DOI:10.32604/cmc.2022.027007
| Computers, Materials & Continua DOI:10.32604/cmc.2022.027007 | |
| Article |
Pedestrian Physical Education Training Over Visualization Tool
1Department of Humanities and Social Science, Al Ain University, Al Ain, 15551, UAE
2Department of Computer Science, Air University, Islamabad, 44000, Pakistan
3Department of Computer Science, College of Computer, Qassim University, Buraydah, 51452, Saudi Arabia
4Department of Computer Science and Software Engineering, Al Ain University, Al Ain, 15551, UAE
5Department of Computer Engineering, Korea Polytechnic University, Siheung-si, Gyeonggi-do, 237, Korea
*Corresponding Author: Jeongmin Park. Email: jmpark@kpu.ac.kr
Received: 08 January 2022; Accepted: 14 March 2022
Abstract: E-learning approaches are one of the most important learning platforms for the learner through electronic equipment. Such study techniques are useful for other groups of learners such as the crowd, pedestrian, sports, transports, communication, emergency services, management systems and education sectors. E-learning is still a challenging domain for researchers and developers to find new trends and advanced tools and methods. Many of them are currently working on this domain to fulfill the requirements of industry and the environment. In this paper, we proposed a method for pedestrian behavior mining of aerial data, using deep flow feature, graph mining technique, and convocational neural network. For input data, the state-of-the-art crowd activity University of Minnesota (UMN) dataset is adopted, which contains the aerial indoor and outdoor view of the pedestrian, for simplification of extra information and computational cost reduction the pre-processing is applied. Deep flow features are extracted to find more accurate information. Furthermore, to deal with repetition in features data and features mining the graph mining algorithm is applied, while Convolution Neural Network (CNN) is applied for pedestrian behavior mining. The proposed method shows 84.50% of mean accuracy and a 15.50% of error rate. Therefore, the achieved results show more accuracy as compared to state-of-the-art classification algorithms such as decision tree, artificial neural network (ANN).
Keywords: Artificial intelligence; behavior mining; convolution neural network (CNN); deep flow; e-learning environment
Moderate and updated technology is the key reason for advancement in the current era, which opens the new ways and doors of an e-learning environment to accommodate the online learning platform and focus on the learning of human behavior and finding advanced and accurate results. The various system is gradually connected with the e-learning environment system as students’ behavior analysis, patient activity analysis, classroom behavior, crowd analysis, and pedestrian behavior analysis are e-learning based approaches to analyze the aerial data to train them in e-learning environments. With the help of information technology, artificial intelligence, machine learning, and computer vision algorithms, researchers enabled the e-learning environment over various types of data such as classroom, crowd, and pedestrian datasets. The rapid development of observing human behavior via updated frameworks and technology results in more accuracy in the e-learning domain [1]. Information security and data encryption [2–4], Artificial Intelligence (AI) systems [5–7], including such deep learning-based actual image-processing tools [8–11], were also used in the workplace to analyze learners’ behaviors via cameras [12–14]. To evaluate sequence homology across video frames, they created a spatial connection comparison. Authors had a high success rate using a collection of predicates to express temporal and spatial correlations between image features [15–17]. Each contact was represented by a distribution of the area of interest along with a local feature detection as an autoencoder [18–21]. They presumed a fixed landscape and hence were unable to deal with the actual world and e-learning methods [22–24]. By taking into account large fluctuations in levels of intensity with movement, researchers were able to create curiosity spots. They used feature map identifiers to represent each focus [25–27], but there were still a few errors due to incorrect identification of key points and based on inter variants inside the image of various actors [28–30]. In [31], a graphical structural model was used to determine the location of body segments and define relationships among them using distance measure, angular speed, personal acceleration, hand location, foot position, and lower extremity area.
For pedestrian physical education training over visualization tool, this paper suggests a systematic approach that takes e-learning type data as input, some pre-processing for computational cost reduction and time-saving are applied. After that human detection and verification steps are performed which are followed by a deep flow features extraction approach. Moreover, a graph mining-based approach is adopted for features and data mining. Finally, Convolution Neural Network (CNN) is applied to classify various classes.
For experimental evaluation, we used the crowd activity University of Minnesota (UMN) dataset which is based on the videos of computer-generated maps of sparsely inhabited places. Three views are available in this dataset one indoor, second outdoor and third again outdoor with different scenes and environments. A stationary camera records all video at a frame rate of 30 fps and a size of 640 × 480 pixels.
The key research contributions of this article are:
• E-learning-based approach to finding the pedestrian behavior and predicting the learning of the system.
• E-learning and machine learning-based features extraction approach help us to find more accurate results.
• With the help of graph mining and Convolution Neural Network (CNN), the proposed system work over high efficacy and accuracy.
The following is how the remaining part of the paper is structured: The research study related to the proposed system is explained and analyzed in Section 2. Section 3 details the system’s proposed approach, which includes a lengthy pre-classification phase. Section 4 outlines the datasets utilized in the proposed study and demonstrates the system’s resilience through various experiments. Section 5 brings the article to a close and suggests some further research.
In this section, two types of related research work are discussed including the traditional methods and the e-learning methods.
Analyzing crowd and pedestrian movement patterns and segmenting flows has received a lot of attention. For flow field compute and classification, Ali and Shah presented Lagrangian spatial structure [32], while Lin et al. offered Lie algebraic modeling [33]. Regarding crowd flow modeling and prediction, subject approaches have been frequently employed. Subject frameworks might contain spatial-temporal dependencies upon movement patterns. Segmentation trajectories might also be used to find patterns of movement [34]. Through simulating the cohesive movement crowd clusters, Shao et al. [35] defined the general features of crowded system applications. Several of these approaches are primarily designed to learn generic movement patterns, but they are unable to replicate individual participants’ decision-making mechanisms. Due to the complexity and variability of human decision-making, it’s indeed difficult for such methods to imitate or forecast precise pedestrian actions. An effective walking behavior network can be constructed with insufficient reported pedestrian location and speed as information. To develop a thorough pedestrian behavior model for each individual, researchers may concentrate on the internal elements that influence the decision-making processes of pedestrians, reducing the model’s complexities. Inside the sense because their mimic the decision-making procedure of persons, operative frameworks [36] fall into a separate class. The communal dynamic framework, for instance, first was developed in population modeling and has since been applied to surveillance, analysis [37], and anomalous activity recognition. Zhou et al. [38] present a hybrid algorithm of dynamical agents (MDA) that can acquire system parameters. The identity particle system and the cyclic velocities hurdle framework [39] are two examples of agent-based architectures. Modern agent-based approaches characterize every individual’s moving behavior using pre-defined principles, which may be utilized for modeling and projection. Furthermore, when opposed to our approach, they possess two major flaws. To begin with, the majority of these assistant frameworks are stationary and cannot be continuously modified over time. Furthermore, because influence variables change over time, pedestrian encounters must be changed as well. The development and diffusion of motionless clusters, for instance, will have an impact on pedestrian movement patterns. Additionally, many present agent-based approaches are unable to account for temperament, which is a significant component in determining how individuals behave [40]. Even in the same situation, a cautious pedestrian will go a considerable distance to avoid an obstruction, but an aggressive walker will stroll directly through a crowd. In this paper, we suggest a personality characteristic to represent the significant variance in people’s behavior induced by personality factors. Sensory effects can therefore be incorporated into the framework.
2.2 E-learning Based Approaches
Capabilities and virtual reality approaches have shown to be effective training tools for reducing pedestrian injuries in children, retraining brain-damaged individuals, and learning fundamental driving abilities. Simulators focus on responding, enable graded levels of task complexity, and enable the exercise to be tailored to the expertise of each individual, allowing for efficient and personalized learning skills or learning. Simulators have lately been evaluated as teaching equipment for senior learners [41]. The suggested simulator-based approach included two teaching sessions concerning preventative behaviors and basic traffic regulations, as well as group discussions and virtual presentations [42]. The emulation sample was developed to increase the various driving techniques provided in the academic sessions for a short period. These gains were not sustained after 18 months [43]. In contrast, via repeated tailored practice and personalized information, employed a more interactive and realistic type of simulator-based learning [44]. This strategy has been demonstrated to be beneficial in improving the performance and abilities of senior drivers, particularly visual scanning at crossroads. More study is needed to determine if these advantages will remain. However, minimal study has been done to see if a program integrating behavioral and learning treatments in a secure and realistic traffic situation might help older people make better crossing decisions [45]. The goal of this study was to add to the body of information on this subject. The goal was to see how successful a training strategy that included repeated practice on an emulator, individual feedback, and instructional conversations was at rehabilitating the cognitive and procedural elements of the sidewalk.
As a result, this study presents a novel system technique for pedestrian physical education training over visualization tools.
This section defines the proposed methodology of pedestrian behavior mining over an e-learning environment. Fig. 1 shows the detailed description of the proposed system model. This model is clarified in the following sections.
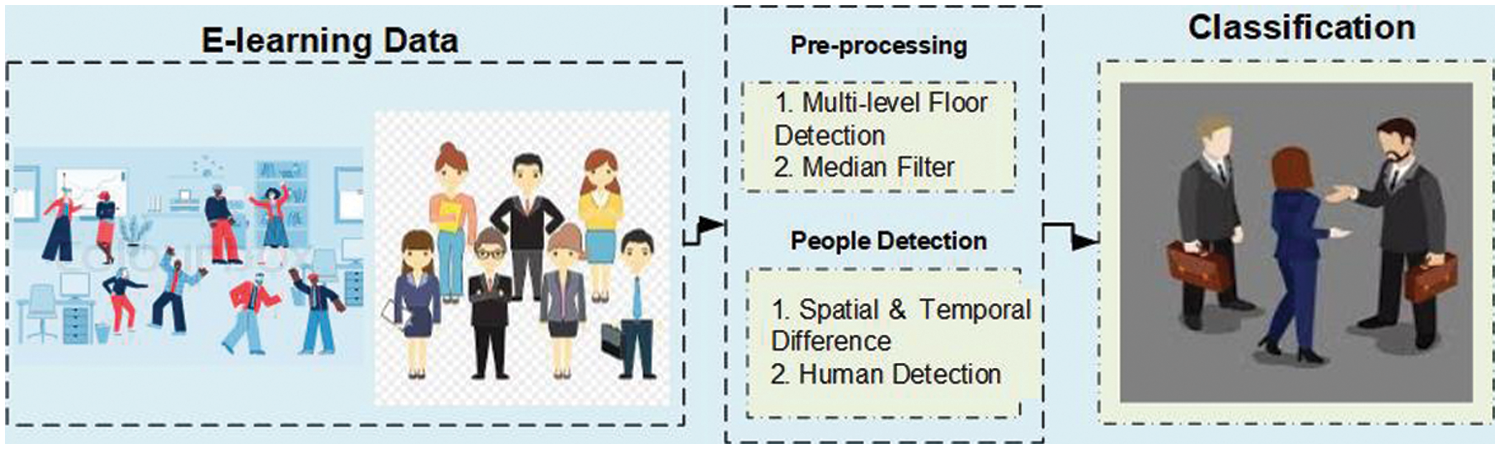
Figure 1: The proposed pedestrian behavior mining architecture
To minimize the computational and manpower resources, one of the mandatory tasks is pre-processing [46–49]. In which we convert videos data to a sequence of images, for background [50–52] subtraction multilevel floor detection is applied and a median filter is applied by using the formula in Eq. (1) to find more accurate results.
where i and j relate to sequence window m having definite region cantered neighboring pixel [k, l] in an image.
After pre-processing, the next step is to detect the people from the image sequence via spatial and temporal differences. In this method, we find the difference between
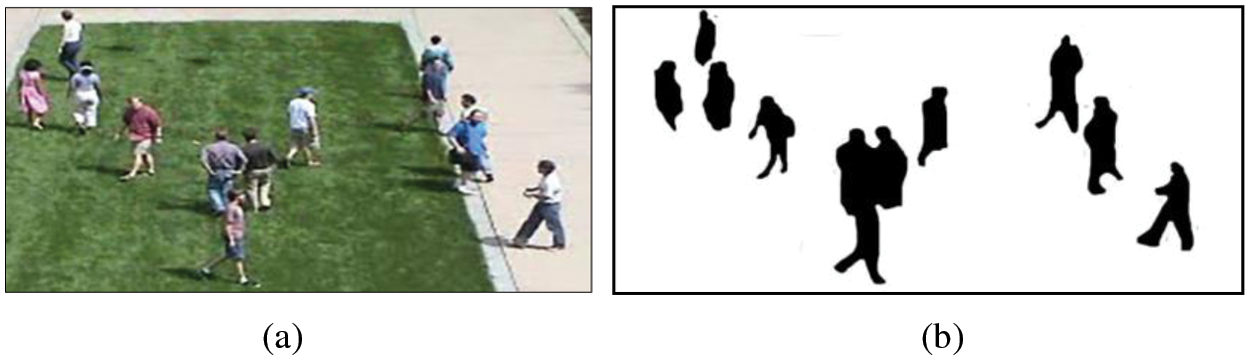
Figure 2: People detection example results over crowd activity UMN dataset (a) represents the original image and (b) shows the extracted human silhouette
Human detection is the next step of human silhouette extraction, which is achieved using human height and width information of given frames and next frames are used to track them [53–55]. After getting the primary information of human silhouette, a bounding box is drawn over-extracted human silhouette [56]. As an outcome, all detected humans are more visible in bounding boxes [57]. The results of human detection and verification of given frames are indicated in Fig. 3.
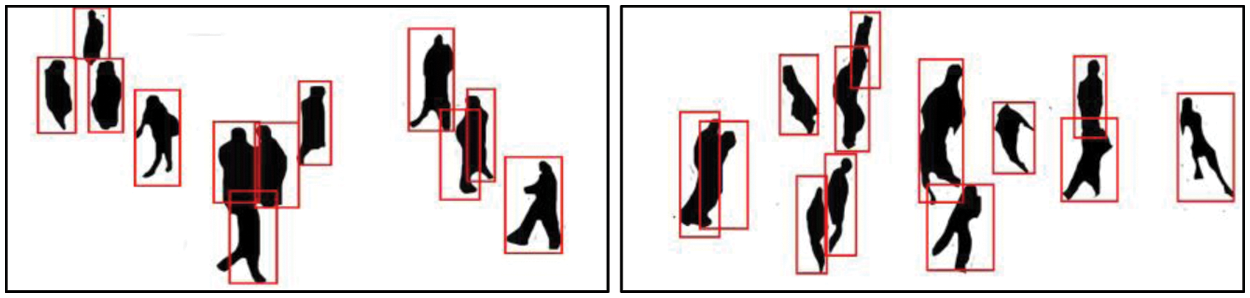
Figure 3: Human detection and verification results
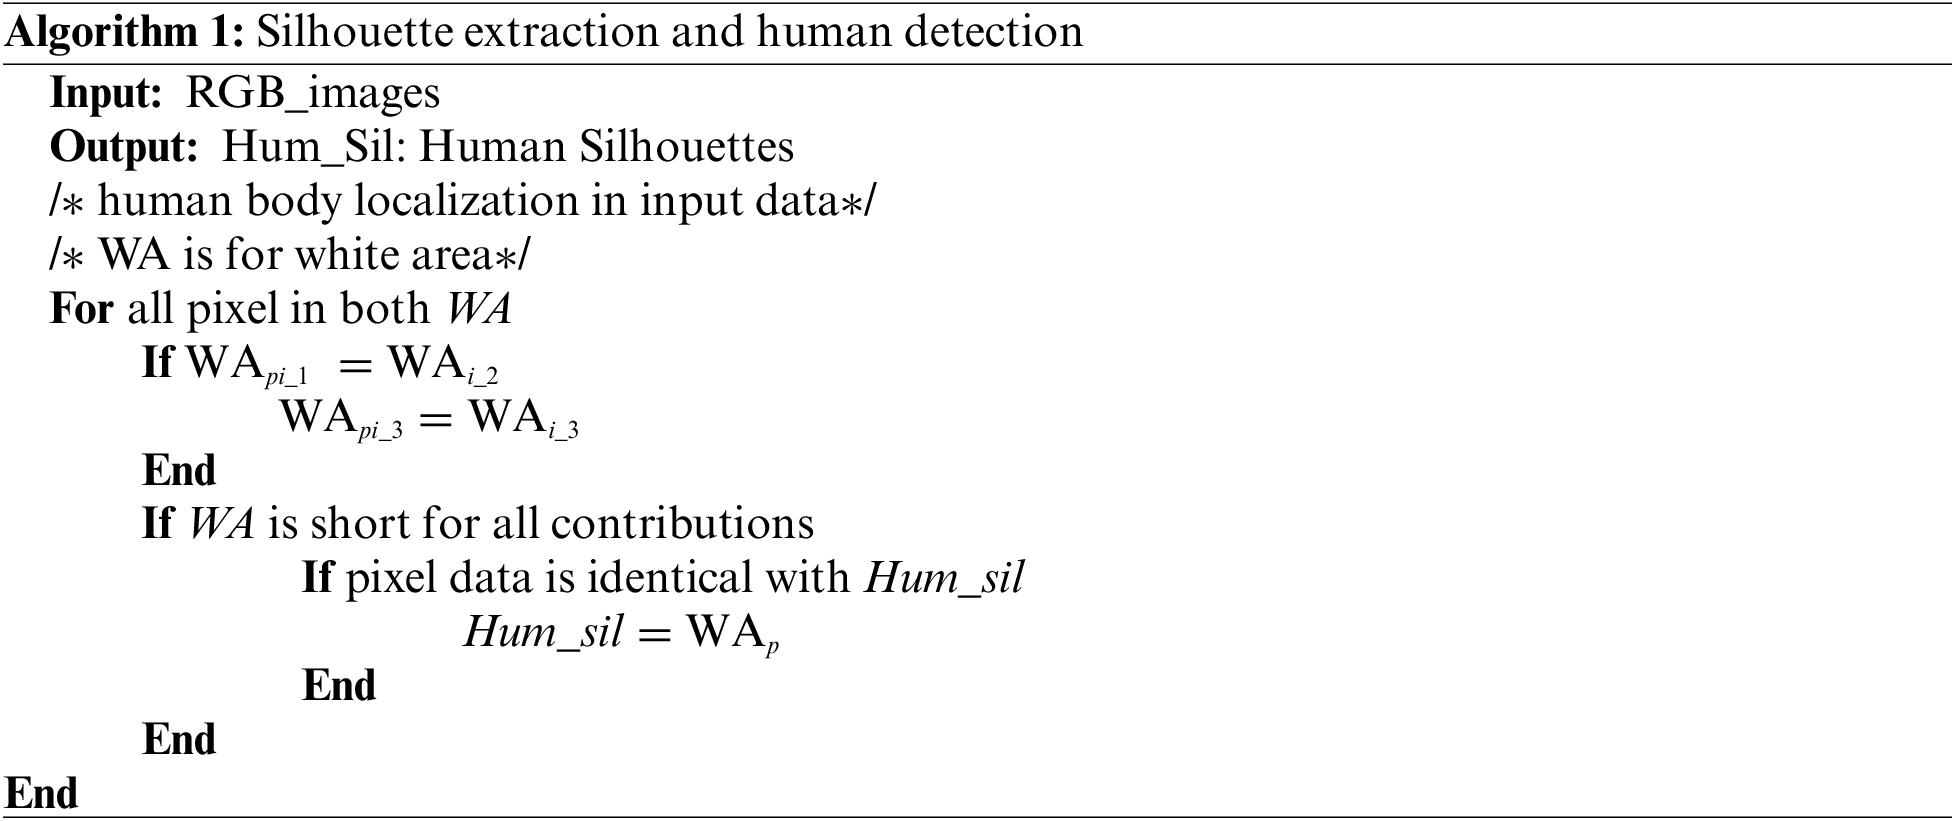
To define a more precise overview of human silhouette extraction and human detection algorithm 1 shows a clear description of all the steps.
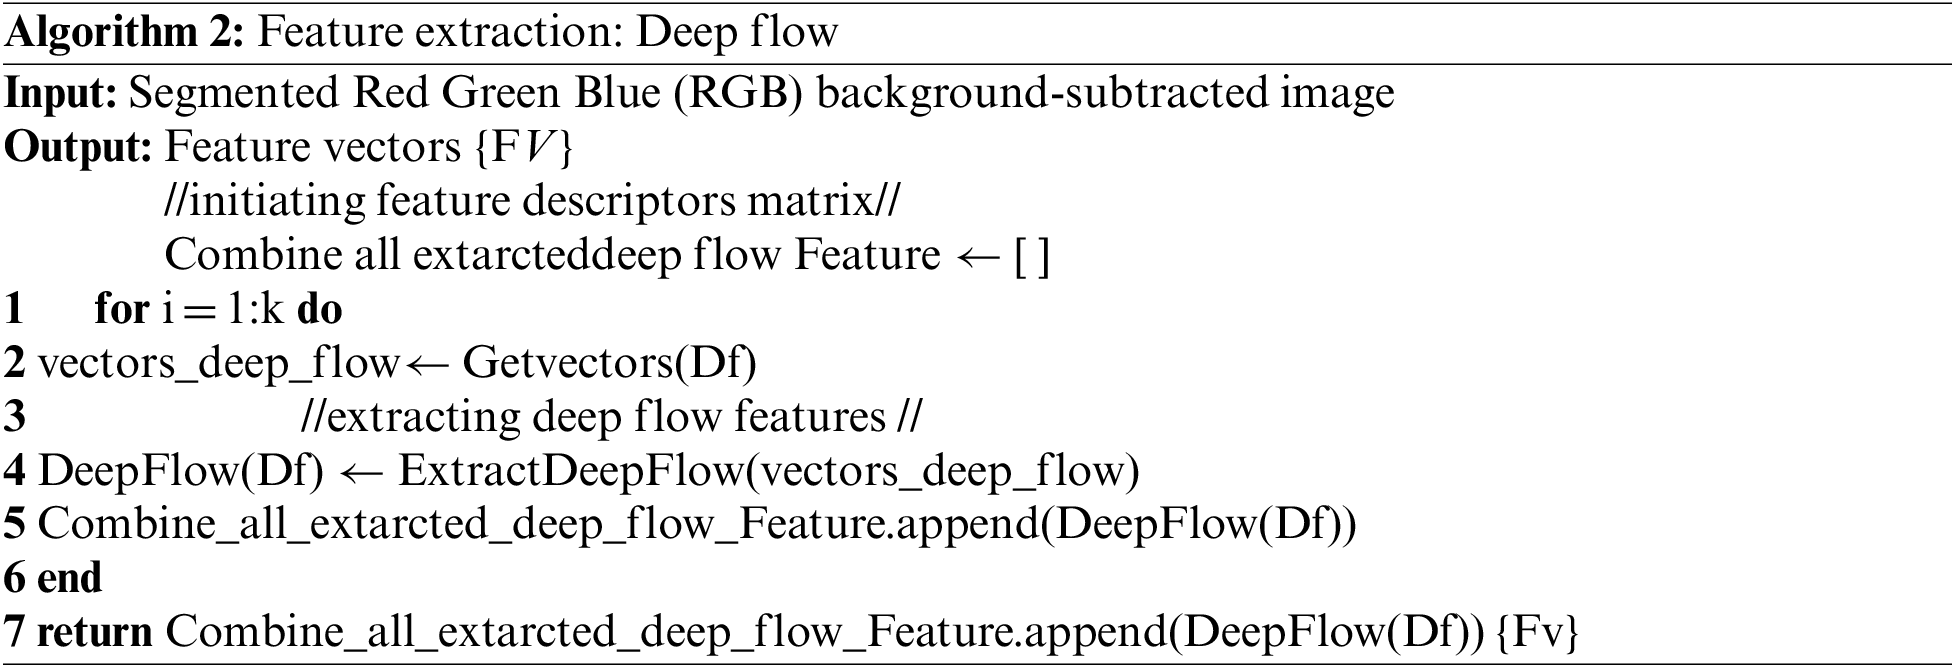
3.3 Feature Extraction: Deep Flow Features
In this section, the deep flow features extraction method is proposed. Deep flow features are based on human flow data and the direction of the flow in continuous images and human video-based data. In this, the feature extraction method estimates the flow of the human from their starting point to their ending point and assigns the specific color to desired areas. The color pattern is the same for the same direction of deep flow after this, we mapped all extracted values in the vector and perform some further processing. The mathematical representation of deep flow is described in Eq. (2)
where
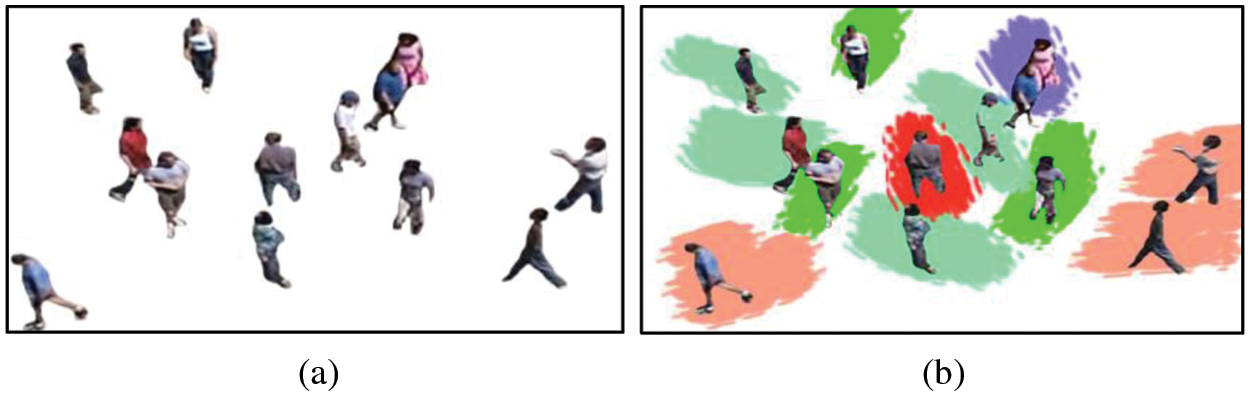
Figure 4: Deep flow features results. (a) Red Green Blue (RGB) image with a subtracted background, (b) Deep flow features results
After extracting deep flow features from the dataset all the features are mapped in a final features vector which is used for the graph mining process. The detailed process of features extraction is defined in Algorithm 2.
3.4 Data Optimization: Graph Mining
After extracting the features from all the sequences of images of the crowd activity University of Minnesota (UMN) datasets, the next step is to minimize the data which helps to reduce computational cost and increase the accuracy rate. For optimization, we adopt the graph mining technique due to features data that are based on statistical patterns and indexes we can achieve a high accuracy rate of mining [58]. Graph mining is the set of methods and framework to analyze the data, find the properties and predict the structure of data, develop the arranged and realistic graph for pattern matching. Fig. 5 shows the example results of features vector in graph representation it is very clear to understand in the image, various classes are marge with other classes such as road crossing class is merged with standing class and Algorithm 3 shows the detailed overview of the graph mining approach over-extracted feature vector.
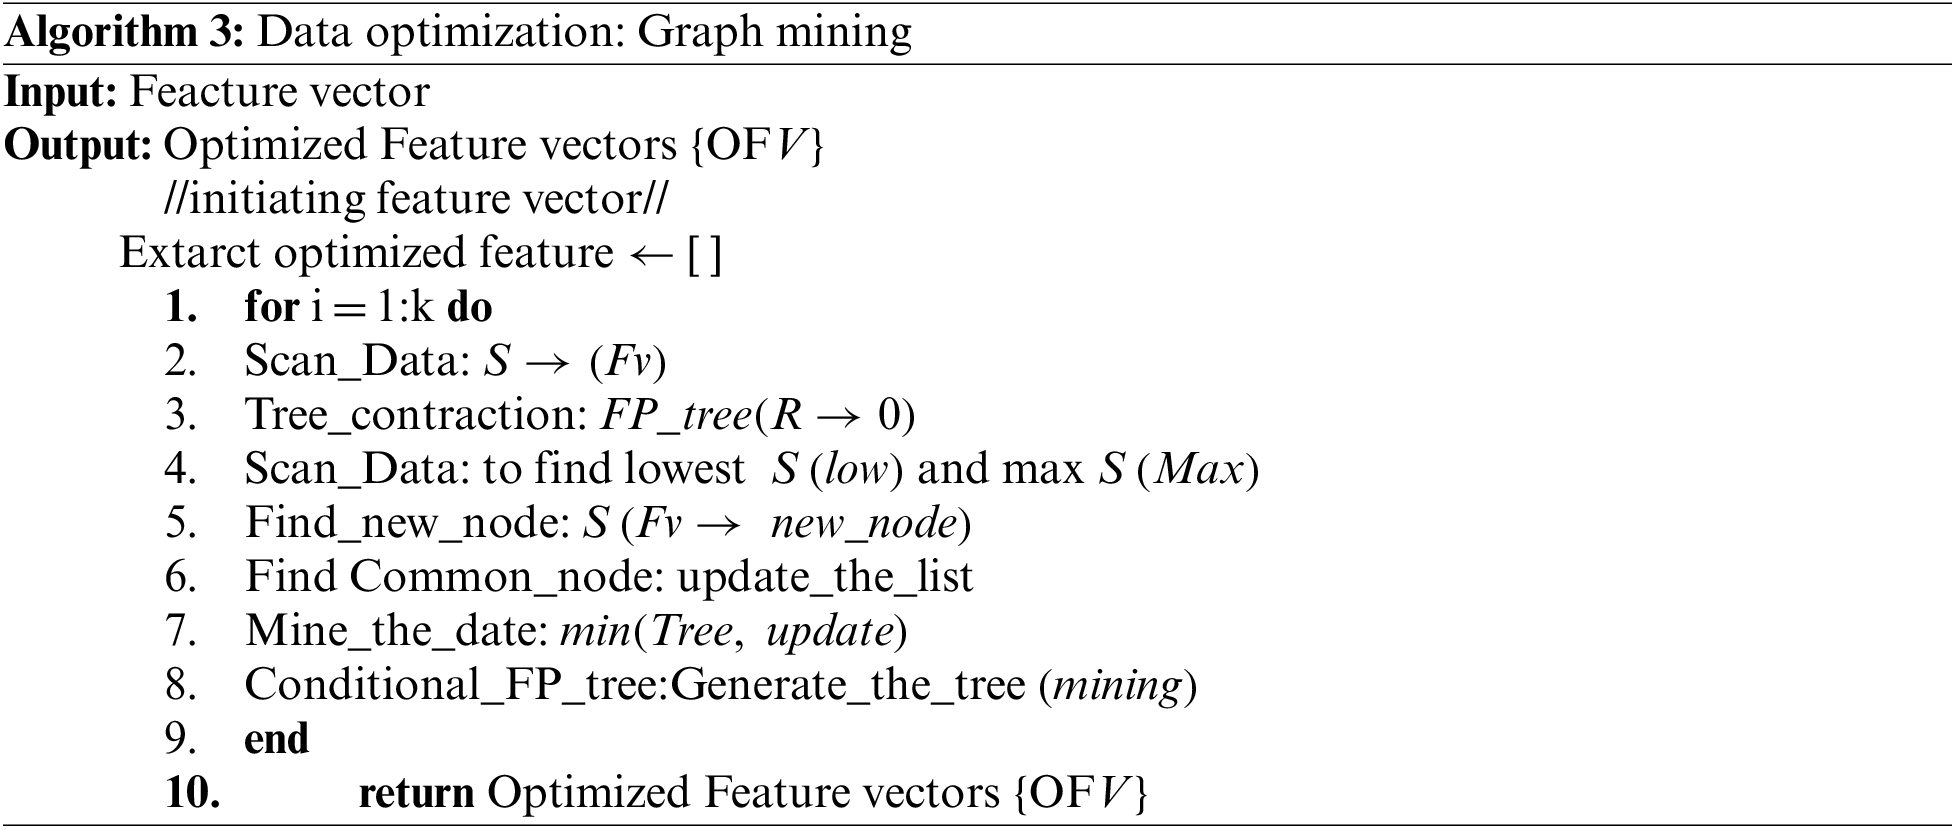
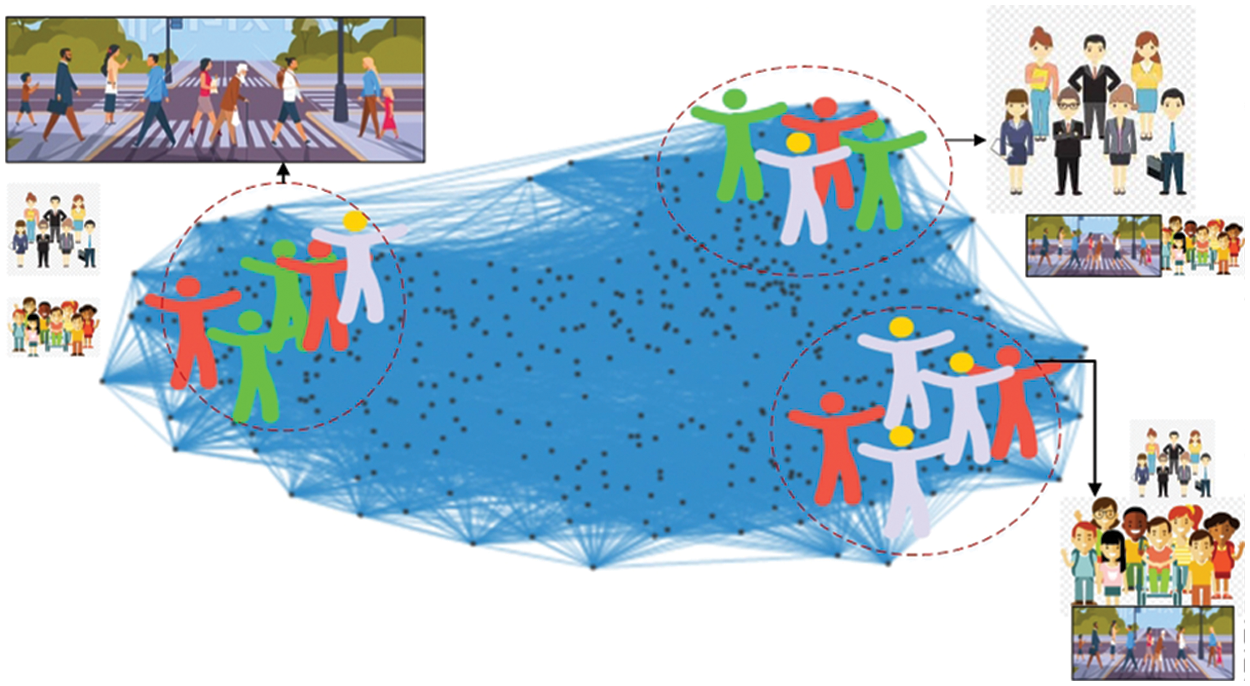
Figure 5: Feature representation in the graph over online e-learning environment
Fig. 6 shows the results of in graph mining approach of optimized features over crowd activity University of Minnesota (UMN) dataset. The understanding of Fig. 6 is very clear, now the maximum classes show the same class results and using graph mining we achieve this accuracy and minimize the error rate. While a little error still exists which are deal with the classification and detection segment of the proposed method.
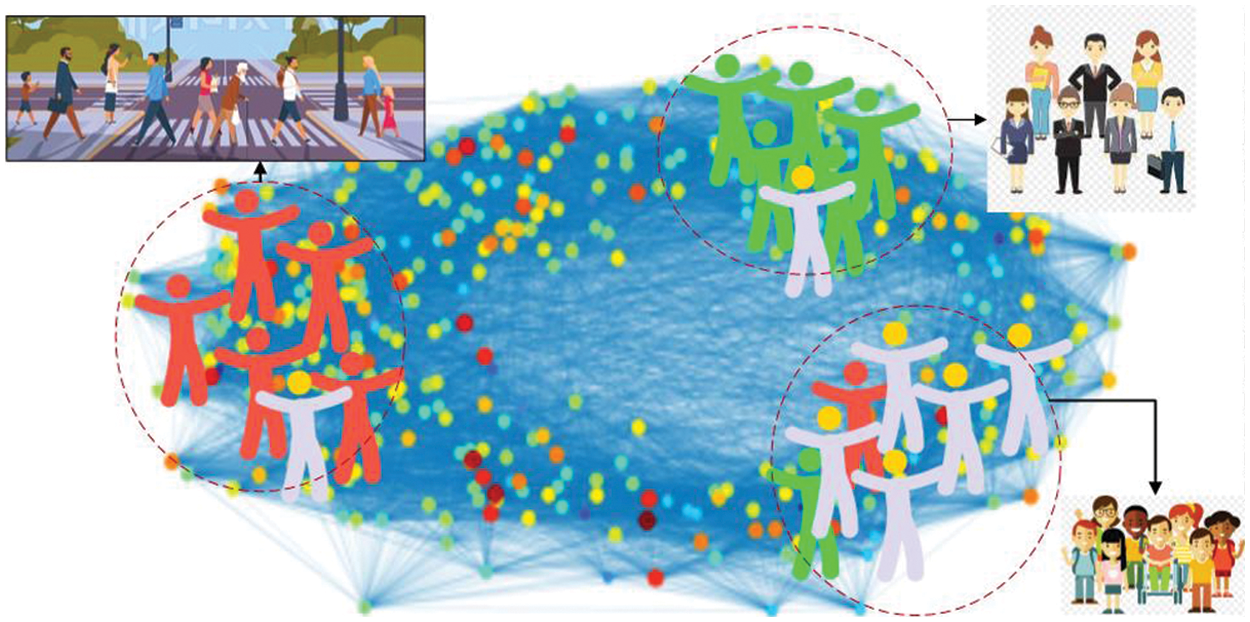
Figure 6: Graph mining representation of optimized features over crowd activity University of Minnesota (UMN) datasets
3.5 Normal and Abnormal Behavior Classification via CNN
For normal and abnormal classification, the obtained optimum features data is fed into a Convolution Neural Network (CNN). Convolution Neural Network is a deep learning-based method that is commonly used to classify multimedia content information. In this dataset and system, we consider normal walking and following the directed path as normal behavior. Movement with non-human objects and violation of the directed path is abnormal behavior Fig. 7 shows some examples of normal and abnormal behavior from the crowd activity. In comparison to other conventional methodologies, Convolution Neural Network performs better and produces more appropriate results [59]. Convolution Neural Network provides less computational complexity [60] while maintaining a low degree of bias [61], resulting in high prediction performance.
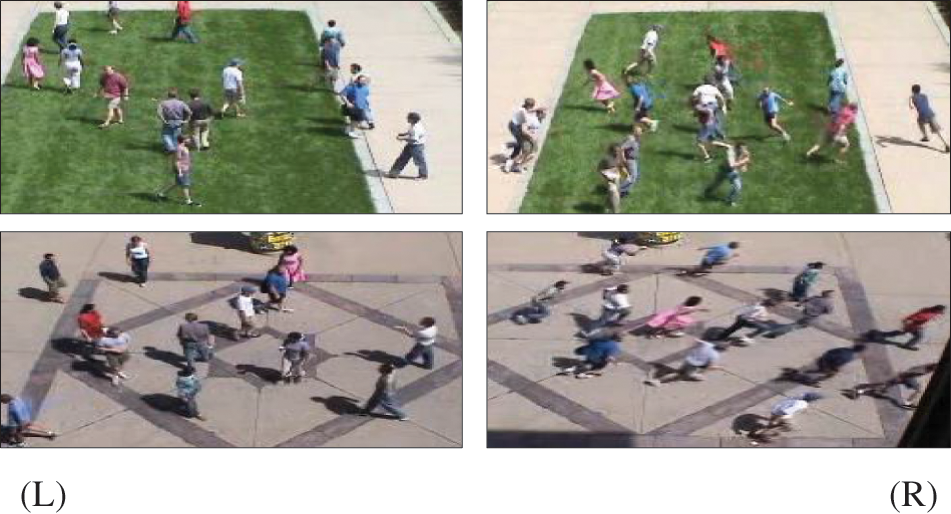
Figure 7: Shows some examples of normal and abnormal behavior from the Minnesota UMN dataset. (L) sides images show the normal behavior and movements of humans and (R) abnormal movement of human
In a Convolutional Neural Network, the input, output, and hidden layers are the three primary levels. Every hidden layer is divided into sub: convolutional layer, critical processes, complete connected layer, and standardized layer. A square gradient selection correlates the post retrieved characteristics from across input nodes across the convolution layers. The answers are then collected across all neural groups using the average pooling procedure. Aggregated responses are convoluted and concatenated again to reduce feature widths even further, and the association maps are produced by the entirely linked grid.
where
This section illustrates a brief overview of the dataset used for pedestrian behavior mining over an e-learning environment, results of conducted experiments, evaluation of the proposed pedestrian behavior mining structure, and detailed comparison with further methods.
4.1 Datasets Description: Crowd Activity UMN
The crowd activity University of Minnesota (UMN) dataset [62] is a computer-generated map of sparsely inhabited places. Normal crowd behavior is monitored until a predetermined single instant, during which moment the behavior gradually transforms into an evacuation situation, in which each person rushes out of the camera frame to mimic anxiety. The dataset consists of 11 video examples that begin with normal behavior and progress to abnormal behavior. Three separate settings, one indoors and two outside, are used to shoot the anxiety situation. A stationary camera records all video at a frame rate of 30fps and a size of 640 480 pixels.
4.2 Experimental Settings and Results
MATLAB (R2018a) is used for all computation and exploration while Intel (R) Core(TM) i5-4210U CPU @ 1.70 GHz with 64-bit Windows 10 was utilized as the physical device. The machine contains an 8 GB memory and a 2.40 GHz processor. We utilized a Leave One Subject Out (LOSO) cross-validation approach to assess the developed system’s accuracy. The experimental findings overcrowd the activity University of Minnesota (UMN) dataset and experimental results are discussed in the results section.
Experiment I: Human Detection Accuracies
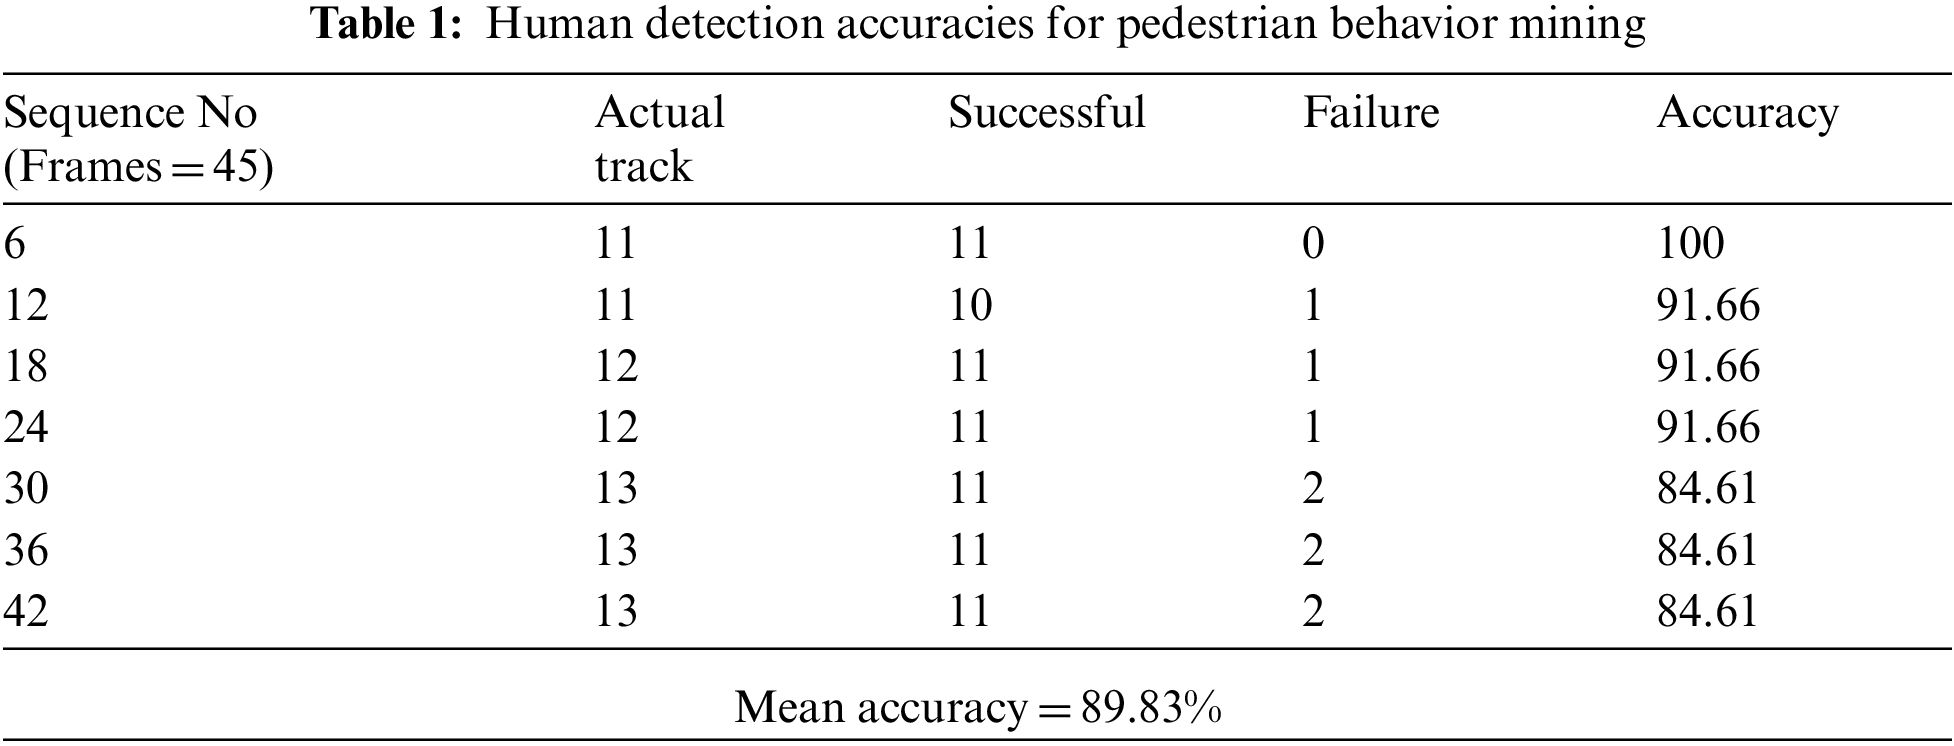
In this section, we find the human detection accuracy in Tab. 1 which displays the efficiency of multi-person detection across the crowd activity University of Minnesota (UMN) dataset; Column. 1 presents the range of sequences, and every sequence comprises 45 frames. Column. 2 displays the dataset’s actual persons, Column. 3 displays the effective detections made by the proposed model, Column. 4 displays the failures, and lastly, Column. 5 displays the performance, with a mean accuracy of 91.15 percent.
Experiment II: Abnormal and Normal Behavior Detection
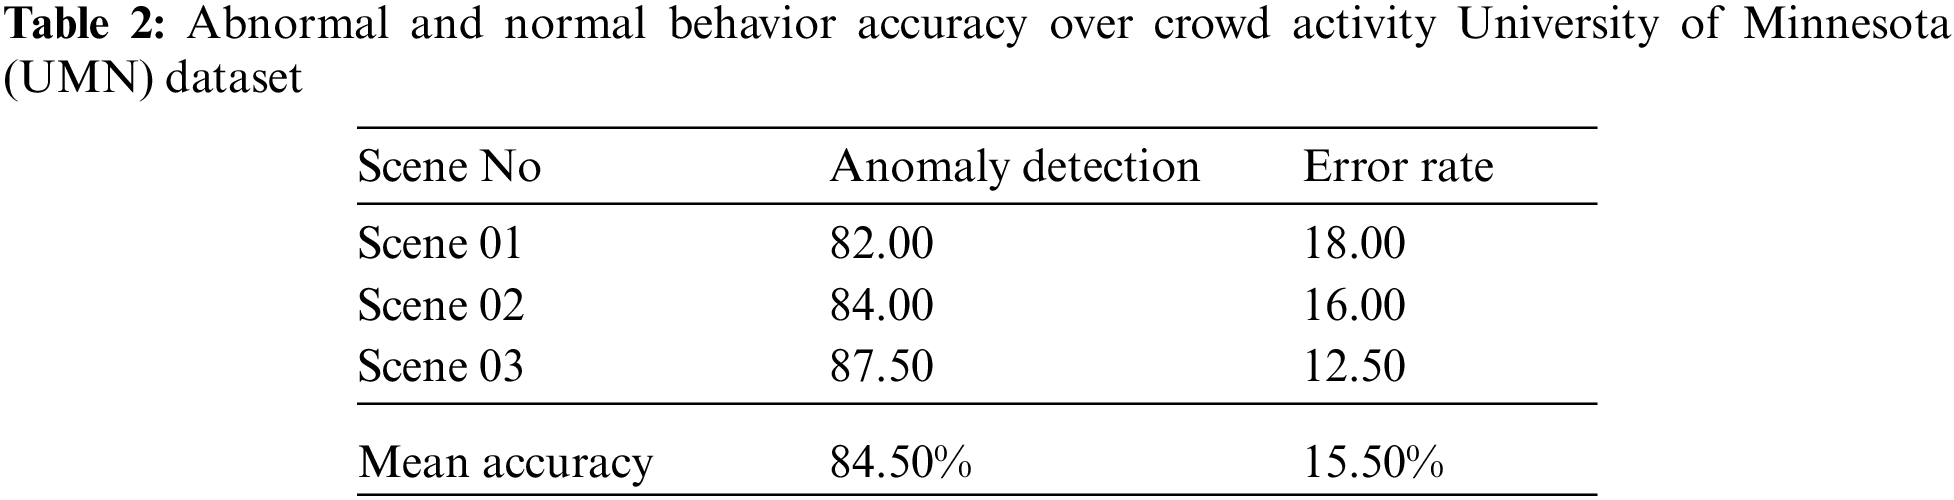
In this section abnormal and normal behavior detection in a crowd scene and pedestrian environment. For this, we used the deep learning method convolutional neural network Convolution Neural Network (CNN). A Convolutional neural network is one of the best and most popular classifiers for image and video-based data. Tab. 2 shows the results of normal and abnormal behavior with an 84.50% of accuracy rate while the error rate is 15.50%.
Experiment III: Survey Results
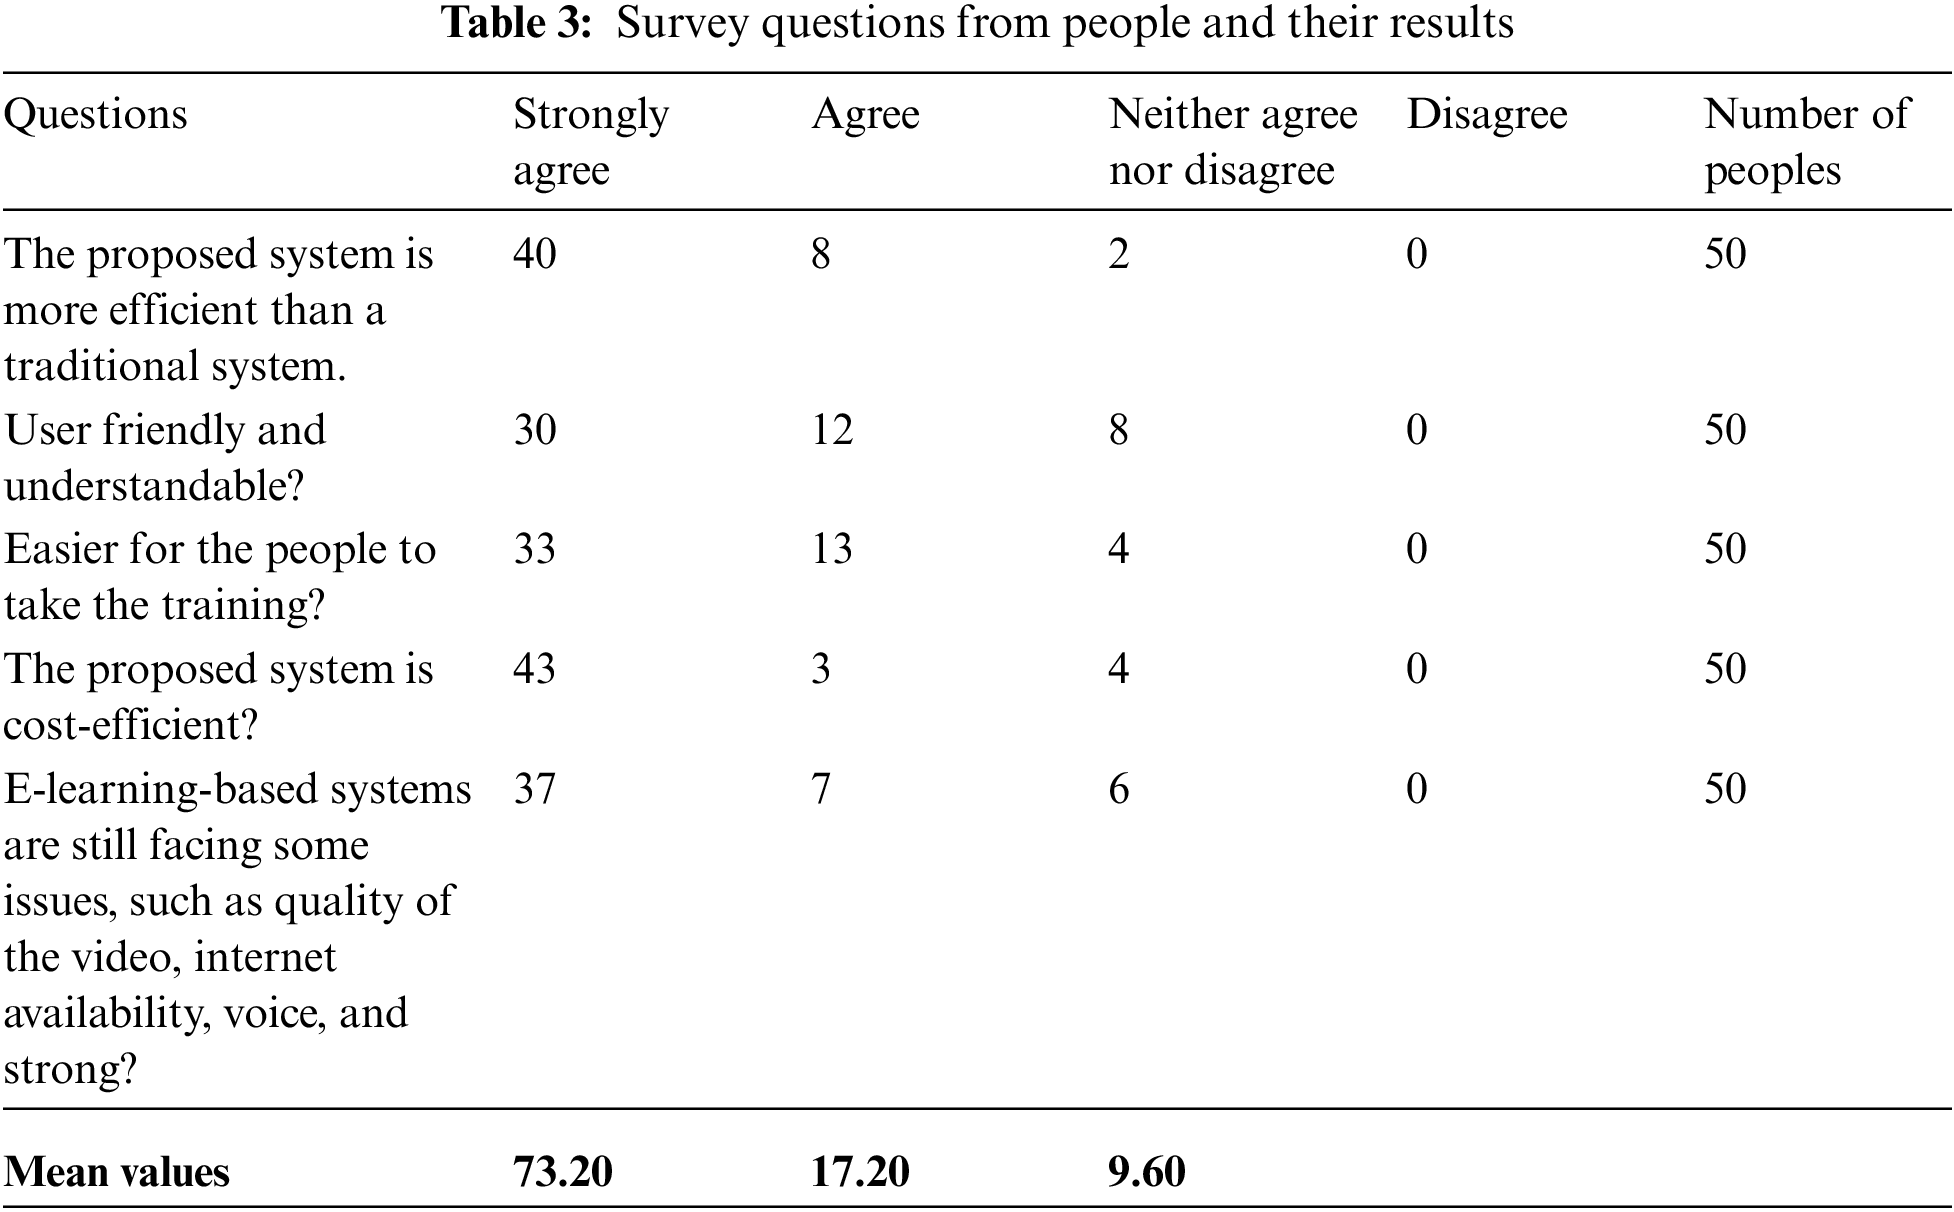
The proposed e-learning based methods are further evaluated on a questionnaire-based single offline survey, in which we collect the data from various people such as e-learning trainers and facilitators. The survey was two types of sampling methods created, each with five questions including four possibilities: strongly agree, agree, neither agree nor disagree, and disagree. For the people data collocation and taking their views, we select the survey one which is based on 50 people to get the data. Tab. 3 shows the detailed overview and results of survey one.
Mean values show that 73.20% strongly agree and 17.20% agree which represents the proposed system is efficient and easy for people. For taking the views of trainers or teachers we use the second questionnaire in which we again take 50 e-learning training and service providers. Tab. 4 shows the detailed overview of survey results and analysis.
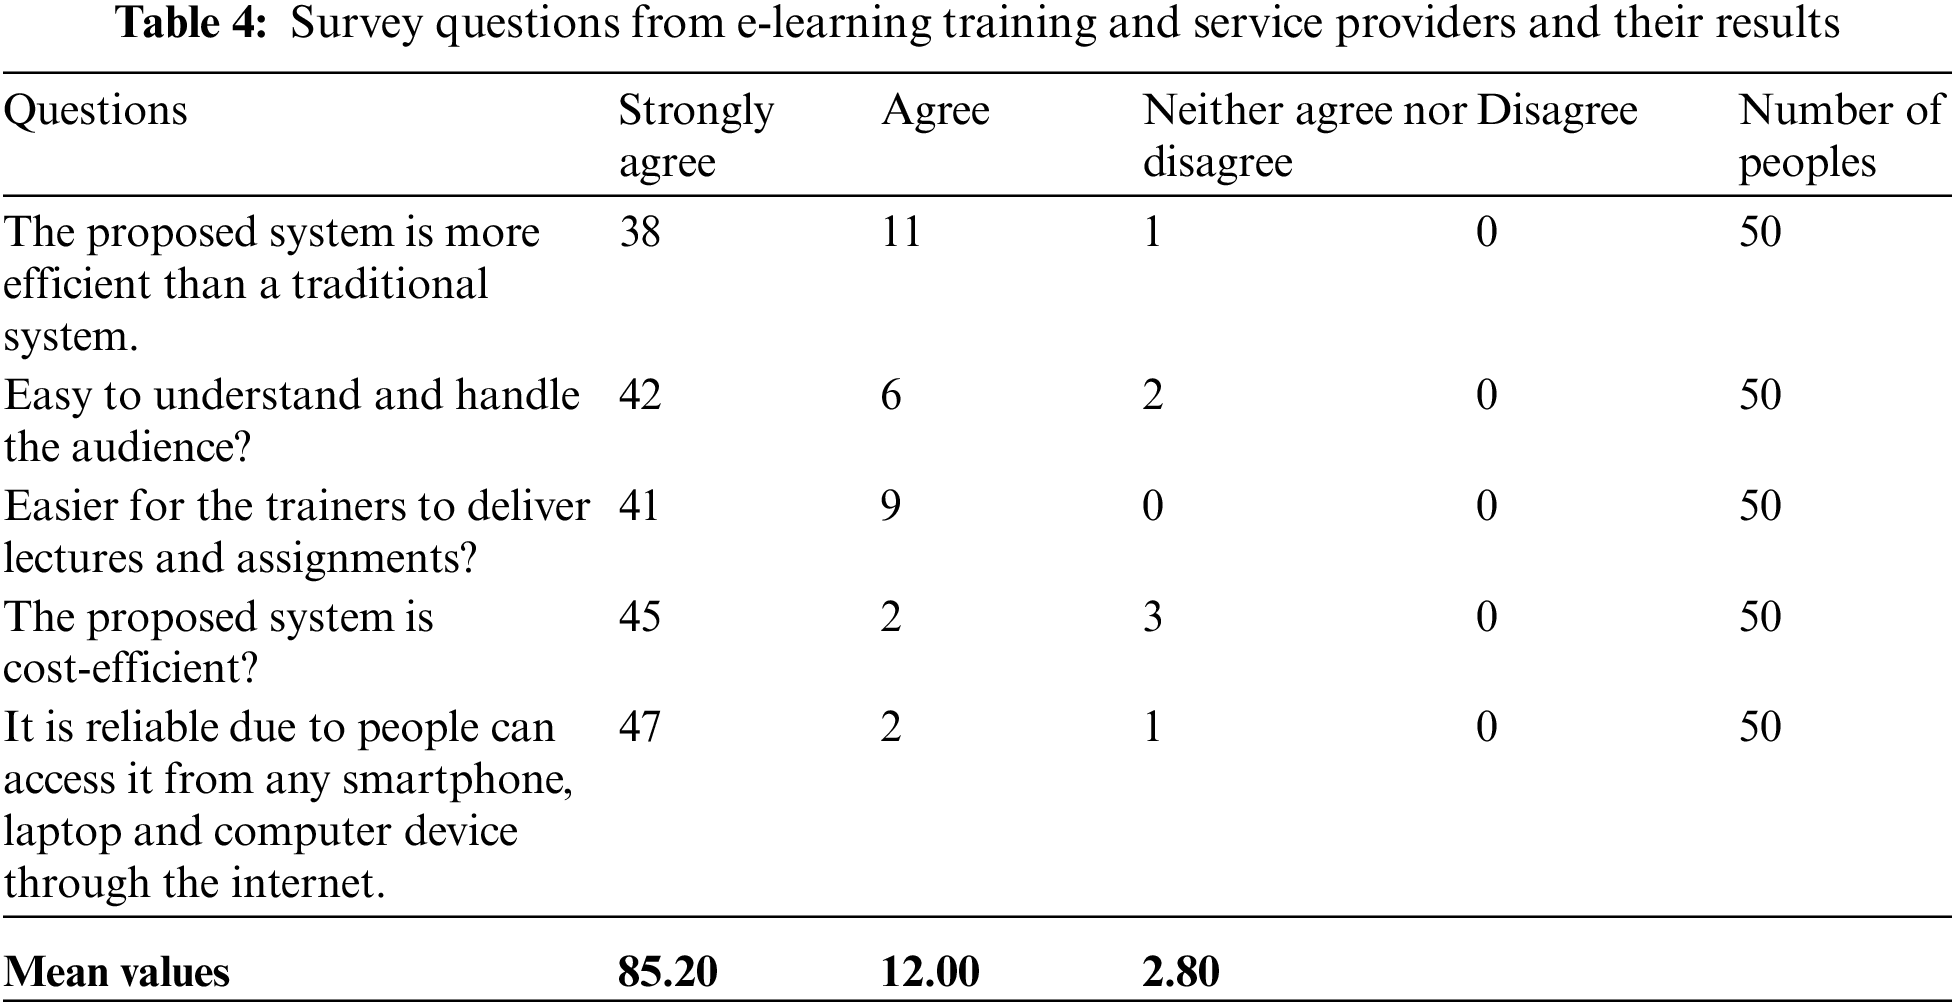
Mean values show that 85.20% strongly agree and 12.00% agree which represents the proposed system is efficient and easy for trainers and service providers.
Experiment III: Comparison with other Classification Algorithms
In this section, a detailed comparison is conducted for other famous classification algorithms such as decision tree, artificial neural networks (ANN), and Convolution Neural Networks (CNN). The accuracy rate for the decision tree is 80.76% with an error rate of 19.24%, an accuracy rate of ANN is 81.48% with an error rate of 18.52% and finally, the accuracy rate of Convolution Neural Network (CNN) is 84.50% with the error rate is 15.50%. Tab. 5 shows the abnormal and normal behavior comparison with other classification algorithms.
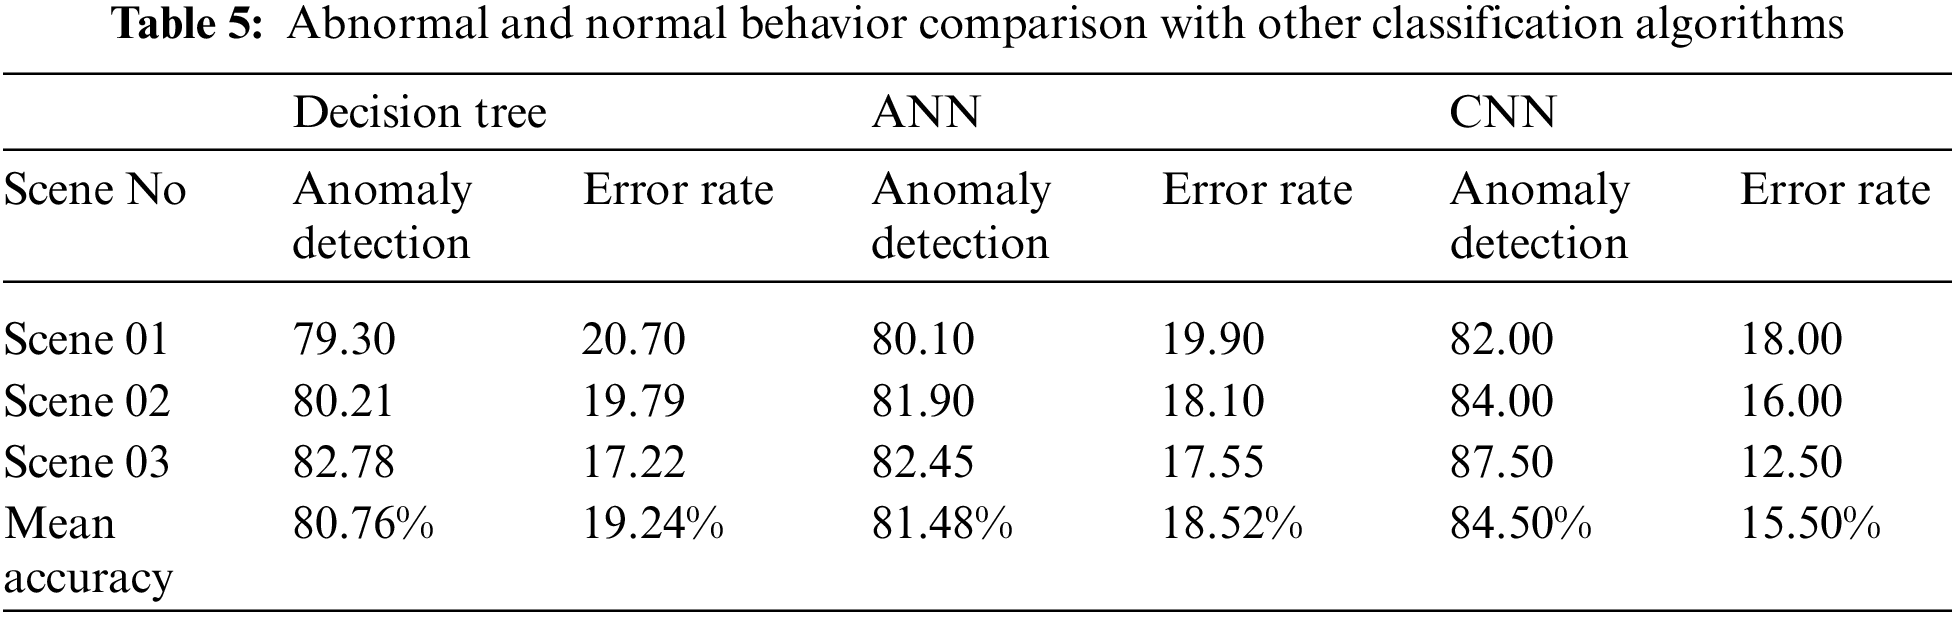
Fig. 7 shows some examples of normal and abnormal behavior from the crowd activity University of Minnesota (UMN) dataset.
Fig. 8 shows the graphical representation of abnormal and normal behavior comparison with other classification algorithms.
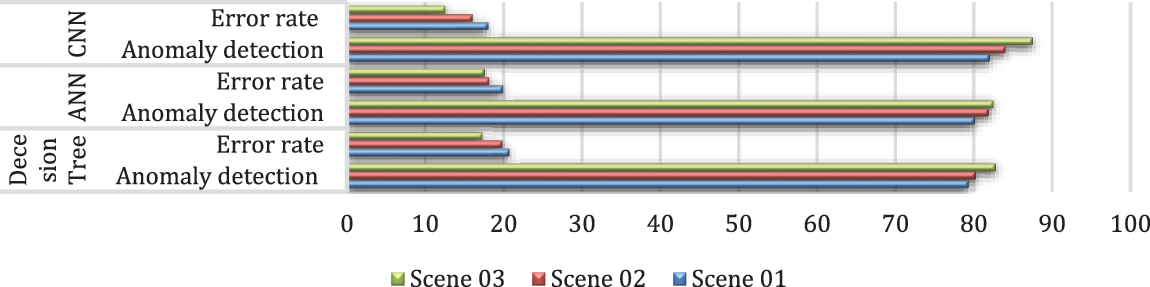
Figure 8: Graphical representation of normal and abnormal behavior comparison
The comparison shows the butter accuracy rate and less rate of our proposed methodology for pedestrian behavior mining over the crowd-based dataset.
The proposed system has better accuracy as per existing state-of-the-art methods, while on real-time application it may cost high in terms of computational and resources. Another limitation of the proposed system is the detection of humans in a crowd scene is a challenging task due to object occlusion. For online systems there are some issues such as speed and large datasets, however, the latest trends in machine and deep learning are the key solution to increase more accuracy of e-learning based systems. Moreover, feedback is one of the main keys to finding the lack points of the system. Instead of offline feedback, we need to take live and online feedback because of the quick response and up-gradation of the system. Live feedback is one of the key contributions of the user to improve the system. In this method, we provide the opportunity for a user to submit their live feedback and submit user reviews. With the help of this information, we will update our system in the future. Fig. 9 shows the live feedback system for the proposed method.

Figure 9: Live feedback features for proposed e-learning approach
The proposed methodology describes the vital way of mining the behaviors of the pedestrian over an e-learning environment, which takes video data as input, some pre-processing to reduce computational cost. After this, deep flow-based features are extracted; to increase the probability of mean accuracy a graph mining technique is adopted. Finally, Convolution Neural Network (CNN) is used for the detection of pedestrians’ normal and abnormal behavior. The proposed system archived 84.50% of means accuracy and a 15.50% of error rate, which is better than existing state of art methods. There are some limitations of the system such as detecting the human in a crowd scene is a complex task. Practically, the suggested system will be used in a variety of contexts including residential care, behavior analysis, surveillance systems, and interactions between people, e-health services, and home automation. Moreover, in future research projects, we will integrate additional forms of human gesture recognition and construct a system for monitoring human behavior including both interior and exterior contexts.
Funding Statement: This research was supported by a grant (2021R1F1A1063634) of the Basic Science Research Program through the National Research Foundation (NRF) funded by the Ministry of Education, Republic of Korea.
Conflicts of Interest: The authors declare that they have no conflicts of interest to report regarding the present study.
1. M. Raca, L. Kidzinsk and P. Dillenbourg, “Translating head motion into attention-towards processing of student’s body-language,” in Proc. of. 8th Int. Conf. on Educational Data Mining, Madrid, Spain, pp. 1–7, 2015. [Google Scholar]
2. M. A. ur Rehman, H. Raza and I. Akhter, “Security enhancement of hill cipher by using non-square matrix approach,” in Proc. Conf. on Knowledge and Innovation in Engineering, Science and Technology, Berlin, Germany, pp. 1–7, 2018. [Google Scholar]
3. A. Jalal, S. Kamal, A. Farooq and D. Kim, “A spatiotemporal motion variation features extraction approach for human tracking and pose-based action recognition,” in Proc. of Int. Conf. on Informatics, Electronics & Vision (ICIEV), Fukuoka, Japan, pp. 1–6, 2015. [Google Scholar]
4. A. Jalal, S. Kamal and D. Kim, “Depth silhouettes context: A new robust feature for human tracking and activity recognition based on embedded HMMs,” in Proc. of 12th Int. Conf. on Ubiquitous Robots and Ambient Intelligence (URAI), Goyang, South Korea, pp. 294–299, 2015. [Google Scholar]
5. A. Jalal, S. Lee, J. T. Kim and T. S. Kim, “Human activity recognition via the features of labeled depth body parts,” in Proc. of Int. Conf. on Smart Homes and Health Telematics, Berlin, Heidelberg, pp. 246–249, 2012. [Google Scholar]
6. A. Jalal, M. Batool and S. B. ud din Tahir, “Markerless sensors for physical health monitoring system using ecg and gmm feature extraction,” in Proc. of. Conf. on Applied Sciences and Technologies (IBCAST), Islamabad, Pakistan, pp. 340–345, 2021. [Google Scholar]
7. S. B. ud din Tahir, A. Jalal and K. Kim, “Wearable inertial sensors for daily activity analysis based on adam optimization and the maximum entropy markov model,” Entropy, vol. 22, no. 5, pp. 1–19, 2020. [Google Scholar]
8. A. Jalal, S. Kamal and D. Kim, “Depth map-based human activity tracking and recognition using body joints features and self-organized map,” in Proc. of Fifth Int. Conf. on Computing, Communications and Networking Technologies (ICCCNT), Hefei, China, pp. 1–6, 2014. [Google Scholar]
9. A. Jalal, Y. Kim and D. Kim, “Ridge body parts features for human pose estimation and recognition from RGB-D video data,” in Proc. of Fifth Int. Conf. on Computing, Communications and Networking Technologies (ICCCNT), Hefei, China, pp. 1–6, 2014. [Google Scholar]
10. S. B. ud din Tahir, A. Jalal and M. Batool, “Wearable sensors for activity analysis using smo-based random forest over smart home and sports datasets,” in Proc. of 3rd Int. Conf. on Advancements in Computational Sciences (ICACS), Lahore, Pakistan, pp. 1–6, 2020. [Google Scholar]
11. A. Jalal, Y. Kim, S. Kamal, A. Farooq and D. Kim, “Human daily activity recognition with joints plus body features representation using kinect sensor,” in Proc. of Int. Conf. on Informatics, Electronics & Vision (ICIEV), Fukuoka, Japan, pp. 1–6, 2015. [Google Scholar]
12. J. Zaletelj and A. Košir, “Predicting students’ attention in the classroom from Kinect facial and body features,” EURASIP Journal on Image and Video Processing, vol. 1, pp. 1–12, 2017. [Google Scholar]
13. A. Jalal and Y. Kim, “Dense depth maps-based human pose tracking and recognition in dynamic scenes using ridge data,” in Proc. of 11th IEEE Int. Conf. on Advanced Video and Signal Based Surveillance (AVSS), Seoul, South Korea, pp. 119–124, 2014. [Google Scholar]
14. A. Jalal and S. Kamal, “Real-time life logging via a depth silhouette-based human activity recognition system for smart home services,” in Proc. of 11th IEEE Int. Conf. on Advanced Video and Signal Based Surveillance (AVSS), Seoul, South Korea, pp. 74–80, 2014. [Google Scholar]
15. M. S. Ryoo and J. K. Aggarwal, “Spatio-temporal relationship match: Video structure comparison for recognition of complex human activities,” in Proc. of IEEE 12th International Conference on Computer Vision, Thessaloniki, Greece, pp. 1593–1600, 2009. [Google Scholar]
16. A. Jalal, I. Akhtar and K. Kim, “Human posture estimation and sustainable events classification via pseudo-2d stick model and k-ary tree hashing,” Sustainability, vol. 12, no. 23, pp. 9814, 2020. [Google Scholar]
17. S. Kamal and A. Jalal, “A hybrid feature extraction approach for human detection, tracking and activity recognition using depth sensors,” Arabian Journal for Science and Engineering, vol. 41, no. 3, pp. 1043–1051, 2016. [Google Scholar]
18. A. Jalal, Y. -H. Kim, Y. -J. Kim, S. Kamal and D. Kim, “Robust human activity recognition from depth video using spatiotemporal multi-fused features,” Pattern Recognition, vol. 61, pp. 295–308, 2017. [Google Scholar]
19. M. Gochoo, S. B. U. D. Tahir, A. Jalal and K. Kim, “Monitoring real-time personal locomotion behaviors over smart indoor-outdoor environments via body-worn sensors,” IEEE Access, vol. 9, pp. 70556–70570, 2021. [Google Scholar]
20. A. Jalal, N. Sarif, J. T. Kim and T. S. Kim, “Human activity recognition via recognized body parts of human depth silhouettes for residents monitoring services at smart home,” Indoor and Built Environment, vol. 22, pp. 271–279, 2013. [Google Scholar]
21. A. Jalal, S. Kamal and D. Kim, “Human depth sensors-based activity recognition using spatiotemporal features and hidden markov model for smart environments,” Journal of Computer Networks and Communications, vol. 10, pp. 1–12, 2016. [Google Scholar]
22. S. J. Berlin and M. John, “Human interaction recognition through deep learning network,” in Proc. of IEEE International Carnahan Conference on Security Technology (ICCST), Hatfield, UK, pp. 1–4, 2016. [Google Scholar]
23. A. Jalal, A. Ahmed, A. A. Rafique and K. Kim, “Scene semantic recognition based on modified fuzzy c-mean and maximum entropy using object-to-object relations,” IEEE Access, vol. 9, pp. 27758–27772, 2021. [Google Scholar]
24. A. Jalal, M. Uddin and T. S. Kim, “Depth video-based human activity recognition system using translation and scaling invariant features for life logging at smart home,” IEEE Transactions on Consumer Electronics, vol. 58, pp. 863–871, 2012. [Google Scholar]
25. A. Jalal, S. Kamal and D. -S. Kim, “Detecting complex 3D human motions with body model low-rank representation for real-time smart activity monitoring system,” KSII Transactions on Internet and Information Systems (TIIS), vol. 12, no. 3, pp. 1189–1204, 2018. [Google Scholar]
26. A. Jalal, S. Kamal and D. Kim, “Shape and motion features approach for activity tracking and recognition from kinect video camera,” in Proc. of IEEE 29th Int. Conf. on Advanced Information Networking and Applications Workshops, Gwangju, South Korea, pp. 445–450, 2015. [Google Scholar]
27. A. Jalal, S. Kamal and D. Kim, “Facial expression recognition using 1D transform features and hidden Markov model,” Journal of Electrical Engineering & Technology, vol. 12, no. 4, pp. 1657–1662, 2017. [Google Scholar]
28. C. Chattopadhyay and S. Das, “Supervised framework for automatic recognition and retrieval of interaction: A framework for classification and retrieving videos with similar human interactions,” IET Computer Vision, vol. 10, no. 3, pp. 220–227, 2016. [Google Scholar]
29. I. Akhter, “Automated posture analysis of gait event detection aia a hierarchical optimization algorithm and pseudo 2D stick-model,” M.S. thesis, Dept. Computer science, Air University, Islamabad, Pakistan, 2020. [Google Scholar]
30. I. Akhter, A. Jalal and K. Kim, “Adaptive pose estimation for gait event detection using context-aware model and hierarchical optimization,” Journal of Electrical Engineering & Technology, vol. 9, pp. 1–9, 2021. [Google Scholar]
31. S. -Z. Zhan and I. -C. Chang, “Pictorial structures model based human interaction recognition,” in Proc. of Int. Conf. on Machine Learning and Cybernetics, Lanzhou, China, pp. 862–866, 2014. [Google Scholar]
32. S. Ali and M. Shah, “A lagrangian particle dynamics approach for crowd flow segmentation and stability analysis,” in Proc. of IEEE Conf. on Computer Vision and Pattern Recognition, Minnesota, USA, pp. 1–6, 2007. [Google Scholar]
33. D. Lin, E. Grimson and J. Fisher, “Learning visual flows: A Lie algebraic approach,” in Proc. of IEEE Conf. on Computer Vision and Pattern Recognition, Miami, USA, pp. 747–754, 2009. [Google Scholar]
34. T. M. Hospedales, J. Li, S. Gong and T. Xiang, “Identifying rare and subtle behaviors: A weakly supervised joint topic model,” IIEEE Transactions on Pattern Analysis and Machine Intelligence, vol. 33, pp. 2451–2464, 2011. [Google Scholar]
35. J. Shao, K. Kang, C. Change Loy and X. Wang, “Deeply learned attributes for crowded scene understanding,” in Proc. of IEEE Conference on Computer Vision and Pattern Recognition, Boston, USA, pp. 4657–4666, 2015. [Google Scholar]
36. E. Bonabeau, “Agent-based modeling: Methods and techniques for simulating human systems,” Proceedings of the National Academy of Sciences of the United States of America, vol. 99, pp. 7280–7287, 2002. [Google Scholar]
37. P. Scovanner and M. F. Tappen, “Learning pedestrian dynamics from the real world,” in Proc. of IEEE 12th Int. Conf. on Computer Vision, Kyoto, Japan, pp. 381–388, 2009. [Google Scholar]
38. B. Zhou, X. Wang and X. Tang, “Understanding collective crowd behaviors: Learning a mixture model of dynamic pedestrian-agents,” in Proc. of IEEE Conf. on Computer Vision and Pattern Recognition, Washington, USA, pp. 2871–2878, 2012. [Google Scholar]
39. J. den Berg, M. Lin and D. Manocha, “Reciprocal velocity obstacles for real-time multi-agent navigation,” in Proc. of IEEE Int. Conf. on Robotics and Automation, California, USA, pp. 1928–1935, 2008. [Google Scholar]
40. S. J. Guy, S. Kim, M. C. Lin and D. Manocha, “Simulating heterogeneous crowd behaviors using personality trait theory,” in Proc. of ACM SIGGRAPH/Eurographics Symposium on Computer Animation, Vancouver, Canada, pp. 43–52, 2011. [Google Scholar]
41. P. L. Weiss, Y. Naveh and N. Katz, “Design and testing of a virtual environment to train stroke patients with unilateral spatial neglect to cross a street safely,” Occupational Therapy International, vol. 10, pp. 1, 2003. [Google Scholar]
42. D. C. Schwebel, J. Gaines and J. Severson, “Validation of virtual reality as a tool to understand and prevent child pedestrian injury,” Accident Analysis and Prevention, vol. 40, pp. 1394–1400, 2008. [Google Scholar]
43. J. C. F. de Winter, P. A. Wieringa, J. Kuipers, J. A. Mulder and M. Mulder, “Violations and errors during simulation-based driver training,” Ergonomics, vol. 50, no. 1, pp. 138–158, 2007. [Google Scholar]
44. M. R. E. Romoser and D. L. Fisher, “The effect of active versus passive training strategies on improving older drivers’ scanning in intersections,” Human Factors, vol. 51, pp. 652–668, 2009. [Google Scholar]
45. D. L. Roenker, G. M. Cissell, K. K. Ball, V. G. Wadley and J. D. Edwards, “Speed-of-processing and driving simulator training result in improved driving performance,” Human Factors, vol. 45, pp. 218–233, 2003. [Google Scholar]
46. A. Jalal, S. Kamal and C. A. Azurdia-Meza, “Depth maps-based human segmentation and action recognition using full-body plus body color cues via recognizer engine,” Journal of Electrical Engineering & Technology, vol. 14, no. 1, pp. 455–461, 2019. [Google Scholar]
47. A. A. Rafique, A. Jalal and A. Ahmed, “Scene understanding and recognition: Statistical segmented model using geometrical features and Gaussian naïve Bayes,” in Proc. of IEEE Conference on Int. Conf. on Applied and Engineering Mathematics, Islamabad, Pakistan, vol. 57 pp. 1–6, 2019. [Google Scholar]
48. A. Ahmed, A. Jalal and A. A. Rafique, “Salient segmentation based object detection and recognition using hybrid genetic transform,” in Proc. of Int. Conf. on Applied and Engineering Mathematics (ICAEM), Islamabad, Pakistan, pp. 203–208, 2019. [Google Scholar]
49. A. A. Rafique, A. Jalal and K. Kim, “Statistical multi-objects segmentation for indoor/outdoor scene detection and classification via depth images,” in Proc. of 17th Int. Bhurban Conf. on Applied Sciences and Technology (IBCAST), Islamabad, Pakistan, pp. 271–276, 2020. [Google Scholar]
50. I. Akhter, A. Jalal and K. Kim, “Pose estimation and detection for event recognition using sense-aware features and adaboost classifier.” in Proc. of Conf. on Applied Sciences and Technologies (IBCAST), Islamabad, Pakistan, pp. 500–505, 2021. [Google Scholar]
51. A. Nadeem, A. Jalal and K. Kim, “Human actions tracking and recognition based on body parts detection via artificial neural network,” in Proc. of 3rd Int. Conf. on Advancements in Computational Sciences (ICACS), Lahore, Pakistan, pp. 1–6, 2020. [Google Scholar]
52. A. Ahmed, A. Jalal and K. Kim, “Region and decision tree-based segmentations for multi-objects detection and classification in outdoor scenes,” in Proc. of Int. Conf. on Frontiers of Information Technology (FIT), Islamabad, Pakistan, pp. 209–214. 2019. [Google Scholar]
53. M. Gochoo, I. Akhter, A. Jalal and K. Kim, “Stochastic remote sensing event classification over adaptive posture estimation via multifused data and deep belief network,” Remote Sensing, vol. 13, pp. 1–29, 2021. [Google Scholar]
54. M. Javeed, A. Jalal and K. Kim, “Wearable sensors based exertion recognition using statistical features and random forest for physical healthcare monitoring,” in Proc. of 17th Int. Bhurban Conf. on Applied Sciences and Technology (IBCAST), Islamabad, Pakistan, pp. 2512–517, 2020. [Google Scholar]
55. A. Ahmed, A. Jalal and K. Kim, “A novel statistical method for scene classification based on multi-object categorization and logistic regression,” Sensors, vol. 20, no. 14, pp. 3871, 2020. [Google Scholar]
56. A. Jalal, A. Nadeem and S. Bobasu, “Human body parts estimation and detection for physical sports movements,” in Proc. of 2nd Int. Conf. on Communication, Computing and Digital Systems (C-CODE), Islamabad, Pakistan, pp. 104–109, 2019. [Google Scholar]
57. A. Ahmed, A. Jalal and K. Kim, “RGB-D images for object segmentation, localization and recognition in indoor scenes using feature descriptor and Hough voting,” in Proc. of 17th Int. Bhurban Conf. on Applied Sciences and Technology (IBCAST), Islamabad, Pakistan, pp. 290–295, 2020. [Google Scholar]
58. D. Chakrabarti and C. Faloutsos, “Graph mining: Laws, generators, and algorithms,” ACM Computing Surveys, vol. 38, pp. 1–78, 2006. [Google Scholar]
59. Y. Ghadi, I. Akhter, M. Alarfaj, A. Jalal and K. Kim, “Syntactic model-based human body 3D reconstruction and event classification via association based features mining and deep learning,” PeerJ Computer Science, vol. 7, pp. e764, 2021. [Google Scholar]
60. M. U. Rehman, F. Ahmed, M. A. Khan, U. Tariq, F. A. Alfouzan et al., “Dynamic hand gesture recognition using 3D-CNN and LSTM networks,” Computers, Materials & Continua, vol. 70, pp. 4675–90, 2021. [Google Scholar]
61. W. Boulila, H. Ghandorh, M. A. Khan, F. Ahmed and J. Ahmad, “A novel CNN-LSTM-based approach to predict urban expansion,” Ecological Informatics, vol. 64, pp. 101325, 2021. [Google Scholar]
62. R. Mehran, A. Oyama and M. Shah, “Abnormal crowd behavior detection using social force model,” in Proc. of. IEEE Conf. on Computer Vision and Pattern Recognition, Miami, USA, pp. 935–942, 2009. [Google Scholar]
 | This work is licensed under a Creative Commons Attribution 4.0 International License, which permits unrestricted use, distribution, and reproduction in any medium, provided the original work is properly cited. |