DOI:10.32604/cmc.2022.027030

| Computers, Materials & Continua DOI:10.32604/cmc.2022.027030 |  |
| Article |
Deep Learning Enabled Microarray Gene Expression Classification for Data Science Applications
1Department of Computer Science, Faculty of Computing and Information Technology, King Abdulaziz University, Jeddah, 21589, Saudi Arabia
2Department of Information Technology, College of Computers and Information Technology, Taif University, Taif, 21944, Saudi Arabia
3Department of Computer Science, College of Science & Art at Mahayil, King Khalid University, Saudi Arabia
4Department of Natural and Applied Sciences, College of Community-Aflaj, Prince Sattam bin Abdulaziz University, Saudi Arabia
5Department of Computer and Self Development, Preparatory Year Deanship, Prince Sattam bin Abdulaziz University, AlKharj, Saudi Arabia
*Corresponding Author: Anwer Mustafa Hilal. Email: a.hilal@kku.edu.sa
Received: 09 January 2022; Accepted: 16 February 2022
Abstract: In bioinformatics applications, examination of microarray data has received significant interest to diagnose diseases. Microarray gene expression data can be defined by a massive searching space that poses a primary challenge in the appropriate selection of genes. Microarray data classification incorporates multiple disciplines such as bioinformatics, machine learning (ML), data science, and pattern classification. This paper designs an optimal deep neural network based microarray gene expression classification (ODNN-MGEC) model for bioinformatics applications. The proposed ODNN-MGEC technique performs data normalization process to normalize the data into a uniform scale. Besides, improved fruit fly optimization (IFFO) based feature selection technique is used to reduce the high dimensionality in the biomedical data. Moreover, deep neural network (DNN) model is applied for the classification of microarray gene expression data and the hyperparameter tuning of the DNN model is carried out using the Symbiotic Organisms Search (SOS) algorithm. The utilization of IFFO and SOS algorithms pave the way for accomplishing maximum gene expression classification outcomes. For examining the improved outcomes of the ODNN-MGEC technique, a wide ranging experimental analysis is made against benchmark datasets. The extensive comparison study with recent approaches demonstrates the enhanced outcomes of the ODNN-MGEC technique in terms of different measures.
Keywords: Bioinformatics; data science; microarray gene expression data classification; deep learning; metaheuristics
Microarray classification and analysis are highly critical for earlier diagnoses and treatment of life-threatening diseases such as cancer. It displays the maximum rate of mortality and morbidity stands second in developing countries and in economically developed countries [1]. Generally, the human being suffers from two hundred kinds of cancer and the microarray technique is adapted for keeping records of them. The GLOBOCAN data, Global health observatory, United Nations World population prospectus, and World Health Organization reported that the four increasingly common cancer that occurs around the world are female breast, lung, prostate, and bowel cancer [2]. It is caused by oncogenes and is associated with genome. It causes uncontrolled and abnormal cell development.
The molecular examination makes known that distinct types of cancer have distinct gene expression profiles and might be used for diagnosing distinct cancers. Higher-density DNA microarray evaluates the activity of various genes in a similar manner. This novel technique assists in providing good therapeutic measurement to cancer patients by identifying type of cancer [3]. Earlier diagnosis of cancer types increases the possibility of survival for the victim. This diagnosis is frequently generated as a classification issue [4]. Therefore, it economically becomes restrictive to have larger sample sizes. In order to resolve these problems, microarray medicinal dataset needs dimensionality reduction [5].
There are two main problems facing the algorithm of microarray dataset: extreme amount of genes compared with a smaller amount of samples [6]. Although, there are wide-ranging techniques and algorithms are accessible for this higher dimension information, massive searching space (unrelated gene) damages the classification accuracy [7]. These unrelated genes confuse the learning method and are fed to unrelated genes that are prone to overfitting. A particular way to improve the accuracy of the classification with a higher dimension smaller sample dataset is gene selection (feature selection) [8]. Feature selection (FS) is the procedure of recognizing the related features from the data and representing the higher dimension dataset with a small searching space. However, for microarray data, the appropriate FS resolution is highly complicated as the sample size is smaller than number of genes. Various factors need to be considered when decreasing the dimensionality of the dataset [9]. The Two essential features are searching strategy and evaluation criteria of FS method. According to this factor, the FS method is separated as wrapper and filter methods [10].
In [11], a hybrid model based simulated annealing (SA) algorithm, adaptive neuro-fuzzy inference system (ANFIS), and fuzzy c-means clustering (FCM) are introduced. The presented approach is employed for classifying five distinct cancer data sets (that is central nervous system cancer, lung cancer, prostate cancer, brain cancer, and endometrial cancer). In [12], a Principal Component Analysis (PCA) reduction dimension approach involves the computation of proportion for eigenvector selection. For the classification model, a Levenberg-Marquardt Backpropagation (LMBP) and Support Vector Machine (SVM) approach have been chosen. The researchers in [13] presented a grid searching-based hyper parameter tuning (GSHPT) for RF parameter to categorize Microarray Cancer Data. A grid searching method is developed by a set of fixed parameters that is important in giving optimum performance based on n-fold cross-validation. The grid searching method offers optimal parameters includes several features to consider at all the splits, various trees in the forest. In this study, the ten-fold cross validation is taken into account.
The authors in [14] proposed a state-of-the-art Gene Selection Programming (GSP) approach to choose appropriate genes for efficient and effective classification of cancer. GSP depends on Gene Expression Programming (GEP) model with an improved mutation fitness function definition, recombination operators, and determined initial population. Support Vector Machine (SVM) with linear kernel serves as a classification of GSP. Sun et al. [15] presented an error correcting output code (ECOC) method for classifying multiple class microarray dataset based data complexity (DC) model. In the study, an ECOC coding matrix is created according to the hierarchical partition of the class space by using Minimizing Data Complexity (ECOC-MDC).
This paper designs an optimal deep neural network based microarray gene expression classification (ODNN-MGEC) model for bioinformatics applications. The proposed ODNN-MGEC technique designs an Improved Fruit fly Optimization (IFFO) based feature selection technique that is utilized for reducing the high dimensionality in the biomedical data. Moreover, deep neural network (DNN) model is applied for the classification of microarray gene expression data and the hyperparameter tuning of the DNN model is carried out using the Symbiotic Organisms Search (SOS) technique. For examining the improved outcomes of the ODNN-MGEC technique, a wide ranging experimental analysis is made against benchmark datasets.
This paper has developed an ODNN-MGEC model for gene expression data classification in bioinformatics applications. The proposed ODNN-MGEC technique performs data normalization process to normalize the data into a uniform scale. Followed by, the IFFO algorithm is utilized for reducing the high dimensionality in the biomedical data. In addition, the DNN model is applied for the classification of microarray gene expression data and the hyperparameter tuning of the DNN model is carried out using the SOS algorithm. Fig. 1 demonstrates the overall block diagram of ODNN-MGEC technique.
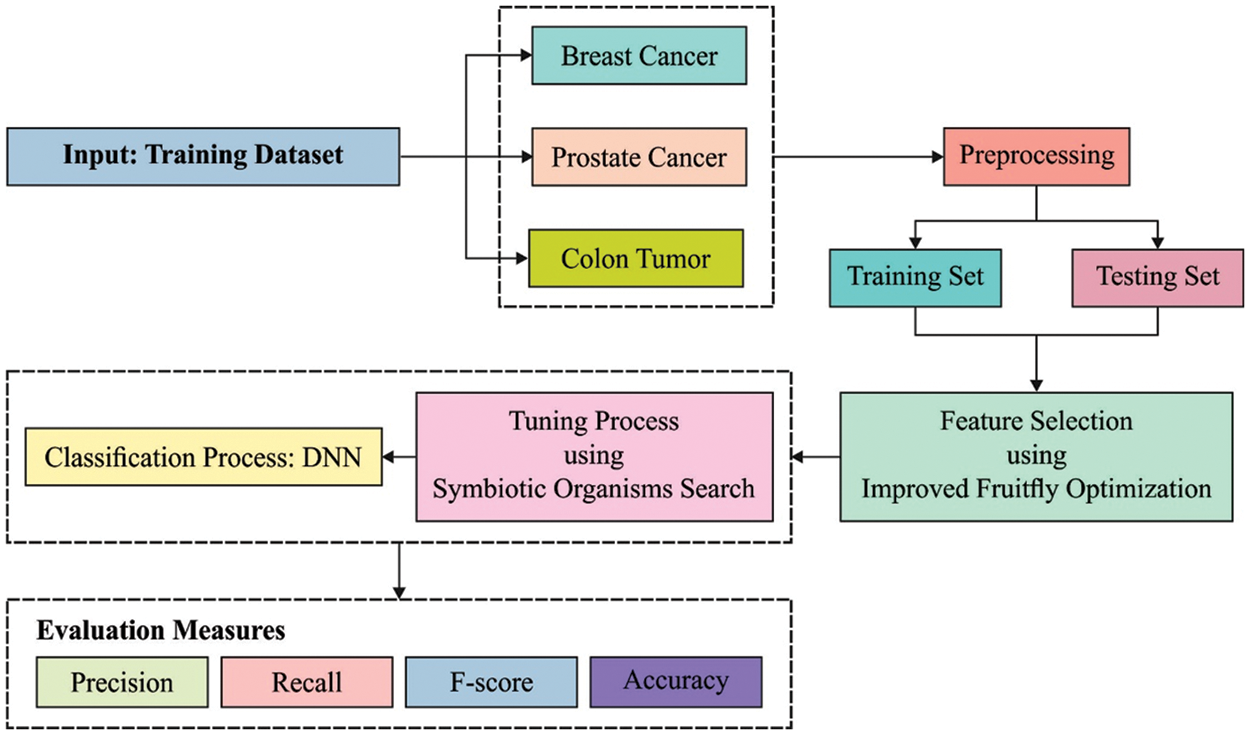
Figure 1: Block diagram of ODNN-MGEC technique
In ML approaches were utilized for discovering tendencies from the dataset with comparative estimation amongst the dimensional data point. But endeavouring for using ML, an important issue was that there dimensional that are drastically varied scales. During this case, the min-max normalized was utilized for reducing the different scales of dimensional. The normalization alters the data from a particular small range by implementing linear transformation on original data. The dimensional value of data is normalization from the range of zero and one utilizing min-max normalized. The min-max carries out the transformation of data by the subsequent formula as:
where
2.2 Algorithmic Design of IFFO Based Feature Selection
In this study, the proper election of feature subsets takes place via the IFFO algorithm. The FFO [16] is established dependent upon foraging performance of Drosophila. The fruit fly (FF) has higher to another species from olfactory ability and visual senses; so, it can be able to completely employ its drive for locating food. In detail, even at a distance of 40 km in the food sources, the nose of FF is collect different food scent which is dispersed during the air. With approaching the food source, the FFs place the food as well as companies gathering place with support of its sensitive visual organ, afterward, it is flying in that way. An optimum FF data are allocated with entire swarm under the iteration, and the next iteration is based only on data of preceding optimum FF. Based on the food search features of FF swarm, the FFO is separated as to many phases as follows [17]:
Step 1. Parameters initialized.
Initializing the parameter of FFO like maximal iteration number the population sizes, a primary FF swarm place
Step 2. Population initialized.
To provide the arbitrary place
Step 3. Population estimation.
Primarily, compute the distance of food place to origin (D). Next, calculate the smell focus judgment value (S) that is reciprocal of distance of the food place to origin.
Step 4. Replacement.
Replacing the smell focus judgment value (S) with smell attention judgment function (is named as Fitness function) for finding the smell attention (Smell) of individual place of FF.
Step 5. Determine the higher smell attention.
Define the FF with maximum smell attention and the equivalent place amongst the FF swarm.
Step 6. Retain the higher smell attention.
Recollect the maximum smell focus value and coordinates
Step 7. Iterative optimization.
Enter the iterative optimized for repeating the execution of steps 2–5. The flow ends if the smell attention is not anymore higher than preceding iterative smell attention or if the iterative number attains the higher iterative numbers. The IFFO algorithm is derived by incorporating the concepts of chaos theory. The chaotic method is non-linear and divergent naturally, it illustrates optimum outcomes to global optimized. It creates oscillating trajectories and created a fractal infrastructure. The fitness function was resultant by IFFO technique to define solution in this state generated to obtain a balance among the 2 objectives as:
2.3 Optimal DNN Based Classification
At the time of classification process, the DNN model is used to determine the proper class label. The basis of DNN is that the NN system is initially separated as a two-layer model and later train the two-layer NN system layer wise and lastly get the primary weight of multi-layer NN model by constructing the trained two-layer NN models, the entire procedure is named layer wise pre-training [18]. The hidden state of NN model extracts features from the input layer because of its abstraction. Therefore, the NN model using various hidden states is good at network generalization and processing as well attain fast convergence rate. Fig. 2 showcases the structure of DNN.
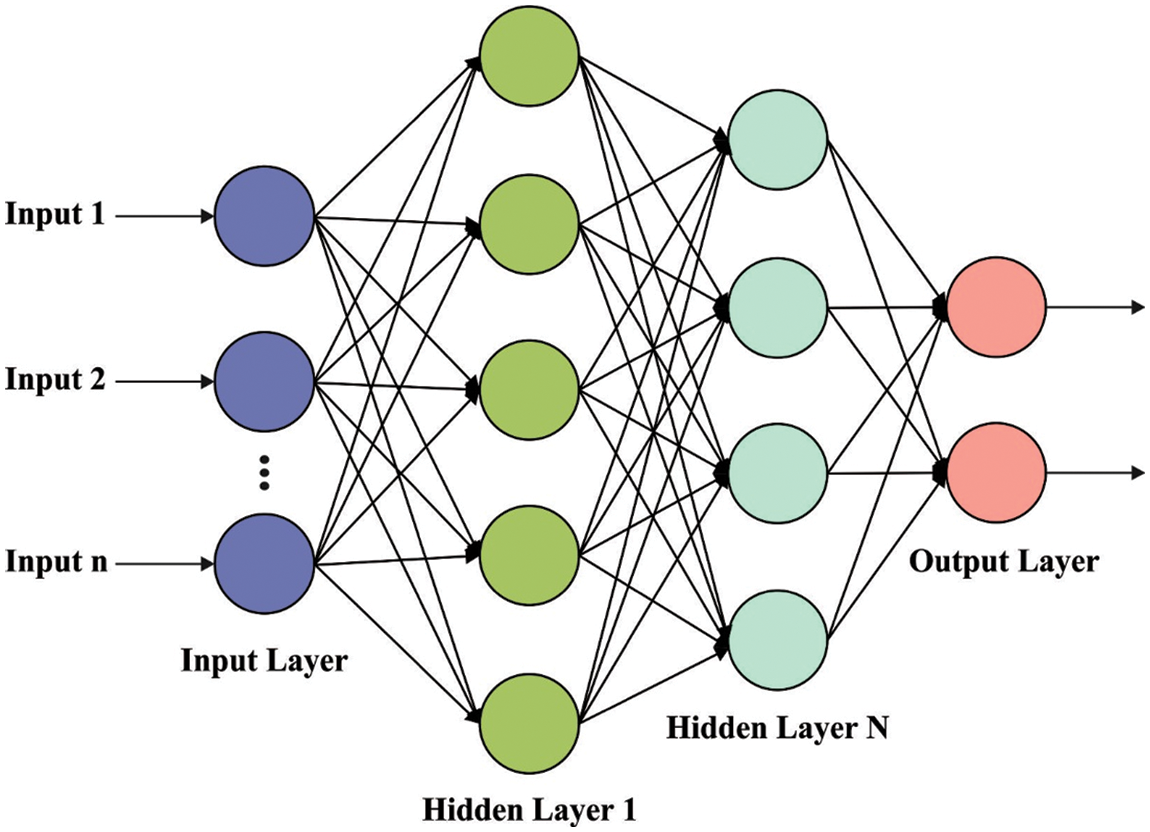
Figure 2: DNN structure
DNN is a kind of feed-forward ANN with many hidden states, also all the nodes at the similar hidden state utilize a similar non-linear function for mapping the input features from the layer below to the existing nodes. DNN framework is flexible because of the different hidden states and nodes, hence DNN illustrates outstanding capacity of fitting the complicated non-linear relations among inputs and outputs. In general, DNN method is employed for classification or regression. The relationships among inputs and outputs in DNN method is expressed by the following equation:
In the equation, we attain the last output by converting the feature vector of the initial layer
2.4 Hyperparameter Tuning Using SOS Algorithm
For optimally tuning the hyperparameters of the DNN model, the SOS is applied. Cheng and Prayogo [19] presented SOS, a novel population based metaheuristic approach simulated by natural ecosystems. SOS utilizes the symbiotic connection amongst 2 different species. The symbiotic connection that is general from the real world has mutualism, commensalism, and parasitism. Mutualism is described as inter-dependable connections amongst 2 organisms in which combined organism’s advantage in the communication. The connection amongst the bee as well as flower is instance of mutualism connection. The bee moves amongst the flower and gather nectar and turned it as to honey. This activity profit the flower as it allows them from the pollination procedure. The procedure is expressed mathematically as:
where
The round function has been utilized for setting the value of
The proposed ODNN-MGEC technique has been validated using three datasets namely breast cancer, prostate cancer, and colon cancer datasets [20,21]. Breast cancer comprises 24,481 features and 97 samples. The prostate cancer dataset has 12,600 features with 136 samples where 77 samples are prostate tumors and 59 samples are normal. The colon cancer dataset has 2000 genes and 62 samples gathered in colon cancer patients.
Tab. 1 and Fig. 3 offer the experimental results obtained by the ODNN-MGEC technique on the breast cancer dataset. The results depicted that the ODNN-MGEC technique has offered enhanced classifier results under all hidden layers. For instance, with 2 hidden layers, the ODNN-MGEC technique has obtained

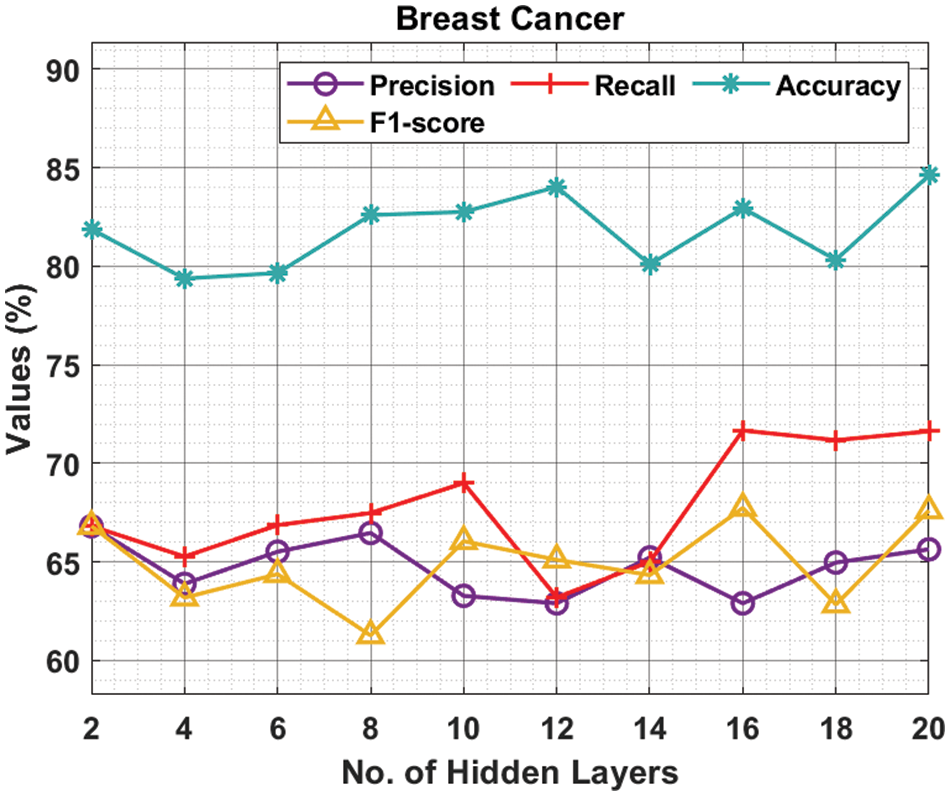
Figure 3: Result analysis of ODNN-MGEC technique on breast cancer dataset
Tab. 2 and Fig. 4 provide the experimental results obtained by the ODNN-MGEC technique on the prostate cancer dataset. The results depicted that the ODNN-MGEC technique has offered superior classifier outcomes under all hidden layers. For instance, with 2 hidden layers, the ODNN-MGEC method has obtained

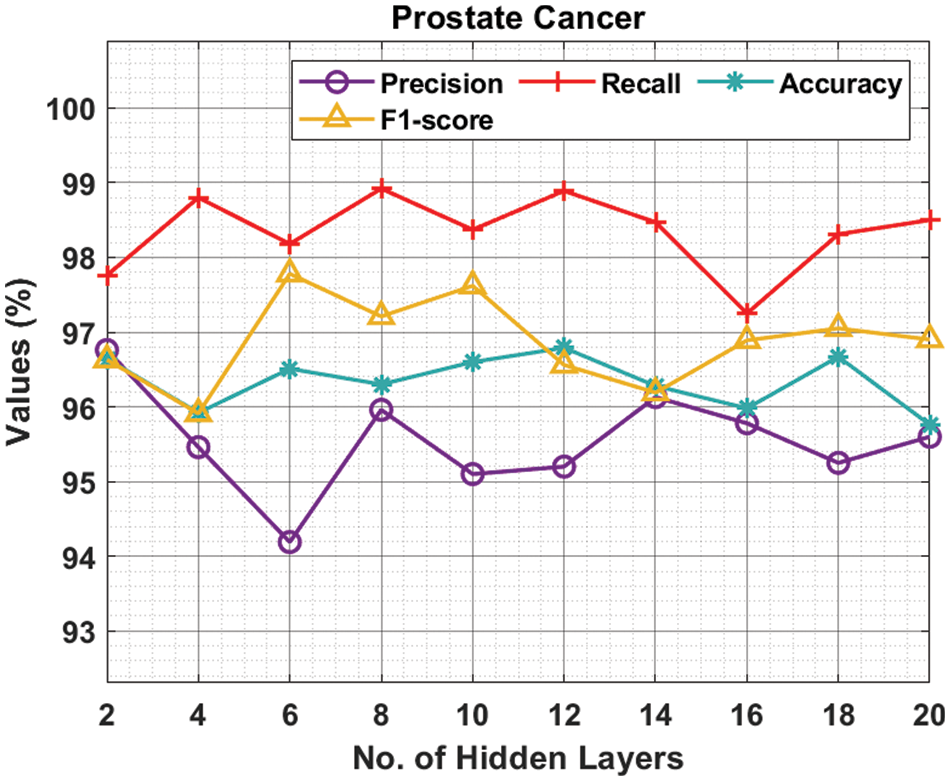
Figure 4: Result analysis of ODNN-MGEC technique on prostate cancer dataset
Tab. 3 and Fig. 5 demonstrate the experimental results obtained by the ODNN-MGEC system on the colon tumor dataset. The outcomes depicted that the ODNN-MGEC technique has obtainable improved classifier outcomes under all hidden layers. For instance, with 2 hidden layers, the ODNN-MGEC algorithm has achieved

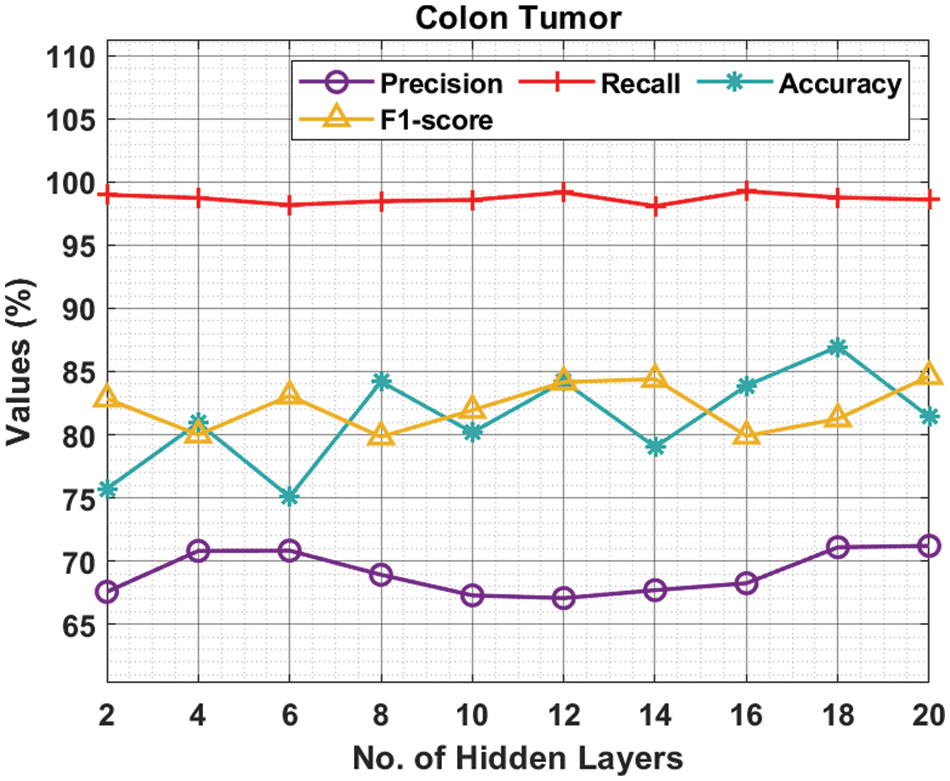
Figure 5: Result analysis of ODNN-MGEC technique on colon tumor dataset
In order to highlight the enhanced outcomes of the ODNN-MGEC technique, a comparison study is made with recent methods in Tab. 4.

Fig. 6 offers the classifier results of the ODNN-MGEC technique with existing techniques on breast cancer dataset. The results depicted that the SVM-Polynomial approach has resulted in poor performance with
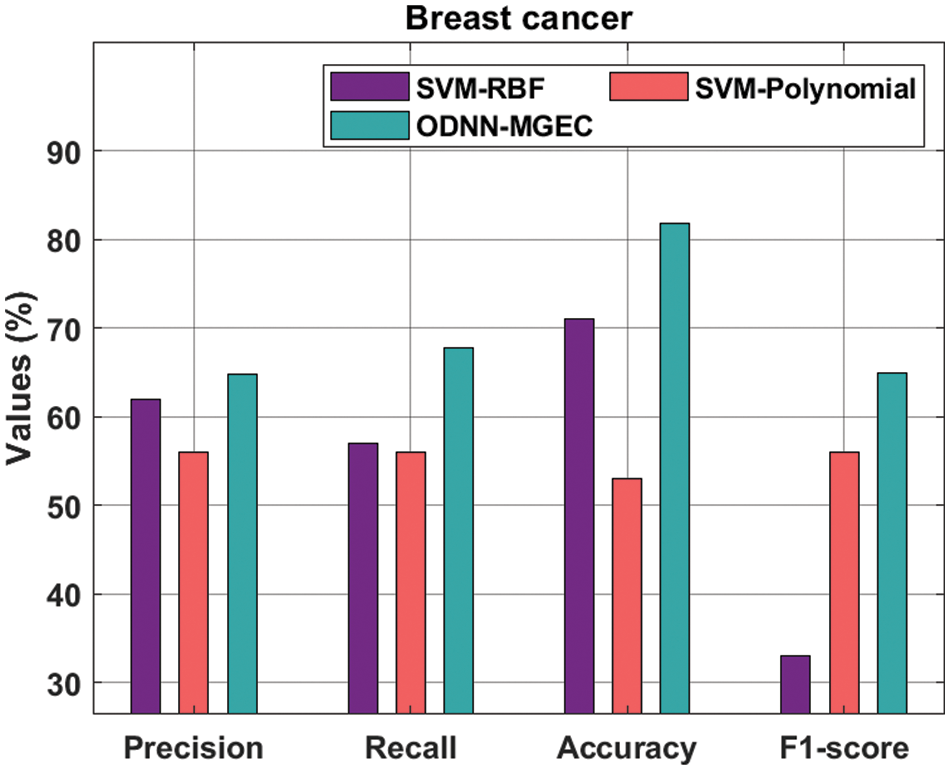
Figure 6: Comparative analysis of ODNN-MGEC technique on breast cancer dataset
Fig. 7 provides the classifiers of the ODNN-MGEC technique with existing techniques on prostate cancer dataset. The outcomes outperformed that the SVM-Polynomial approach has resulted in worse performance with the
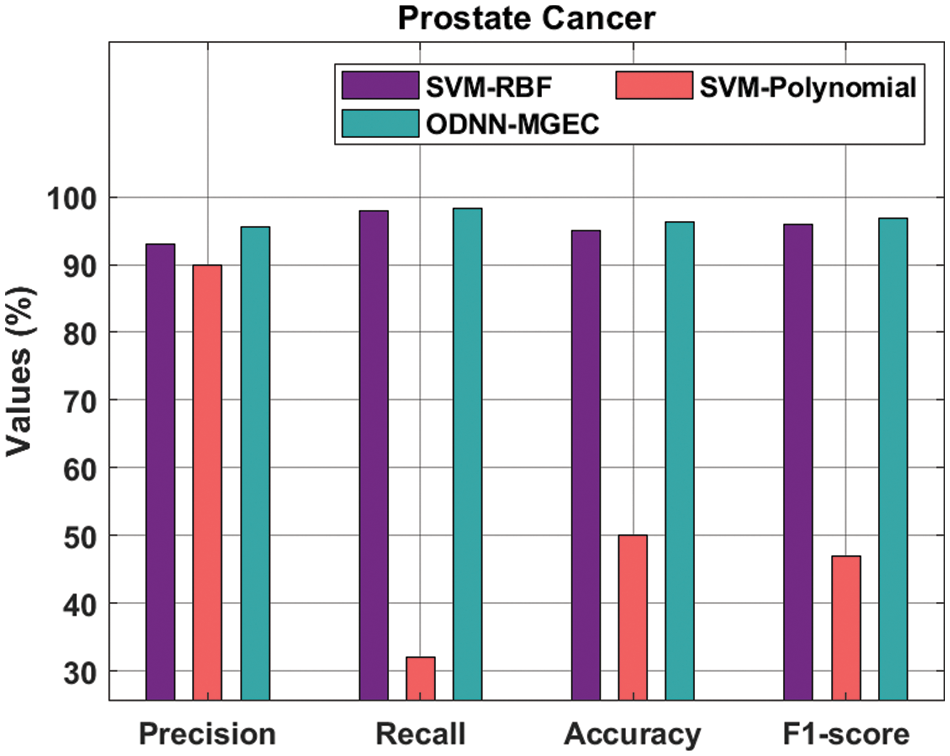
Figure 7: Comparative analysis of ODNN-MGEC technique on prostate cancer dataset
Fig. 8 gives the classifier outcomes of the ODNN-MGEC methodology with existing algorithms on colon tumor dataset. The outcomes demonstrated that the SVM-Polynomial method has resulted in worse performance with
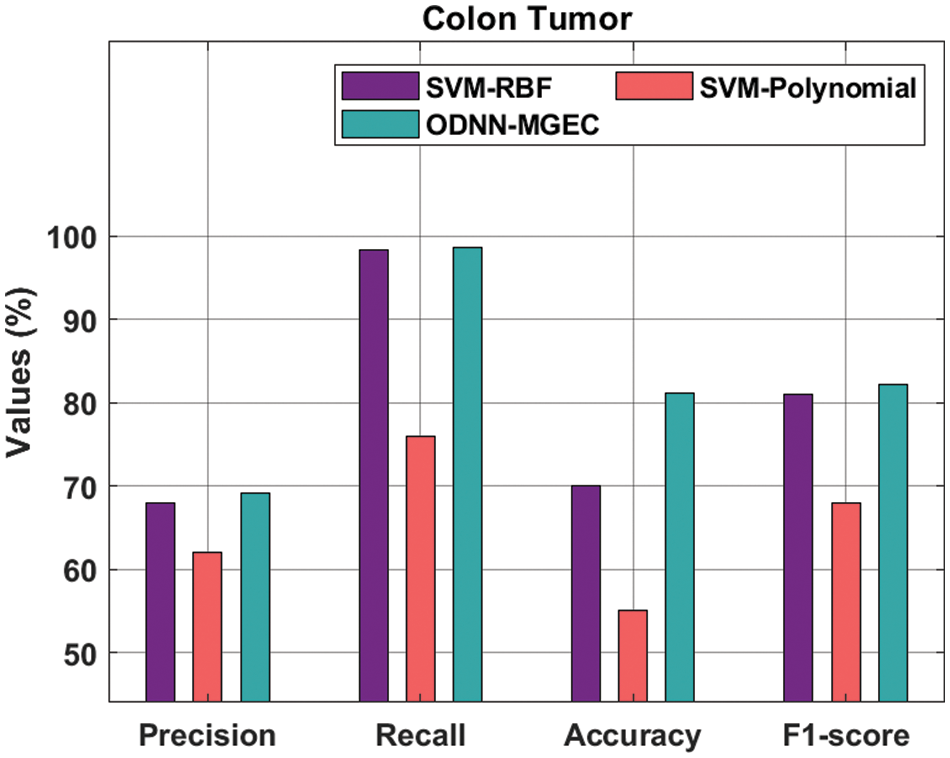
Figure 8: Comparative analysis of ODNN-MGEC technique on colon tumor dataset
From the above mentioned result and discussion, it is apparent that the ODNN-MGEC technique has accomplished superior outcomes over the other methods.
This paper has developed an ODNN-MGEC model for gene expression data classification in bioinformatics applications. The proposed ODNN-MGEC technique performs data normalization process to normalize the data into a uniform scale. Followed by, the IFFO algorithm is used to reduce the high dimensionality in the biomedical data. In addition, the DNN model is applied for the classification of microarray gene expression data and the hyperparameter tuning of the DNN model is carried out using the SOS algorithm. The utilization of IFFO and SOS algorithms pave the way for accomplishing maximum gene expression classification outcomes. For examining the improved outcomes of the ODNN-MGEC technique, a wide ranging experimental analysis is made against benchmark datasets. The extensive comparison study with recent approaches demonstrates the enhanced outcomes of the ODNN-MGEC technique in terms of different measures. In future, the microarray gene classification performance can be boosted by the design of clustering and outlier removal models.
Funding Statement: The authors extend their appreciation to the Deanship of Scientific Research at King Khalid University for funding this work under grant number (RGP 2/42/43). This work was supported by Taif University Researchers Supporting Program (project number: TURSP-2020/200), Taif University, Saudi Arabia.
Conflicts of Interest: The authors declare that they have no conflicts of interest to report regarding the present study.
1. R. Dash, “A two stage grading approach for feature selection and classification of microarray data using Pareto based feature ranking techniques: A case study,” Journal of King Saud University-Computer and Information Sciences, vol. 32, no. 2, pp. 232–247, 2020. [Google Scholar]
2. R. Dash, “An adaptive harmony search approach for gene selection and classification of high dimensional medical data,” Journal of King Saud University-Computer and Information Sciences, vol. 33, no. 2, pp. 195–207, 2021. [Google Scholar]
3. P. Mohapatra, S. Chakravarty and P. K. Dash, “Microarray medical data classification using kernel ridge regression and modified cat swarm optimization based gene selection system,” Swarm and Evolutionary Computation, vol. 28, no. Suppl. 8, pp. 144–160, 2016. [Google Scholar]
4. S. Sucharita, B. Sahu and T. Swarnkar, “A comprehensive study on the application of grey wolf optimization for microarray data,” in Data Analytics in Bioinformatics: A Machine Learning Perspective, pp. 211–248, 2021. [Google Scholar]
5. R. Dash and B. B. Misra, “Pipelining the ranking techniques for microarray data classification: A case study,” Applied Soft Computing, vol. 48, no. 11, pp. 298–316, 2016. [Google Scholar]
6. C. Zhang, L. Liu, S. Zhang and C. Huang, “Microarray data classification based on neighbourhood components analysis projection method,” in 2021 IEEE 6th Int. Conf. on Big Data Analytics (ICBDA), Xiamen, China, pp. 123–127, 2021. [Google Scholar]
7. S. Begum, R. Sarkar, D. Chakraborty, S. Sen and U. Maulik, “Application of active learning in DNA microarray data for cancerous gene identification,” Expert Systems with Applications, vol. 177, no. 11, pp. 114914, 2021. [Google Scholar]
8. R. Dash and B. Misra, “Gene selection and classification of microarray data: A Pareto DE approach,” Intelligent Decision Technologies, vol. 11, no. 1, pp. 93–107, 2017. [Google Scholar]
9. Jahwar and N. Ahmed, “Swarm intelligence algorithms in gene selection profile based on classification of microarray data: A review,” Journal of Applied Science and Technology Trends, vol. 2, no. 01, pp. 01–9, 2021. [Google Scholar]
10. R. Dash and B. B. Misra, “Performance analysis of clustering techniques over microarray data: A case study,” Physica A: Statistical Mechanics and its Applications, vol. 493, no. 1, pp. 162–176, 2018. [Google Scholar]
11. B. Haznedar, M. T. Arslan and A. Kalinli, “Optimizing ANFIS using simulated annealing algorithm for classification of microarray gene expression cancer data,” Medical & Biological Engineering & Computing, vol. 59, no. 3, pp. 497–509, 2021. [Google Scholar]
12. U. N. Wisesty Adiwijaya, E. Lisnawati, A. Aditsania and D. S. Kusumo, “Dimensionality reduction using principal component analysis for cancer detection based on microarray data classification,” Journal of Computer Science, vol. 14, no. 11, pp. 1521–1530, 2018. [Google Scholar]
13. B. H. Shekar and G. Dagnew, “Grid search-based hyperparameter tuning and classification of microarray cancer data,” in 2019 Second Int. Conf. on Advanced Computational and Communication Paradigms (ICACCP), Gangtok, India, pp. 1–8, 2019. [Google Scholar]
14. R. Alanni, J. Hou, H. Azzawi and Y. Xiang, “A novel gene selection algorithm for cancer classification using microarray datasets,” BMC Medical Genomics, vol. 12, no. 1, pp. 10, 2019. [Google Scholar]
15. M. Sun, K. Liu, Q. Wu, Q. Hong, B. Wang et al., “A novel ECOC algorithm for multiclass microarray data classification based on data complexity analysis,” Pattern Recognition, vol. 90, pp. 346–362, 2019. [Google Scholar]
16. W. T. Pan, “A new fruit fly optimization algorithm: Taking the financial distress model as an example,” Knowledge-Based Systems, vol. 26, no. 7, pp. 69–74, 2012. [Google Scholar]
17. L. Shen, H. Chen, Z. Yu, W. Kang, B. Zhang et al., “Evolving support vector machines using fruit fly optimization for medical data classification,” Knowledge-Based Systems, vol. 96, no. 3, pp. 61–75, 2016. [Google Scholar]
18. W. Zheng, D. Hu and J. Wang, “Fault localization analysis based on deep neural network,” Mathematical Problems in Engineering, vol. 2016, pp. 1–11, 2016. [Google Scholar]
19. M. Y. Cheng and D. Prayogo, “Symbiotic organisms search: A new metaheuristic optimization algorithm,” Computers & Structures, vol. 139, pp. 98–112, 2014. [Google Scholar]
20. A. H. Chen and C. Yang, “The improvement of breast cancer prognosis accuracy from integrated gene expression and clinical data,” Expert Systems with Applications: An International Journal, vol. 39, no. 5, pp. 4785–4795, 2012. [Google Scholar]
21. B. Liu, Q. Cui, T. Jiang and S. Ma, “A combinational feature selection and ensemble neural network method for classification of gene expression data,” BMC Bioinformatics, vol. 5, pp. 136, 2004. [Google Scholar]
 | This work is licensed under a Creative Commons Attribution 4.0 International License, which permits unrestricted use, distribution, and reproduction in any medium, provided the original work is properly cited. |