DOI:10.32604/cmc.2022.027094
| Computers, Materials & Continua DOI:10.32604/cmc.2022.027094 | |
| Article |
Characteristics of Desertification Change in Lake Basin Area in Gangcha County
1School of Geographical Sciences, Nanjing University of Information Science & Technology, Nanjing, 210044, China
2Public Meteorological Service Center, China Meteorological Administration, Beijing, 100081, China
3Center for Wind and Solar Energy Resources, China Meteorological Administration, Beijing, 100081, China
4Faculty of Science, The University of Auckland, Auckland, 1010, New Zealand
*Corresponding Author: Yanbo Shen. Email: shenyb@cma.gov.cn
Received: 10 January 2022; Accepted: 23 March 2022
Abstract: Qinghai Lake Basin area in Gangcha county is selected as the study area in terms of desertification change features in this paper. Based on the remote sensing (RS) and global positioning system (GPS) technologies, the desertification information range from 1989 to 2014 in the study area is extracted. Using the method of the decision tree, the desertification in the research area is been divided into four grades including mild desertification, moderate desertification, severe desertification and serious desertification. The change characteristics of desertification in the study area were analyzed in detail, which showed that the desertification in the study area experienced a process of first development and then a reversal. The rapid development of desertification appears in the 1990s, where about 1101.22 kilometers of desertification area was increased in this stage. Since the twenty-first Century, the desertification is gradually significant recovered and local area exist intensified desertification. There are tendencies of interactive transform in different types of desertification. The tendencies of different degrees of desertification land are rising, and there’re some differences in rising rates, where the expansion rate of moderate desertification is the biggest, increasing by 7.27 kilometers per year.
Keywords: Desertification classification; desertification expansion rate; grass land change; the Qinghai Lake
Desertification is a manifestation of land degradation, which was first proposed by Lavauden [1]. However, the definitions of desertification are still not reached a consensus [2]. It was not until 1999 that the definition of desertification was widely applied in academic circles in the United Nations Convention to Combat Desertification, which pointed out that desertification is the land degradation in arid, semi-arid, and semi-humid areas caused by a variety of factors including climate change and human activities [3]. Desertification, threatened human survival and sustainable development, has become one of the most serious ecological environment and social-economic problems.
Desertification mapping is the important and fundamental work for studies of the mechanism of desertification, spatial and temporal change of land degradation. Hanan et al. [4] used remote sensing data to evaluate the desertification in the Sahara desert. Tripathy et al. [5] extracted Albedo, normalized difference vegetation index (NDVI), land erosion rate and, soil moisture from Multispectral Scanner (MSS) images to evaluate land degradation in the Karnataka region of India by selecting. Nasem et al. [6] used temporal and spatial dynamic index of vegetation coverage to dynamically monitor desertification change in Egypt through multi-temporal moderate-resolution imaging like spectroradiometer (MODIS) remote sensing data. Wu [7,8] proposed a series of remote sensing dynamic monitoring methods based on the technical route of discriminant indicators and monitoring of desertified land; then, the authors found that the desertified land change in the Horqin region experienced a process of development-redevelopment-reversal in recent 50 years. Based on remote sensing images, Li et al. [9] believed through discussion and analysis that desertification in the Otindag Sandy Land would develop further in the 21st century under the background of global warming. Hu et al. [10,11] monitored desertification in the source region of the Yellow River in recent 30 years by combining remote sensing and geographic information system technology and found that the area of desertified land in the source region of the Yellow River showed an increasing trend, and further verified and analyzed the development of desertification combining landscape pattern analysis. For the study of desertification in China, many scholars mainly put their efforts into the typical sandy land in north China (Horqin Sandy Land, Mu Us Sandy Land, Otindag Sandy Land, Hulun Buir Sandy Land, etc.), ecologically fragile river source regions and the Qinghai-Tibet Plateau [12,13]. These studies have analyzed the dynamic changes of desertification in these regions, but the driving mechanism of desertification is mostly discussed by qualitative methods, and the screening of main controlling factors of desertification is lacking.
The sensitivity of desertification in the surrounding area of the Qinghai Lake is moderate and high. In recent years, the desertification situation in the Qinghai Lake area has been quite serious. Therefore, the Qinghai Lake area has become one of the hot spots and focus areas of desertification around the world. Therefore, Gangcha County was selected as a representative county to carry out relevant research and provide scientific decision-making basis for desertification prevention and control.
The remainder of this paper is organized as follows. Section 2 describes the study area. Section 3 describes the data preprocessing. Then, Section 4 describes the research methods. Next, Section 5 demonstrates and discusses the research results in detail, and finally, Section 6 presents the conclusions.
Study area, on the north bank of Qinghai Lake, is located at Gangcha County, Haibei Tibetan Autonomous Prefecture, Qinghai Province. The geographical location is between 99°20 ′44 ″–100°37′ 24″ E, 36°58 ′06 ″–38°04′ 04″ N, bordering Haiyan County on the east, Tianjun County of Haixi Mongolian and Tibetan Autonomous Prefecture on the west, Buha River and Hainan County on the south, and Tonghe River on the north. The total area is 1.2*104 km2, and the land type is mainly grassland. The terrain of the study area is clear north high and south low, with an average altitude of more than 3300 m. Gangcha county is a typical highland continental climate, long sunshine time, the large temperature difference between day and night; The average annual precipitation is 370.5 mm, and the annual evaporation is 1500.6~1847.8 mm. It is cool in summer and autumn and cold in winter. The average annual temperature is only −0.6°C. In this paper, the southern lake basin area with obvious desertification development was selected as the research area (As shown in Fig. 1).
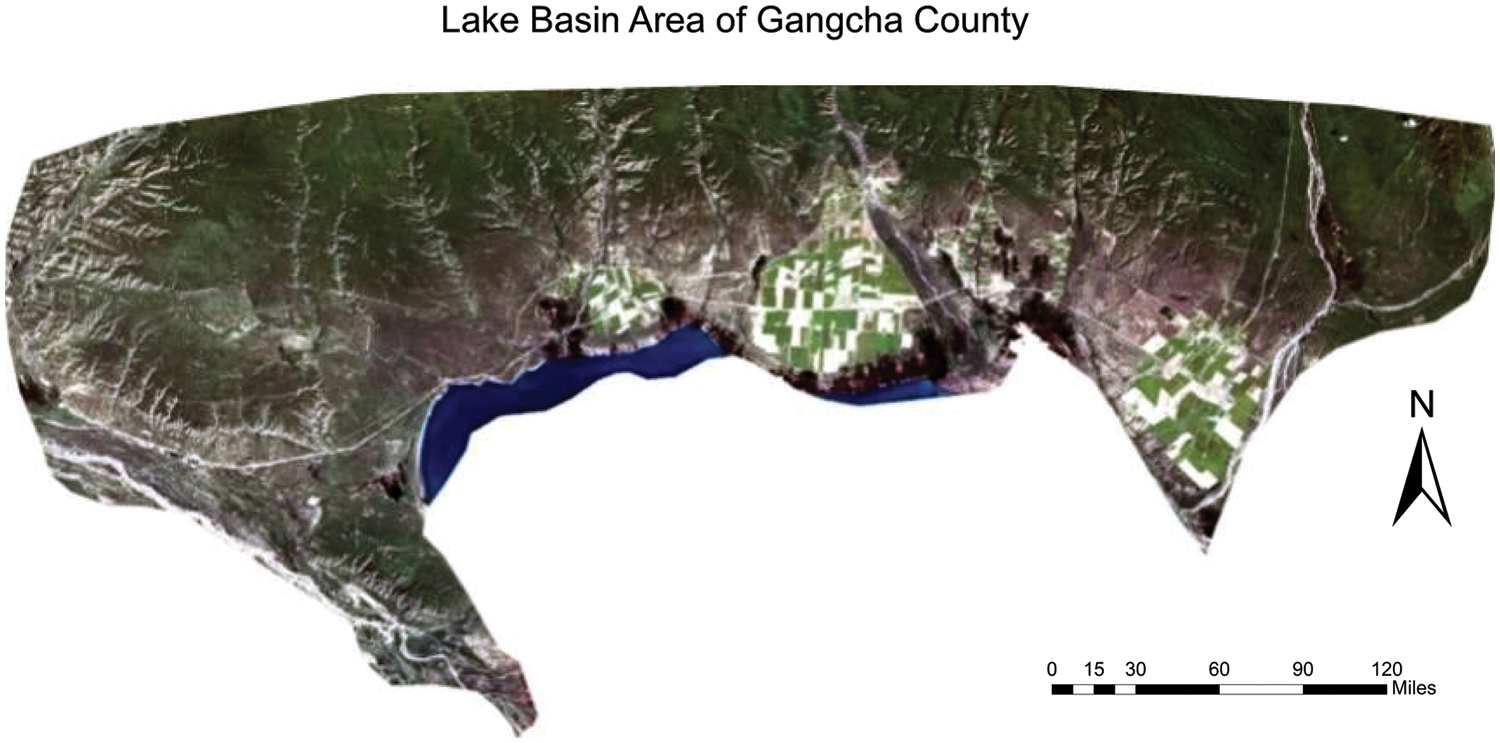
Figure 1: Image of the study area
This paper mainly uses Landsat 5 Thematic Mapper (TM) remote sensing image data to interpret and obtain the land cover in the study area. Landsat data is obtained by NASA, which is favored for its advantages of multi-band, good spatial resolution (30 M) and short monitoring period, especially its superior potential in long-term continuous remote sensing monitoring at the large regional scale. In this study, Landsat 5 TM images from 1989 to 2014 were selected as the main data source. The images were mainly taken from July to September when the vegetation coverage of the Gangcha Lake basin area was better and the thermal radiation difference of ground objects was more obvious, and the cloud content of the images was less than 10%. Specific image information is shown in Tab. 1.

Due to attenuation and satellite flight attitude sensor function, the effect of many factors, such as atmosphere and at the time of complex surface information, will inevitably produce a variety of radiation distortion, geometric distortion and atmospheric extinction system error and random error, which is to reduce the quality of the remote sensing image and affects the accuracy of image analysis [14]. Therefore, it is necessary to preprocess remote sensing images. In this study, remote sensing image preprocessing includes radiometric calibration, atmospheric correction, geometric correction, image clipping, etc. All preprocessing operations are based on the environment for visualizing images (ENVI) 5.0 platform.
4.1 Selection and Inversion of Desertification Monitoring Index
On the basis of the interpretation of the desertification results, the desertification vector diagrams of 1990 and 2000, 2000 and 2009, and 2009 and 2014 were superimposed and calculated, obtained the years 1990 to 2000, 2000 to 2009, and the transfer matrix of various types of desertified land in the three periods, and analyzed the evolution mechanism of different types of desertified land in two different time dimensions: interdecadal and interannual.
Albedo refers to the ratio of solar radiation reflected by the earth’s surface, that is, the ratio of the solar radiation flux reflected by the Earth’s surface to the solar radiation flux incident. Surface Albedo, or surface Albedo, reflects the earth’s ability to reflect solar radiation. Radiation from the sun drives the land, sea, air the material exchange and energy cycle of the ecosystem, absorbed by the surface solar radiation conditions but also will affect the entire earth’s weather and climate change. So the surface albedo is the key factor of the development and changes of the earth’s climate system, it is an important parameter of the terrestrial surface radiation energy balance. Referring to the calculation method, this study uses the reflectance in the direction of the top of the atmosphere to estimate the surface albedo of the wideband, and the calculation formula is as follows:
where,
Fractional Vegetation Cover (FVC) refers to the vertical projection area of Vegetation in the unit area [15], which is one of the important input parameters in land desertification evaluation, soil erosion monitoring and ecological environment assessment [16]. Vegetation coverage is usually estimated using NDVI. NDVI is a comprehensive reflection of vegetation type cover form and growth status within a unit pixel [16]. Its characteristics are mainly shown as follows: When the pixel is completely covered by vegetation, the corresponding NDVI value is 1; when there is no vegetation coverage at all, the corresponding NDVI value is between −1 and 0, such as water body and desert; when vegetation cannot completely cover the whole pixel, the corresponding NDVI value is between 0 and 1, and such pixel is called a mixed pixel. The calculation formula of normalized vegetation index NDVI is as follows:
where NIR and R are the near-infrared band and red band of the image respectively.
According to the binary pixel model [17,18], the estimation formula of vegetation coverage is as follows:
In the formula,
4.1.3 Modified Soil Adjusted Vegetation Index
To reduce the influence of soil, shadow, atmospheric environment and other factors on the vegetation index inversion results, the improved soil-adjusted vegetation index (MSAVI) came into being. MSAVI can minimize the influence of soil factors and enhance sensitivity to vegetation [19]. As an important indicator of desertification classification, MSAVI can not only eliminate the influence of soil factors but also obtain objective results without artificial parameters. The specific calculation formula is as follows:
where NIR and R are the near-infrared band and red band of the image respectively.
4.1.4 Land Surface Temperature
Land Surface Temperature (LST), which is an important parameter in desertification monitoring, will change with the change of desertified Land types. Land surface temperature inversion is mainly based on remote sensing data with the thermal infrared band. At present, LST inversion algorithms mainly include atmospheric correction method, single-channel algorithm, split window algorithm, and multi-band algorithm. In this study, the single-channel algorithm proposed by Weng Qihao et al. was used to invert land surface temperature.
First, the gray value is converted into the emitted radiation energy of the object, and the formula is as follows:
Where,
Secondly, the radiation energy emitted by the object is converted into the brightness temperature of surface radiation, and the transformation formula is as follows:
Where,
Then, the brightness temperature can be converted to the surface temperature, and the calculation formula is as follows:
Where, λ = 11.5 um; H is Planck constant, 6.26 × 10⁻³⁴, unit is J·S; C is the speed of light, and the value is 2.998 × 10⁸ m/s. α is Stefan Boltzmann constant, with a value of 1.38 × 10⁻²³, and the unit is J/K. ε is the specific emissivity. The modified specific emissivity method proposed by Qin [20] is adopted for correction, and the formula is as follows:
In the formula,
Soil moisture (WET) is an important indicator for monitoring land degradation and is of great significance for remote sensing monitoring and quantitative evaluation of desertification. The vegetation canopy temperature is affected by soil moisture. Sandholt et al. [21] found in their study that there were many isolines in the feature spatial distribution of TS-NDVI, so they proposed the concept of temperature vegetation drought index (TVDI). TVDI is calculated by land surface temperature and vegetation index, and the specific calculation formula is as follows:
where
4.2 Extraction of Desertification Information In The Study Area
Remote sensing image classification is the prerequisite to evaluate the degree and spatial distribution of land desertification in the study area. The nature of decision tree classification is a kind of supervised classification, and its classification steps can be roughly divided into the following steps: First, the definition of knowledge (rules), which can be expressed by mathematical language such as algorithm, or defined by experience summary; Second is the input of rules, that is, the defined classification rules are input to the classifier; Thirdly the decision tree operation is carried out; Finally, the classification results are processed after output. Before decision tree classification, it is necessary to fuse the inverted vegetation coverage, albedo, land surface temperature, improved soil-adjusted vegetation index, and soil moisture image to obtain a new multi-band remote sensing image, which is used as the input layer of decision tree classification. In order to refine the desertification grade of the study area, the desertification grade of the study area was divided into seven categories: mild desertification, moderate desertification, severe desertification, severe desertification, non-desertification land, water body, and others (including cloud, cloud shadow, and snow).
According to the mathematical statistics of inversion parameters, the classification thresholds of desertification degree of different grades were set. In general, NDVI value can distinguish the vegetation covered area from the non-vegetation covered area, and the vegetation coverage can effectively distinguish the mild desertification land, moderate desertification land, severe desertification land, and desertified land. Albedo can efficiently cloud, the cloud and snow from vegetation types in the land to the isolated, the surface temperature can distinguish between water and serious desertification land types, the modified soil adjusted vegetation index and soil moisture can further distinguish between vegetation and vegetation coverage less desertification, water, and different land types such as cloud. The specific classification rules of the decision tree are shown in Fig. 2.
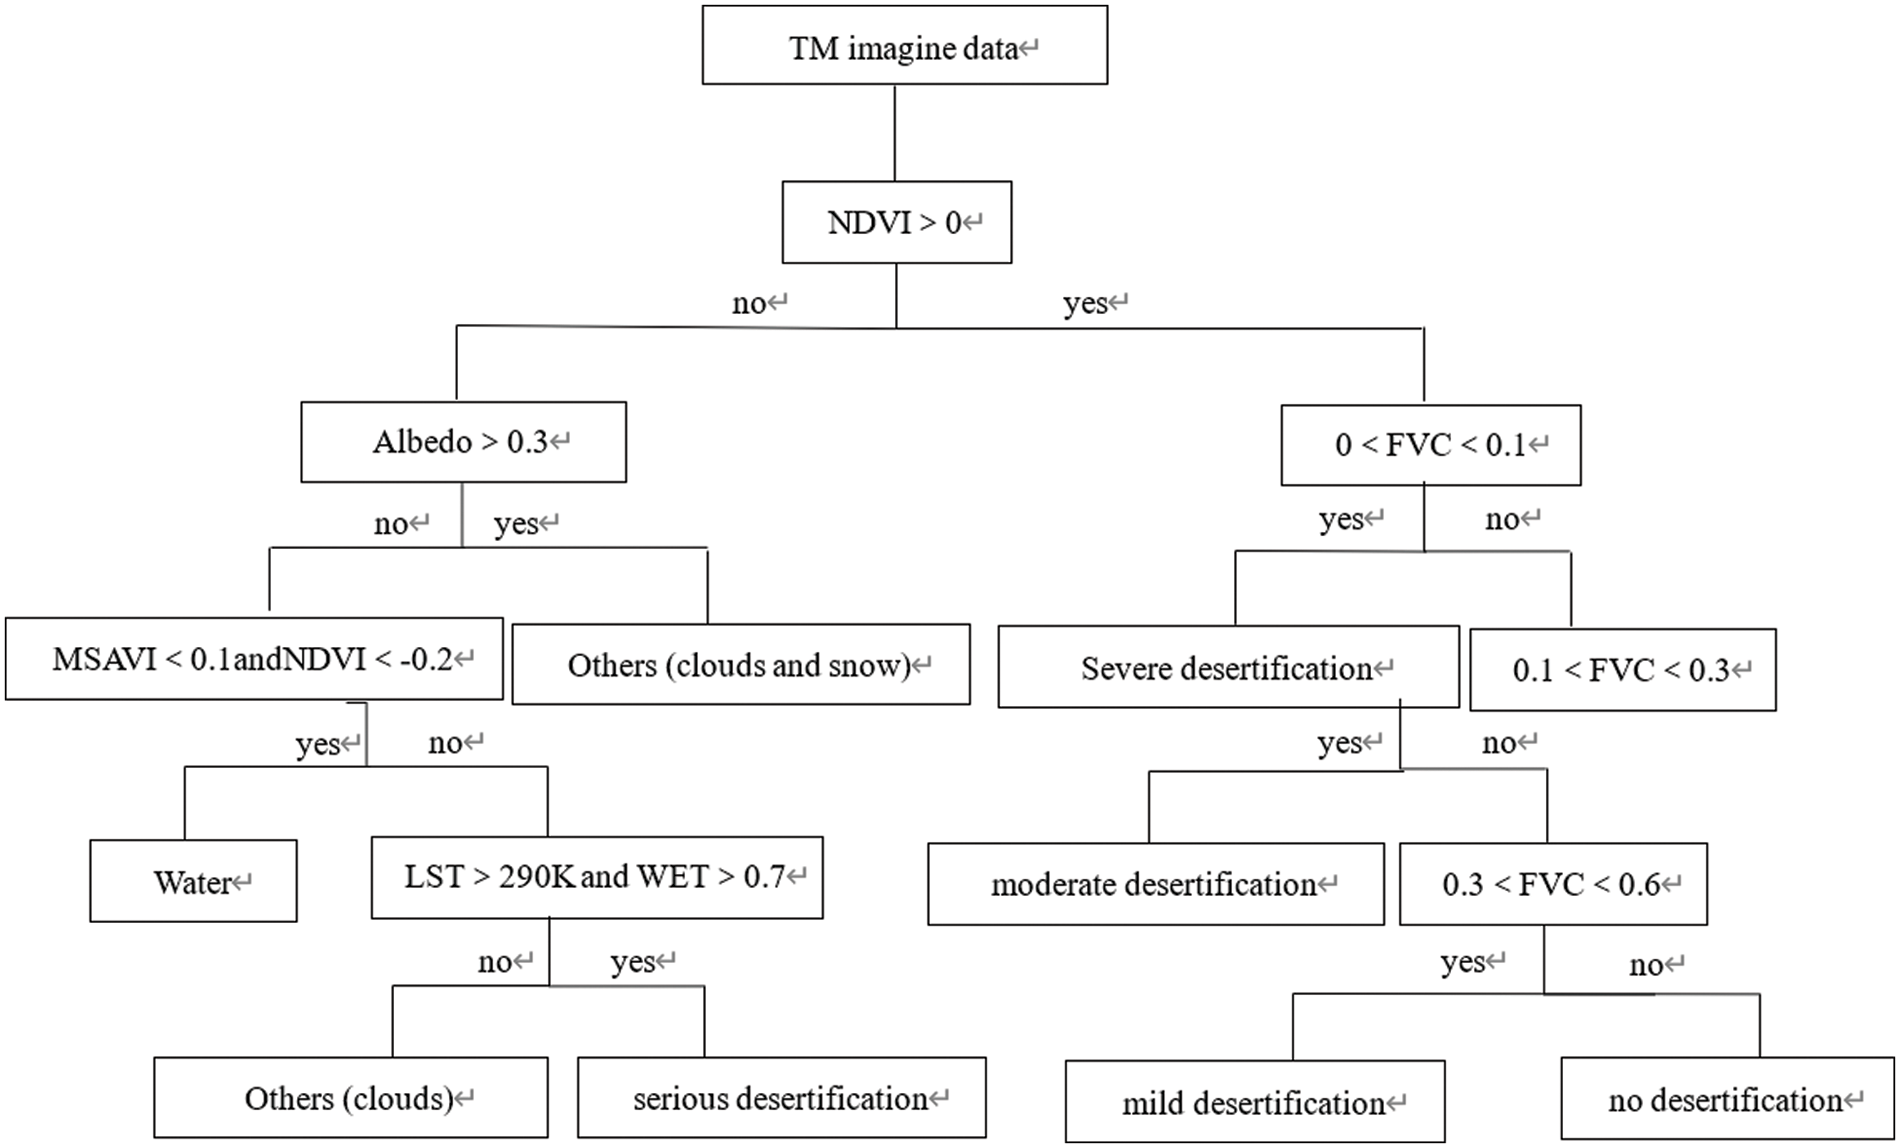
Figure 2: Decision tree classification rules
Established based on the decision tree classification system of land desertification in the study area can be divided into different levels, classification of inevitably in the salt and pepper effect, this is caused by noise classification error, the classification results are on ENVI 5.0 platform post-processing to remove salt and pepper effect to get the final results of desertification hierarchy, as shown in Fig. 3. In this study, the Error Matrix method was adopted to calculate the overall classification accuracy, Kappa coefficient, user classification accuracy, producer classification accuracy, and other indicators [22]. The overall classification accuracy of the calculated classification results was about 89%. The Kappa coefficients obtained are all greater than the minimum allowable discrimination accuracy of 0.7 [23], and the values are all above 0.8, which meet the accuracy requirements of remote sensing image classification [24–28].

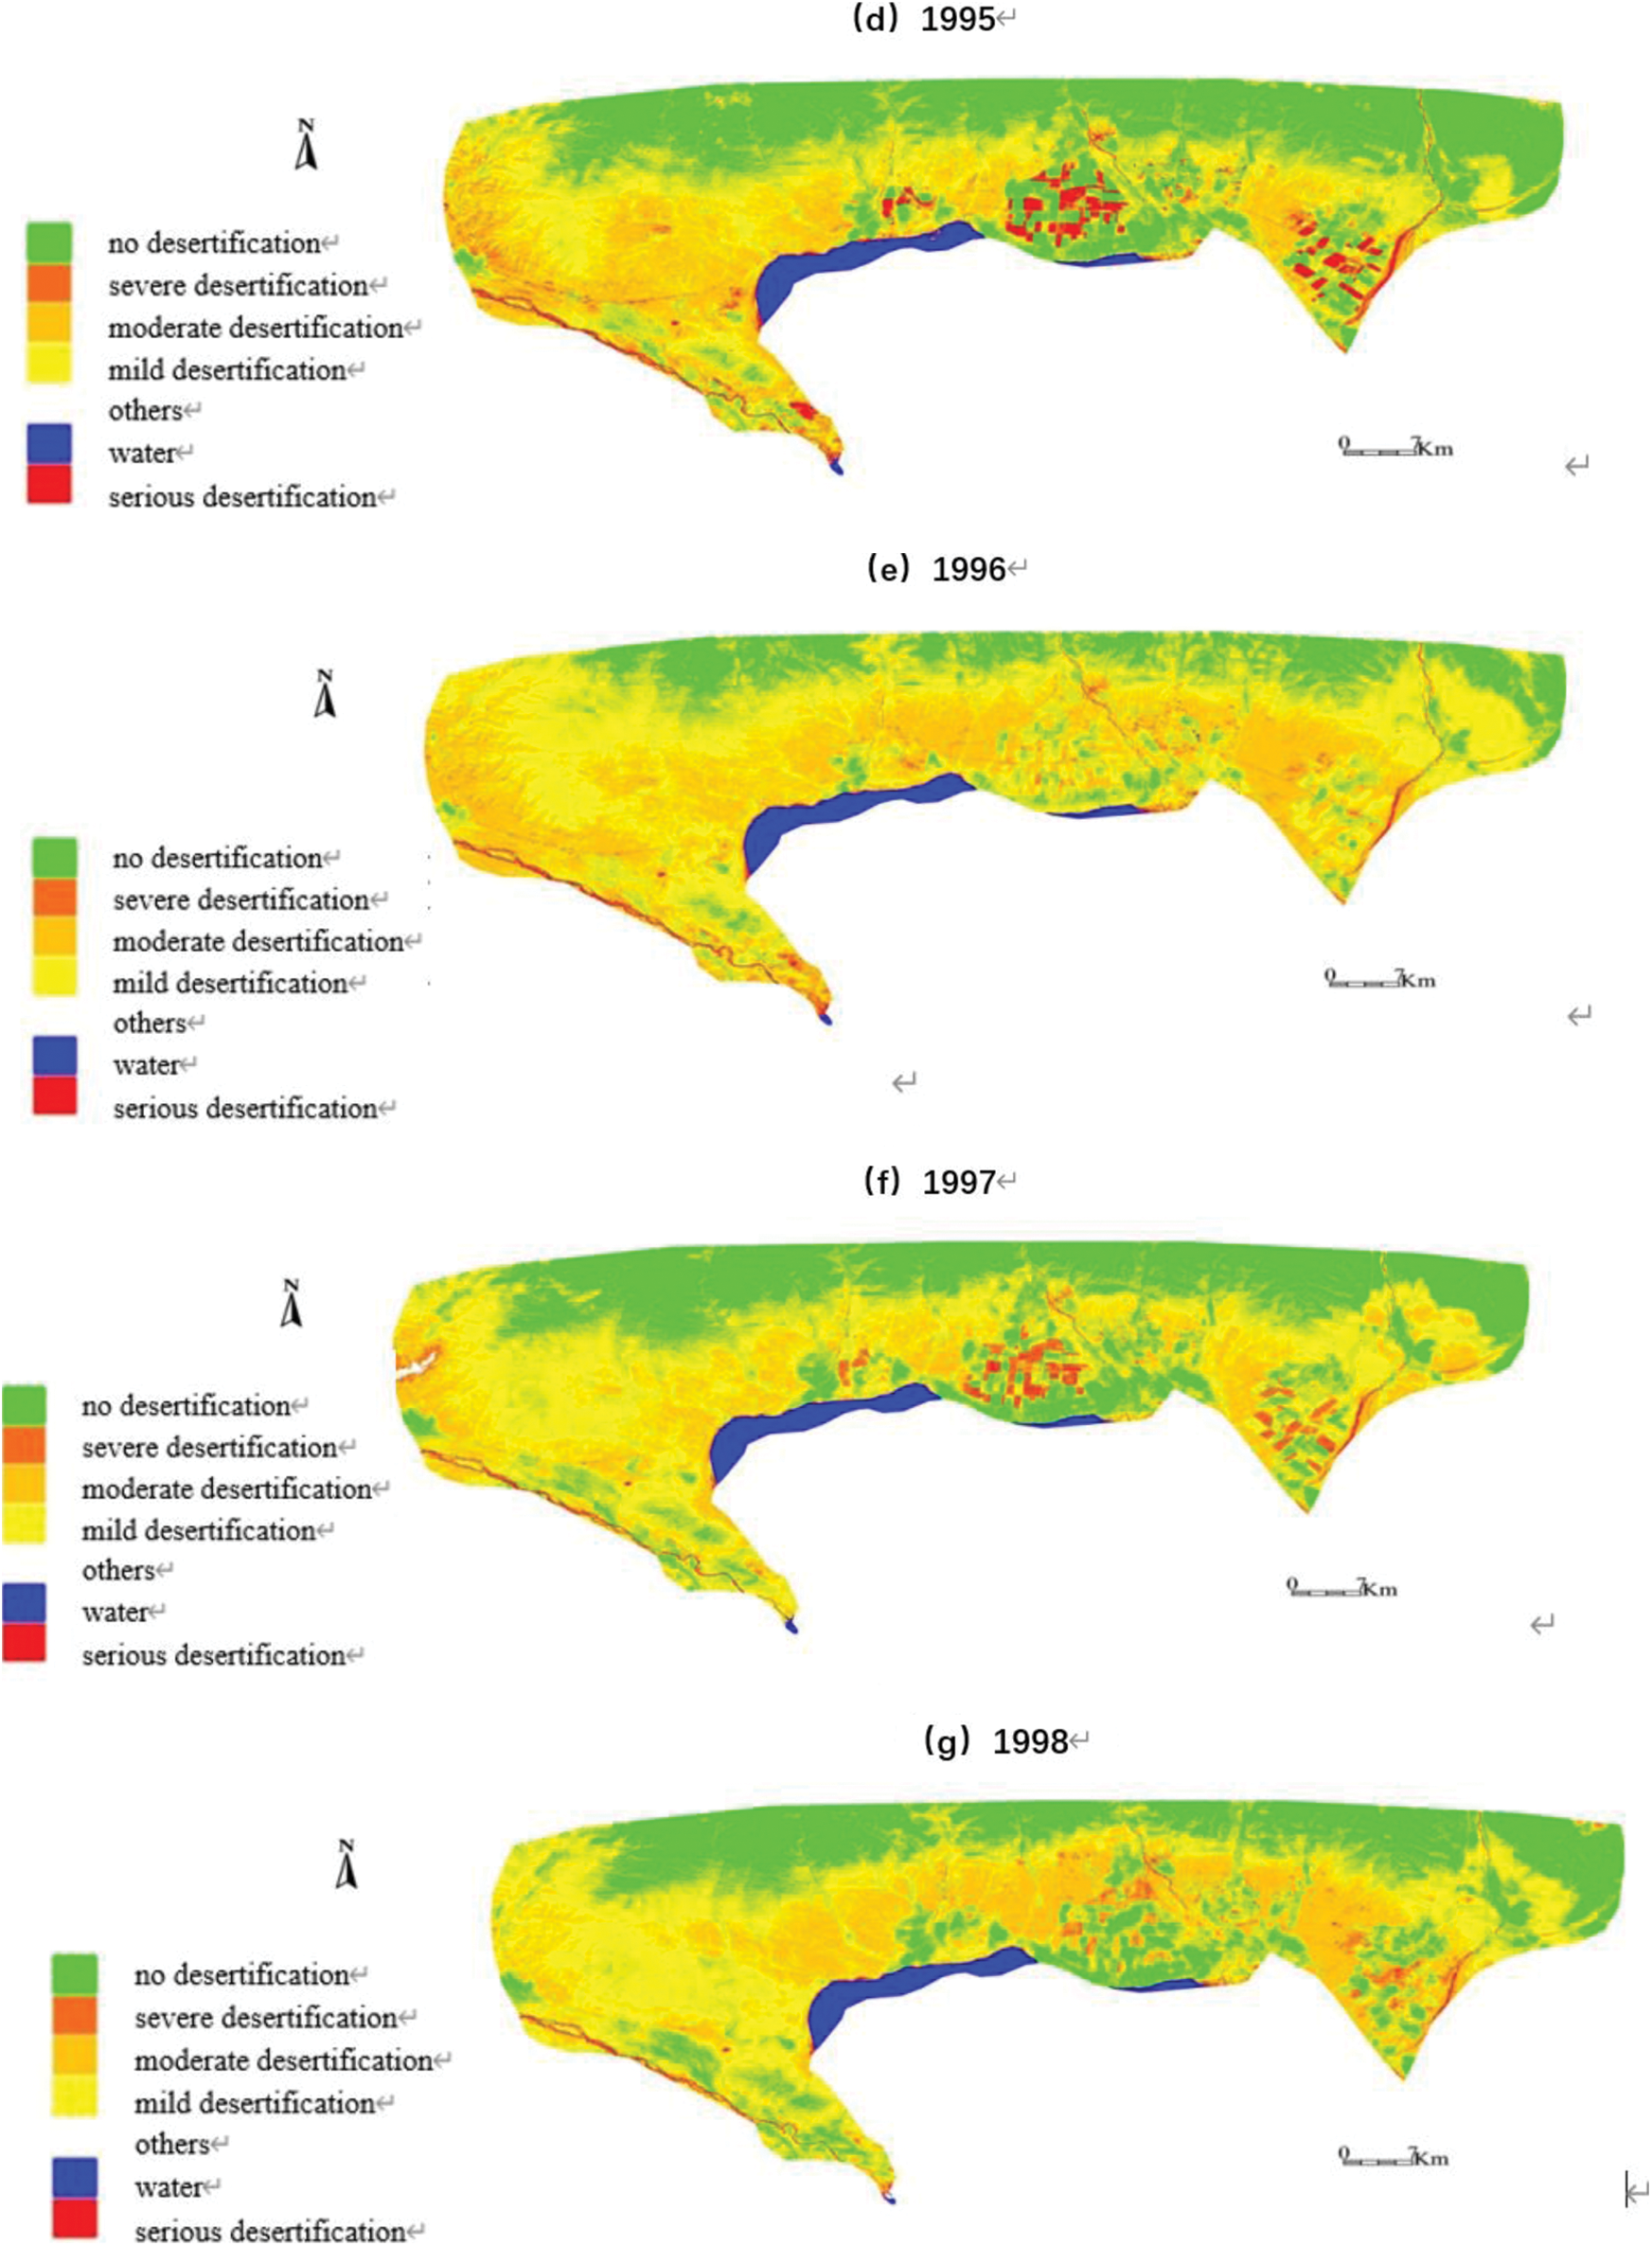


Figure 3: Land classification map of the study area in different periods
5 Change of Desertified Land In The Study Area
5.1 Interannual Variation of Desertified Land Area
Taking 1989, 2000, 2009, and 2014 as the time nodes, the research period was divided into three stages, and the area information of desertified land in different time nodes and periods was counted, respectively. The results were shown in Tab. 2. The results showed that the area of desertified land in the whole study area experienced a fluctuating trend of rapid increase and then a gradual decrease. Desertification in the study area, mild in all accounted for the largest percentage of desertified land, an average of 70%, followed by moderate desertification, and severe desertification and serious desertification, the proportion of smaller. 1989–2000 as the research area of desertification area rapid development stage, due to human factors such as grazing, grassland reclamation, desertification rapid deterioration. The total area increased from 458.73 km2 in 1989 to 1559.95 km2 in 2000, with an increase of 1101.22 km2, and the area of desertification land of different degrees showed an obvious trend of expansion, among which the increase of mild desertification area was 698.36 km2.
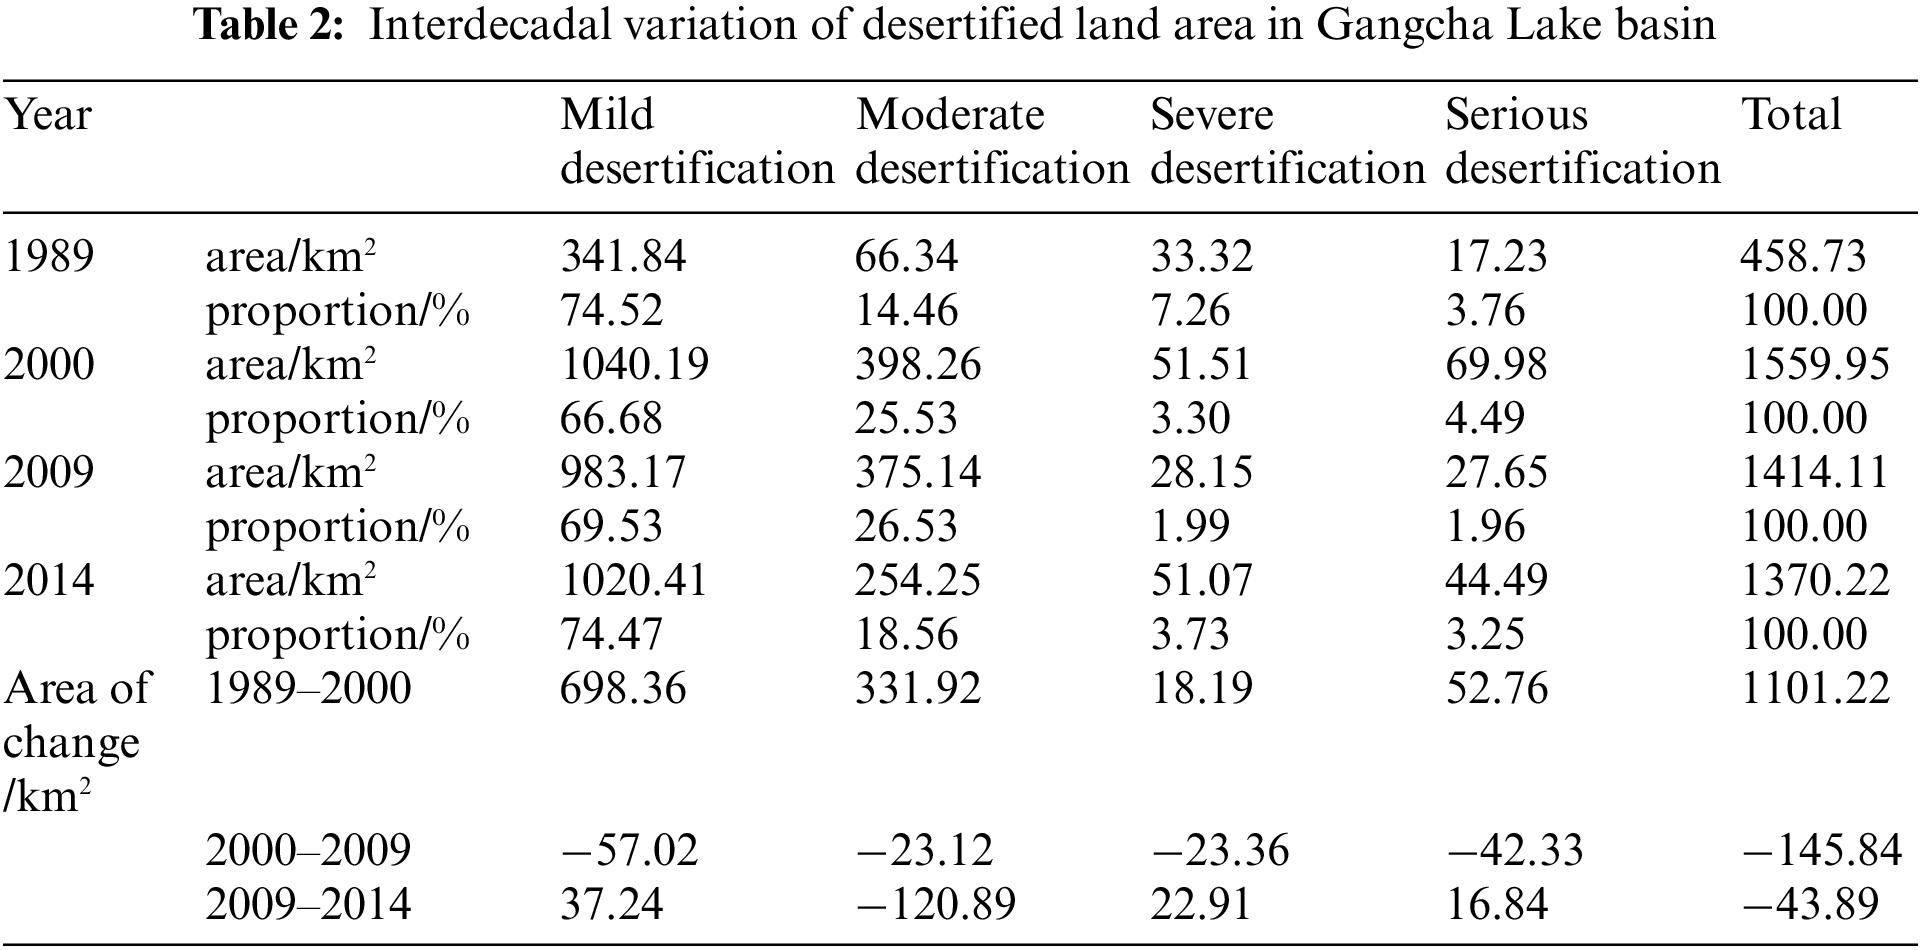
From 2000 to 2009, the total area of desertified land decreased by 145.84 km2. This may be related to the formulation of regional desertification control policies, the active implementation of desertification control measures (sand fixation and grass planting, sand sealing and grassland breeding, returning farmland to grassland, rational grazing, etc.), and the enhancement of human environmental awareness. During this period, the area of different degrees of desertified land decreased, and the area of mild desertified land decreased the most, reaching 57.02 km2. These changes show that the measures to control desertification in this period have achieved initial results.
From 2009 to 2014, the total area of desertified land in the study area was still decreasing, but the decreasing rate was significantly slower, and the total area of desertified land decreased only 43.89 km2 during this period. However, according to the area change of different degree desertified land types, the area of moderate desertified land decreased significantly during this period, but the area of other degree desertified land increased. However, the overall trend is gradually improving, indicating that the ecological environment quality of the study area has been significantly improved.
5.2 Spatial Evolution of Desertified Land
According to the transfer matrix of desertified land of different grades in three periods (Tab. 3), it can be seen that during 1989–2000, the large area of non-desertified land was gradually desertified, which was mainly transformed into mild desertified land and moderate desertified land, with an area of 903.77 km2 and 210.14 km2 respectively. Only 14.13 km2 and 29.88 km2 were converted to severe desertification, respectively. The total area of desertified land reversed to non-desertified land was 62.54 km2, which was much smaller than the total area of desertified land during this period (1157.92 km2), which indicated that the desertification situation was deteriorating in general during this period. During 1989-2000, mild desertified land was mainly degraded to moderate desertified land with an area of 165.52 km2, followed by severely desertified land with an area of 20.32 km2, and 5.80 km2 to severely desertified land. Meanwhile, the area of mildly desertified land reversed to non-desertified land was 31.79 km2. The area of moderate desertified land to severely desertified land was 10.40 km2 and 11.06 km2 respectively, and the area of moderate desertified land to mild desertified land and that of non-desertified land was 11.99 km2 and 17.26 km2 respectively. The area of severely desertified land was 8.39 km2, and that of non-desertified land was 12.73 km2. The area of mild desertified land was 5.38 km2, and that of moderate desertified land was 3.25 km2. The area of serious desertified land reversed to other land types was small.

From 2000 to 2009, the total area of non-desertified land converted to desertified land was 104.62 km2, and the total area of desertified land converted to non-desertified land was 255.95 km2, indicating that the trend of land change in this period was reverse desertification and the ecological status was getting better. The area of mild desertification land converted to moderate desertification land was 112.57 km2, which was much larger than that of severe desertification land and severe desertification land. However, the area of moderate desertification land was 139.06 km2, and the area of moderate desertification land was 139.06 km2, and the area of moderate desertification land was 139.06 km2, and the area of moderate desertification land was 139.06 km2. The area of severe desertification land was 13.72 km2 and 17.85 km2, respectively. The severe desertification land was mainly converted from moderate desertification land, accounting for 62.5% of the total converted to severe desertification land. There was a distinct improvement in serious desertification land, into the largest proportion, mild desertified land conversion area of 31.87 km2, followed by moderate desertification, 10.86 km2, into the proportion of the severe desertification and desertification land types and smaller, similar serious desertification development is mainly by moderate desertification land conversion. It was 4.37 km2, followed by severe desertification land and mild desertification land, and finally by non-desertification land, which was only 0.37 km2.
From 2009 to 2014, the area of moderately desertified land decreased by 120.89 km2, which was mainly reversed to mild desertified land (206.29 km2). Among the moderate desertified land types, mild desertified land accounted for 52%, followed by non-desertified land (35%). The area of mild desertified land was mainly reversed to non-desertified land, the area of mild desertified land was 57.69 km2, the area of severely desertified land was 9.2 km2 and the area of severely desertified land was 4.87 km2. Severely desertified land was mainly converted from non-desertified land (19.34 km2), and moderate desertified land (12.19 km2), followed by severe desertified land (6.01 km2), developed land (19.34 km2) and moderate desertified land (12.19 km2). Severely desertification land was mainly converted from moderate desertification land and severe desertification land, and the area of serious desertification land was 6.73 km2 and 6.01 km2 respectively. The non-desertified land was mainly converted to mild desertified land (127.26 km2), followed by moderate desertified land (38.80 km2), and the increase of non-desertified land was mainly caused by the reversal of mild desertified land (212.98 km2).In general, desertification showed a slight reversal trend, and the variation trend was slightly different among different degrees of desertification, and desertification intensified in some areas.
5.3 Interannual Variation of Desertified Land Area
5.3.1 Characteristics of Annual Change of Desertified Land Area
Based on the classification results of remote sensing images, desertification information in the study area from 1988 to 2014 was extracted and statistically analyzed. For incomplete data in some years, linear interpolation method was used to complete the data, as shown in Tab. 4.

As can be seen from the variation trend of the total area of desertified land in the study area (Fig. 4), the total area of desertified land increased year by year with an average change rate of 12.24 km2/y. The maximum area of desertified land was 2494.95 km2 in 2013, and the minimum area was 458.73 km2 in 1988. From 1989 to 2014, the total area of desertified land in the study area increased by 911.49 km2, but its change trend was always in a state of fluctuation. This variation is influenced by climate, geographical location, human activities, and other factors, and is also closely related to the diversity of desertification.
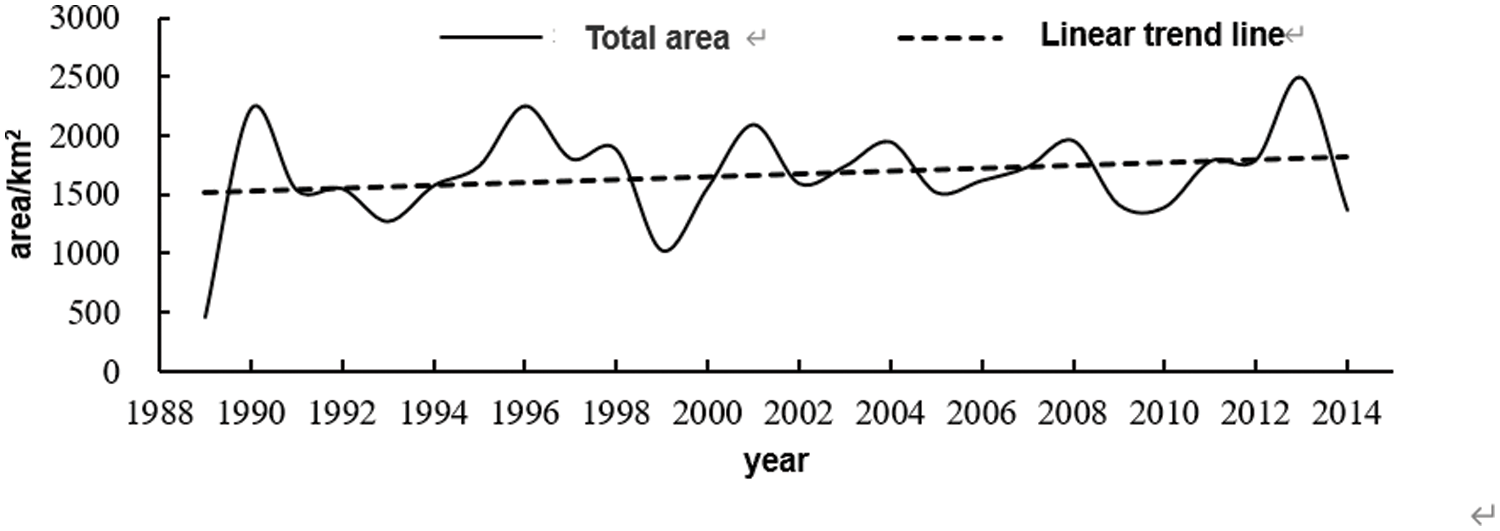
Figure 4: Change characteristics of the total area of desertified land in the study area
As can be seen from the area changes of different grades of desertified land (Fig. 5), the main types of desertified land in the study area are mild and moderate desertification, and the proportion of severe and severe desertified land is small. However, the increasing rates were different. The increasing rates of moderate desertification, severe desertification, mild desertification and severe desertification were 7.27 km2/y, 2.87 km2/y, 1.48 km2/y and 0.61 km2/y, respectively. As shown in Fig. 5a, during 1989–1990, the area of mild desertification land increased sharply, with an increase of 1208.89 km2. After 1990, the area fluctuated steadily. The area of moderately desertified land showed obvious fluctuation, as shown in Fig. 5b. In 1989, 1993, 1999, 2010 and 2014, the area of moderately desertified land was small. During 1989–2014, the area of moderately desertified land increased by 187.91 km2. The area of severely desertified land showed a steady increase on the whole, and passed the significance test of 80% confidence, as shown in Fig. 5c. The area of severely desertified land expanded rapidly in 2001, 2008 and 2013, and increased by 17.74 km2 from 1989 to 2014. The area of severely desertified land changed gently, as shown in Fig. 5d. The expansion rate in 1995 and 2001 was significant, and the area of severely desertified land increased by 27.26 km2 from 1989 to 2014. In general, the increase of desertified land area of different degrees aggravated desertification in the study area.
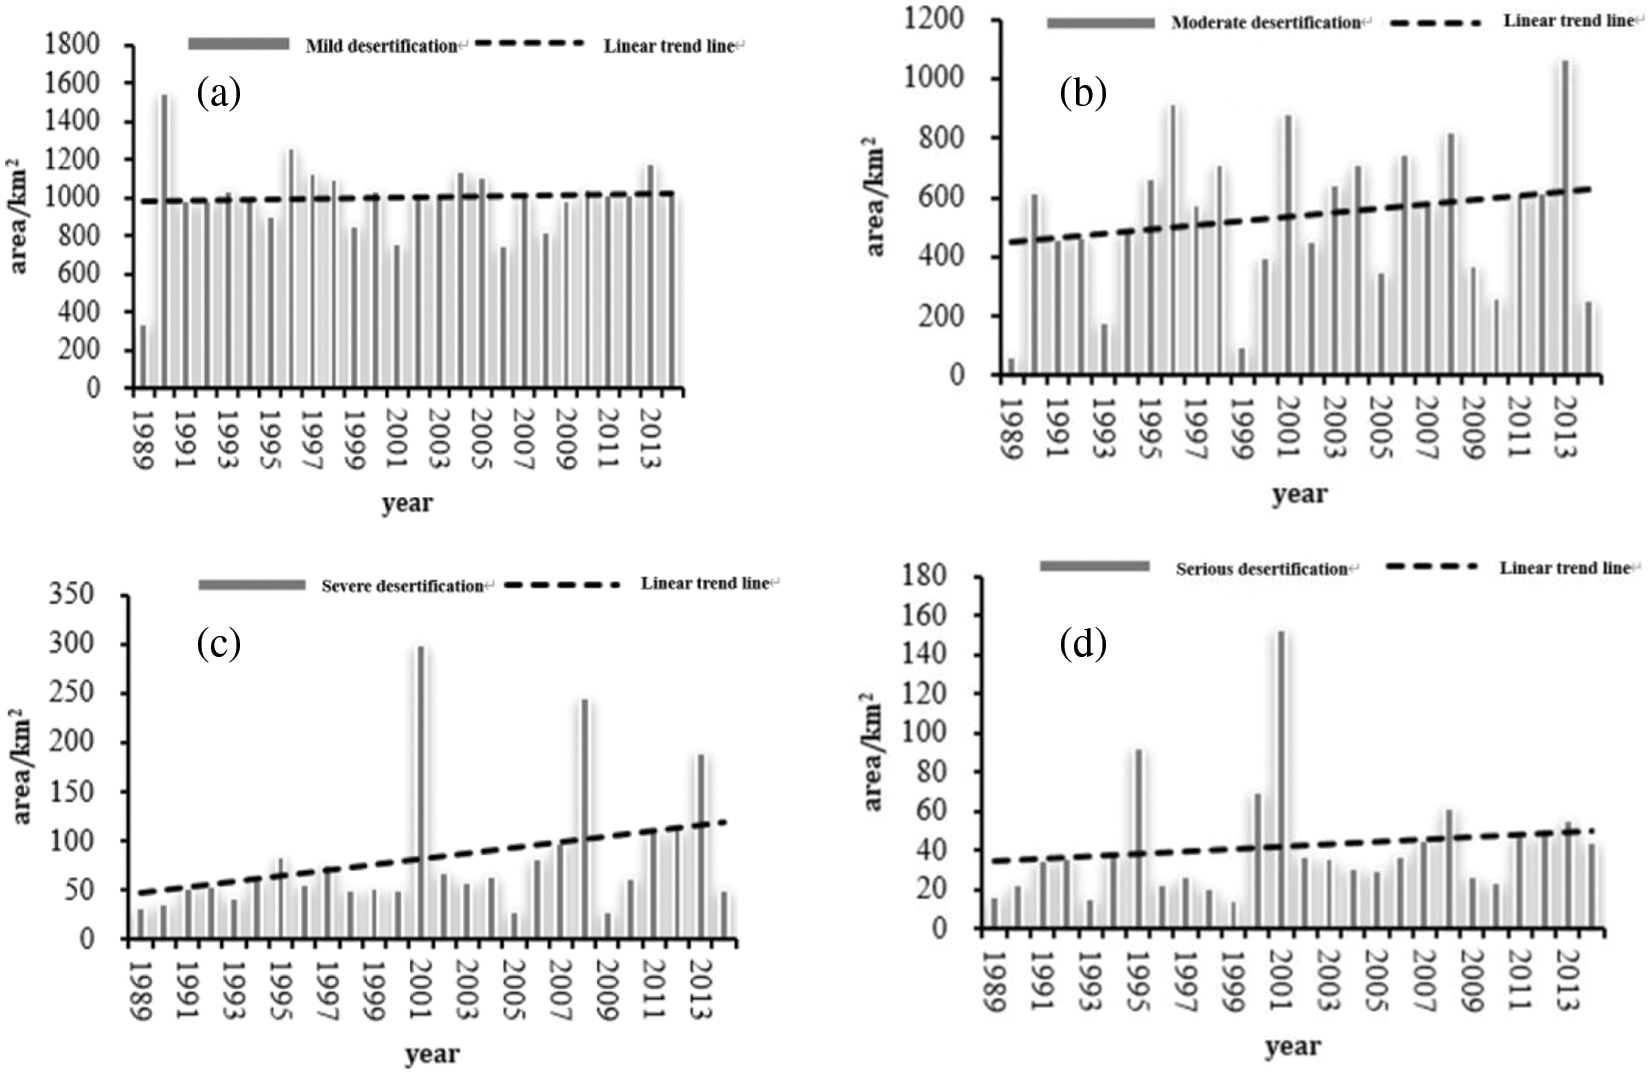
Figure 5: The interannual variation characteristics of different degrees of desertification land area in the study area: (a) Mild desertification; (b) Moderate desertification; (c) Severe desertification; (d) Serious desertification
5.3.2 Characteristics of Annual Change of Area Increment of Desertified Land
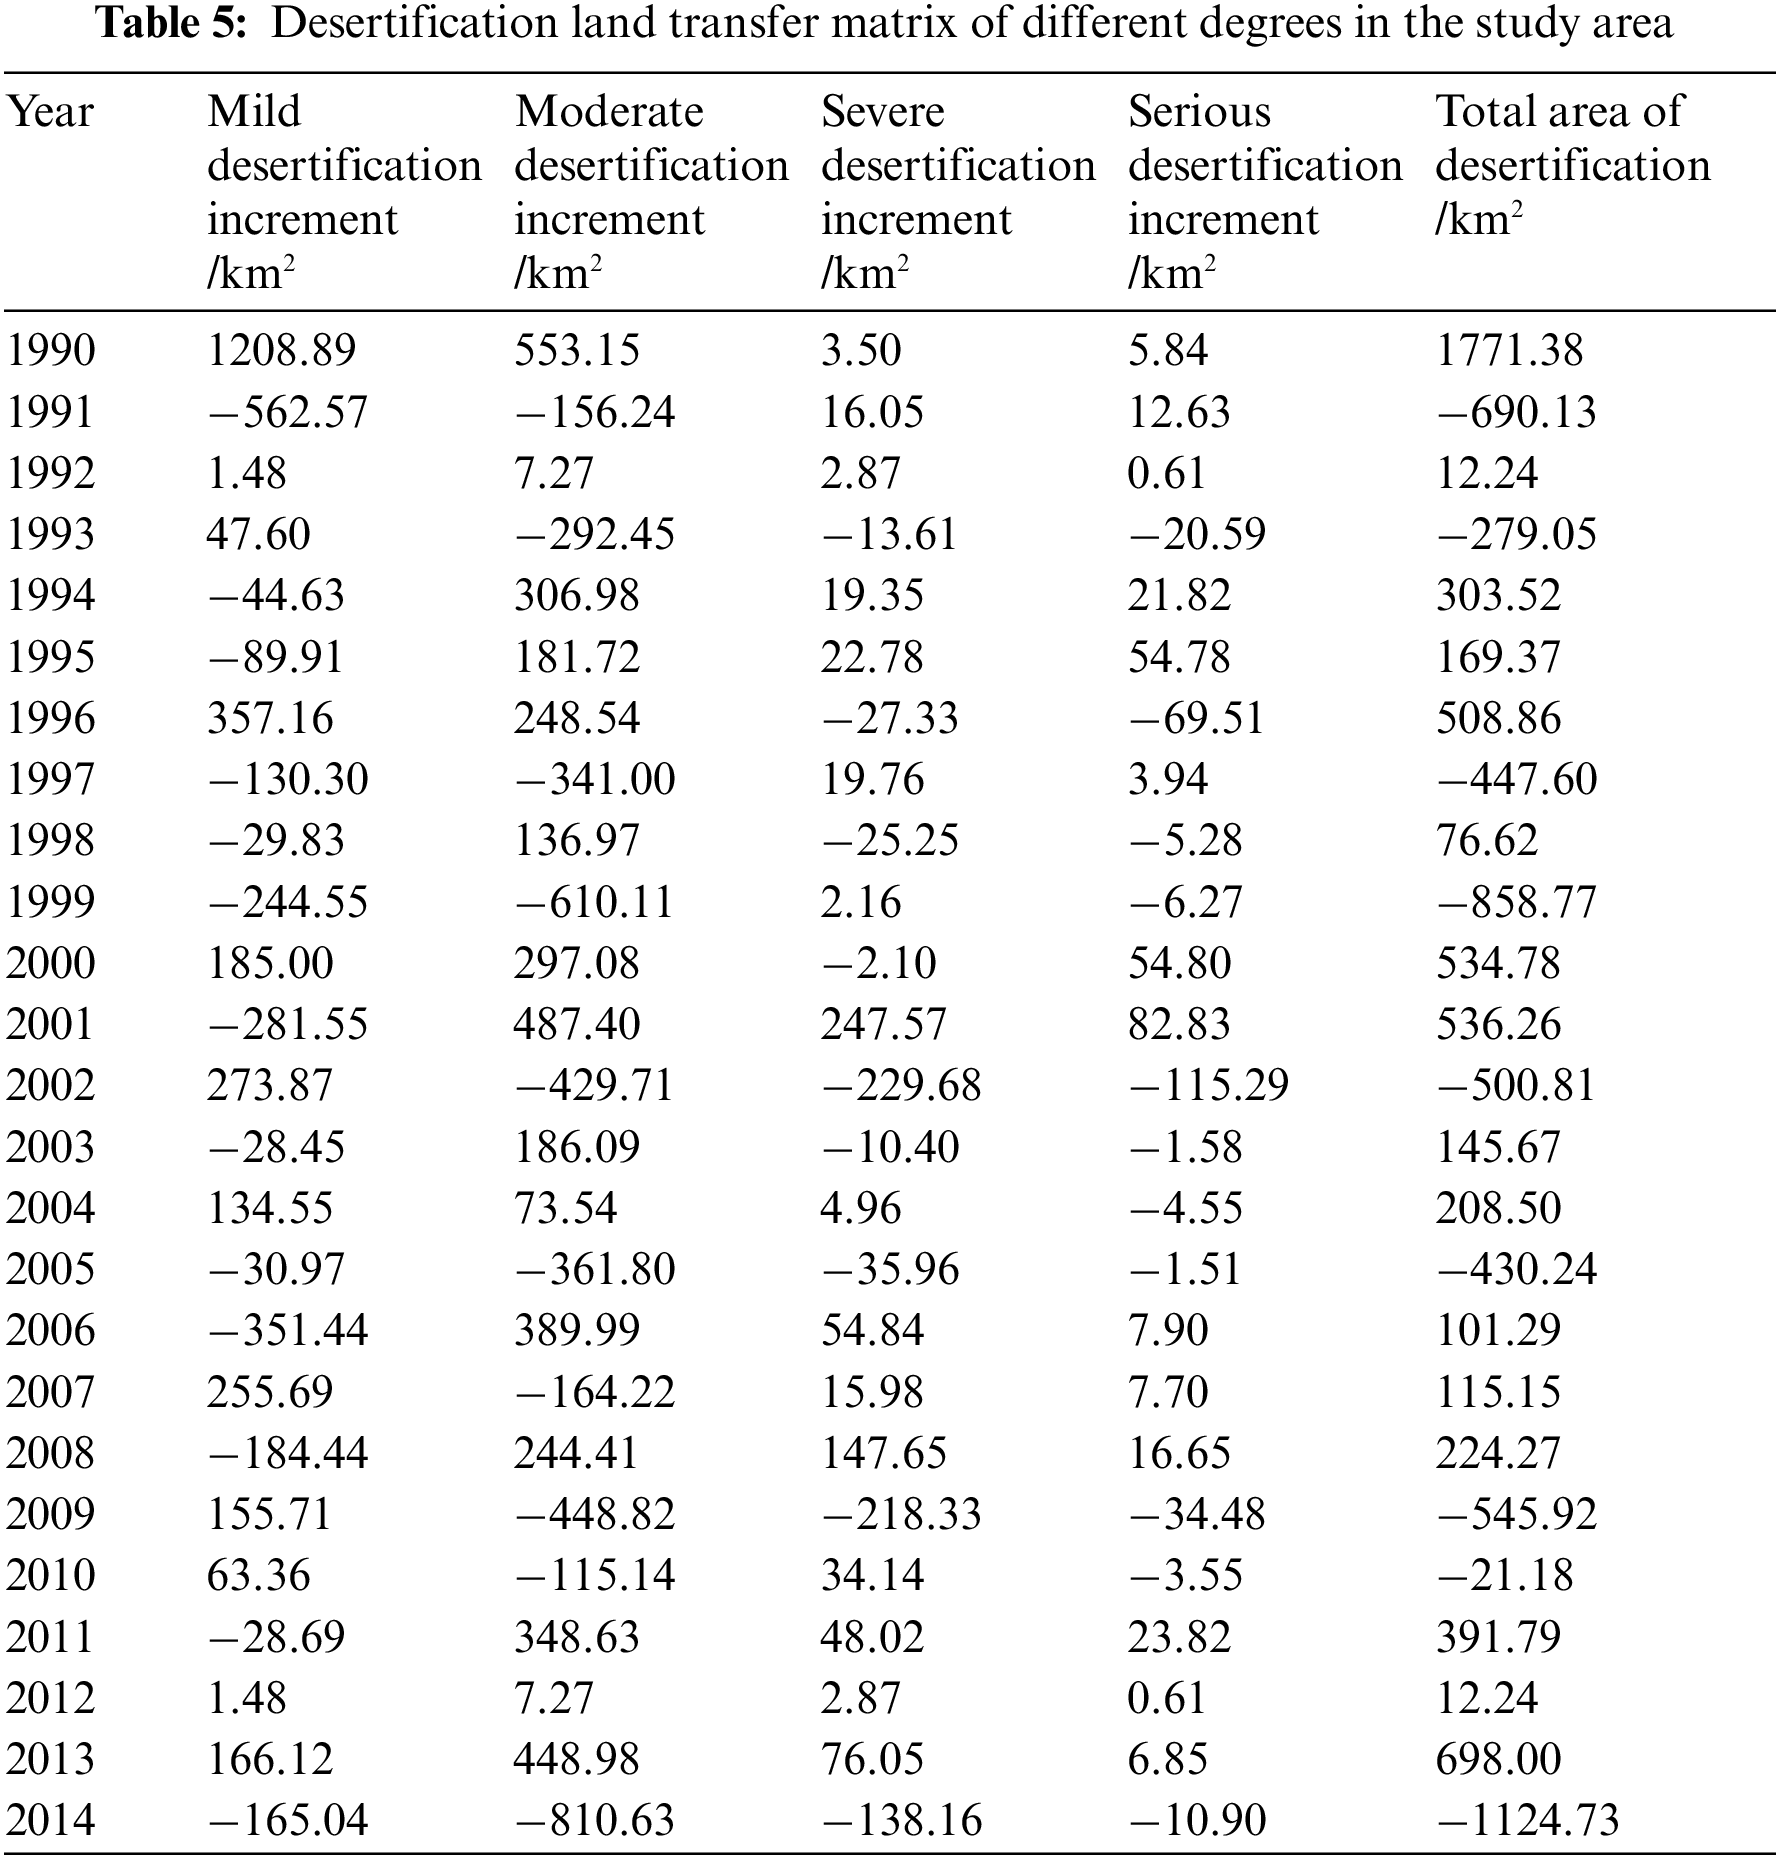
The increment of the desertified land area can well reflect the change amplitude and trend of desertified land area. The increment information of different types of desertified land area in the study area from 1990 to 2014 is shown in Tab. 5.
In general, the increment of the total area of desertification in the study area showed a decreasing trend year by year (Fig. 6) with a decreasing rate of −15.08 km2/y, while the total area of desertification in the study area showed an increasing trend, indicating that the increase rate of the total area of desertification was gradually slowing down. The increment of the total area of desertification in the study area was the largest in 1990, with an area increase value of 1771.38 km2, indicating that desertification in the study area deteriorated sharply in 1990, while the minimum increment value was −1124.73 km2 in 2014, indicating that desertification in the study area improved significantly in 2014.
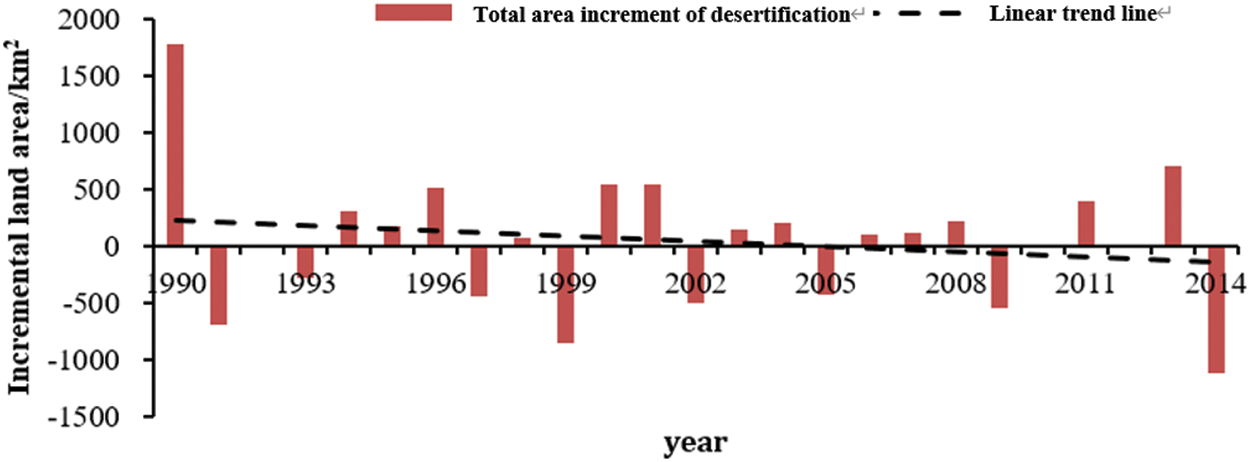
Figure 6: Interannual variation of the increment of the total area of desertification
As shown in Fig. 7, the different types of desertified land area in the study area increment all showed a trend of decrease in the time series, but decrease rate differences of different types of desertified land area, its absolute value from big to small, in the desertification of moderate desertification increment, the increment, the severe desertification increment, severe desertification increment, The change rates were −7.59 km2/y, −6.45 km2/y, −0.82 km2/y and −0.23 km2/y, respectively. The previous results showed that the area of different types of desertified land was increasing year by year, indicating that the increasing trend of different types of desertified land was gradually slowing down and desertification was improving. As shown in Fig. 7a, the maximum increment of mild desertification occurred in 1990, with an increment of 1208.89 km2, while the minimum increment occurred in 1991, with an increment of −562.57 km2.As shown in Fig. 7b, the increment of moderate desertification land area showed significant fluctuation. Desertification change increased and decreased during this period. The maximum value of moderate desertification increment appeared in 1990 with an increment of 553.15km2, while the minimum value appeared in 2014 with an increment of −810.63 km2. As shown in Fig. 7c, the change of moderate desertification increment was moderate before 2000. In 2001, the maximum value of severe desertification increment was 247.57 km2, followed by the minimum value of −229.68 km2 in 2002. After 2002, the increment change amplitude increased significantly. As shown in Fig. 7d, the maximum increment of serious desertification land area appeared in 2001, which was 82.83 km2, while the minimum increment appeared in 2002, which was −115.29 km2. In conclusion, the abrupt change points of mild and moderate desertification land area increment were located in 1990 and 2014, while the abrupt change points of severe and severe desertification land area increment were located in 2001 and 2002.
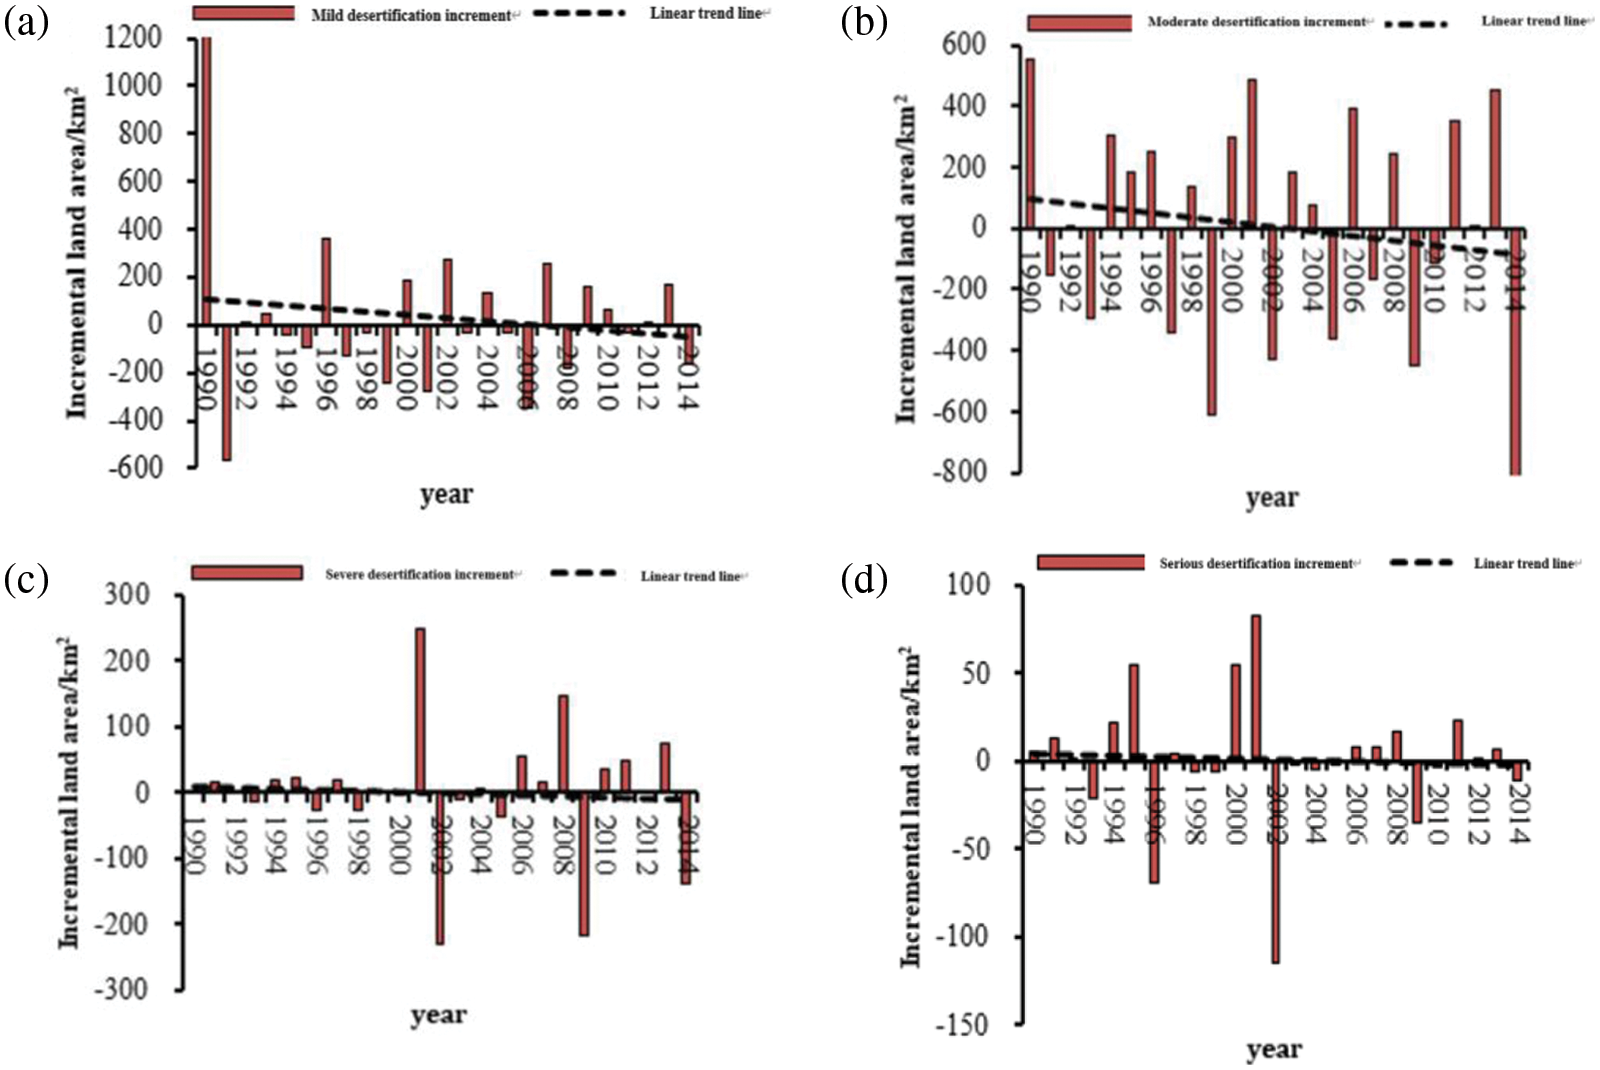
Figure 7: The interannual variation characteristics of land area increment of different desertification types in the study area :(a) mild desertification increment;(b) Moderate desertification increment;(c) Severe desertification increment;(d) Serious desertification increment
In this study, the lake basin area of Gangcha County as the study area was used to analysis the trend of desertification. The multi-phase remote sensing image of the study area was interpreted by RS technology, and the desertification land information of the study area in the past 26 years was extracted. The Desertified land in the area is divided into four grades: light desertification, moderate desertification, heavy desertification, and severe desertification by decision tree classification and statistics on the area and spatial distribution of different degrees of desertification land in the study area. The results of desertification data analysis show that since 1989, the overall desertification in the study area has experienced a fluctuating process of first deterioration and then improvement. The 1990s was the stage of rapid development of desertification in the study area. During this period, the total area of desertification increased by 1101.22 km2. The land area has shown a significant increase trend, of which the lightly desertified land has the largest increase, and the expansion area has reached 698.36 km2. Since the 21st century, the overall desertification in the study area has shown a gradual improvement trend, but local desertification is still aggravating. Through the analysis of the data of the desertified land in the study area over the years, it is found that the total area of desertification in the study area showed a significant increase from 1989 to 2014, with an increased rate of 12.24 km2/y. The area of desertification land in different degrees has an increasing trend, but the increase rate is different. Among them, the area of moderately desertified land has the largest spread rate, which is +7.27 km2/y; followed by heavily desertified land and lightly desertified land, with rates of +2.87 km2/y and 1.48 km2/y, the change rate of the severely desertified land area is the smallest, which is +0.61 km2/y. The increase in the area of different types of desertification showed a downward trend, indicating that the increase in the area of desertification in the study area was slowing down. In 1990 and 2002, the increase in desertification was generally large, and there was an obvious mutation effect.
Acknowledgement: This work was supported by the National Natural Science Foundation of China “Study on the dynamic mechanism of grassland ecosystem response to climate change in Qinghai Plateau” under grant number U20A2098.
Funding Statement: This work was supported by the National Natural Science Foundation of China “Study on the dynamic mechanism of grassland ecosystem response to climate change in Qinghai Plateau” under grant number U20A2098.
Conflicts of Interest: The authors declare that they have no conflicts of interest to report regarding the present study.
1. L. L. Lavauden, Forêts du Sahara. Paris, France, Impr. Berger-Levrault, 1927. [Google Scholar]
2. M. M. Verstraete, “Defining desertification: A review,” Climatic Change, vol. 9, no. 1–2, pp. 5–18, 1986. [Google Scholar]
3. Z. D. Zhu, S. Liu and Z. Wu, An introduction to Deserts in China. Beijing, China, Science Press, 1980. [Google Scholar]
4. N. P. Hanan, Y. Prevost and A. Diouf, “Assessment of desertification around deep wells in the Sahel using satellite imagery,” Journal of Applied Ecology, vol. 28, no. 1, pp. 173–186, 1991. [Google Scholar]
5. G. K. Tripathy, T. K. Ghosh and S. D. Shah, “Monitoring of desertification process in Karnataka state of India using multi-temporal remote sensing and ancillary information using GIS,” International Journal of Remote Sensing, vol. 17, no. 12, pp. 2243–2257, 1996. [Google Scholar]
6. B. Nasem and G. Rudi, “A satellite-based disturbance index algorithm for monitoring mitigation strategies effects on desertification change in an arid environment,” Mitigation and Adaptation Strategies for Global Change, vol. 20, no. 2, pp. 263–276, 2015. [Google Scholar]
7. W. Wu, “Methods and practice of desertification dynamic monitoring by remote sensing,” Remote Sensing Technology and Application, vol. 12, no. 4, pp. 14–20, 1997. [Google Scholar]
8. W. Wu, “Dynamic monitor to evolvement of sandy desertified Land in horqin region for the Last 5 decades, China,” Journal of Desert Research, vol. 23, no. 6, pp. 646–651, 2003. [Google Scholar]
9. H. W. Li and X. P. Yang, “Advances and problems in the understanding of desertification in the hunshandake sandy land during the last 30 years,” Advances in Earth Science, vol. 25, no. 6, pp. 647–655, 2010. [Google Scholar]
10. G. Y. Hu, Z. B. Dong and J. F. Lu, “Spatial and temporal changes of desertification land and its influence factors in source region of the yellow river from 1975 to 2005,” Journal of Desert Research, vol. 31, no. 5, pp. 1079–1086, 2011. [Google Scholar]
11. G. Y. Hu, Z. B. Dong and J. F. Lu, “Desertification and change of landscape pattern in the Source Region of Yellow River,” Acta Ecologica Sinica, vol. 31, no. 14, pp. 3872–3881, 2011. [Google Scholar]
12. Y. X. Dong, “Progresses and problems in research on sandy desertification in Qinghai-Xizang plateau,” Journal of Desert Research, vol. 19, no. 3, pp. 251–255, 1999. [Google Scholar]
13. S. Li, Y. X. Dong and G. R. Dong, “Regionalization of land desertification on Qinghai-Tebet plateau,” Journal of Desert Research, vol. 21, no. 4, pp. 418–427, 2001. [Google Scholar]
14. Y. S. Zhao, Principle and method of remote sensing application analysis. Beijing, China, Science Press, 2003. [Google Scholar]
15. S. H. Tang, “A simple method to estimate crown cover fraction and rebuild the background information,” Journal of Image and Graphics, vol. 8, no. 11, pp. 1309–1340, 2003. [Google Scholar]
16. M. M. Li, “Estimation of vegetation fraction in the upper basin of Miyun reservoir by remote sensing,” Resources Science, vol. 26, no. 4, pp. 157–164, 2004. [Google Scholar]
17. C. Leprieur, M. M. Verstraete and B. Pinty, “Evaluation of the performance of various vegetation indices to retrieve vegetation cover from AVHRR data,” Remote Sensing Review, vol. 10, no. 4, pp. 265–284, 1994. [Google Scholar]
18. C. R. Bradlev, “The influence of canopy green vegetation fraction on spectral measurements over native tall grass prairie,” Remote Sensing of Environment, vol. 81, no. 1, pp. 129–135, 2002. [Google Scholar]
19. J. G. Qi, A. R. Chehbouni and A. R. Huete, “A modified soil adjusted vegetation index,” Remote sensing of Environment, vol. 48, no. 2, pp. 119–126, 1994. [Google Scholar]
20. Z. H. Qin, “Mono-window algorithm for retrieving land surface temperature from landsat TM6 data,” Acta Geographica Sinica, vol. 56, no. 4, pp. 456–466, 2001. [Google Scholar]
21. I. Sandholt, K. Rasmussen and J. Andersen, “A simple interpretation of the surface temperature/vegetation index space for assessment of surface moisture status,” Remote Sensing of Environment, vol. 79, no. 2-3, pp. 213–224, 2002. [Google Scholar]
22. M. Story and R. G. Congalton, “Accuracy assessment: A user’s perspective,” Photogrammetric Engineering & Remote Sensing, vol. 48, no. 1, pp. 131–137, 1986. [Google Scholar]
23. I. F. J. Lucas and J. M. Fransand, “Accuracy assessment of satellite derived land-cover data: A review,” Photogrammetric Engineering & Remote Sensing, vol. 60, no. 4, pp. 410–432, 1994. [Google Scholar]
24. Q. He, S. Yu, H. Xu, J. Liu, D. Huang et al., “A weighted threshold secret sharing scheme for remote sensing images based on chinese remainder theorem,” Computers Materials & Continua, vol. 58, no. 2, pp. 349–361, 2019. [Google Scholar]
25. C. Srinivas and K. C. Rao, “Adaptive signal enhancement unit for eeg analysis in remote patient care monitoring systems,” Computers Materials & Continua, vol. 67, no. 2, pp. 1801–1817, 2021. [Google Scholar]
26. M. M. Alshahrani, “Secure multifactor remote access user authentication framework for iot networks,” Computers Materials & Continua, vol. 68, no. 3, pp. 3235–3254, 2021. [Google Scholar]
27. W. Sung and S. Hsiao, “Rfid positioning and physiological signals for remote medical care,” Computer Systems Science and Engineering, vol. 41, no. 1, pp. 289–304, 2022. [Google Scholar]
28. H. Kwon, S. Hong, M. Kang and J. Seo, “Data traffic reduction with compressed sensing in an aiot system,” Computers Materials & Continua, vol. 70, no. 1, pp. 1769–1780, 2022. [Google Scholar]
 | This work is licensed under a Creative Commons Attribution 4.0 International License, which permits unrestricted use, distribution, and reproduction in any medium, provided the original work is properly cited. |