DOI:10.32604/cmc.2022.027856
| Computers, Materials & Continua DOI:10.32604/cmc.2022.027856 | |
| Article |
EEG Emotion Recognition Using an Attention Mechanism Based on an Optimized Hybrid Model
1Brain Cognitive Computing Lab, School of Information Engineering, Minzu University of China, Beijing, 100081, China
2Case Western Reserve University, USA
*Corresponding Author: Huiping Jiang. Email: jianghp@muc.edu.cn
Received: 28 January 2022; Accepted: 19 April 2022
Abstract: Emotions serve various functions. The traditional emotion recognition methods are based primarily on readily accessible facial expressions, gestures, and voice signals. However, it is often challenging to ensure that these non-physical signals are valid and reliable in practical applications. Electroencephalogram (EEG) signals are more successful than other signal recognition methods in recognizing these characteristics in real-time since they are difficult to camouflage. Although EEG signals are commonly used in current emotional recognition research, the accuracy is low when using traditional methods. Therefore, this study presented an optimized hybrid pattern with an attention mechanism (FFT_CLA) for EEG emotional recognition. First, the EEG signal was processed via the fast fourier transform (FFT), after which the convolutional neural network (CNN), long short-term memory (LSTM), and CNN-LSTM-attention (CLA) methods were used to extract and classify the EEG features. Finally, the experiments compared and analyzed the recognition results obtained via three DEAP dataset models, namely FFT_CNN, FFT_LSTM, and FFT_CLA. The final experimental results indicated that the recognition rates of the FFT_CNN, FFT_LSTM, and FFT_CLA models within the DEAP dataset were 87.39%, 88.30%, and 92.38%, respectively. The FFT_CLA model improved the accuracy of EEG emotion recognition and used the attention mechanism to address the often-ignored importance of different channels and samples when extracting EEG features.
Keywords: Emotion recognition; EEG signal; optimized hybrid model; attention mechanism
Emotional recognition is essential in daily life and plays a vital role in human-computer interaction, medical care, and other areas [1]. Physiological signals can generally be used to measure emotional conditions via galvanic skin responses, electromyography, heart rate, respiratory rate, and electroencephalograms (EEG). The EEG signal is a typical physiological signal, which involves the overall response of the electrical activity of the cerebral cortex nerve cells or scalp surface and contains a large amount of physiological and pathological information. Since these signals are non-invasive, quick, and inexpensive, they are widely used for emotional recognition [1,2].
Emotional recognition using EEG signals represents a significant research area in emotional computing. The feature extraction and classification of EEG signals form the basis of emotional recognition. As shown in Fig. 1, the feature extraction of traditional EEG signals mainly involves time-domain features, frequency domain features, time-frequency domain features, nonlinear dynamic analysis, and spatial domain features [3]. This article uses EEG functionality as a frequency-time domain feature. On the one hand, it refers to the work involving EEG feature processing in our previous paper. On the other hand, the results have confirmed that using this method for processing simplifies the subsequent experiments and improves the accuracy of the model.

Figure 1: Classification of the EEG features
Deep learning methods are used to classify EEG signals according to their extracted characteristics [3,4]. On the one hand, the deep learning method can be considered a classifier after feature extraction [5]. For example, Zheng et al. extracted differential entropy (DE) features from multi-channel EEG signals using a deep belief network (DBN) as a classifier [6]. Wang et al. used DE functions as input data with a comprehensive dynamic graph learning system as classifiers [7]. On the other hand, many deep learning methods are data-driven and work end-to-end without first extracting the functionality of the EEG signal. For example, Cho et al. proposed a novel method for recognizing emotions using three-dimensional convolutional neural networks (3D CNNs), efficiently representing the spatiotemporal attributes of EEG signals [8]. Liu et al. proposed an effective multi-level features guided capsule network (MLF-Caps Net) for EEG emotion recognition and achieved good performance [9]. However, EEG emotional recognition remains challenging. Therefore, this paper examines these two aspects from a global perspective and considers a hybrid model to extract and classify EEG signals.
First, FFT technology is used to process the EEG time-frequency characteristics, after which a CNN is used to extract the spatial features of the processed data for classification. LSTM is employed to extract and classify the time features of the processed data. Finally, inspired by the cascading recurring convolutional network, this paper combines the CNN and LSTM models to extract the spatial and temporal characteristics of the EEG signals. Furthermore, a channel attention mechanism to address the often-ignored importance of different channels due to the use of CNN to extract spatial characteristics [10,11]. A self-attention mechanism is used to approach the importance of samples when using LSTM to extract temporal features [12].
This article uses the DEAP [13] public dataset to evaluate the model and compare the recognition accuracy of multiple methods. The main contributions of this paper are summarized below.
1) For EEG emotion recognition, this work proposes and compares three model frameworks, namely FFT_CNN, FFT_LSTM, and an optimized hybrid model with an attention mechanism (FFT_CLA). The rationale and feasibility of these three EEG emotional recognition frameworks are verified.
2) Experiments are performed in the DEAP dataset for these three models. The average recognition accuracy of FFT_CNN, FFT_LSTM, and FFT_CLA is 88.01%, 88.85%, and 92.38%, respectively. These results indicate little difference between the recognition accuracy of the FFT_CNN and FFT_LSTM models, while that of the FFT_CLA model is significantly higher than the other models.
The remainder of this paper is arranged in the following sections: Section 2 introduces related work; Section 3 introduces the proposed method; Section 4 validates the proposed method. Finally, a summary is provided in Section 5.
2.1 EEG Emotion Recognition Steps
As shown in Fig. 2, emotion recognition based on EEG mainly includes the following steps.
1) Develop a test plan. The type of stimulus file is selected, such as music or a movie, followed by the data to be recorded, such as the gender, the number of subjects, the duration of the experiment [14], and the emotion to be recognized.
2) EEG signal acquisition. The number of electrodes and the test time are recorded, and the EEG signals recorded on the electrodes are collected [15]. Finally, the emotional state of the subject can be evaluated based on the collected EEG signals.
3) EEG signal preprocessing. A large number of artifact signals (such as oculograms and electromyography) increase the difficulty of EEG signal analysis, making it challenging to intuitively analyze the inner connection with emotions [16]. To facilitate follow-up research, specific preprocessing is performed on the collected signals, such as blind source separation and independent component analysis to obtain a specific regular signal.
4) EEG signal feature extraction. The relevant information is examined to extract the relevant emotional features from the EEG signals, such as EEG features in the time domain, frequency domain, and spatial domain [16,17].
5) Emotional classification of the EEG signals. The EEG signals are classified according to the extracted features [18]. The main classifiers are Bayes, support vector machines, decision trees, and deep learning classifiers.

Figure 2: EEG emotion recognition steps
2.2 Fast Fourier Transform (FFT)
Fourier Transform is essential in signal processing and represents the primary method for analyzing time-frequency [19]. However, since discrete-time Fourier transform is highly complex, this paper uses FFT for EEG processing, which combines the initial sequence of the N sampling points into short sequences [20]. Due to the periodicity and symmetry of the exponential factor in the calculation formula of the discrete Fourier transform (DFT), FFT first obtains the corresponding DFT of these short sequences and then combines them appropriately. Therefore, the goal of structural optimization is acquired by reducing the number of repeated calculations and multiplication calculations.
Attention is vital in human perception. For example, humans can selectively focus on salient parts to better capture visual structure [21]. Consequently, attention mechanisms, such as channel attention and self-attention, have been proposed for various deep learning tasks.
The basic idea of channel attention is to allow the neural network to automatically determine the importance of the channel and then assign appropriate weights [22]. A typical representative is the Squeeze-and-Excitation Network (SENet) architecture [23]. The channel attention mechanism can selectively enhance the features with the most significant amount of information via the network, allowing the post-processing process to fully utilize these features and suppress useless features to reduce noise. During EEG recognition tasks, many methods ignore the importance of EEG channels. This paper uses the channel attention mechanism to further explore the spatial dependence between EEG channels [24].
Self-attention is an internal attention mechanism that associates different positions of a single sequence to encode sequence data based on importance scores [25]. The self-attention mechanism performs well in answering simple language questions and completing language modeling tasks. An EEG experiment is usually divided into several input specimens to increase the number of training samples during an EEG recognition task. However, many methods ignore the importance of different EEG samples [26]. This work uses the self-attention mechanism to further explore the time dependence between EEG samples.
This section presents the application of the EEG feature processing method (FFT) in this experiment and provides a brief introduction to the proposed FFT_CNN and FFT_LSTM model framework. Finally, the proposed FFT_CLA model is introduced in detail. FFT is typically used to rapidly calculate the DFT of a sequence or its inverse transform [27]. Fourier analysis converts the signal from the original domain (usually time or space) to a representation in the frequency domain or vice versa [28]. Therefore, it can reduce the complexity of calculating the DFT from only
After FFT, the EEG data was processed in a vector form with the same dimensions, which was expected to require further processing. The FFT_CNN model was obtained by entering the subsequent vector into a defined CNN, as shown in Fig. 3.

Figure 3: FFT_CNN model
The EEG signal was processed via FTT, followed by convolution and pooling. The processed vector was fully connected (FC), after which the softmax function was used to classify and output the feature vector classification results. The FFT_LSTM model was acquired by entering the obtained features into the LSTM architecture, as shown in Fig. 4.

Figure 4: FFT_LSTM model
The EEG signal was processed using FFT and sent to the LSTM unit. The softmax function was used for the feature classification and result output of the processed FC vector.
The softmax function transformed the importance of the channel into a probability distribution
Here,
For the FFT_CLA model, first, the FFT processed data were entered into the channel attention mechanism model, after which the spatial information of the EEG signal was further extracted using a CNN. The processed CNN data were entered into the LSTM architecture to further extract the time features of the EEG signal [31]. Finally, the data processed via the LSTM was entered into a self-attention mechanism model to obtain the FFT_CLA model, as shown in Fig. 5.

Figure 5: FFT_CLA model
The EEG signal was processed via FFT, and the data was sent to the channel attention network, CNN network, LSTM network, and self-attention network, respectively. Then, the softmax function was used for feature vector classification and output.
The data were subjected to global average pooling (GAP) in the channel attention network. The processed vector was then sent to the FC layer and processed using the dimensional reduction function r and the activation function tanh. Next, the vector dimensions were adjusted, and the vector was multiplied.
The intrinsic similarity of the EEG samples in the self-attention network was calculated using the
Here, it was assumed that the hidden state obtained via the LSTM structure was
Expressed in the corresponding vector form:
Here, a represents a correlation operator, such as common dot multiplication or weighted dot multiplication. The softmax function was used to standardize
The expanded form is:
Using
From this, the next hidden state
As well as the output at that location:
where
Here,
In summary, three frameworks were designed to retrieve the characteristics of raw EEG signals and classify emotions. The first involves FFT processing, after which the processed vector was sent to the CNN to complete the emotional classification. The second involved sending the vector to the LSTM network after FFT processing. After FFT processing, the third adopted the channel attention mechanism to adaptively affect the weights of the various channels to extract the internal channel information, after which a CNN was used to extract the spatial data from the coded EEG signal. Next, an LSTM was employed to explore the time information of different EEG samples and while an extended self-attention mechanism was integrated to assign weights to the EEG samples according to their importance. Finally, the spatiotemporal attention features were obtained for EEG emotional recognition.
The experiments were conducted using the DEAP data set to evaluate the performance of the three models. EEG data were collected from 32 healthy participants (16 males and 16 females). The participants were physically and mentally healthy, and the EEG signals were collected via a 32-lead electrode cap according to the international lead standard, “10–20”. EEG signals of the participants were collected at a sampling rate of 512 Hz while they viewed 40 1-min videos. This comprised 32 EEG and 16 additional channels, including common eye power and electrocardiogram (ECG) signals [34]. The participants were asked to evaluate the valence, excitement, and dominance of the videos according to a size ratio of 1 to 9 after viewing.
The frequency was decreased to 128 Hz during sampling, and 40 data channels were selected, including 32 EEG channels, while the bandpass was filtered to 4–45 Hz. Each data sample lasted for 63 s, which included a 3-s baseline time [34,35]. The experimental data generally included preprocessing information (downsampling, removal of noise such as ocular electricity) that could be downloaded from the official website. The experimental data comprised 32 files, each corresponding to 32 experimental subjects, consisting of two arrays. The data format of these files is shown in Tab. 1.

Here we first use Fast Fourier Transform (FFT) to process the DEAP data set, that is, first use the mother wavelet function to stretch and shift the EEG signal, and then obtain a series of wavelet coefficients. The specific parameter settings of FFT are shown in Tab. 2.
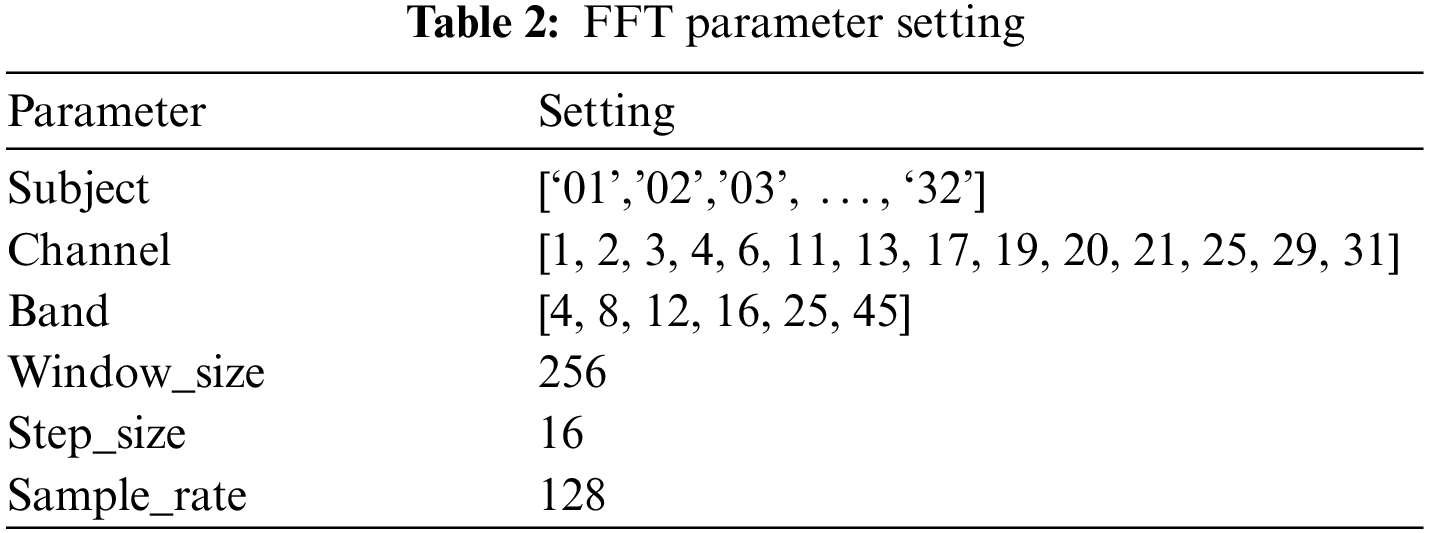
The 14 selected channels included 1: AF3, 2: F3, 3: F7, 4: FC5, 7: T7, 11: P7, 13: O1, 17: AF4, 19: F4, 20: F8, 21: FC6, 25: T8, 29: P8, and 31: O2. FFT decomposed the EEG signal into different frequency bands in the following range: theta band: 4–8; alpha band: 8–12; low beta band: 12–16; high beta band: 16–25; gamma band: 25–45. The Window_size was set to 256, representing an average frequency band power of about 2 s. The Step_size was set to 16, which was updated approximately every 0.125 s. The Sample_rate was set to 128, representing a sampling rate of 128 Hz.
The parameters during FFT processing were the same to compare the rationality of the three experiments. Then, 10-fold cross-validation was used to evaluate the performance of the proposed and baseline methods, the average of which was considered the final experimental result. The next section discusses the experimental process and results of the three experiments.
4.3 FFT_CNN Model Experimental Results
After FFT processing, a CNN was used for function extraction and classification. During the experiment, the Adam algorithm was used to optimize the parameters. The Adam algorithm is an adaptive time estimation algorithm to calculate the adaptive learning speed of each parameter. The Adam algorithm can accelerate network convergence in practical applications, providing excellent experimental results. After several experiments, a three-layer convolution structure was employed at a batch size of 256, using the dropout layer to prevent overfitting. The parameter value was set to 0.2 while the training epochs were set to 200 to ultimately obtain an average classification accuracy rate of 87.79%. The convergence curve of the model is illustrated in Fig. 6.

Figure 6: The accuracy convergence curve of the FFT_CNN model
During the training process, the precision and loss rate of the model were calculated at each step. The loss function represented the cross-entropy loss function, while the model parameters were adjusted to reduce the loss rate and improve accuracy. After 200 epochs, the model tended to converge, completing the model training. Fig. 7 shows the confusion matrix of this experiment, which was used to better evaluate the quality of the model.

Figure 7: The FFT_CNN model confusion matrix
The confusion matrix was used to display the actual and predicted conditions of each sample. It reflected the portion that corresponded to the actual and predicted values, as well as the portion not corresponding to the predicted value. As shown in Fig. 7, the confusion matrix determined whether the actual situation of each category was consistent with the predicted situation while reflecting the specific values of the corresponding and predicted portions. These values were used to analyze possible problems in the model and make appropriate adjustments.
4.4 FFT_LSTM Model Experiment Results
After FFT processing, the LSTM was used for function extraction and classification. The Adam algorithm was employed to optimize the settings during the experiment. After several experiments, the batch size was set to 256, using the dropout layer to prevent overfilling. The parameter value was set to 0.4, while the periods of the formation round were set to 200, obtaining a classification accuracy of 88.30%. Although the average accuracy rate was 0.51% higher than that of the FFT_CNN model, the time was significantly higher than that of CNN during the experiment due to the characteristics of LSTM. The accuracy convergence curve of the LSTM model is shown in Fig. 8.
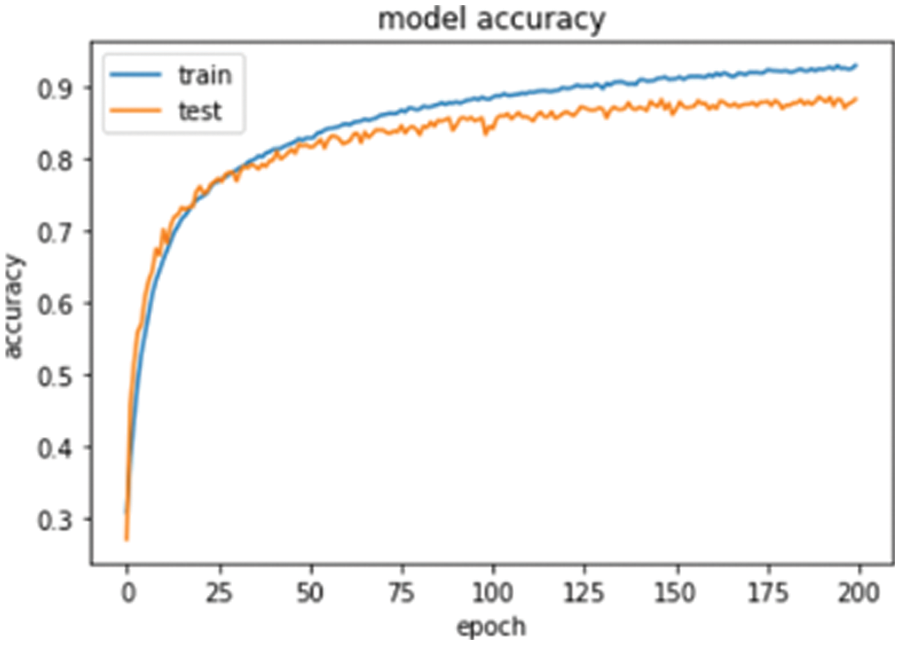
Figure 8: The accuracy convergence curve of the FFT_LSTM model
During the training process, the accuracy and loss rate of the model were calculated at each step. The loss function represented the cross-entropy loss function. This model focused on reducing the loss ratio and improving the accuracy. After 200 epochs, the model tended to converge, completing model training. Fig. 9 shows the confusion matrix for this experiment.

Figure 9: The FFT_LSTM model confusion matrix
This matrix presented the difference between the predicted and actual values. It determined the number of accurately and inaccurately predicted values, allowing for the identification of potential problems in the model and appropriate adjustments. The classification accuracy of the two models was obtained via 10-fold cross-validation, as shown in Tab. 3.

Tab. 3 shows the specific results of the two models after 10-fold cross-validation. The average recognition accuracy of the FFT_CNN model was 87.79%, while that of the FFT_LSTM model was 88.30%. Compared with the FFT_CNN model, the performance of the FFT_LSTM model improved by 0.51%. Previous experimental analyses show that the LSTM model may be more suitable for EEG feature assessment than the CNN model due to the time-frequency characteristics of EEG signals.
4.5 FFT_CLA Model Experiment Results
After the FFT process, the channel attention mechanism was used for feature processing. The processed vector was sent to the CNN model to extract the spatial information of the EEG signal and was then transferred to the LSTM model for time information extraction. The subsequent vector was sent to the self-observing mechanism model to complete the feature extraction process, after which the softmax function was used for feature classification. Here, the apprenticeship rate was set to 1–4, while the training periods were set to 200. Finally, the classification accuracy of the 32 participants was obtained via 10-fold cross-validation, as shown in Tab. 4.

Tab. 4 lists the average classification accuracy of each subject in the DEAP data set, indicating an overall classification accuracy of 92.38% for the FFT_CLA model. The comparison between the classification accuracy values of the three models is shown in Tab. 5.

Compared with the previous two models, the accuracy rates of this model increased by 4.59% and 4.08%, respectively. Furthermore, it also indicated that the EEG emotional recognition accuracy was increased to a certain extent by adding an attention mechanism.
This paper mainly focuses on EEG emotional recognition based on the FFT attention mechanism. The public DEAP data set is used to explore the EEG emotional recognition performance of the FFT_CNN, FFT_LSTM, and FFT_CLA models. The EEG data are subjected to FFT processing, after which the three models are used to classify the emotional values of the processed EEG samples. Finally, the classification performance of these models is evaluated.
The average recognition accuracy of the FFT_CNN and FFT_LSTM emotional recognition models is 87.79% and 88.30%, respectively, which is lower than that of the FFT_CLA model at 92.38%. Therefore, the FFT_CLA model displays significantly improved recognition ability. On the one hand, these results indicate that the deep learning hybrid attention model can be used to classify emotional features. On the other hand, this model is more suitable for emotion classification than the traditional deep learning model. In addition, of the three models, FFT_CLA displays the best classification ability at an average accuracy of 92.38%.
This may be attributed to the fact that the channel-based mechanism of the FFT_CLA model addresses the importance of different channels, which is usually ignored when using CNN to extract spatial features. Furthermore, the sample-based mechanism of this model considers the importance of samples often disregarded when using LSTM to extract temporal features. Therefore, the overall classification accuracy of the FFT_CLA model is higher than the other models.
This paper explores EEG emotional recognition using the DEAP data set. The experimental data indicate that some challenges remain, requiring further research.
1) The experiments in this work are conducted based on the DEAP data set. Future research can explore different data sets to identify the optimal model suitable for universal data set application.
2) This study uses the time-frequency domain features of EEG signals for feature analysis. Future studies can analyze other EEG signal attributes, such as nonlinear and spatial domain features.
3) The experiments in this work employ FFT for EEG feature processing. Future research can explore the additional EEG feature processing methods, such as multiscale principal component analysis and empirical wavelets.
Acknowledgement: The author thanks all subjects who participated in this research and FISTAR Technology Inc for their technical support.
Funding Statement: This work was supported by the National Nature Science Foundation of China (No. 61503423, H. P. Jiang). The URL is http://www.nsfc.gov.cn/.
Conflicts of Interest: The authors declare that they have no conflicts of interest to report regarding the present study.
1. J. H. Zhang, Z. Yin, P. Cheng and S. Nichele, “Emotion recognition using multi-modal data and machine learning techniques: A tutorial and review,” Information Fusion, vol. 59, pp. 103–126, 2020. [Google Scholar]
2. J. A. Domínguez-Jiménez, K. C. Campo-Landines and J. C. Martínez-Santos, “A machine learning model for emotion recognition from physiological signals,” Biomedical Signal Processing and Control, vol. 55, pp. 101646, 2020. [Google Scholar]
3. Q. Xiong, X. M. Zhang, W. F. Wang and Y. H. Gu, “A parallel algorithm framework for feature extraction of EEG signals on MPI,” Computational and Mathematical Methods in Medicine, vol. 2020, no. 1, pp. 1–10, 2020. [Google Scholar]
4. S. Lee, “A study on classification and detection of small moths using cnn model,” Computers, Materials & Continua, vol. 71, no. 1, pp. 1987–1998, 2022. [Google Scholar]
5. W. Tao, C. Li, R. C. Song, J. Cheng, Y. Liu et al., “EEG-based emotion recognition via channel-wise attention and self attention,” IEEE Transactions on Affective Computing, pp. 1, 2020. https://doi.org/10.1109/TAFFC.2020.3025777. [Google Scholar]
6. W. L. Zheng, J. Y. Zhu, Y. Peng and B. L. Lu, “EEG-based emotion classification using deep belief networks,” in IEEE Int. Conf. on Multimedia and Expo Workshops (ICMEW), Chengdu, China, pp. 1–6, 2014. [Google Scholar]
7. X. H. Wang, T. Zhang, X. M. Xu, L. Chen, X. F. Xing et al., “EEG emotion recognition using dynamical graph convolutional neural networks and broad learning system,” in 2018 IEEE Int. Conf. on Bioinformatics and Biomedicine (BIBM), Madrid, Spain, pp. 1240–1244, 2018. [Google Scholar]
8. J. C. Cho and H. Hwang, “Spatio-temporal representation of an electoencephalogram for emotion recognition using a three-dimensional convolutional neural network,” Sensors, vol. 20, no. 3491, pp. 3491, 2020. [Google Scholar]
9. Y. Liu, Y. F. Ding, C. Li, J. Cheng, R. C. Song, F. Wan et al., “Multi-channel EEG-based emotion recognition via a multi-level features guided capsule network,” Computers in Biology and Medicine, vol. 123, pp. 103927, 2020. [Google Scholar]
10. J. X. Chen, D. M. Jiang, Y. N. Zhang and P. W. Zhang, “Emotion recognition from spatiotemporal EEG representations with hybrid convolutional recurrent neural networks via wearable multi-channel headset,” Computer Communications, vol. 154, pp. 58–65, 2020. [Google Scholar]
11. L. W. Ko, O. Komarov, W. K. Lai, W. G. Liang and T. P. Jung, “Eyeblink recognition improves fatigue prediction from single-channel forehead EEG in a realistic sustained attention task,” Journal of Neural Engineering, vol. 17, no. 3, pp. 036015, 2020. [Google Scholar]
12. D. Wu, J. P. Zhang and Q. C. Zhao, “Multimodal fused emotion recognition about expression-EEG interaction and collaboration using deep learning,” IEEE Access, vol. 8, pp. 2169–3536, 2020. [Google Scholar]
13. S. Koelstra, C. Muhl and M. Soleymani, “Deap: A database for emotion analysis; using physiological signals,” IEEE Transactions on Affective Computing, vol. 3, no. 1, pp. 18–31, 2012. [Google Scholar]
14. T. Chen, S. H. Ju, F. J. Ren, M. Y. Fan and Y. Gu, “EEG emotion recognition model based on the LIBSVM classifier,” Measurement, vol. 164, pp. 108047, 2020. [Google Scholar]
15. P. J. Arnal, V. Thorey, E. Debellemaniere, M. E. Ballard, A. Bou Hernandez et al., “The dreem headband compared to polysomnography for electroencephalographic signal acquisition and sleep staging,” Sleep, vol. 43, no. 11, pp. zsaa097, 2020. [Google Scholar]
16. A. K. Mishra and V. Ponnusamy, “Deep learning-based decoding and ap selection for radio stripe network,” Intelligent Automation & Soft Computing, vol. 32, no. 1, pp. 131–148, 2022. [Google Scholar]
17. V. Bajaj, S. Taran, K. S. Khare and A. Sengur, “Feature extraction method for classification of alertness and drowsiness states EEG signals,” Applied Acoustics, vol. 163, pp. 107224, 2020. [Google Scholar]
18. N. Hooda and N. Kumar, “Cognitive imagery classification of EEG signals using CSP-based feature selection method,” IETE Technical Review, vol. 37, no. 3, pp. 315–326, 2020. [Google Scholar]
19. W. Mardini, M. M. B. Yassein, R. Al-Rawashdeh, S. Aljawarneh, Y. Khamayseh et al., “Enhanced detection of epileptic seizure using EEG signals in combination with machine learning classifiers,” IEEE Access, vol. 8, pp. 24046–24055, 2020. [Google Scholar]
20. S. Palpandi and T. Meeradevi, “Development of efficient classification systems for the diagnosis of melanoma,” Computer Systems Science and Engineering, vol. 42, no. 1, pp. 361–371, 2022. [Google Scholar]
21. D. Zhang, L. Yao, K. Chen and J. Monaghan, “A convolutional recurrent attention model for subject-independent eeg signal analysis,” IEEE Signal Processing Letters, vol. 26, no. 5, pp. 715–719, 2019. [Google Scholar]
22. Y. Zhang, K. Li, Li, K., L. Wang, B. Zhong et al., “Image super-resolution using very deep residual channel attention networks,” Proceedings of the European Conference on Computer Vision (ECCV), vol. 11211, pp. 294–310, 2018. [Google Scholar]
23. X. R. Zhang, W. F. Zhang, W. Sun, X. M. Sun and S. K. Jha, “A robust 3-D medical watermarking based on wavelet transform for data protection,” Computer Systems Science & Engineering, vol. 41, no. 3, pp. 1043–1056, 2022. [Google Scholar]
24. W. Li, F. Qi, M. Tang and Z. Yu, “Bidirectional LSTM with self-attention mechanism and multi-channel features for sentiment classification,” Neurocomputing, vol. 387, pp. 63–77, 2020. [Google Scholar]
25. Y. Tay, D. Bahri, D. Metzler, D. C. Juan, Z. Zhao et al., “Synthesizer: Rethinking self-attention for transformer models,” in Int. Conf. on Machine Learning, Pittsburgh, PA, USA, pp. 10183–10192, 2021. https://doi.org/10.48550/arXiv.2005.00743. [Google Scholar]
26. W. Qu, Z. Wang, H. Hong, Z. Chi, D. D. Feng et al., “A residual based attention model for eeg based sleep staging,” IEEE Journal of Biomedical and Health Informatics, vol. 24, no. 10, pp. 2833–2843, 2020. [Google Scholar]
27. A. B. Joshi, D. Kumar, A. Gaffar and D. C. Mishra, “Triple color image encryption based on 2D multiple parameter fractional discrete Fourier transform and 3D arnold transform,” Optics and Lasers in Engineering, vol. 133, pp. 106139, 2020. [Google Scholar]
28. X. R. Zhang, X. Sun, X. M. Sun, W. Sun and S. K. Jha, “Robust reversible audio watermarking scheme for telemedicine and privacy protection,” Computers, Materials & Continua, vol. 71, no. 2, pp. 3035–3050, 2022. [Google Scholar]
29. L. Deng, X. Wang, F. Jiang and R. Doss. “EEG-based emotion recognition via capsule network with channel-wise attention and LSTM models,” CCF Transactions on Pervasive Computing and Interaction, vol. 3, no. 4, pp. 425–435, 2021. [Google Scholar]
30. W. Sun, G. Z. Dai, X. R. Zhang, X. Z. He and X. Chen, “TBE-net: A three-branch embedding network with part-aware ability and feature complementary learning for vehicle re-identification,” IEEE Transactions on Intelligent Transportation Systems, pp. 1–13, 2021. https://doi.org/10.1109/TITS.2021.3130403. [Google Scholar]
31. S. Sheykhivand, Z. Mousavi, T. Y. Rezaii and A. Farzamnia, “Recognizing emotions evoked by music using CNN-LSTM networks on EEG signals,” IEEE Access, vol. 8, pp. 139332–139345, 2020. [Google Scholar]
32. H. Zhao, J. Jia and V. Koltun, “Exploring self-attention for image recognition,” in Proc. of the IEEE/CVF Conf. on Computer Vision and Pattern Recognition, Seattle, WA, USA, pp. 10076–10085, 2020. [Google Scholar]
33. W. Sun, L. Dai, X. R. Zhang, P. S. Chang and X. Z. He, “RSOD: Real-time Small object detection algorithm in UAV-based traffic monitoring,” in Applied Intelligence, pp. 1–16, 2021. https://doi.org/10.1007/s10489-021-02893-3. [Google Scholar]
34. Y. Luo, Q. Fu, J. Xie, Y. Qin, G. Wu et al., “EEG-based emotion classification using spiking neural networks,” IEEE Access, vol. 8, pp. 46007–46016, 2020. [Google Scholar]
35. A. Mert and A. Akan, “Emotion recognition from EEG signals by using multivariate empirical mode decomposition,” Pattern Analysis and Applications, vol. 21, no. 1, pp. 81–89, 2018. [Google Scholar]
 | This work is licensed under a Creative Commons Attribution 4.0 International License, which permits unrestricted use, distribution, and reproduction in any medium, provided the original work is properly cited. |