DOI:10.32604/cmc.2022.028289
| Computers, Materials & Continua DOI:10.32604/cmc.2022.028289 | |
| Article |
Multi-Scale Network with Integrated Attention Unit for Crowd Counting
1Department of Electrical Engineering, Taibah University, Madinah, Saudi Arabia
2Department of Electronics and Computer Engineering, School of Electrical Engineering, Faculty of Engineering, Universiti Teknologi Malaysia, 81310, Johor, Malaysia
3Department of Computer Engineering, Hodeidah University, Hodeidah, Yemen
*Corresponding Author: Ahlam Al-Dhamari. Email: kmahlam@utm.my
Received: 07 February 2022; Accepted: 28 April 2022
Abstract: Estimating the crowd count and density of highly dense scenes witnessed in Muslim gatherings at religious sites in Makkah and Madinah is critical for developing control strategies and organizing such a large gathering. Moreover, since the crowd images in this case can range from low density to high density, detection-based approaches are hard to apply for crowd counting. Recently, deep learning-based regression has become the prominent approach for crowd counting problems, where a density-map is estimated, and its integral is further computed to acquire the final count result. In this paper, we put forward a novel multi-scale network (named 2U-Net) for crowd counting in sparse and dense scenarios. The proposed framework, which employs the U-Net architecture, is straightforward to implement, computationally efficient, and has single-step training. Unpooling layers are used to retrieve the pooling layers’ erased information and learn hierarchically pixel-wise spatial representation. This helps in obtaining feature values, retaining spatial locations, and maximizing data integrity to avoid data loss. In addition, a modified attention unit is introduced and integrated into the proposed 2U-Net model to focus on specific crowd areas. The proposed model concentrates on balancing the number of model parameters, model size, computational cost, and counting accuracy compared with other works, which may involve acquiring one criterion at the expense of other constraints. Experiments on five challenging datasets for density estimation and crowd counting have shown that the proposed model is very effective and outperforms comparable mainstream models. Moreover, it counts very well in both sparse and congested crowd scenes. The 2U-Net model has the lowest MAE in both parts (Part A and Part B) of the ShanghaiTech, UCSD, and Mall benchmarks, with 63.3, 7.4, 1.5, and 1.6, respectively. Furthermore, it obtains the lowest MSE in the ShanghaiTech-Part B, UCSD, and Mall benchmarks with 12.0, 1.9, and 2.1, respectively.
Keywords: Computer vision; crowd analysis; crowd counting; U-Net; max-pooling index; unpooling; attention units
Automatic crowd analysis is essential for effective crowd management for every entity responsible for ensuring public safety. Two of the most significant and recent tasks in crowd analysis are density estimation (DE) and crowd counting (CC) [1,2]. They can be used in a variety of visual real-world surveillance applications, including recognizing abnormally massive crowds, pedestrian tracking, crowd dynamics modeling, congestion detection, group behavior analysis, improving long-term crowd management solutions required for better urban planning, and designing evacuated routes in open public areas by statistically analyzing the flow rate of pedestrians in specific areas. Although the past decade has witnessed explosive growth and widespread applications of wireless sensing technologies such as Radio-Frequency Identification (RFID), WiFi, and Ultra-Wideband (UWB), the number of people in a specific crowd region is still critical for many application scenarios in reality. Device-based approaches such as RFID for CC request each individual to take the RFID tags, which will obstruct the systems for further large-scale applications, especially if the public place is very wide and has many gates, such as in the Holy Places of Makkah and Madinah. Device-based approaches necessitate the use of mobile devices. People must additionally enable Bluetooth equipment, use speakers, or use other equipment such as RFID tags. The main problem with this approach is that some people can have multiple mobile devices, and not everyone has one. This has a big impact on the counting accuracy, flexibility, and system cost. On the other hand, vision-based CC can be acquired from the available and ubiquitous closed-circuit television cameras (CCTV) making it one of the best options.
DE in computer vision is intended to estimate the spatial distribution of a crowd image, and CC seeks to compute the number of people in images or videos automatically. Accurate CC is required in many situations and occasions, such as public demonstrations, sports activities, and religious gatherings [3]. CC assists in the management of large crowds, particularly during Hajj and Umrah, when millions of Muslims (from all over the world) congregate in Makkah to conduct rituals. Moreover, DE helps in predicting high-density distribution maps to represent the places of dense crowd groups. Fig. 1 shows sample scenes for Hajj captured at different locations. One of the most crowded areas during Hajj is the Tawaf area, which represents the area around the Kabbah and shows some of the ritual places, such as the Blackstone. The Jamarat area, located outside the Masjid Al-Haram in Mina, is another crowd destination during the Hajj. Overcrowding in these crowded scenes might result in deaths owing to respiratory issues and stampedes, especially among the elderly, who make up a substantial portion of the pilgrims. Managing the crowd in these main locations during the Hajj season is one of the important real topics. However, because of the inherent nature of the problem, CC in real-life contexts is extremely challenging. For example, in dense scenarios, people have lower resolutions with varied scales. Also, observing a person's entire body is almost nonviable due to the frequent occlusions in a scenario. Furthermore, background clutter is detrimental to counting accuracy. CC approaches have been progressively developed with the advent of convolutional neural networks (CNNs). One significant benefit of utilizing CNNs is their capability to learn powerful feature representations from crowd images.
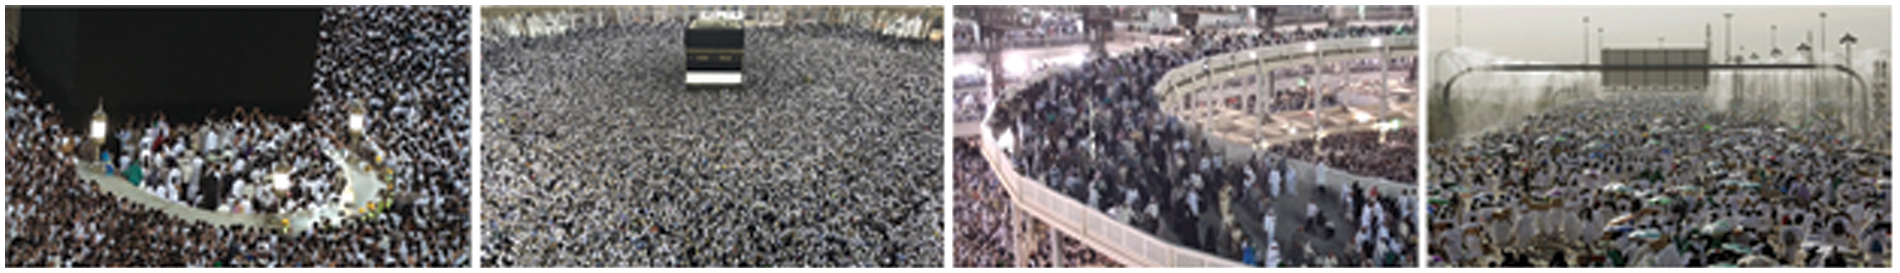
Figure 1: Crowded scenes at different areas of Hajj rituals
There are four main constraints for running current CNN crowd counting models: the model size, the number of model parameters, the run-time memory requirement, and the counting accuracy. Some methods have been proposed to overcome or improve some of these limitations, but at the expense of other constraints. For example, complex models with a large number of parameters will almost certainly result in time-consuming and suboptimal issues, which is inconvenient for applications that require quick reaction. To recap, it is still far from the desired balance of accuracy and efficiency in a real-world scenario. This research seeks to get high counting accuracy using a simple CNN-network architecture with fewer parameters but yet a smaller model size using two U-Net streams. To summarize, the following are the main novelties and contributions of this study:
• To cope with the challenge of crowd counting in realistic circumstances, a multi-scale framework named 2U-Net is proposed. Using two efficient parallel encoder-decoder architectures, the proposed model can gain rich contextual information and be able to construct a high-quality density map with high CC accuracy. It has a lower number of parameters and yields competitive results. To our knowledge, no studies have attempted to focus on estimating high-quality density maps while preserving a smaller number of parameters. We also use several quality metrics to assess the quality of density maps created by the proposed framework, including peak signal-to-noise ratio and structural similarity index.
• To allow the 2U-Net model to focus on crowd areas, a modified attention unit has been introduced and integrated into the 2U-Net architecture.
• To tackle the issue of data loss actuated by the pooling layers of the U-Net, unpooling layers are utilized to upsample the downsampled maps.
• To test the performance of the proposed 2U-Net, five challenging benchmarks for image and video crowd counting are utilized. The paper is intended for crowd counting in the holy places of Makkah and Madinah as a special case study for congested crowd scenes; thus, we used the Haramain benchmark [4]. In addition, to prove the efficiency and integrity of our 2U-Net model for general surveillance crowd scenes and state-of-the-art frameworks, we compared it with four relevant and challenging standard benchmarks: ShanghaiTech, University of Central Florida (UCF), University of California San Diego (UCSD), and Mall. Based on our findings, the proposed model demonstrates its superiority over the state-of-the-art studies in terms of counting accuracy and the quality of the generated density maps.
The following are the other sections of this article: Section 2 outlines some key and timely DE and CC studies. The whole proposed 2U-Net model is shown in Section 3. In Section 4, the evaluation metrics, experimental settings, and findings are discussed in detail. The proposed framework is concluded in Section 5.
Several approaches have been presented in the literature to address the challenges of DE and CC, which can be classified into two major groups: traditional approaches and deep learning approaches. Further details on the DE and CC approaches are given in the next sub-sections.
In early studies on crowd counting, researchers used detection-based approaches, which utilized a sliding window to detect every individual and then estimate the number of observed instances. The detection-based approaches utilize handcrafted features derived from a single pedestrian to train a classifier [5]. The classifier could be one of the most commonly used classifiers, including support vector machines and random forest. Nevertheless, the acute occlusions prevalent in crowd counting applications significantly impact the counting accuracy of detection-based approaches [6]. The regression-based approaches were next studied, which require constructing a mapping from the image to the counting outcome and predicting crowd counts in the absence of awareness of the location of each pedestrian. However, due to the intricate non-linearity between the image and the predicted outcome, constructing the mapping remains challenging [6]. Despite advancements in the detection-based and regression-based approaches for crowd counting, density estimation-based approaches have been developed to map an image to the corresponding density-map. This mapping is much easier and more effective than mapping the image directly to the counting outcome, wherein the spatial information can be provided via the density estimation-based approaches for crowd scene analysis. Almost all of the recent research on crowd counting has used a density estimation-based approach, and this paper follows recent studies by using a density estimation-based pipeline to deal with the crowd counting problem.
Motivated by the outstanding performance of deep learning in the computer vision field [7–11], the latest studies of CC utilize deep learning networks to enhance the performance metrics such as counting accuracy and quality of the density-map. Deep learning-based approaches integrate the procedures of feature extraction as well as regression model learning. This integration has become prevalent in crowd counting, and most computer vision applications [6]. Taking advantage of CNNs, the latest state-of-the-art CC approaches based on CNN have accomplished laudable performance [12,13]. Dealing with many ranges of crowd densities can be daunting for a single CNN. Therefore, many researchers suggested different CNN architectures to deal with this challenge. Some of these architectures are multi-column CNN [14], stacked multi-branch blocks [15,16], and multi-scale feature fusion [17]. However, when these architectures are used to process crowd images, many factors, such as network depth and multi-scale information, will have a big impact on the quality of density-maps.
Several multicolumn or multi-branch architectures are usually adopted to address scale variation and cluttered backgrounds for better counting accuracy. Different receptive fields are used in these column architectures to accommodate different crowd densities, which represents a challenge due to the diversity of people’s crowd densities [4]. Generally, high crowd density scenes can be efficiently addressed by a branch with tinier receptive fields. On the other hand, a branch with wider receptive fields can effectively handle scenes with low crowd density [18]. A multi-column CNN (MCNN), with different-sized filters to acquire additional information, was first presented by Zhang et al. [14]. In their seminal work, they introduced the ShanghaiTech dataset for crowd counting. Prompted by the performance of the MCNN, Sam et al. [19] introduced the Switching-CNN, which decouples the three columns into independent CNNs, each trained on a portion of the patches. They used VGG to create a density selector that uses structural and functional differences to steer various branches to choose the best regression for various input pictures, thereby avoiding three times regressing on the whole image. Compared to the MCNN, this method needs less computation time.
Unlike other methods, the proposed 2U-Net aims to construct high-quality density estimation maps by using two parallel U-Nets and maintaining spatial information, followed by one convolutional layer to fuse the generated density and attention maps. Consequently, pixel-wise regression counting accuracy in the predicted map has improved. Thus, in a larger sense, estimating the density map is identical to other localization challenges like tracking [20,21], which likewise produce localized estimated maps as network outputs. Moreover, the proposed framework is a case study of crowd high-density estimation and counting in Makkah and Madinah during the Hajj pilgrimages. The Hajj is the largest annual pilgrimage to the Islamic holy cities of Makkah and Madinah. For the following reasons, high levels of occlusion (i.e., one pilgrim blocking others) and complicated backgrounds make counting exceptionally hard. (1) The majority of the female pilgrims wear full black hijab and walk-in groups, which makes counting a very complex task. (2) The congested crowd that is far away from the camera leads to recording incomplete body silhouettes. It is interesting to note that, the proposed model can be used for any general surveillance scene that models crowd counting in highly densely populated images. Additionally, the proposed framework is also more generalized and works very well in sparse crowd datasets such as the UCSD and Mall datasets.
3 Scale-Aware Crowd Counting by 2U-Net
The aim of this research is to address the image/frame crowd counting problem. Previous studies have found that density-based crowd counting approaches accomplish higher performance than directly regressing the number of individuals [22]. In our framework, CC is formulated as a regression problem between the crowd characteristics and density. Given a crowd image/frame
In this work, a non-linear regression function is learned by decreasing the MSE loss (
A novel multi-scale two-stream U-Net (2U-Net) is proposed to deal with the challenge of crowd counting, especially in the holy places of Makkah and Madinah, and produce high-quality density-maps. The overall workflow of the proposed crowd counting framework using the proposed 2U-Net model is shown in Fig. 2. The 2U-Net architecture is illustrated in the zoom-in part of Fig. 2 in more detail. Our architecture comprises two U-Net streams, each of which contains multiple multi-scale features and learns to represent features in a progressively robust way. The resized crowd image is straightforwardly fed into both U-Net streams. Then, two loss functions are used for training the model. These loss functions compute the distance between the current network output and the anticipated output by using the ground-truth density maps and the estimated density maps. A wise-multiplication procedure is applied between U-Net streams to complement resolutions for the final high-resolution density-map output. Unlike the traditional expanding path “decoder” in the baseline (U-Net), which uses convolution for upsampling, we exploit unpooling as an upsampling method in our 2U-Net proposed model. The mechanism of the unpooling operation is to backpropagate the information recorded by the preceding max-pooling as well as the location information. The surround loss data is then re-added to a zero value, resulting in an output that is identical to the input dimension. Also, a modified attention unit (AU) is added and integrated into the first stream of the proposed 2U-Net.
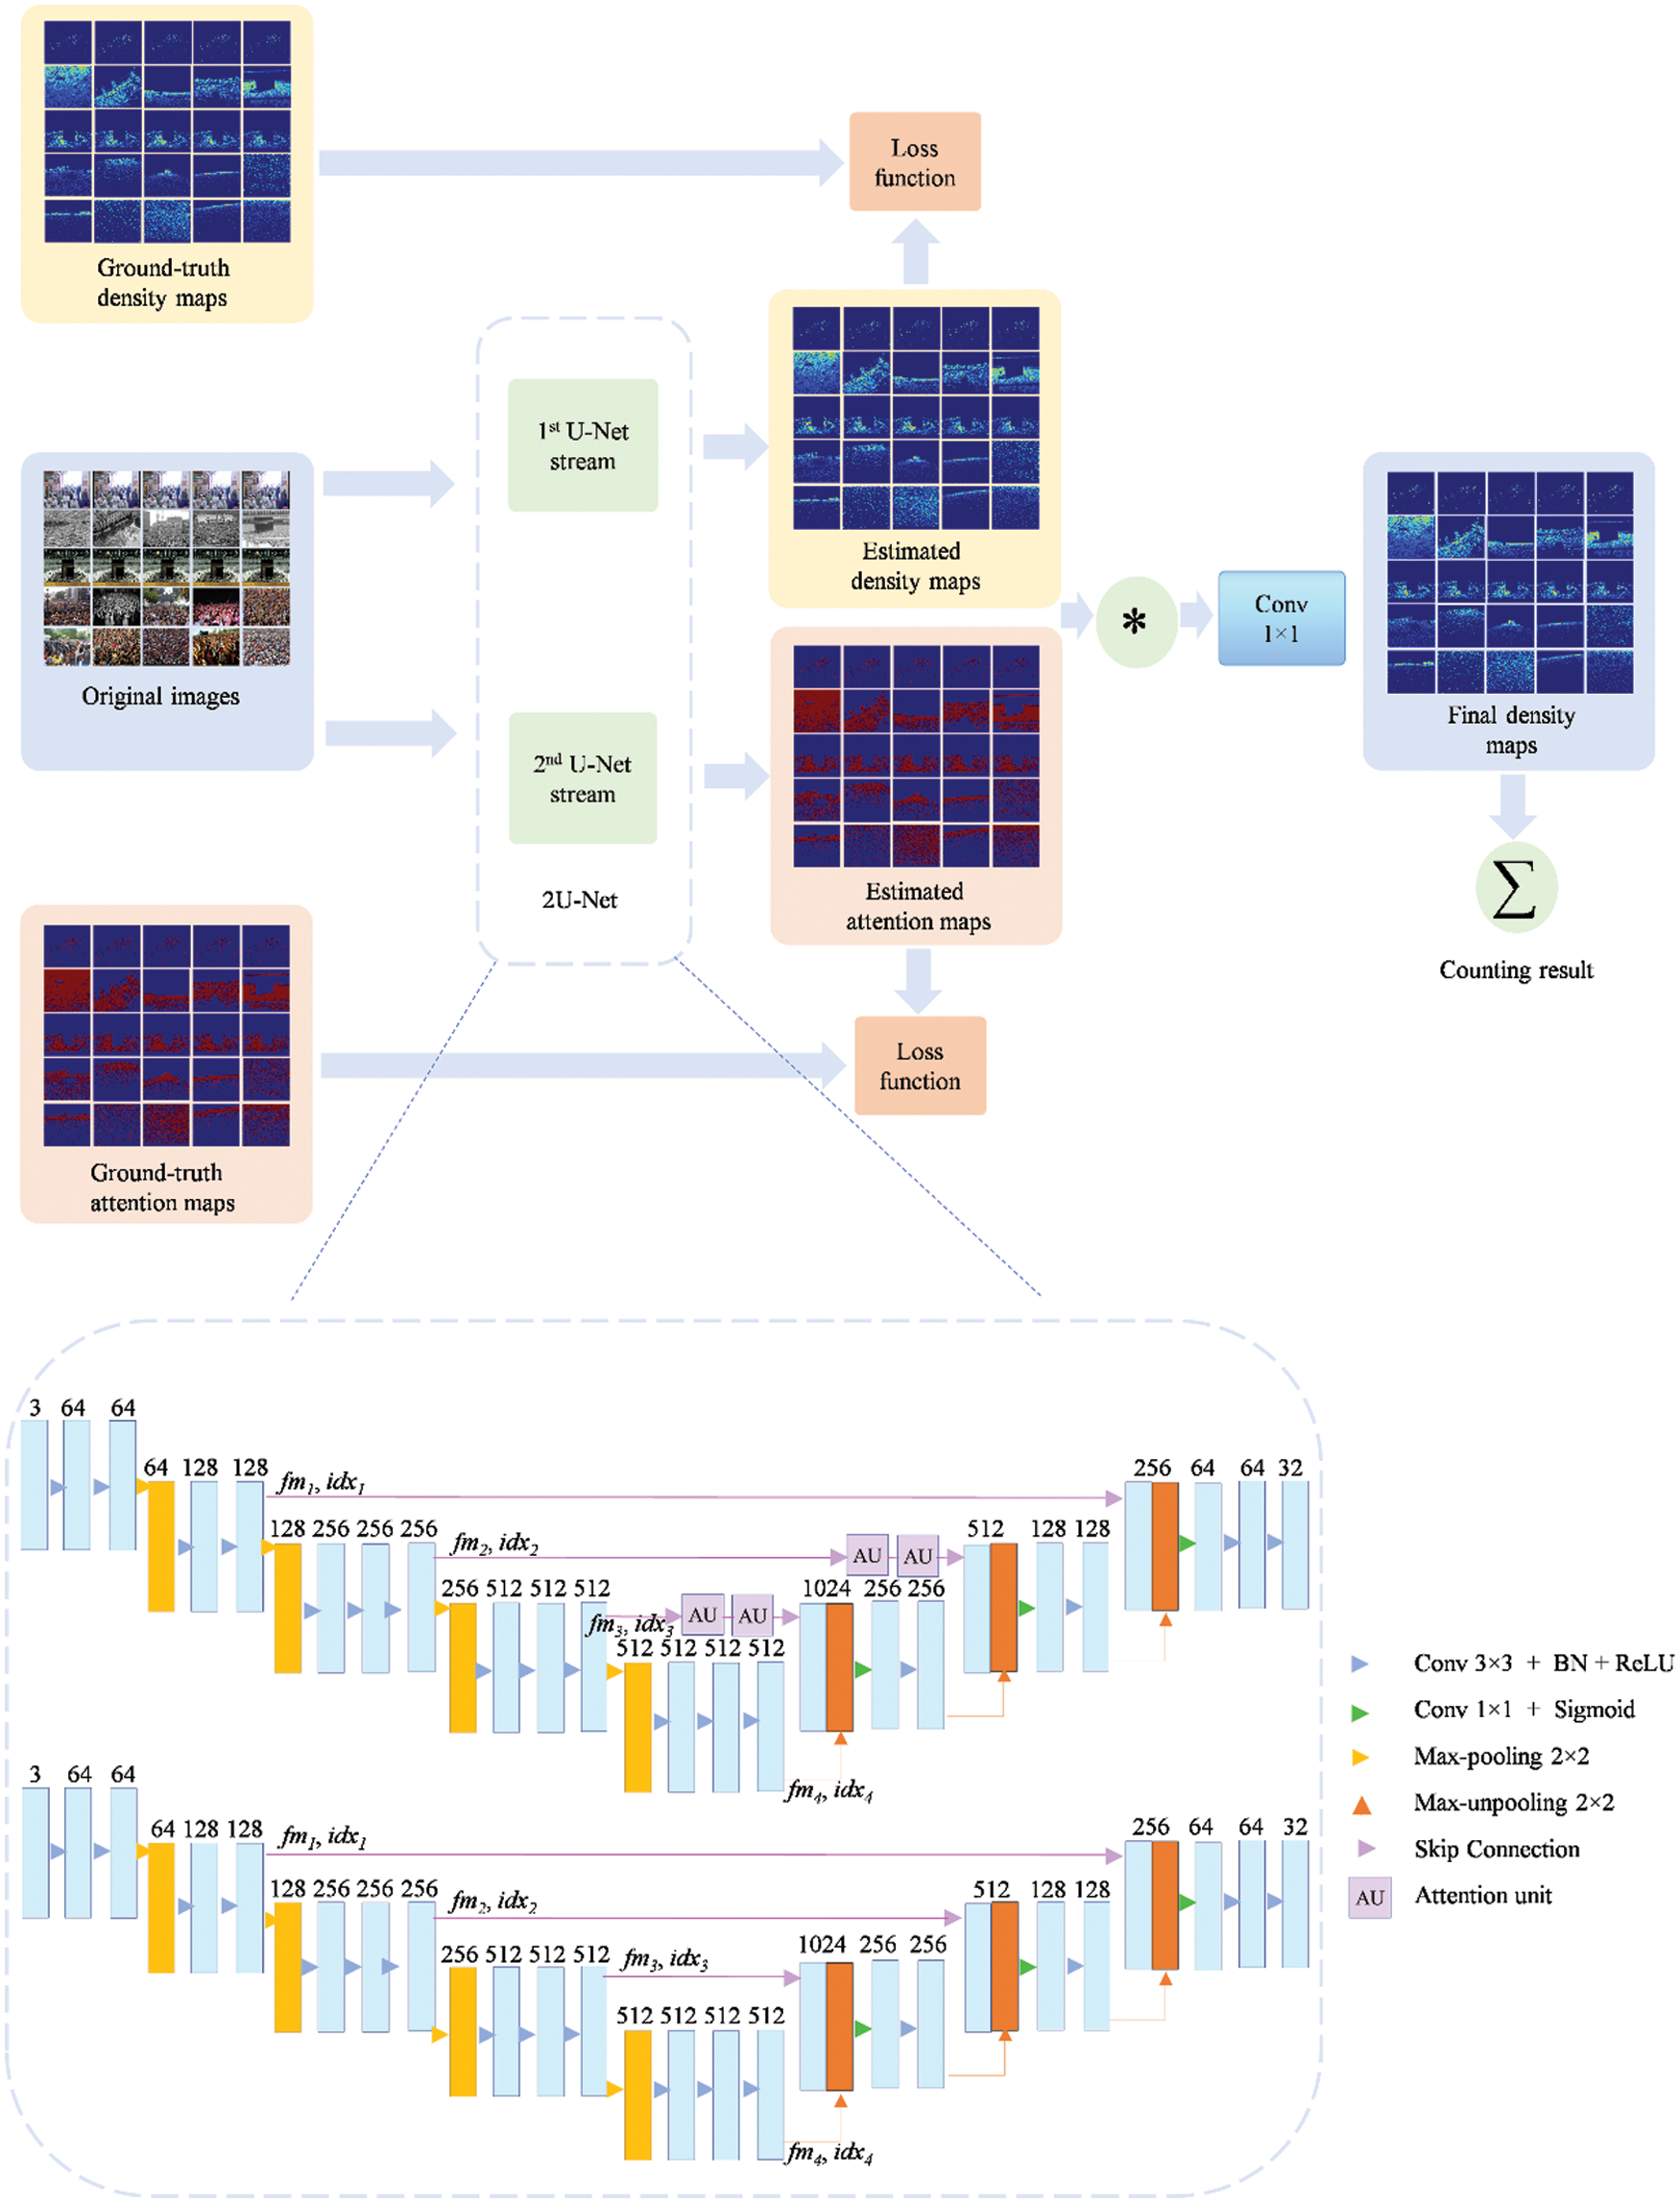
Figure 2: The workflow of the proposed framework using the proposed 2U-Net model. The zoom-in part provides an illustration of the 2U-Net architecture in detail
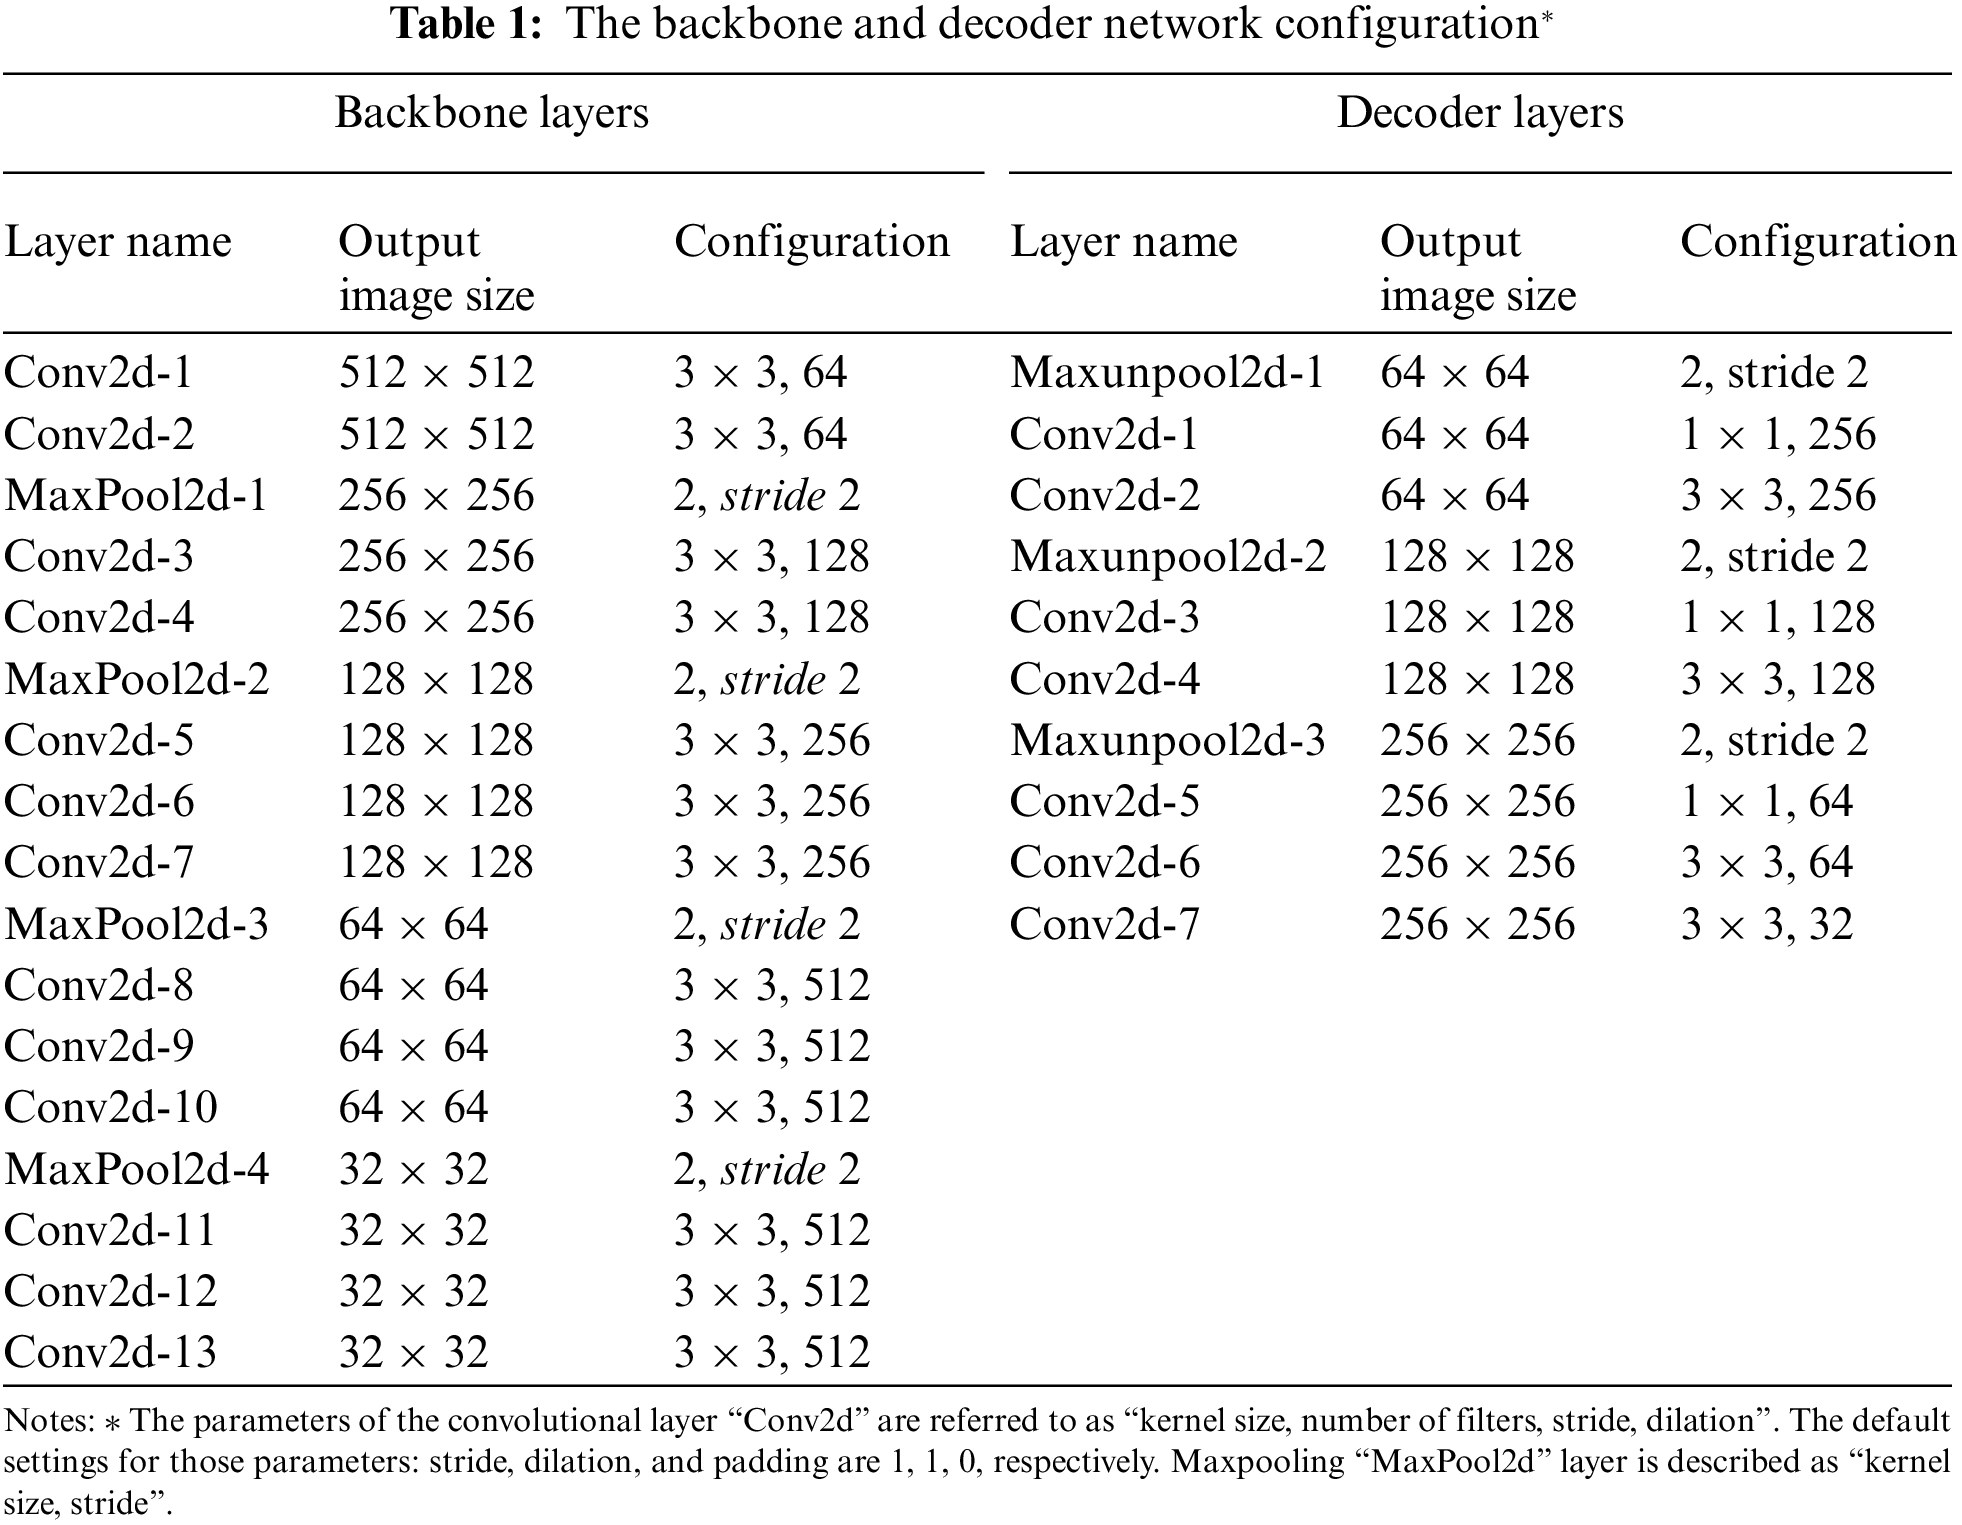
BN [23] is utilized instead of the encoder part to extract visual features from an input crowd-frame sequence. VGG16-bn, a version of VGG16 accompanied by batch normalization (BN), has been employed due to its practical transfer learning ability [4]. For greater effectiveness, VGG-16 utilizes multiple convolution layers with tiny kernels rather than a few convolution layers with large kernels. As a result, it outperforms several other local feature extraction strategies. The adopted layers from the BN contain four pooling layers, and the feature maps created by the BN are 1/16 the size of the original input.
For extracting spatial features from a crowded frame, two convolutional layers are employed first, as shown in Tab. 1, followed by a pooling operation to eliminate noisy activations and preserve the constant scale of the resulting features. Small kernels are used to expand the perception field to decrease the number of parameters caused by the convolution layer and deal with insufficient training samples. Assume that a training set element is given as (x, y), in which x indicates a training pattern (i.e., a crowd image patch with many channels), and y refers to the associated label. To obtain the ith feature map x(k,i) in the kth convolution layer, the tth feature map of the former layer x(k−1,t ) is convolved with a learnable kernel lk,i,t, after that, all the maps are directed into an activation function (f ) in order to obtain the output x(k,s) as follows:
Where
where d( ) represents the subsampling operation, and
Pooling layers result in downsampling the feature maps. From Eq. (3), we can notice that if there are
The feature-map grid is progressively down-sampled in conventional CNN architectures to obtain a sufficient sizeable receptive field. Thus, semantic contextual features are obtained. However, decreasing false-positive predictions for tiny objects with considerable shape-changeability is still challenging. As a result, several computer vision frameworks depend on extra prior object localization models to break down the process into distinct localization and subsequent steps. Oktay et al. [25] showed that integrating attention gates (AGs) into a conventional CNN model can achieve the same objective. This does not necessitate multiple models to be trained or a considerable number of additional parameters. Unlike the localization in multi-stage CNNs, attention gates gradually repress feature responses in irrelevant background areas without cropping regions of interest between networks. Thus, in this paper, based on [25], a modified attention unit (AU) is introduced and incorporated into the first stream of the 2U-Net model.
As illustrated in Fig. 3, attention coefficients
where
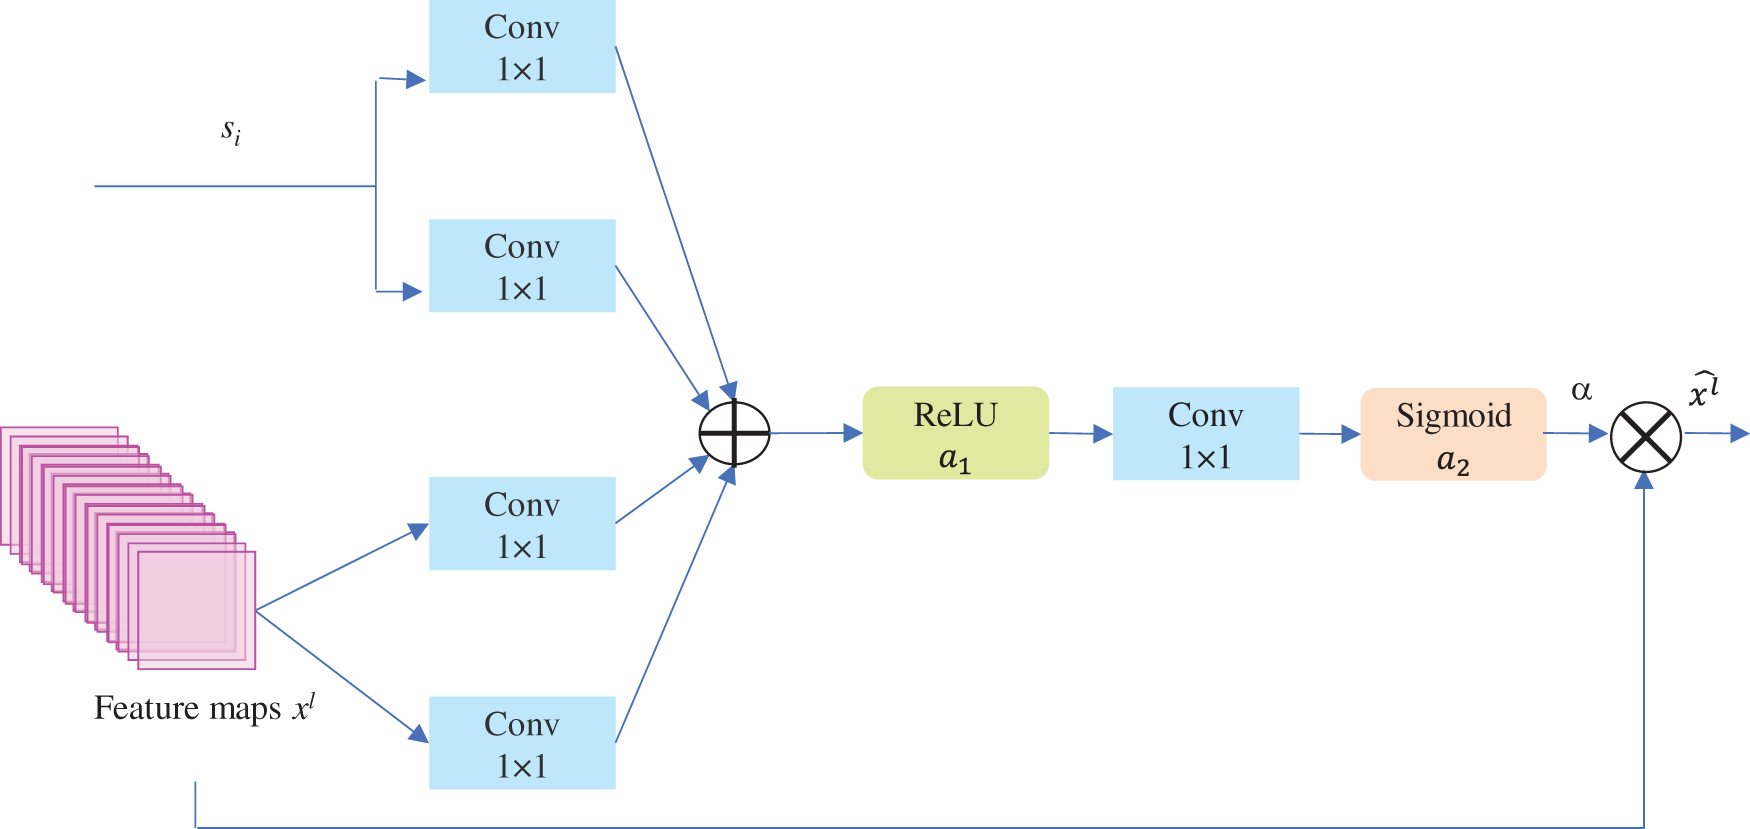
Figure 3: Schematic of the AU. Input feature maps are scaled with attention coefficients obtained in AU
The U-Net is arguably the most successful architecture in many areas relevant to computer vision, such as crowd counting, segmentation, and concrete crack detection. The U-Net architecture is symmetrical, with a contracting pathway “encoder” on the left (the encoder configuration details are described in Tab. 1) and an expanding pathway “decoder” on the right (the decoder configuration details are described in Tab. 1) [28]. In the contracting pathway, every downsampling operation has a series of two and three
The whole 2U-Net model is trained using the MSE and BCE losses, and the Adam optimizer is used for optimization. Both MSE and BCE losses are utilized to train the 1st U-Net and the 2nd U-Net, respectively. They are defined as follows:
where
This section presents the evaluation metrics and experimental details. Then, the findings of the proposed 2U-Net are recorded and evaluated on five other common standards crowd counting benchmarks.
There are two kinds of metrics related to crowd counting and employed to assess the overall performance of the proposed 2U-Net model and test the quality of the estimated density-map: model evaluation metrics and density-map evaluation metrics. Details of these types are in the following sub-sections.
4.1.1 Model Evaluation Metrics
Model evaluation metrics can be performed by calculating the mean absolute error (MAE) and mean squared error (MSE) on different public datasets. The MAE and MSE [6,29,30] can be computed using the following equations:
where for an ith test pattern,
4.1.2 Density-map Evaluation Metrics
High-resolution density-maps generally provide high location accuracy as well as maintain more spatial information for localization challenges (e.g., detection and tracking). The quality of the density-map can be examined using two standard metrics: peak signal-to-noise ratio (PSNR) and structural similarity index (SSIM) [4]. The PSNR and SSIM are defined as follows [31–33]:
where M denotes the image of the density-map and
where for a given ground-truth density-map (g) as well as an estimated density (p) map,
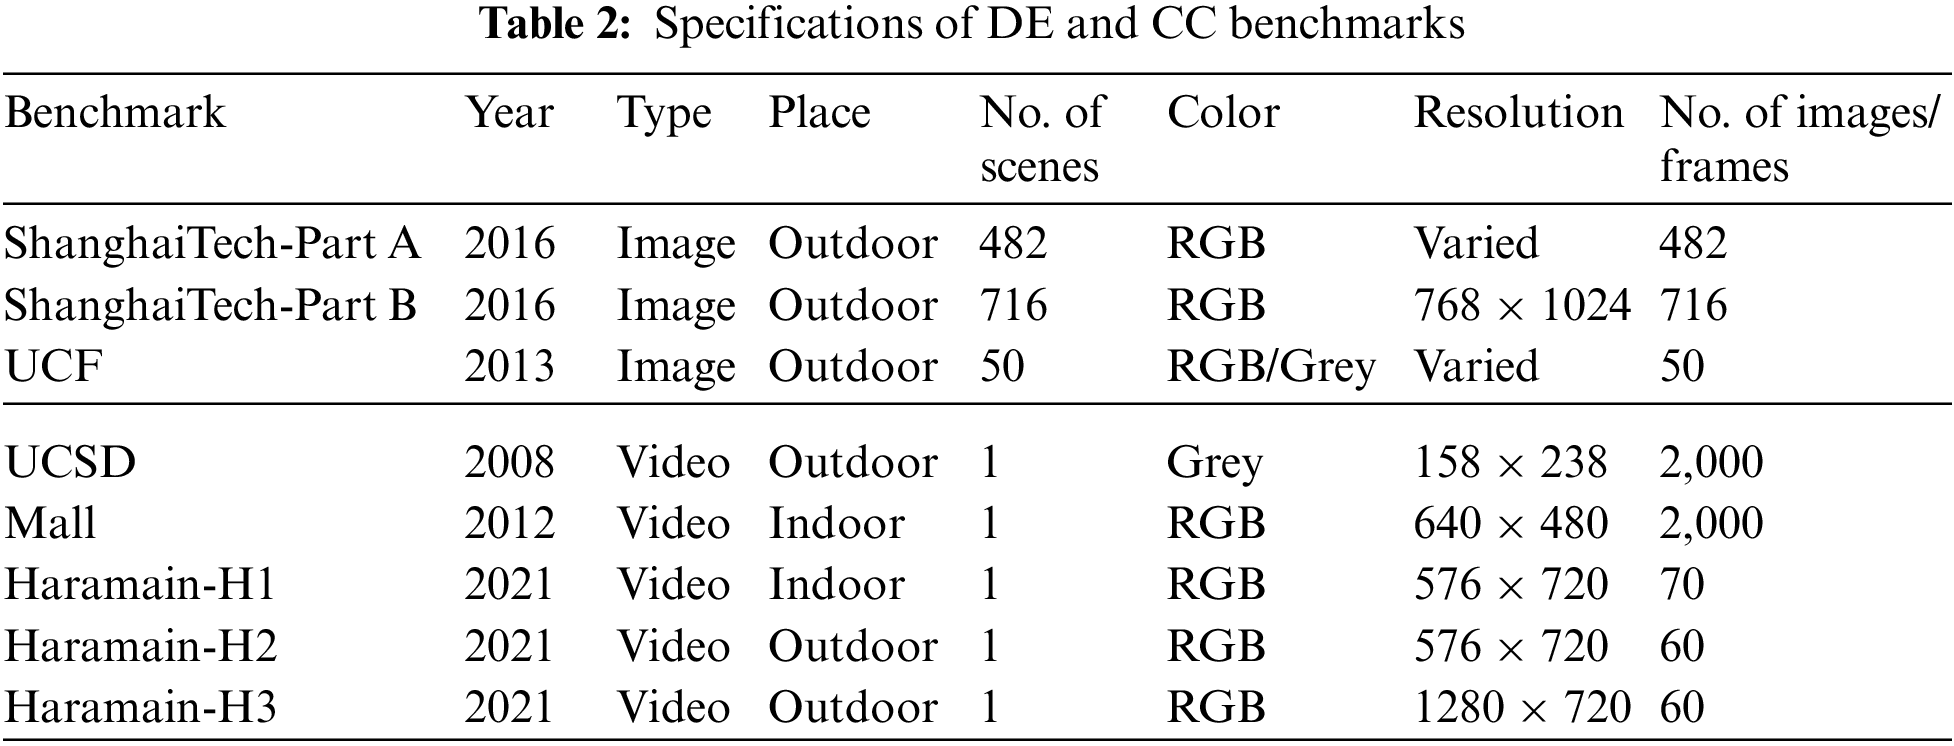
There are several publicly available benchmarks for DE and CC frameworks that can be used to assess performance tests and evaluations. Fig. 4 depicts some samples from the benchmarks listed below and recorded in Tab. 2. Marking the pedestrian head on all images and frames provides the labelled individuals.
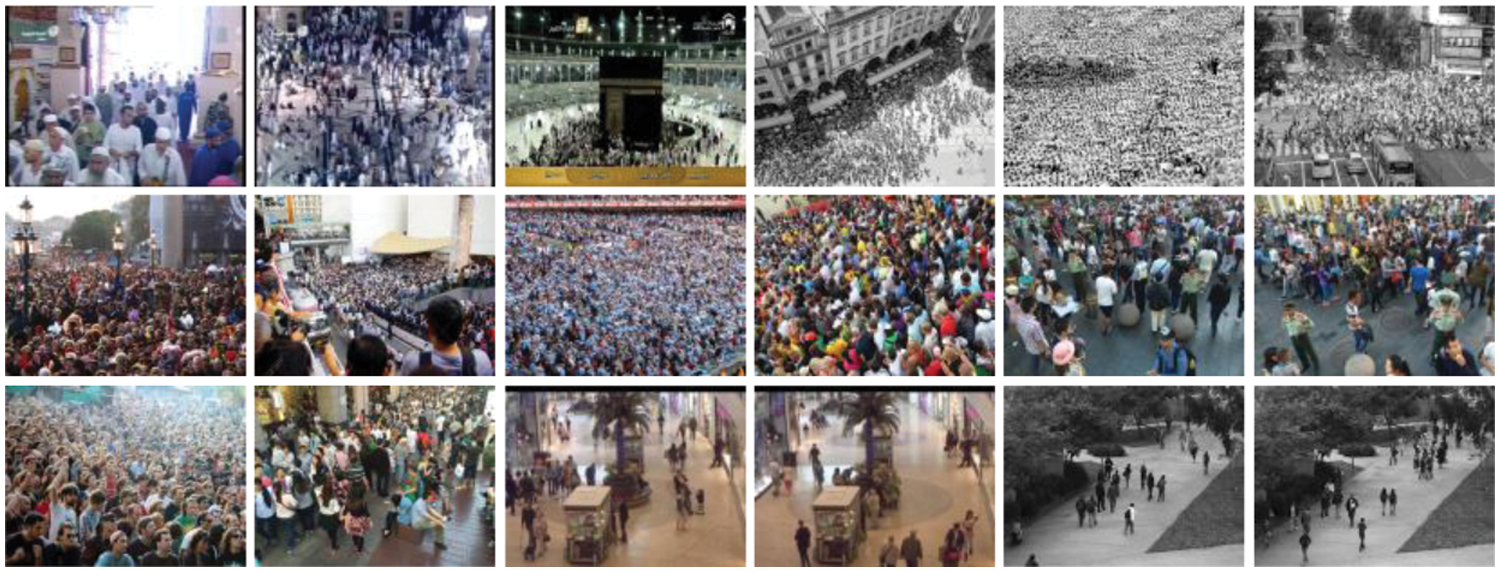
Figure 4: Random crowd images from the five DE and CC benchmarks
One of the most popular datasets for crowd-counting applications is the ShanghaiTech dataset [14]. It has 1198 images with 330,165 annotated people. This dataset has two parts: 482 images in Part A and 716 images in Part B. Images of Part A were gathered from the Internet, whereas the images of Part B were taken using a security camera on the streets of Shanghai. When comparing these two parts, Part A has a higher crowd density than Part B. Since ShanghaiTech benchmark Part A is a more challenging outdoor dataset, with a wide range of crowd density, both MAE and MSE values are higher than those of Part B.
Although the UCF dataset [34], with only 50 images, is the smallest of all public crowd counting datasets, it is still one of the most popular crowd counting datasets. The UCF dataset has three main features: (1) It includes a wide range of crowd scenes like pilgrimages, stadiums, concerts, protests, marathons. (2) The number of pedestrians varies greatly, from 94 to 4543. (3) All images are grayscale. However, the features mentioned above make crowd counting more challenging in different aspects. Because this dataset includes only 50 images, state-of-the-art techniques verify their methods through using conventional 5-fold cross-validation (5F-CV) strategy [4,5,22,34,35]. Therefore, following those methods, the proposed 2U-Net model is also evaluated using 5F-CV.
The UCSD benchmark [36] is the first dataset gathered for crowd counting, which has 2000 frames with one annotated frame every five frames. It was collected at the University of San Diego campus, California. The frame resolution of the UCSD dataset is 238 × 158 pixels, which is insufficient for constructing high-quality density-maps. As a result, each image is enlarged to 512 × 512 pixels. The total number of people inside the frames in the UCSD dataset is sparse, ranging from 11 to 46. The original settings in [36] have been used to examine the performance of the proposed method, where the frame sequences from 601 to 1400 are employed for training, and the rest 1200 frame sequences are utilized for testing.
The Mall benchmark [37] is captured by a public surveillance camera within a shopping center. The glass surface reflections, indoor plants, and lighting conditions in this dataset present several challenges. Furthermore, the scene in this dataset contains significant perspective distortion, resulting in substantial variations in the size and appearance of target objects. Additionally, the dataset faces severe occlusion caused by the scene objects. The UCSD and Mall datasets include relatively low-density crowd pictures that are generally captured in a single scene. Following [4,37], for training, the first 800 frames are utilized, and the other 1,200 sequences will be used for testing.
The Haramain dataset [4] comprises different crowd views at some Muslim religious sites in Makkah and Madinah. For the purpose of worship, Muslims from all over the world congregate at the holy places in Makkah and Madinah. Consequently, preserving individuals' comfort and safety while praying is a top priority. Every year more than 3-million pilgrims visit Madinah. It has 42 multidoor entries and spans an area of nearly 98,000 m2 [38]. As a result, sustaining smooth movement in all regions and gates is a difficult mission. Predicting the number of individuals in congested scenarios aids in flattening the distribution of more than 167 thousand individuals over the holy haram. The Haramain dataset, which comprises three-parts for three-different scenarios, was proposed for the purpose of crowd counting at the holy religious sites. The first two parts, dubbed Haramain-H1 and Haramain-H2, contain 70 and 60 crowd frames from two scenarios at the Madinah masjid, respectively, while the third part, Haramain-H3, was captured during the pilgrimage season from the Al-Sahn region at Al-Haram mosque in Makkah, Saudi Arabia, and contains 60 image sequences. Tab. 2 lists the resolutions for all parts. Because the annotation procedure takes a long time, the duration of each video in this benchmark has been restricted in length, and 5F-CV has been utilized as an assessment methodology to test the performance and robustness of the proposed 2U-Net model on unseen data with the goal of minimal generalization error. 5F-CV was employed in this investigation, where the entire real dataset was partitioned into five folds. In each experiment, only four folds were utilized for the training process in each experiment, while the remaining set was used for testing purposes. Five experiments are carried out in order to get five distinct accuracies for each fold of the dataset used as a test set. The proposed model's absolute accuracy is the average of all experiments’ accuracy.
The training and evaluation were conducted by PyTorch on a Tesla V100 GPU. For a fair comparison, we use the measurement approach described in [4,5] and use linear interpolation to adjust the density map and ground truth to the size of the original input image.
4.4 Ground-truth (GT) Generation
We initially generate the GT density-maps and, afterward, produce GT attention-maps. Following [4], a fixed sigma kernel is utilized for this task. The ground-truth density-map are expressed as:
where
An attention-map
In this section, we compare the results of our model to those of other models on five distinct benchmarks to highlight the efficiency of our model.
4.5.1 Model Computational Complexity
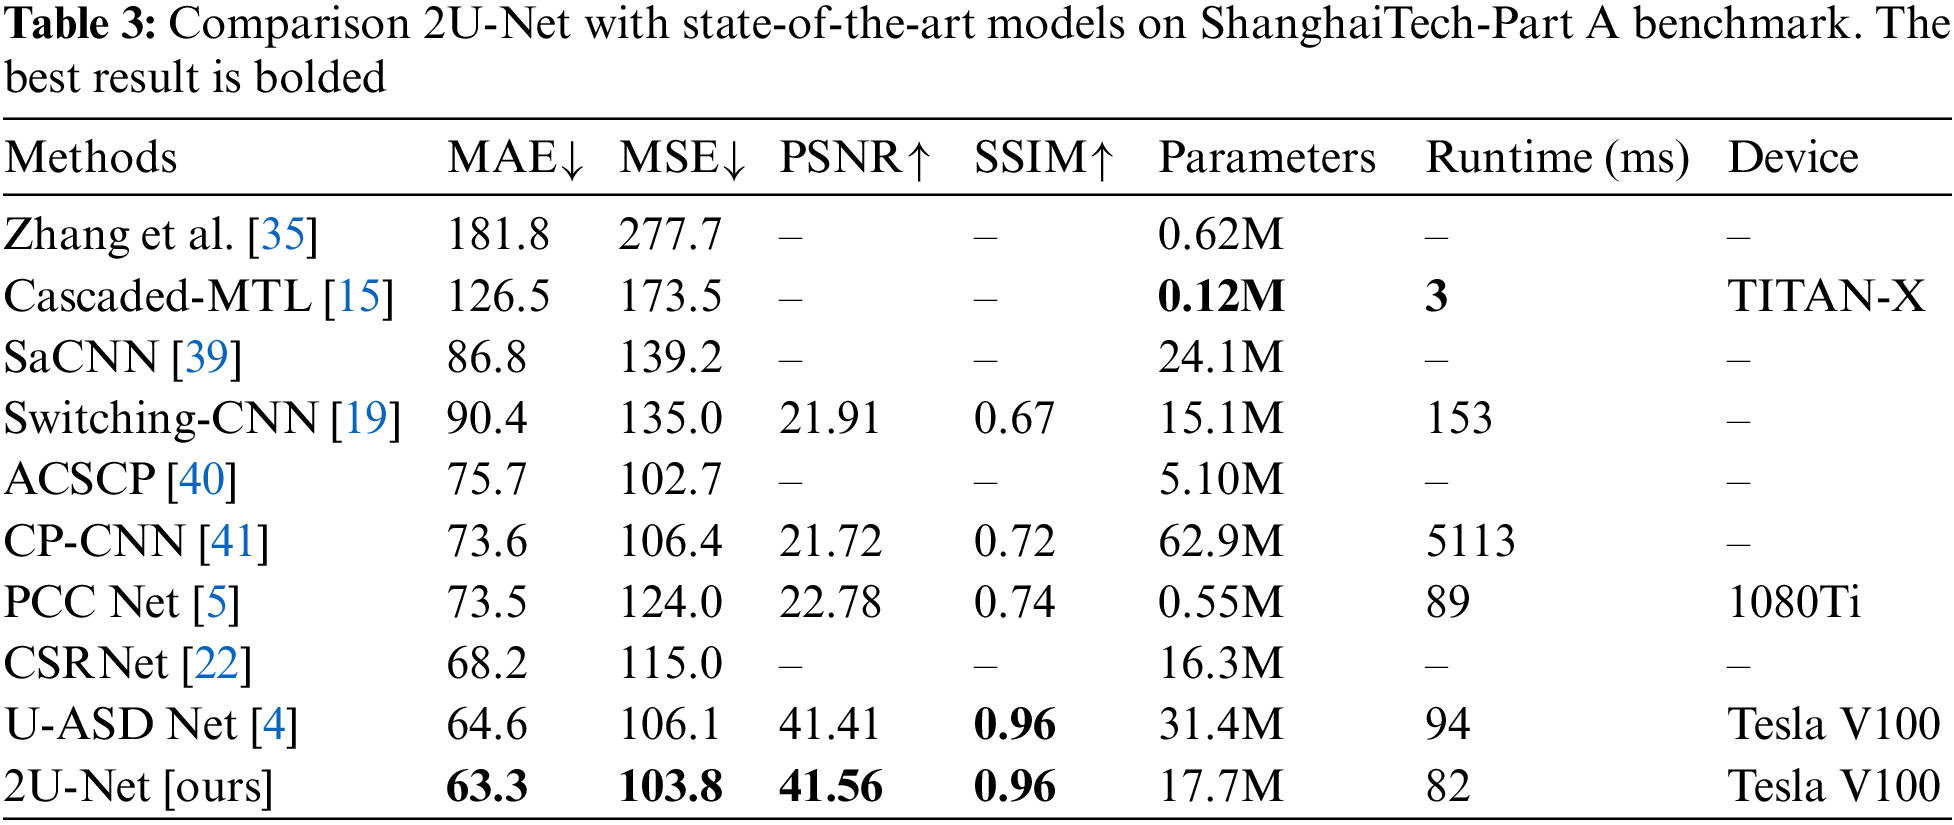
Measures like the number of model parameters and runtime are utilized to evaluate model computational complexity. A model with fewer parameters will run more efficiently, but at the cost of performance, such as the Cascaded-MTL model [15], which has much fewer parameters due to its design simplicity, and it yields very poor performance as shown in Tab. 3. As a result, the efficiency-accuracy trade-off should be investigated. Tab. 3. presents the detailed results of the proposed 2U-Net on the crowd ShanghaiTech-Part A benchmark. It can be concluded that the estimation errors of 2U-Net are much better than Zhang et al. [35], Cascaded-MTL [15], SaCNN [39], Switching-CNN [19], ACSCP [40], CP-CNN [41], PCC Net [5], CSRNet [22], and U-ASD Net [4]. Compared to SaCNN [39], SaCNN necessitates more training parameters. Furthermore, SaCNN’s density map has a resolution of 1/8 of the original input, whereas 2U-Net's density map has a resolution of 1/2 of the original image. Compared the 2U-Net model with the UASD-Net, 2U-Net presents better MAE and MSE as well as lower model parameters and computational costs, which proves the balance of efficiency and performance in the 2U-Net model. Furthermore, on a single Tesla V100 GPU, 2U-Net requires 82 ms to process one image from the ShanghaiTech Part A dataset. Considering that individuals in a scene do not walk so fast and not every image should be analyzed, this run-time efficiency is appropriate for a variety of real-time applications. To sum up, 2U-Net presents a parallel architecture that is still lightweight compared to other state-of-the-art approaches, as shown in Tab. 3, which also aims to generate high-quality density maps.
4.5.2 Evaluation on Image Crowd Counting Benchmarks (ShanghaiTech and UCF Benchmarks)
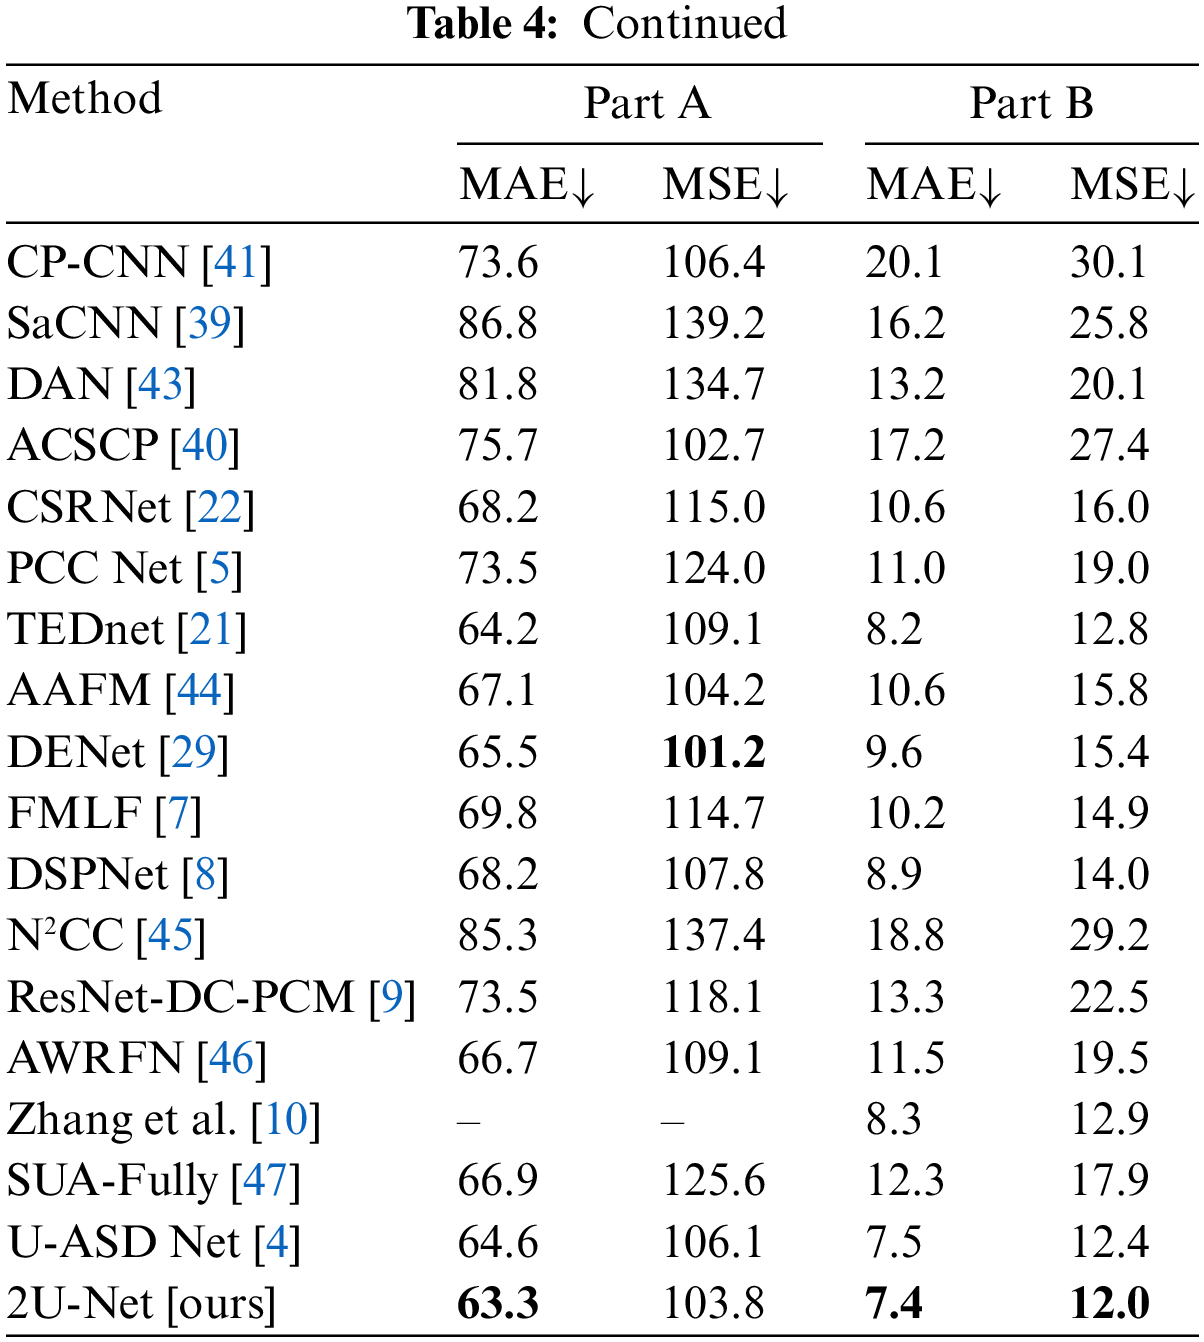
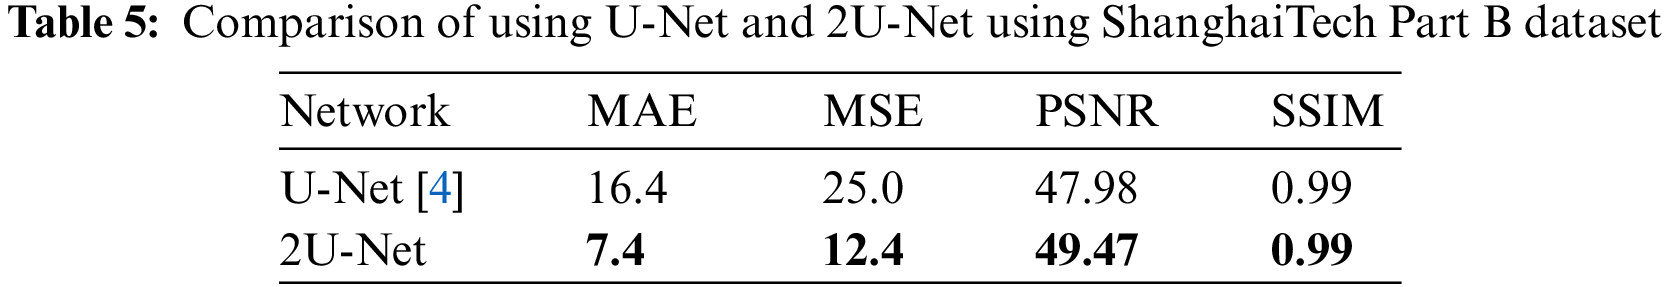
ShanghaiTech Benchmark: Figs. 5 and 6 demonstrate the results of some test crowd images from ShanghaiTech Part A and B, respectively. Figs. 5 and 6b show that the predicted counting result from the proposed 2U-Net is very close to the corresponding counting number of the ground-truth density-map. We compared our findings to those of other models from 2015 to 2021 using the same evaluation metrics: MAE and MSE on the two parts of the ShanghaiTech benchmark in the validation set, and the results are recorded in Tab. 4. Part A of the ShanghaiTech benchmark is a more difficult outdoor dataset with a wider range of crowd densities. Thus, MAE and MSE values are larger than those of Part B. In ShanghaiTech-Part A, our approach achieves an MAE of 63.3, which is lower by 1.3% than UASD-Net [4], while the runtime and the number of parameters are much less as shown previously in Tab. 3. Moreover, it can be noticed that 2U-Net outperforms other learning methods in terms of MAE and acquires the second-best MSE result after DENet [29] and ACSCP [40]. The good performance of DENet [29] is attributed to its model design characteristics, which has two nets, named detection net and encoder-decoder prediction net, and utilizes VGG-16 as a backbone for feature extraction. Despite DENet’s excellent performance, the 2U-Net outperforms it. Moreover, 2U-Net generates higher quality density maps, as will be shown later in Section 4.5.4. In addition, we get the lowest MAE of 7.4 and the lowest MSE of 12.0 in ShanghaiTech-Part B. Furthermore, as shown in Tab. 5, combining two U-Net networks enhances the counting accuracy and improves the quality of the produced density maps.
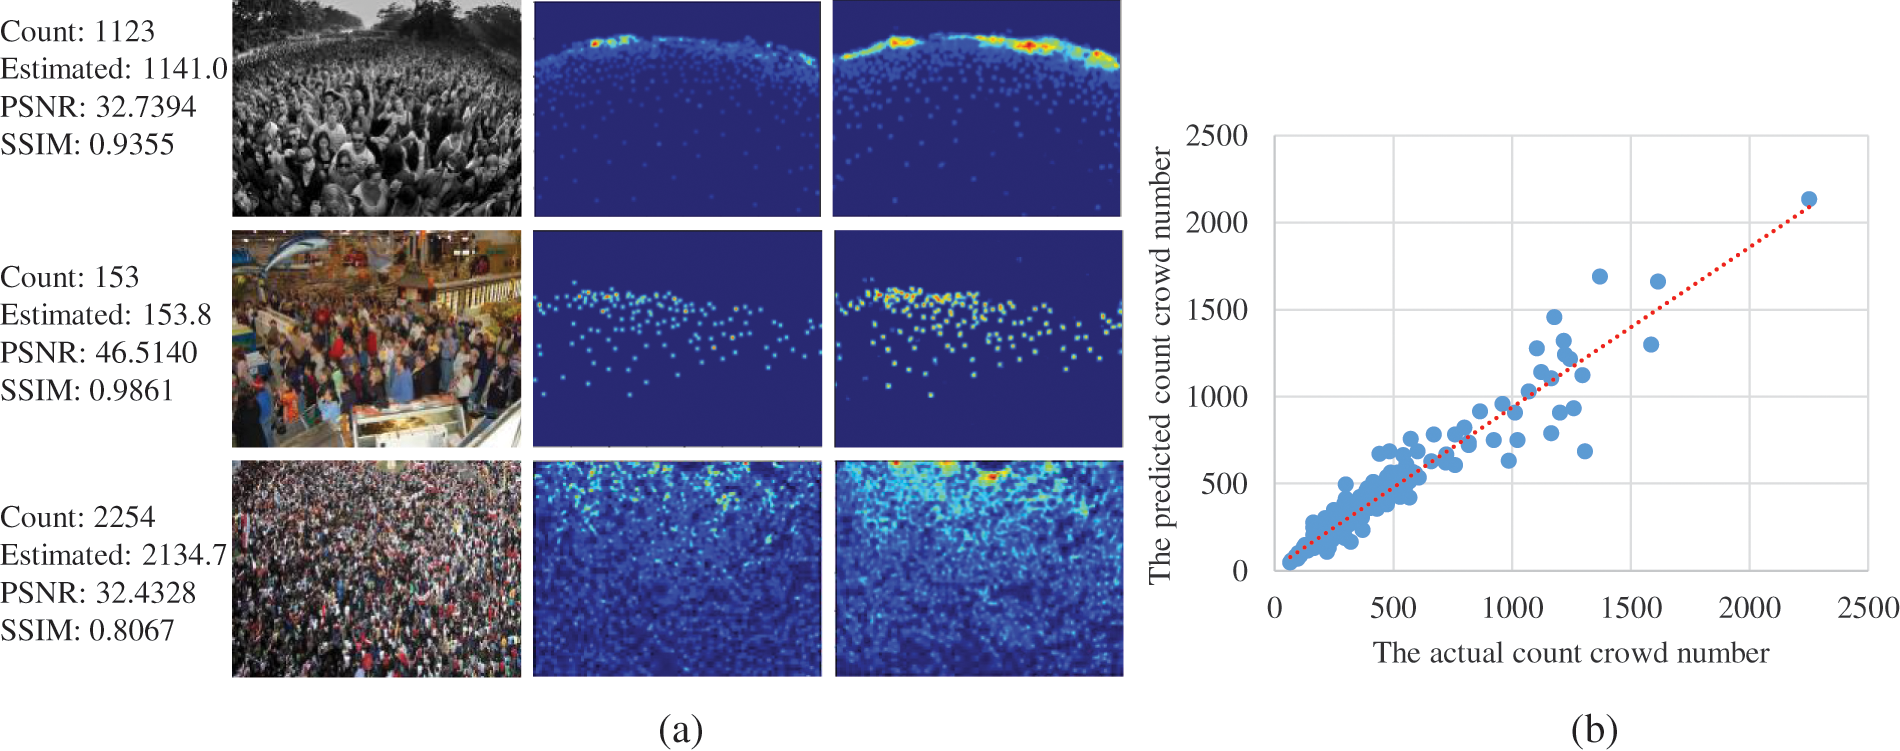
Figure 5: The evaluation results on ShanghaiTech-Part A. (a) Density-map visualization. 1st column: validation images, 2nd column: GT density-map, 3rd column: generated density-map. (b) Scatter plot
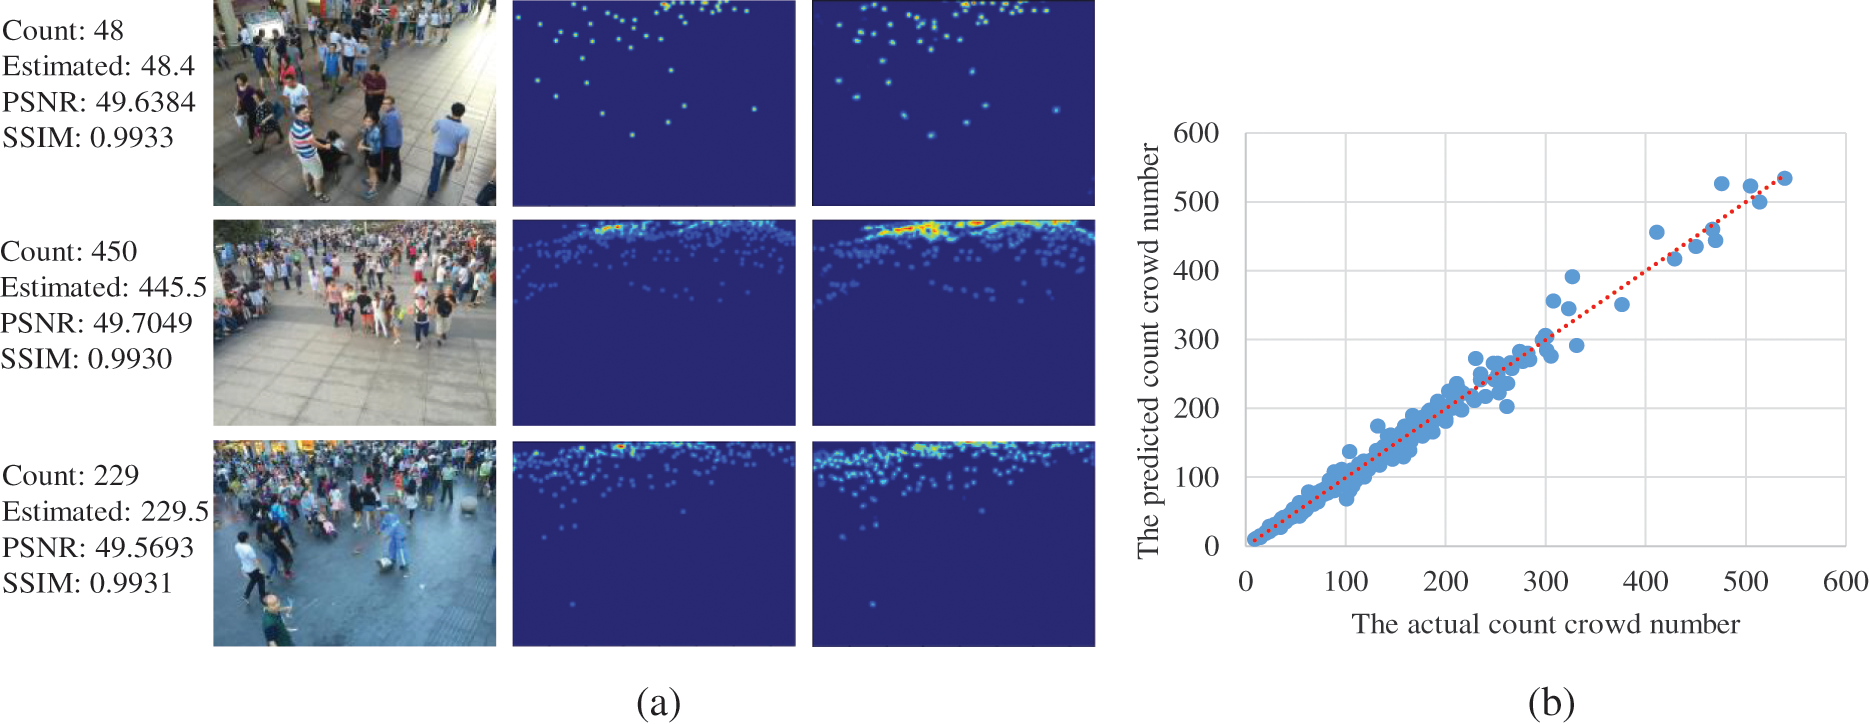
Figure 6: The evaluation results on ShanghaiTech-Part B. (a) Density-map visualization. 1st column: validation images, 2nd column: GT density-map, 3rd column: generated density-map. (b) Scatter plot
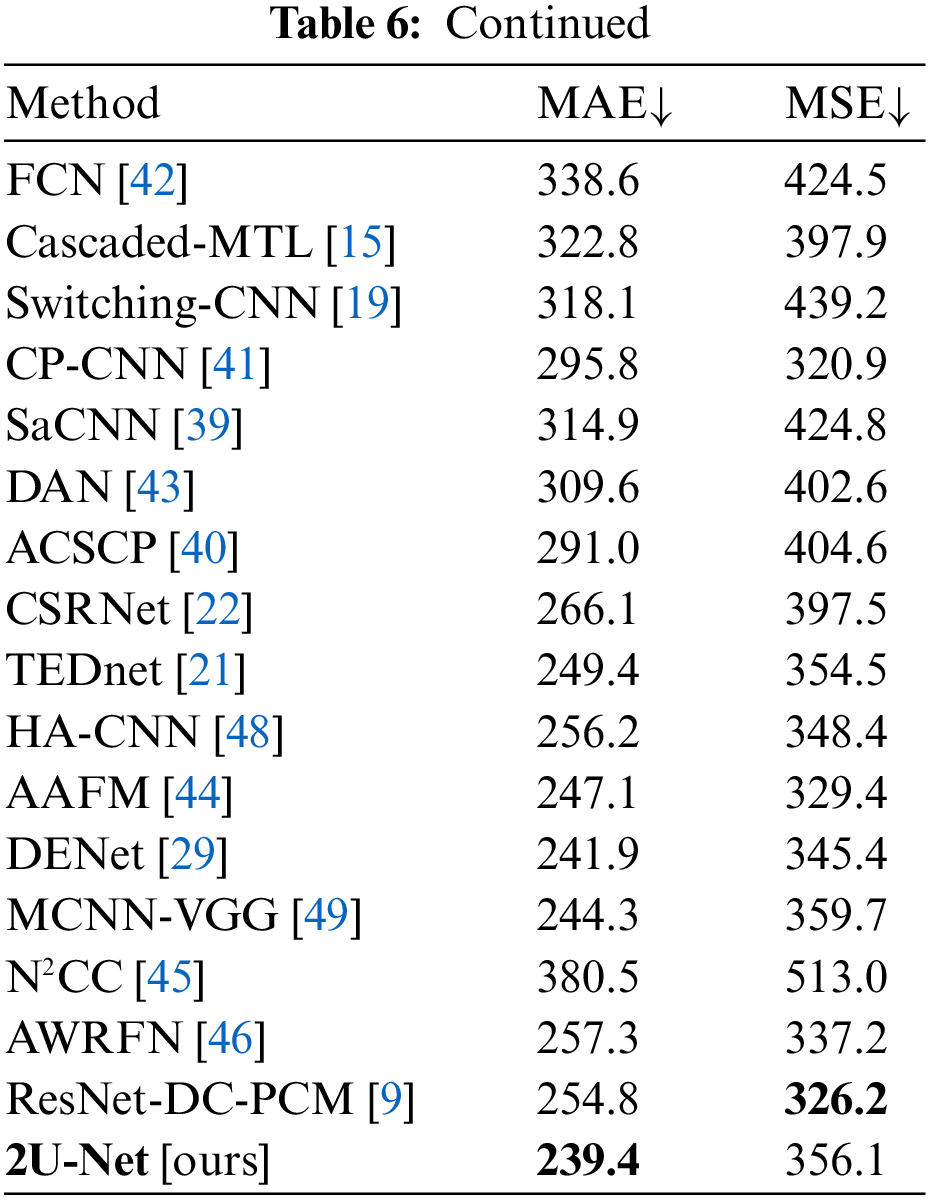
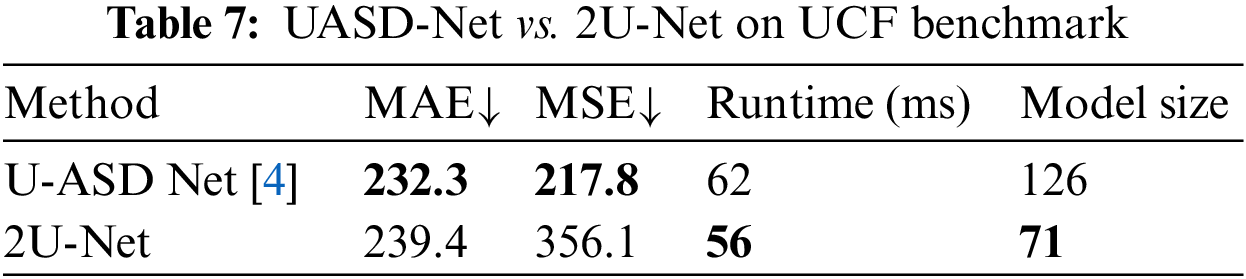
UCF Benchmark: Tab. 6. compares the outcomes of several methods on the UCF benchmark. Unlike the ShanghaiTech benchmark, a five-fold cross-validation technique is utilized in the evaluation of the 2U-Net. Our model acquires 239.4 of MAE and 356.1 of MSE. As shown in Tab. 6, the 2U-Net model achieved comparable performance to those relevant methods in the literature, which proves the counting efficiency of the proposed model in highly condensed crowd scenarios. Furthermore, compared with UASD-Net [4] on UCF, as shown in Tab. 7, 2U-Net offers close results to those of UASD-Net with a lower running time and a lower model size.
4.5.3 Evaluation on Video Crowd Counting Benchmarks (UCSD, Mall, and Haramain Benchmarks)
UCSD Benchmark: Frames with sparse crowd scenes (about 25 on average) are provided in the form of region of interest (ROI) areas in the UCSD dataset. Moreover, because the UCSD dataset is collected from a video, it contains many almost identical images. The MAE and MSE findings for the proposed 2U-Net and eight state-of-the-art approaches are presented in Tab. 8. Our 2U-Net performs competitively against other approaches, with the lowest 1.5 and 1.9 for the MAE and MSE, respectively. Furthermore, the results indicate that 2U-Net slightly outperforms the UASD-Net by 0.2 percent, while 2U-Net provides lower running time and fewer parameters. More results are provided in Fig. 7.
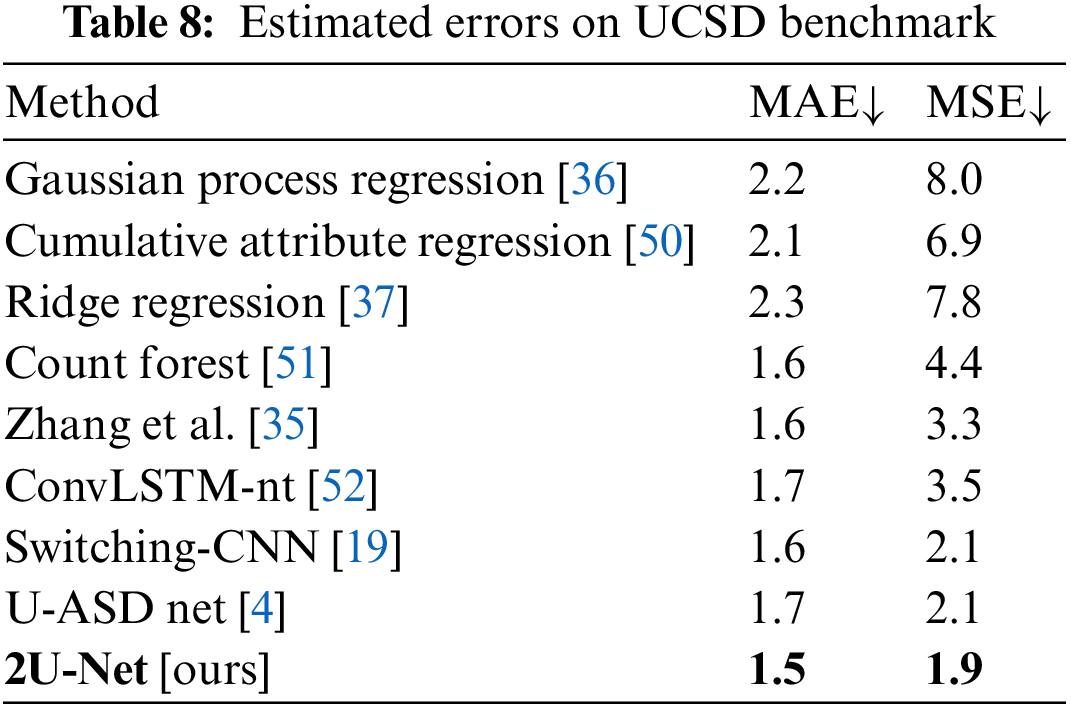
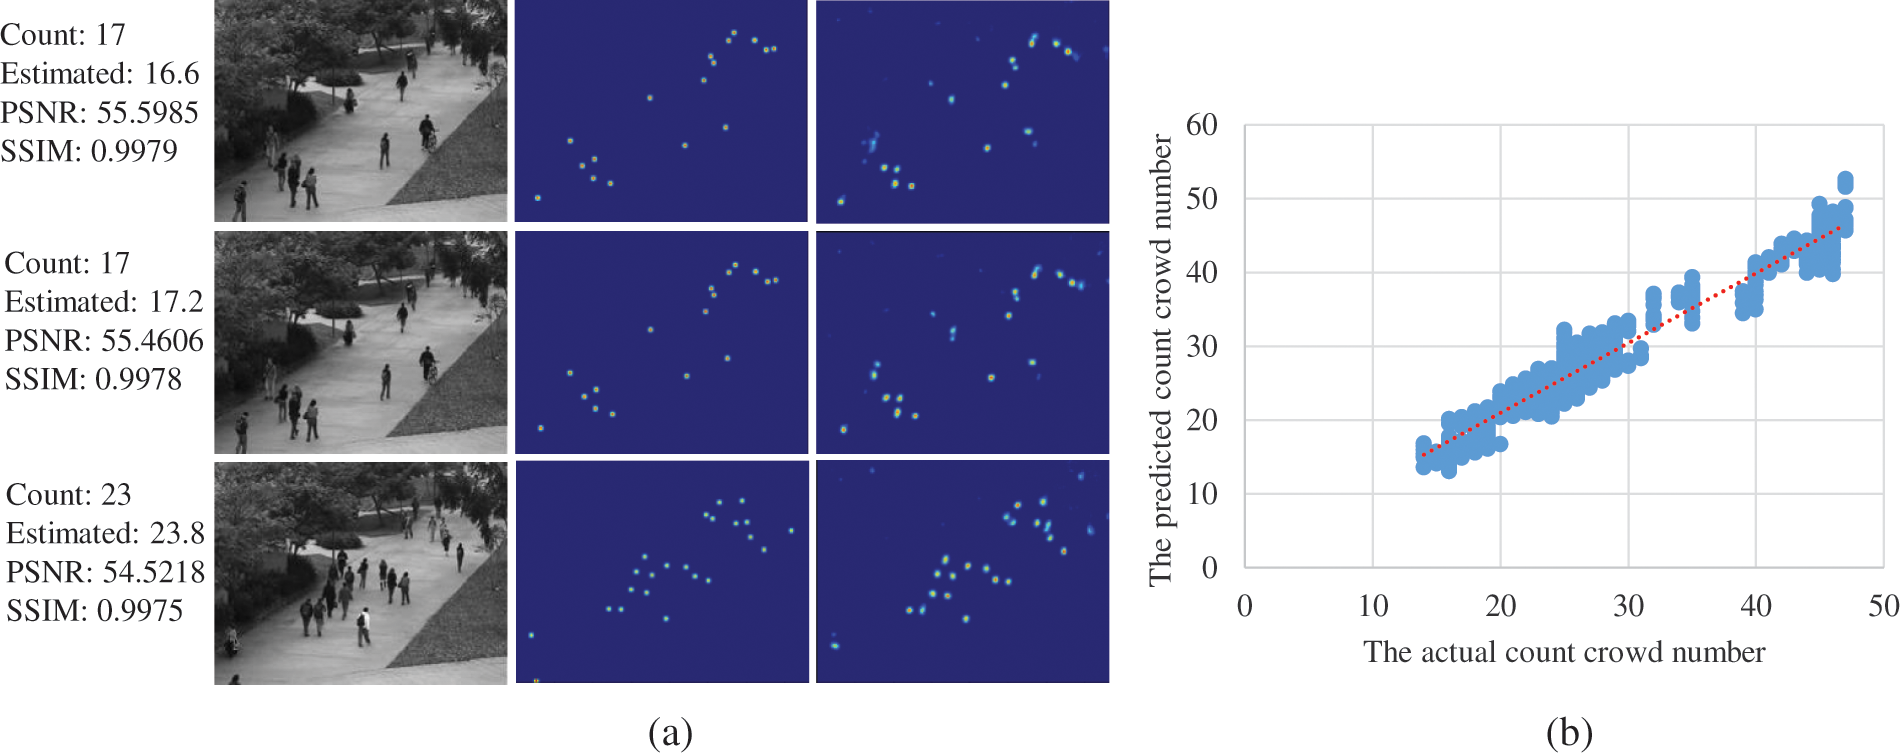
Figure 7: The evaluation results for the UCSD benchmark. (a) Density-map visualization. 1st column: validation images, 2nd column: GT density-map, 3rd column: generated density-map. (b) Scatter plot
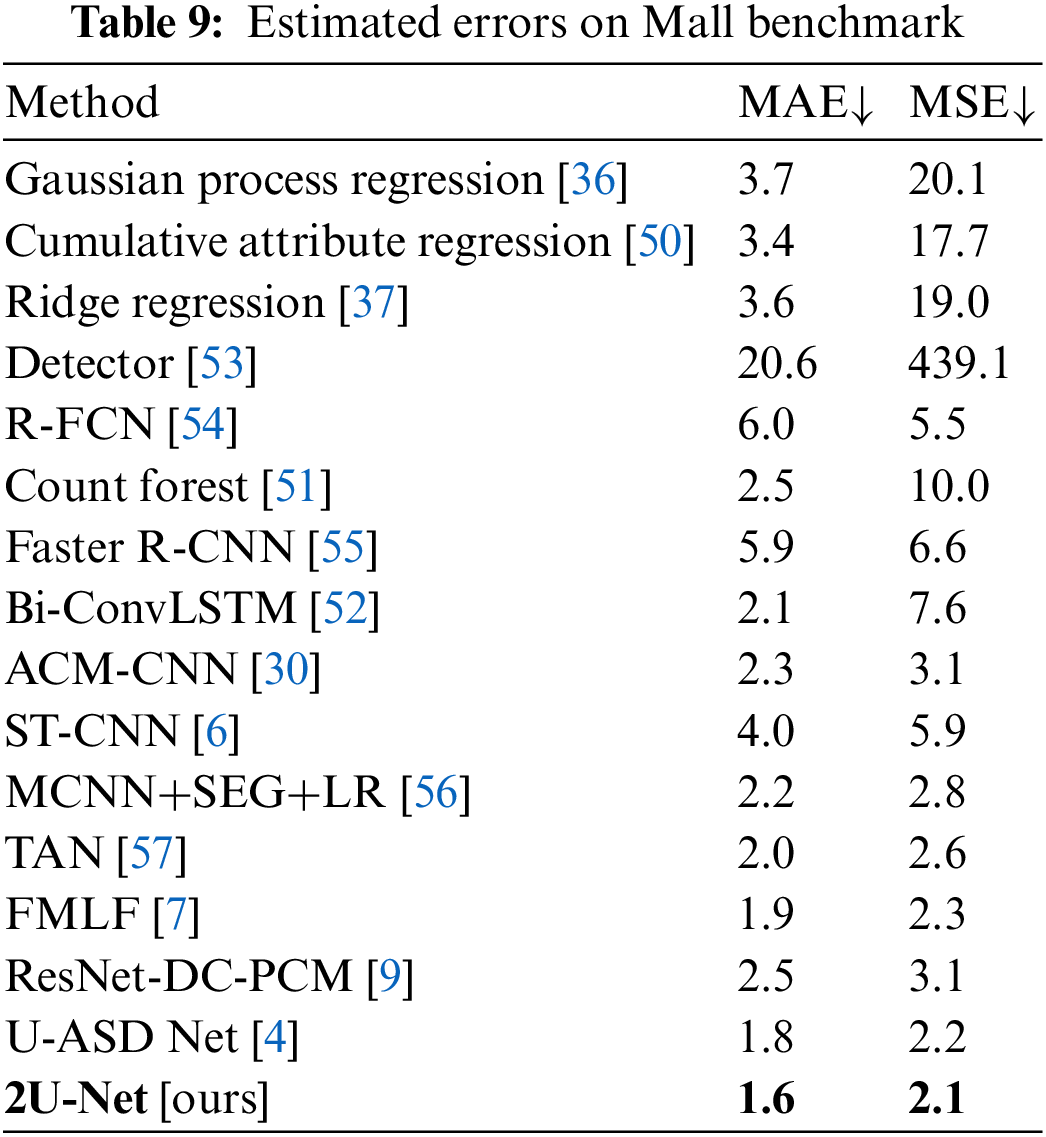
Mall Benchmark: Mall frames have substantially sparse crowds, with an average of 31 people per frame. The results are shown in Fig. 8. We tested the proposed 2U-Net with detection-based, regression-based, and recent deep learning models, as shown in Tab. 9. The performance of conventional detection-based frameworks is less desirable, such as Detector [53], R-FCN [54], and Faster R-CNN [55], with very high values in terms of MAE and MSE, followed by classical regressors such as Gaussian process regression [36], and Ridge regression [37]. As a result of the experimental findings, it can be concluded that regression models based on deep learning frameworks actually increase performance, as evidenced by lower values of MAE and MSE. We can see that our model excels over existing state-of-the-art methods. This demonstrates how well the proposed model works with frames of sparse crowds.
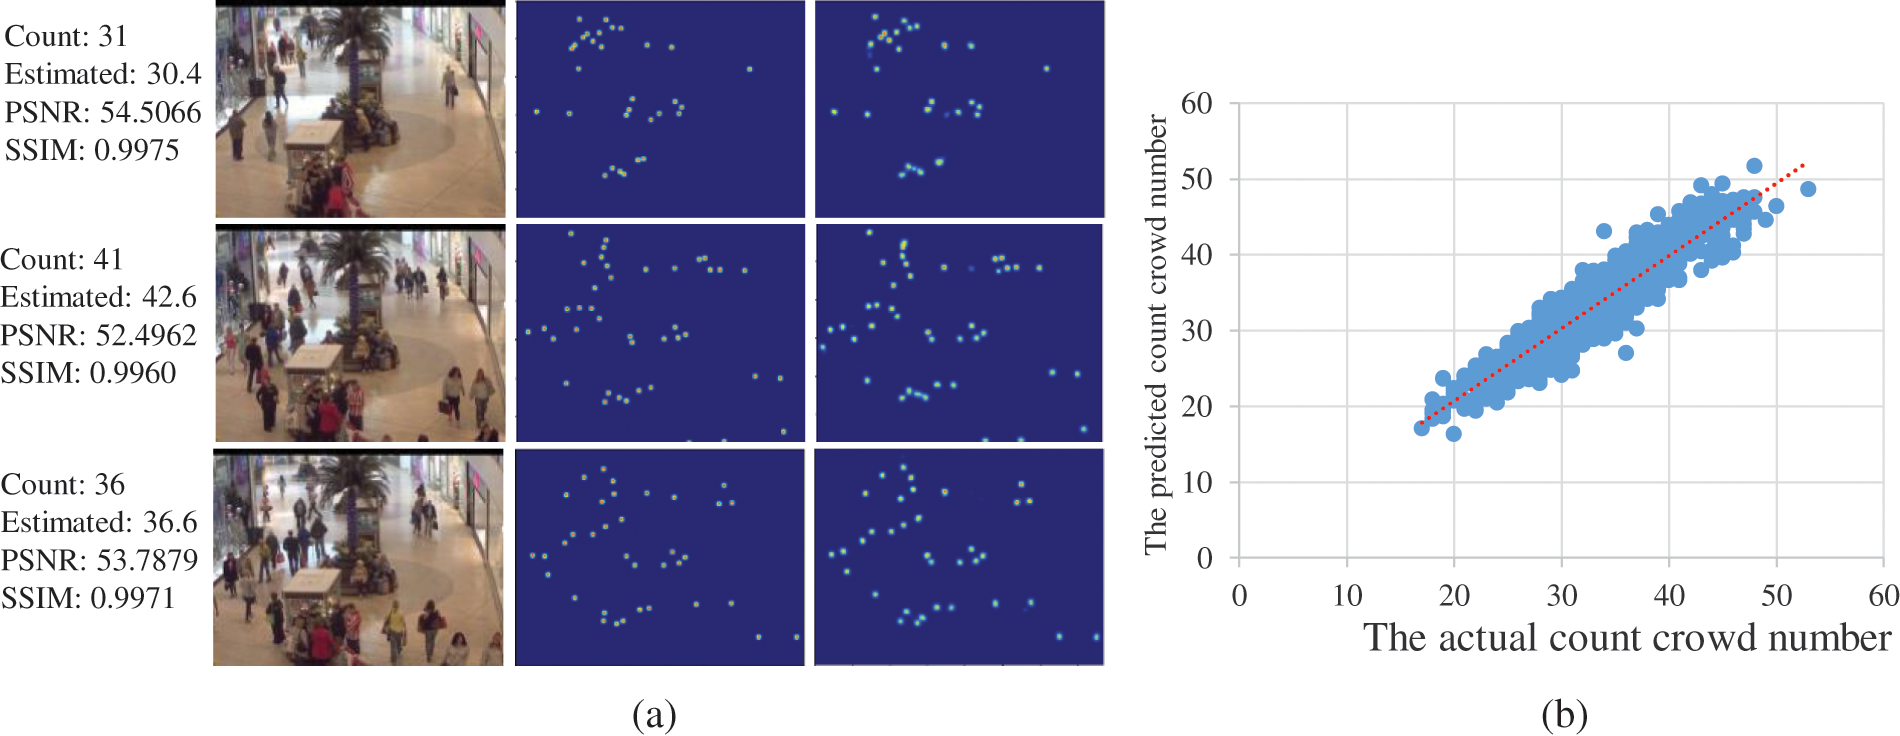
Figure 8: The evaluation results for the Mall benchmark. (a) Density-map visualization. 1st column: validation images, 2nd column: GT density-map, 3rd column: generated density-map. (b) Scatter plot
Haramain Benchmark: As mentioned earlier, 5F-CV has been used to validate Haramin dataset results in order to get tougher, balanced, and optimized results. The entire dataset is randomly split into five equal-sized subsets; a single subset is kept as the validation data for testing the model. The remaining four subsets are utilized as training data. As shown in Tab. 10, 2U-Net outperforms UASD-Net in part Haramain-H2 of the Haramin dataset, and it provides comparable results in parts Haramain-H1 and Haramain-H3. However, 2U-Net succeeds in balancing the performance metrics where it gets comparable MAE and MSE values while reducing the model size by 55 MB and reducing the running time by 20, 9, and 25 ms for Haramain-H1, Haramain-H2, and Haramain-H3, respectively. Fig. 9 presents the quality of the generated density maps. It can be clearly seen that the generated density maps have high quality. The zoom area from the generated density map shows how dense that area is. That belongs to the overall structure of the 2U-Net model and uses the attention units, which help in highlighting the tiny objects.
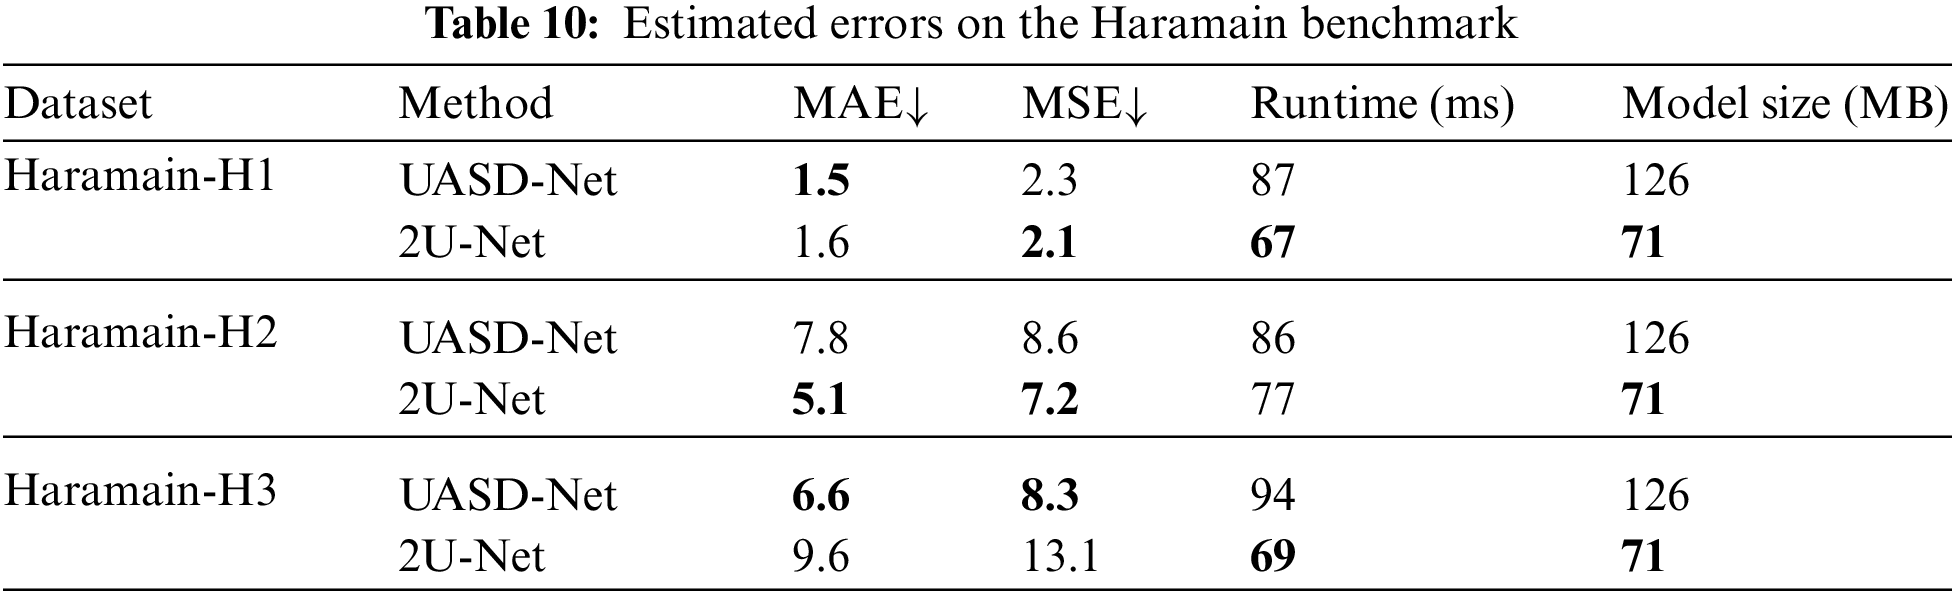
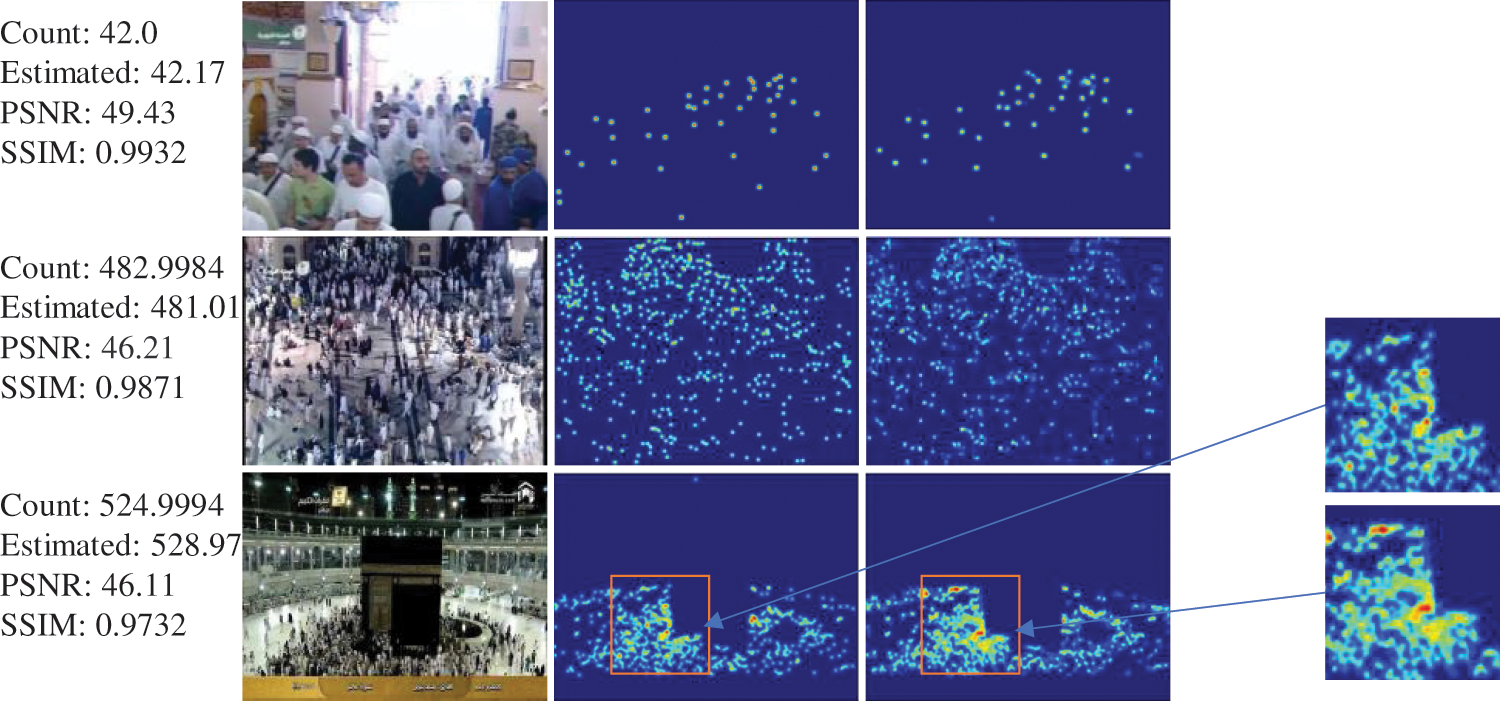
Figure 9: The evaluation results for the Haramain benchmark. 1st column: validation images, 2nd column: GT density-map, 3rd column: generated density-map
4.5.4 Compare The Density-maps Quality
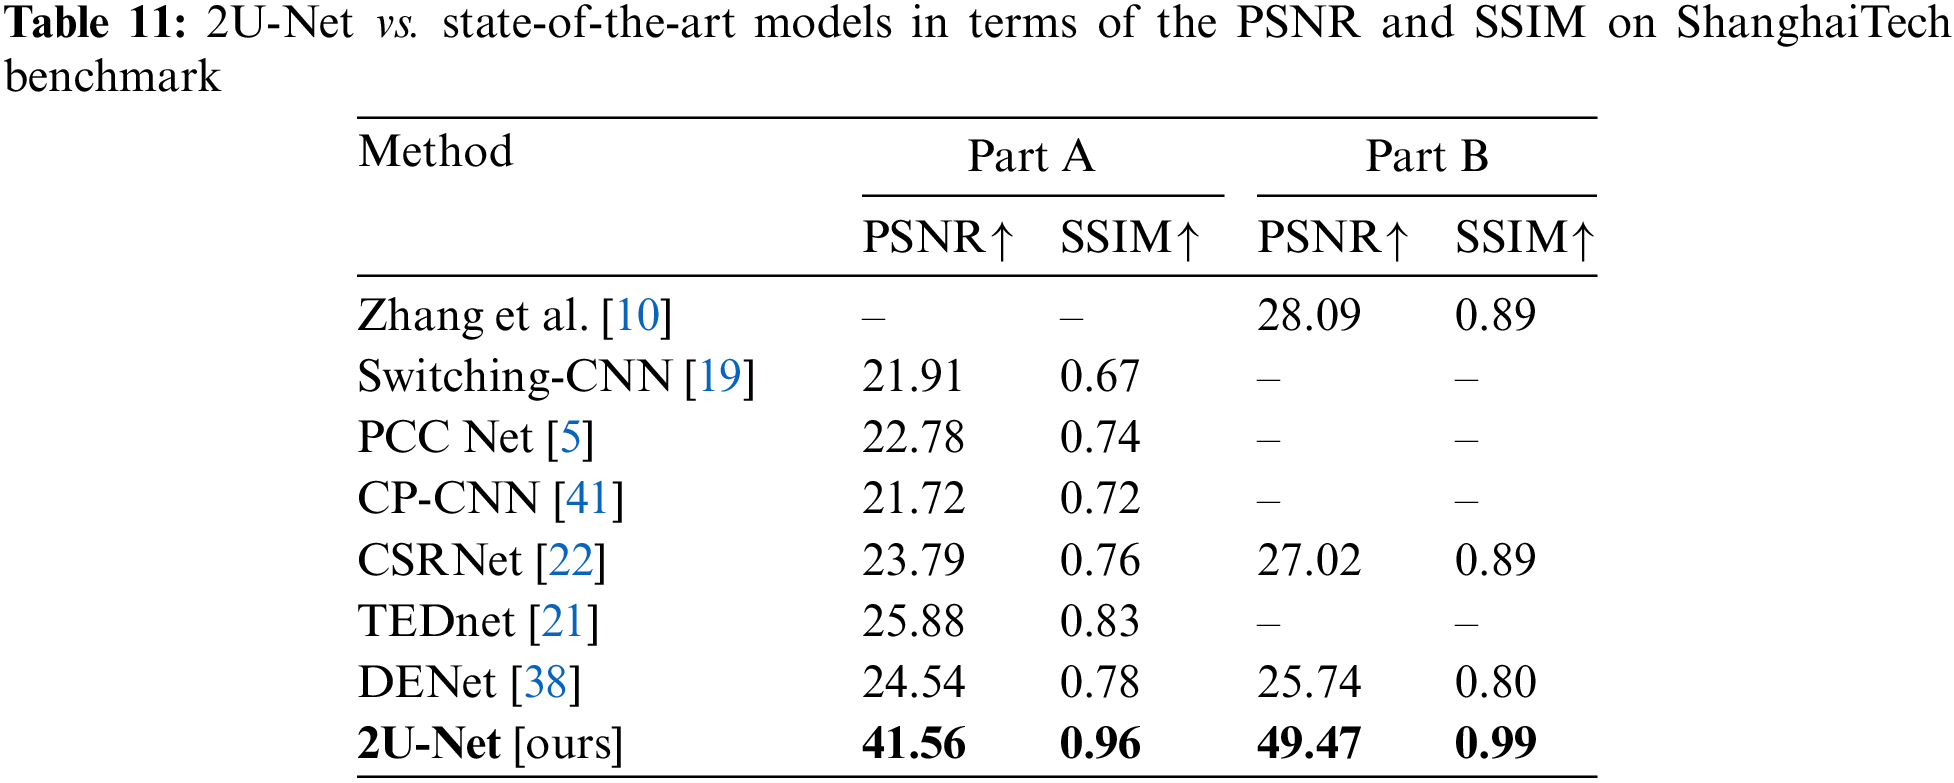
To evaluate the density-map quality generated by the proposed 2U-Net, both PSNR and SSIM metrics were recorded and compared with state-of-the-art methods: Zhang et al. [10], Switching-CNN [19], PCC Net [5], CP-CNN [41], CSRNet [22], TEDnet [21], and DENet [38]. Quantitatively, as shown in Tab. 11, the 2U-Net model outperforms the other models in both PSNR and SSIM metrics on the two parts of the ShanghaiTech dataset. In particular, we gain 15.68% and 0.13% improvements over the second best approach (TEDnet [24]) for PSNR and SSIM metrics on ShanghaiTech-Part A, respectively, and 21.38% and 0.1% improvements on ShanghaiTech-Part B over the second best approach (Zhang et al. [10]).
In this work, we proposed a new end-to-end crowd model that can accurately estimate high-quality crowd density-maps and count the crowd in images and frames, called 2U-Net. By using two-stream U-Net, high counting accuracy has been acquired. The proposed 2U-Net utilizes the unpooling operation to solve the problem of information loss induced by the pooling operations of the U-Net. Besides, a modified attention unit is introduced and integrated into the proposed 2U-Net model to concentrate on crowd regions. The results of the proposed 2U-Net model indicate that the model is effective in estimating high-quality density-maps as well as counting crowds. Furthermore, the 2U-Net model provides comparable results to the UASD-Net model with fewer parameters, lower running time, and a smaller model size. Compared with other state-of-the-art frameworks, it has been demonstrated that our framework achieves a reasonable trade-off between model performance and the number of network parameters.
Currently, our model has certain limitations in some crowd images since it does not account for various characteristics that exist in real-world locations, such as different lighting conditions. We will examine varied illumination settings in future work to lessen the impact of varying illumination on our model. In addition, we plan to apply the proposed model to more real-world use scenarios, especially in the Holy Places of Makkah and Madinah.
Acknowledgement: The authors extend their appreciation to the Deputyship of Research & Innovation, Ministry of Education in Saudi Arabia, for funding this research work through Project Number 758. The authors also would like to thank the Research Management Center of Universiti Teknologi Malaysia for managing this fund under vot. no. 4C396.
Funding Statement: This research work is supported by the Deputyship of Research & Innovation, Ministry of Education in Saudi Arabia (Grant Number 758).
Conflicts of Interest: The authors declare that they have no conflicts of interest to report regarding the present study.
1. J. Xiang and N. Liu, “Crowd density estimation method using deep learning for passenger flow detection system in exhibition center,” Scientific Programming, vol. 2022, no. 7, pp. 1–9, 2022. [Google Scholar]
2. Y. C. Li, R.-S. Jia, Y.-X. Hu, D.-N. Han and H.-M. Sun, “Crowd density estimation based on multi scale features fusion network with reverse attention mechanism,” Applied Intelligence, vol. 28, no. 10, pp. 1–17, 2022. [Google Scholar]
3. E. Felemban, F. U. Rehman, S. A. Biabani, A. Ahmad, A. Naseer et al., “Digital revolution for Hajj crowd management: A technology survey,” IEEE Access, vol. 8, pp. 208583–208609, 2020. [Google Scholar]
4. A. Hafeezallah, A. Al-Dhamari and S. A. R. Abu-Bakar, “U-ASD Net: Supervised crowd counting based on semantic segmentation and adaptive scenario discovery,” IEEE Access, vol. 9, pp. 127444–127459, 2021. [Google Scholar]
5. J. Gao, Q. Wang and X. Li, “PCC Net: Perspective crowd counting via spatial convolutional network,” IEEE Transactions on Circuits and Systems for Video Technology, vol. 30, no. 10, pp. 3486–3498, 2019. [Google Scholar]
6. Y. Miao, J. Han, Y. Gao and B. Zhang, “ST-CNN: Spatial-temporal convolutional neural network for crowd counting in videos,” Pattern Recognition Letters, vol. 125, no. 4, pp. 113–118, 2019. [Google Scholar]
7. X. Ding, F. He, Z. Lin, Y. Wang, H. Guo et al., “Crowd density estimation using fusion of multi-layer features,” IEEE Transactions on Intelligent Transportation Systems, vol. 22, no. 8, pp. 4776–4787, 2020. [Google Scholar]
8. X. Zeng, Y. Wu, S. Hu, R. Wang and Y. Ye, “DSPNet: Deep scale purifier network for dense crowd counting,” Expert Systems with Applications, vol. 141, pp. 112977, 2020. [Google Scholar]
9. J. Zhang, S. Chen, S. Tian, W. Gong, G. Cai et al., “A crowd counting framework combining with crowd location,” Journal of Advanced Transportation, vol. 2021, no. 5, pp. 1–14, 2021. [Google Scholar]
10. S. Zhang, H. Li and W. Kong, “A cross-modal fusion based approach with scale-aware deep representation for RGB-D crowd counting and density estimation,” Expert Systems with Applications, vol. 180, pp. 115071, 2021. [Google Scholar]
11. A. Al-Dhamari, R. Sudirman and N. H. Mahmood, “Transfer deep learning along with binary support vector machine for abnormal behavior detection,” IEEE Access, vol. 8, pp. 61085–61095, 2020. [Google Scholar]
12. W. Sun, G. Dai, X. Zhang, X. He and X. Chen, “TBE-Net: A three-branch embedding network with part-aware ability and feature complementary learning for vehicle re-identification,” IEEE Transactions on Intelligent Transportation Systems, pp. 1–13, 2021. [Google Scholar]
13. W. Sun, L. Dai, X. Zhang, P. Chang and X. He, “RSOD: Real-time small object detection algorithm in UAV-based traffic monitoring,” Applied Intelligence, vol. 92, no. 6, pp. 1–16, 2021. [Google Scholar]
14. Y. Zhang, D. Zhou, S. Chen, S. Gao and Y. Ma, “Single-image crowd counting via multi-column convolutional neural network,” in Proc. of the IEEE Conf. on Computer Vision and Pattern Recognition, Las Vegas, NV, USA, pp. 589–597, 2016. [Google Scholar]
15. V. A. Sindagi and V. M. Patel, “CNN-based cascaded multi-task learning of high-level prior and density estimation for crowd counting,” in Proc. of the 14th IEEE Int. Conf. on Advanced Video and Signal Based Surveillance (AVSS), Lecce, Italy, pp. 1–6, 2017. [Google Scholar]
16. X. Cao, Z. Wang, Y. Zhao and F. Su, “Scale aggregation network for accurate and efficient crowd counting,” in Proc. of the European Conf. on Computer Vision (ECCV), Munich, Germany, pp. 757–773, 2018. [Google Scholar]
17. Y. Miao, Z. Lin, G. Ding and J. Han, “Shallow feature based dense attention network for crowd counting,” Proceedings of the AAAI Conference on Artificial Intelligence, vol. 34, no. 7, pp. 11765–11772, 2020. [Google Scholar]
18. V. Ranjan, H. Le and M. Hoai, “Iterative crowd counting,” in Proc. of the European Conf. on Computer Vision (ECCV), Munich, Germany, pp. 278–293, 2018. [Google Scholar]
19. D. B. Sam, S. Surya and R. V. Babu, “Switching convolutional neural network for crowd counting,” in Proc. of the IEEE Conf. on Computer Vision and Pattern Recognition (CVPR), Honolulu, USA, pp. 4031–4039, 2017. [Google Scholar]
20. Z. Sun, J. Chen, L. Chao, W. Ruan and M. Mukherjee, “A survey of multiple pedestrian tracking based on tracking-by-detection framework,” IEEE Transactions on Circuits and Systems for Video Technology, vol. 31, no. 5, pp. 1819–1833, 2020. [Google Scholar]
21. X. Jiang, Z. Xiao, B. Zhang, X. Zhen, X. Cao et al., “Crowd counting and density estimation by trellis encoder-decoder networks,” in Proc. of the IEEE/CVF Conf. on Computer Vision and Pattern Recognition, Long Beach, CA, USA, pp. 6133–6142, 2019. [Google Scholar]
22. Y. Li, X. Zhang and D. Chen, “CSRNet: Dilated convolutional neural networks for understanding the highly congested scenes,” in Proc. of the IEEE Conf. on Computer Vision and Pattern Recognition, Salt Lake City, UT, USA, pp. 1091–1100, 2018. [Google Scholar]
23. K. Simonyan and A. Zisserman, “Very deep convolutional networks for large-scale image recognition,” Arxiv preprint arXiv: 1409. 1556, 2014. [Google Scholar]
24. X. Wang, C. Chen, Y. Cheng, X. Chen and Y. Liu, “Zero-shot learning based on deep weighted attribute prediction,” IEEE Transactions on Systems, Man, and Cybernetics: Systems, vol. 50, no. 8, pp. 2948–2957, 2018. [Google Scholar]
25. O. Oktay, J. Schlemper, L. Folgoc1, M. Lee, M. Heinrich et al., “Attention U-Net: Learning where to look for the pancreas,” Arxiv Prepr. arXiv1804.03999, 2018. [Google Scholar]
26. D. Bahdanau, K. Cho and Y. Bengio, “Neural machine translation by jointly learning to align and translate,” Arxiv Prepr. arXiv1409.0473, 2014. [Google Scholar]
27. M. Luong, H. Pham and C. D. Manning, “Effective approaches to attention-based neural machine translation,” Arxiv Prepr. arXiv1508.04025, 2015. [Google Scholar]
28. O. Ronneberger, P. Fischer and T. Brox, “U-Net: Convolutional networks for biomedical image segmentation,” in Int. Conf. on Medical Image Computing and Computer-Assisted Intervention, Munich, Germany, pp. 234–241, 2015. [Google Scholar]
29. L. Liu, J. Jiang, W. Jia, S. Amirgholipour, Y. Wang et al., “DENet: A universal network for counting crowd with varying densities and scales,” IEEE Transactions on Multimedia, vol. 23, pp. 1060–1068, 2020. [Google Scholar]
30. Z. Zou, Y. Cheng, X. Qu, S. Ji, X. Guo et al., “Attend to count: Crowd counting with adaptive capacity multi-scale CNNs,” Neurocomputing, vol. 367, no. 10, pp. 75–83, 2019. [Google Scholar]
31. K. A. Darabkh, A. K. Al-Dhamari and I. F. Jafar, “A new steganographic algorithm based on multi directional PVD and modified LSB,” Information Technology and Control, vol. 46, no. 1, pp. 16–36, 2017. [Google Scholar]
32. H. Hiary, K. E. Sabri, M. S. Mohammed and A. Al-Dhamari, “A hybrid steganography system based on LSB matching and replacement,” International Journal of Advanced Computer Science and Applications, vol. 7, no. 9, pp. 374–380, 2016. [Google Scholar]
33. A. K. Al-Dhamari and K. A. Darabkh, “Block-based steganographic algorithm using modulus function and pixel-value differencing,” Journal of Software Engineering and Applications, vol. 10, no. 1, pp. 56, 2017. [Google Scholar]
34. H. Idrees, I. Saleemi, C. Seibert and M. Shah, “Multi-source multi-scale counting in extremely dense crowd images,” in Proc. of the IEEE Conf. on computer vision and pattern recognition, Portland, OR, USA, pp. 2547–2554, 2013. [Google Scholar]
35. C. Zhang, H. Li, X. Wang and X. Yang, “Cross-scene crowd counting via deep convolutional neural networks,” in Proc. of the IEEE Conf. on Computer Vision and Pattern Recognition, Boston, MA, pp. 833–841, 2015. [Google Scholar]
36. A. B. Chan, Z. Liang and N. Vasconcelos, “Privacy preserving crowd monitoring: counting people without people models or tracking,” in Proc. of the IEEE Conf. on Computer Vision and Pattern Recognition, Anchorage, AK, USA, pp. 1–7, 2008. [Google Scholar]
37. K. Chen, C. C. Loy, S. Gong and T. Xiang, “Feature mining for localised crowd counting,” in Proc. of the British Machine Vision Conf. (BMVC), Guildford, England, vol. 1, 2012. [Google Scholar]
38. A. A. H. Allah, S. A. Abu-Bakar and W. A. Orfali, “Sub-difference image of curvelet transform for crowd estimation: A case study at the Holy Haram in Madinah,” Research Journal of Applied Sciences, Engineering and Technology, vol. 11, no. 7, pp. 740–745, 2015. [Google Scholar]
39. L. Zhang, M. Shi and Q. Chen, “Crowd counting via scale-adaptive convolutional neural network,” in Proc. of the IEEE Winter Conf. on Applications of Computer Vision (WACV), Lake Tahoe, NV, USA, pp. 1113–1121, 2018. [Google Scholar]
40. Z. Shen, Y. Xu, B. Ni, M. Wang, J. Hu et al., “Crowd counting via adversarial cross-scale consistency pursuit,” in Proc. of the IEEE Conf. on Computer Vision And Pattern Recognition, Salt Lake City, UT, USA, pp. 5245–5254, 2018. [Google Scholar]
41. V. A. Sindagi and V. M. Patel, “Generating high-quality crowd density maps using contextual pyramid cnns,” in Proc. of the IEEE Int. Conf. on Computer Vision, Venice, Italy, pp. 1861–1870, 2017. [Google Scholar]
42. M. Marsden, K. McGuinness, S. Little and N. E. O’Connor, “Fully convolutional crowd counting on highly congested scenes,” Arxiv Prepr. arXiv1612.00220, 2016. [Google Scholar]
43. H. Li, X. He, H. Wu, S. A. Kasmani, R. Wang et al., “Structured inhomogeneous density map learning for crowd counting,” Arxiv Prepr. arXiv1801.06642, 2018. [Google Scholar]
44. Z. Duan, H. Chen and J. Deng, “AAFM: Adaptive attention fusion mechanism for crowd counting,” IEEE Access, vol. 8, pp. 138297–138306, 2020. [Google Scholar]
45. L. Zhang, L. Yan, M. Zhang and J. Lu, “T2CNN: A novel method for crowd counting via two-task convolutional neural network,” The Visual Computer, pp. 1–13, 2021. [Google Scholar]
46. S. Peng, L. Wang, B. Yin, Y. Li, Y. Xia et al., “Adaptive weighted crowd receptive field network for crowd counting,” Pattern Analysis and Applications, vol. 24, no. 2, pp. 805–817, 2021. [Google Scholar]
47. Y. Meng, H. Zhang, Y. Zhao, X. Yang, X. Qian et al., “Spatial uncertainty-aware semi-supervised crowd counting,” in Proc. of the IEEE/CVF Int. Conf. on Computer Vision, pp. 15549–15559, 2021. https://openaccess.thecvf.com/content/ICCV2021/html/Meng_Spatial_Uncertainty-Aware_Semi-Supervised_Crowd_Counting_ICCV_2021_paper.html. [Google Scholar]
48. V. A. Sindagi and V. M. Patel, “HA-CNN: Hierarchical attention-based crowd counting network,” IEEE Transactions on Image Processing, vol. 29, pp. 323–335, 2019. [Google Scholar]
49. Z. Fan, Y. Zhu, Y. Song and Z. Liu, “Generating high quality crowd density map based on perceptual loss,” Applied Intelligence, vol. 50, no. 4, pp. 1073–1085, 2020. [Google Scholar]
50. K. Chen, S. Gong, T. Xiang and C. Change, “Cumulative attribute space for age and crowd density estimation,” in Proc. of the IEEE Conf. on Computer Vision and Pattern Recognition, Portland, OR, USA, pp. 2467–2474, 2013. [Google Scholar]
51. V. Q. Pham, T. Kozakaya, O. Yamaguchi and R. Okada, “Count forest: Co-voting uncertain number of targets using random forest for crowd density estimation,” in Proc. of the IEEE Int. Conf. on Computer Vision, Santiago, Chile, pp. 3253–3261, 2015. [Google Scholar]
52. F. Xiong, X. Shi and D. Yeung, “Spatiotemporal modeling for crowd counting in videos,” in Proc. of the IEEE Int. Conf. on Computer Vision, Venice, Italy, pp. 5151–5159, 2017. [Google Scholar]
53. R. Benenson, M. Omran, J. Hosang and B. Schiele, “Ten years of pedestrian detection, what have we learned?,” in European Conf. on Computer Vision, Zurich, Switzerland, pp. 613–627, 2014. [Google Scholar]
54. J. Dai, Y. Li, K. He and J. Sun, “R-FCN: Object detection via region-based fully convolutional networks,” Arxiv Prepr. arXiv1605.06409, 2016. [Google Scholar]
55. S. Ren, K. He, R. Girshick and J. Sun, “Faster R-CNN: Towards real-time object detection with region proposal networks,” Arxiv Prepr. arXiv1506.01497, 2015. [Google Scholar]
56. J. He, X. Wu, J. Yang and W. Hu, “CPSPNet: Crowd counting via semantic segmentation framework,” in Proc. of the 32nd IEEE Int. Conf. on Tools with Artificial Intelligence (ICTAI), Baltimore, MD, USA, pp. 1104–1110, 2020. [Google Scholar]
57. X. Wu, B. Xu, Y. Zheng, H. Ye, J. Yang et al., “Fast video crowd counting with a temporal aware network,” Neurocomputing, vol. 403, no. 1, pp. 13–20, 2020. [Google Scholar]
 | This work is licensed under a Creative Commons Attribution 4.0 International License, which permits unrestricted use, distribution, and reproduction in any medium, provided the original work is properly cited. |