DOI:10.32604/cmc.2022.028503
| Computers, Materials & Continua DOI:10.32604/cmc.2022.028503 | |
| Article |
Data Reliability and Sensors Lifetime in Bridge Health Monitoring using LoRaWAN-Zigbee
1Department of Computer Science, College of Science and Arts-Sharourah, Najran University, Najran, Kingdom of Saudi Arabia
2Department of Computer Science, JJTU, Jhunjhunu, Rajasthan, India
*Corresponding Author: Awad Ali. Email: aaomar@nu.edu.sa
Received: 11 February 2022; Accepted: 30 March 2022
Abstract: The Wireless Sensor Network (WSN) is regarded as the fastest expanding technological trend in recent years due its application in a variety of sectors. In the monitoring region, several sensor nodes with various sensing capabilities are installed to gather appropriate data and communicate it to the gateway. The proposed system of the heterogeneous WSN employing LoRaWAN-Zigbee based hybrid communication is explored in this research study. To communicate in a network, two Long–Range Wide Area Network (LoRaWAN) sensor clusters and two Zigbee sensor clusters are employed, together with two Zigbee and LoRaWAN converters. The suggested Golden eagle shepherd optimization (GESO) method then forms Zigbee as well as LoRaWAN networking clusters. Furthermore, depending on energy usage and data packet size, the fitness of each sensor node is assessed using the Dynamic Intelligent Reasoning Based Neural (DIRN) approach. MATLAB software is used to implement and execute this study. When the Zigbee network’s transmission distance is 650 m and the LoRaWAN network’s transmission range is 3.5 km, the system can function with a packet loss rate of less than 0.04 percent. This study shows significant gains in the performance of the system when compared to traditional approaches based on digital findings obtained on software solutions.
Keywords: Zigbee; LoRaWAN; wireless sensor network; health monitoring; routing protocol
Wireless sensor networks (WSNs) have gotten a lot of interest in the last several years, both from academia and business [1]. Moreover, the Industrial Internet of Things (IoT), Environmental monitoring, health management, contact tracing, and intelligent transportation are just a few of the sectors and disciplines where WSN has been extensively used [2]. To gather contextual factors and interact with the sensor nodes and the base station through communication networks, these devices consist of multiple sensors to be deployed over an area [3]. Even though many studies assume that sensor nodes in WSNs are homogenous, such systems need not appear. In terms of starting energy level & energy degradability, even industrially manufactured homogenous sensors offer a wide range of capabilities [4]. Furthermore, big WSNs frequently use a variety of sensors as well as protocols to collaborate, resulting in heterogeneous WSNs [5]. Clustering, radio optimization, data compression, sleep but rather wake-up procedures, energy-aware routing protocols, and energy generation are some of the strategies used to build software and hardware components in WSNs concurrently [6].
Consequently, Bluetooth, BLE, Wi-Fi, NB-IoT, LoRaWAN, Zigbee, and LTE-M are just a few of the WSN network topologies that have been created [7,8]. Specifically, Zigbee and LoRaWAN are becoming more popular in WSNs due to their exceptional technological benefits. ZigBee technology is a high-level communication system based on the IEEE 802.15.4 standard that uses low-power radio transmissions with an Institute of Electrical and Electronics Engineers shortwave frequency [9,10]. Star, tree, and mesh topologies are available in Zigbee [11]. Mesh topology is commonly used in WSNs since it provides for continual communication and the ability to modify network settings as packets pass from one node to the next [12]. Every node in the meshes may communicate with its neighbors and route traffic between each other [13]. LoRaWAN, which stands for “broad frequency range,” is a novel IoT communication especially focused on the LoRaWAN communication network [14]. The LoRaWAN technology is built on the chirp spread spectrum technique, which can link to sensors in rural locations that are more than 15 to 30 miles apart [15].
The frequency of up-chirps rises over time, while the frequency of down-chirps drops. This method reduces the receiver circuit’s complexity as well as accuracy while outperforming standard modulation techniques like frequency shift keying [16,17]. Furthermore, LoRaWAN provides several advantages, including frequency-free operating and simple installation. The challenge of WSN coverage extension can be solved by using the LoRaWAN technology [17]. As a result, ensuring Quality of Service (QoS) and optimizing resource allocation in diverse WSNs pose a variety of issues [18]. Also, supervised learning [19], intelligent method, the fuzzy logic method [20], and so on are utilized for the LoRaWAN and Zigbee communication [21]. Yet, the optimal solution is not achieved due to poor performance. The sensors are categorized to the cluster network in this study, which investigates a heterogeneous WSN depending on Zigbee as well as LoRaWAN connectivity. In addition, a LoRaWAN-based Wi-Fi gateway is used to send data to the server. At no additional expense, the solution provides interoperability with current Zigbee networks and combines LoRaWAN to address coverage extension in heterogeneous WSN. Nevertheless, network longevity and dependability are serious issues. As a result, the sensor node’s health must be monitored. The following is the work’s key contribution:
• Two Zigbee clusters and two LoRaWAN clusters are proposed for a heterogeneous WSN depending on Zigbee as well as LoRaWAN connectivity. The Zigbee, as well as LoRaWAN, are connected in the network communication using bridges. Temperature/humidity, pH sensors, gas, light intensity, and turbidity sensors are just a few of the sensors that may be connected to the system.
• The suggested Golden eagle shepherd optimization (GESO) method then forms Zigbee and LoRaWAN networking clusters.
• Then, depending on the energy usage and data packet size, the health of every sensor node is assessed using the Dynamic Intelligent Reasoning Based Neural approach.
• The outcomes from the proposed method are compared with the conventional methods in terms of packet loss, throughput, network lifespan, end-to-end delay, and so on.
The following is a breakdown of the paper’s structure. The second section focuses on the literature review. The third section includes a description of the system model and its issue. The suggested system is described in depth in Section 4. The system performance and comparative analysis are explained in Section 5. Section 6 of the article concludes with a discussion of the study’s future potential.
Some of the recent works correlated to this research are summarized as follows: These networks’ terminal devices connect with all gateways within their respective ranges, wasting energy in duplicated transmissions. Gupta et al., [22] investigated whether LoRaWAN networks may benefit from clustering, and proposed two methods for this kind of networks: path-based as well as data-centric. Examine how several nodes, node range, and cluster range affect transmitting data energy consumption.
Klaina et al. [23] established numerous hypothetical scenarios for big farm monitoring employing LPWAN-based near-ground sensor nodes with the engagement of both tractors as well as landowners. Cloud-based platforms for LoRaWAN, Sigfox, and NB-IoT networking verify the suggested systems, enabling highly scalable technologies to allow interactive agricultural activities.
The majority of WSNs comes with a battery that has a finite lifespan. The maximum functioning of these systems necessitates the use of additional electricity. Developing LoRaWAN has become a significant problem in today’s world, and it is critical to predicting their performance and power consumption for numerous applications. Rao et al. [24] presented a power consumption system based on LoRa & Zigbee protocols that enable wireless sensor nodes to detect and quantify power usage in a cyclic sleeping situation. Practical findings show that the developed LoRa WSNs nodes have an interest in real IoT applications when compared to Zigbee sensor networks in terms of communication distance, network information, broadcasting speed, and energy consumption.
The majority of extant study focuses on enhancing sleep scheduling tactics and deployment methodologies, either alone or together, to extend network lifetime. Nevertheless, mesh network congenital abnormalities cannot be eliminated. Wu et al. [25] designed a LoRaWAN-based WSN and investigated its energy-efficient management strategy to address technological obstacles. The simulation and experimental findings proved that at various times, most nodes have the very same energy output, and the network lifespan is maximized.
Lombardo et al. [26] compared the transmission rate of two of the most widely used IoT development tools in key situations. For the aforementioned application cases, the most widely used path-loss features are discussed. A multiprotocol wireless sensing cluster design utilizing both broadcasting protocols is detailed to evaluate and analyze the performance.
Evaluating signal strength to forecast packet delivery may be a useful technique for ensuring the reliability of wireless networks. To address this issue, Guerrero et al. [27] used the LoRaWAN network protocols to investigate the practical applicability of this concept from the end-device aspect. Correlations between connection parameters at the edge router and the reality that a packet is accepted at the gateway have been discovered through an examination of the collected traces. The findings show that in all of the instances studied, it can know the delivery of packets.
As a result, they can’t tell the difference between infrequent data abnormalities created by genuine occurrences in sensed data on the one hand, and failure data misinterpretation on the other. Widhalm et al. [28] donated fully accessible sensor node architecture for sensor activities like monitoring systems. It is mostly made up of low-power parts to ensure long battery life. Unlike another sensor network, this platform has self-diagnostic features that ensure active node dependability. With both extended battery life & high-quality information, this enhances the overall dependability of WSNs. Compatibility amongst IoT wireless technology protocols is still restricted, according to the preceding research. There is currently no perfect solution for heterogeneous WSN using Zigbee as well as LoRaWAN. This is what motivates us to create a system that integrates different wireless network technologies into a heterogeneous WSN.
A heterogeneous WSN depending on Zigbee as well as LoRaWAN communication is suggested in this section. The LoRaWAN sensor cluster, Zigbee sensor cluster, and gateway are the four primary pieces that make up this WSN technically. Nodes may interact with one another over a small distance using a Zigbee and LoRaWAN converter operating in the 2 GHz band. LoRaWAN sensor clusters are made up of LoRaWAN sensing devices that communicate over long distances using 340 MHz bands and a modest transmission range. The Zigbee and LoRaWAN conversion, which is positioned close to the Zigbee cluster, converts the Zigbee transmission to LoRaWAN.
The interior LoRaWAN gateway is installed in a public Wi-Fi hotspot. With such a framework, we can simply expand the system to include 30 Zigbee and 62 LoRaWAN sensor nodes. The system model of heterogeneous WSN is shown in Fig. 1.
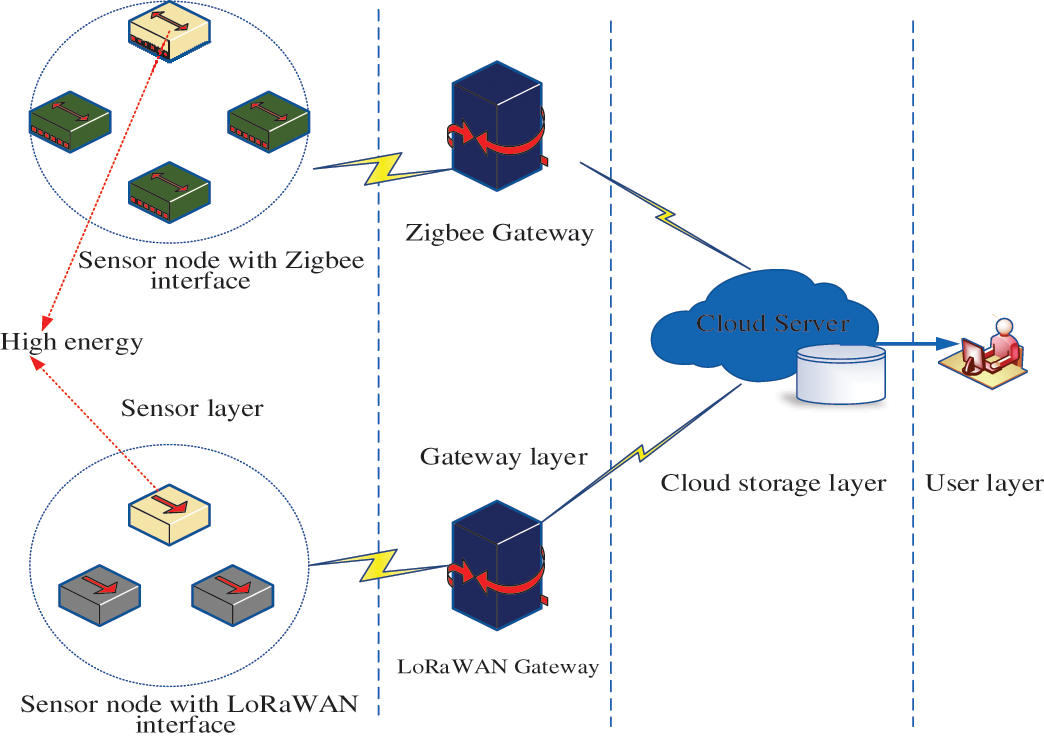
Figure 1: The system model of heterogeneous WSN
Sensor nodes must be deployed and associated data must be sent to the information center in contemporary monitoring systems. WSNs are typically used in tough settings with vibration, changes in temperature, congestion, humidity, and other factors. Due to the difficulty of access, sensor node batteries are never changed. To enable accurate data capture while running unsupervised and over long periods, sensor nodes must be dependable and energy-efficient. The majority of extant study focuses on enhancing rest scheduling tactics and deployment methodologies, either alone or together, to extend network lifetime. However, mesh network congenital abnormalities cannot be eliminated.
The proposed methodology of the WSN health monitoring is illustrated in Fig. 2. Here, are the performance of Zigbee and LoRaWAN based communication sensor node systems for the data reliability and network lifetime analysis. The Zigbee and LoRaWAN system-based sensor nodes like Temperature/humidity, pH sensors, gas, light intensity, and turbidity sensors are formed as two modes of cluster individually.
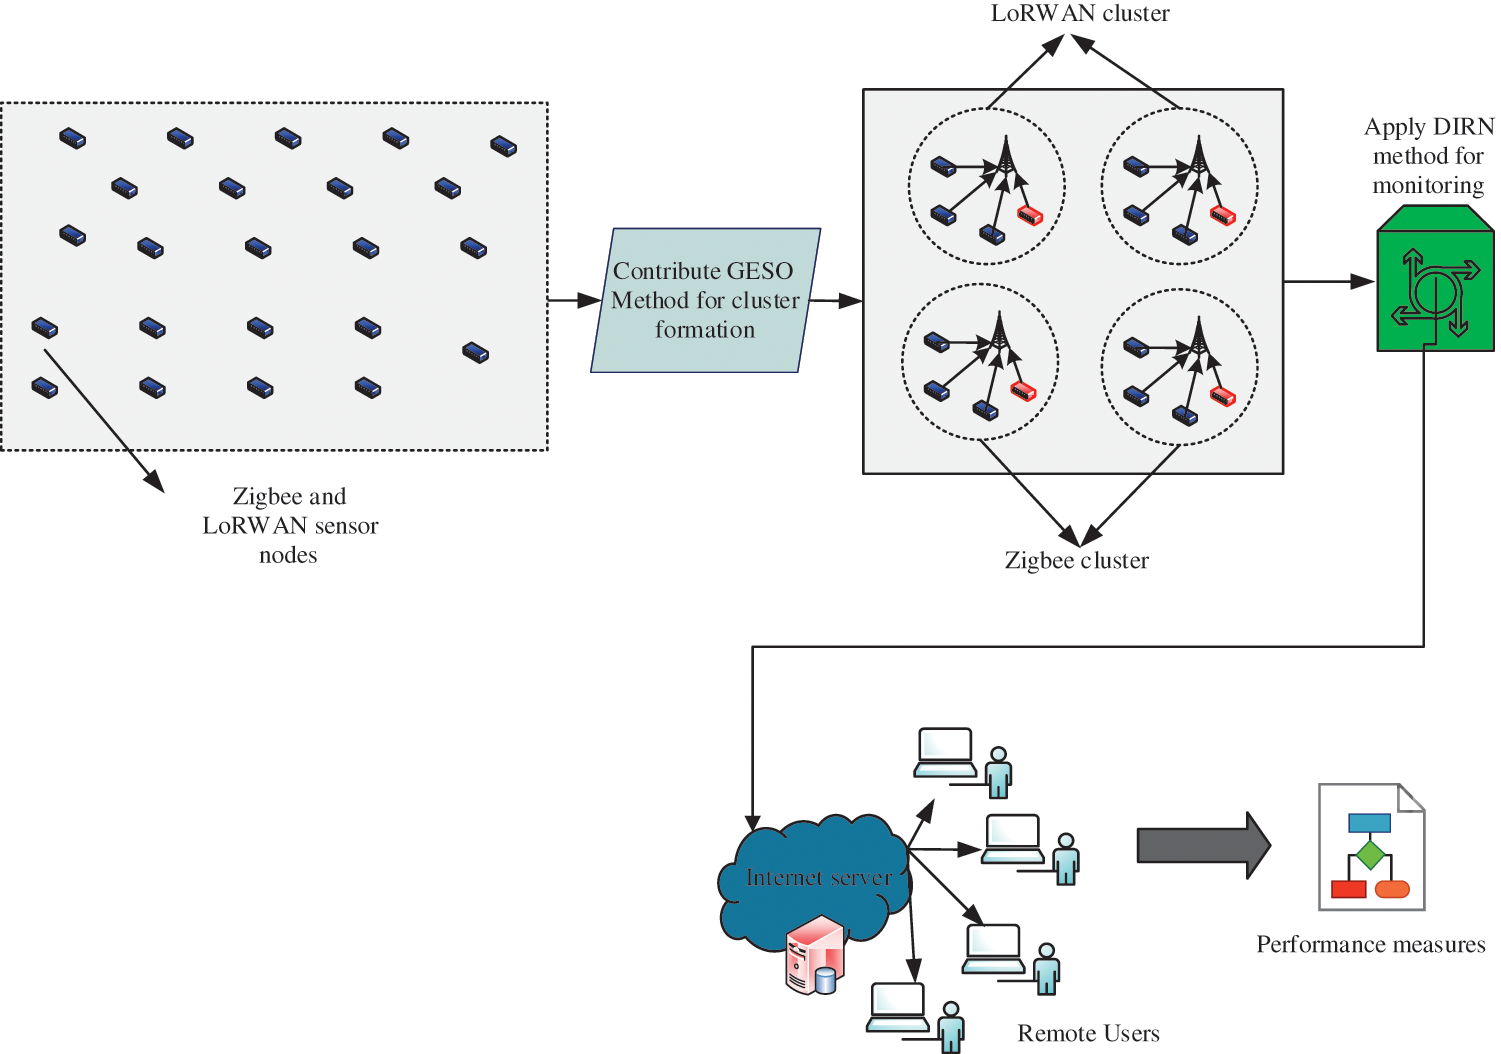
Figure 2: The proposed methodology of the network health monitoring
The clusters are selected and formed using the GESO algorithm and the network lifetime and packet delivery rate is evaluated using the DIRN method. The performance of the proposed method is validated with the different parameters like throughput, network lifetime, end-to-end delay, packet loss, alive nodes, and so on. The description of the proposed approach in Zigbee and LoRaWAN based network communication is explained in following sections.
4.1 GESO Based Clustering Formation
The GESO algorithm is the combination of the golden eagle and shuffle shepherd optimization method. The fitness of each algorithm is combined to develop a new algorithm named GESO. Shepherds form herds of horses or other animals, depending on the animals’ innate instincts to choose the best path to pasture. For this purpose, the shepherd herds sheep alongside horses. The fitness of hunting and surrounding behaviors is taken into account for the assessment of the golden eagle technique. The GESO was created as a result of this behavior. Fig. 3 shows a flow diagram of the suggested GESO algorithm’s performance.
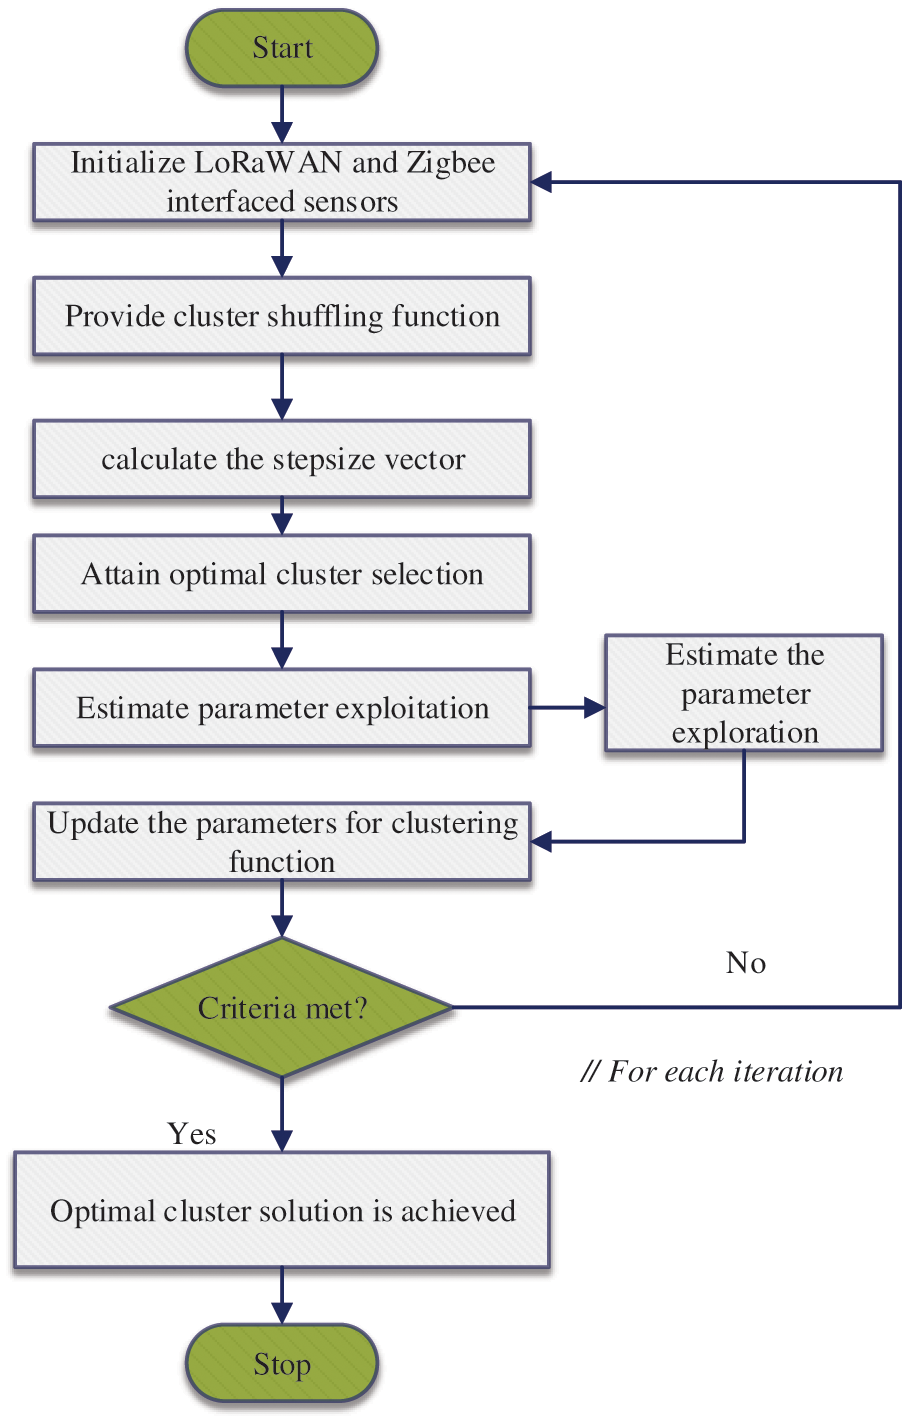
Figure 3: Flow diagram of proposed GESO based node clustering
Initialization: Throughout each cycle, each parameter chooses the activation of p another parameter q at random and circles around the best point that parameter q has visited thus far. Since the parameter may pick to cycle has its memory, have
where
Cluster Shuffling: The initial members p of each population are randomly placed in the first column of the multi-cluster conditions Eq. (3) in this approach based on their goal functions as the other members of each population. The subsequent p members are chosen in the same way as the previous step and are organized in a random order in the section to create the second column of the multi-cluster parameter. This procedure is continued q until the following multi-cluster matrix is created:
It’s worth noting that each row of the multi-cluster parameter reflects an individual from each cluster, with the top column being the best people from each cluster. Furthermore, the persons in the last segment are the weakest variable in the cluster.
Optimal Cluster Selection: To establish a specific step size for each member of the group, two factors are utilized. The potential to explore more areas of the solution space is shown by the first variable
The Eq. (5) is used to calculate the worst and best functions of step size for adjusting the parameter,
where
Parameter exploitation: A vector that starts at the current state of the parameter and ends at the parameter’s location in the classification memory can be used to illustrate the approach. In addition, Eq. (7) may be used to find the p parameter’s entry point.
where
Parameter exploration: The exploration is computed using exploitation. The exploration is tangential to the circle and perpendicular to the exploitation. The n-dimensional exploration takes place within the perpendicular hyperplane of the circle. To calculate the exploration, the solution of the perpendicular hyperplane is calculated. A random point from a hyperplane and a perpendicular component to that hyperplane referred to as the hyperplane’s coordinates can be used to compute the expression of a hyperplane in n dimensions. In n-dimensional space, Eq. (8) represents the scalar version of the hyperplane solution.
where
The arbitrary target point of the cruise hyperplane is discovered. Eq. (9) shows the general form of the exploration hyperplane’s goal destination,
It is obvious that as the number of iterations s grows,
Parameter Updating: According to the preceding stage, the new parameter
Termination: After a chosen Maximum iteration, the optimization procedure will be completed. If it doesn’t, it goes back to step one for another round of repetitions.
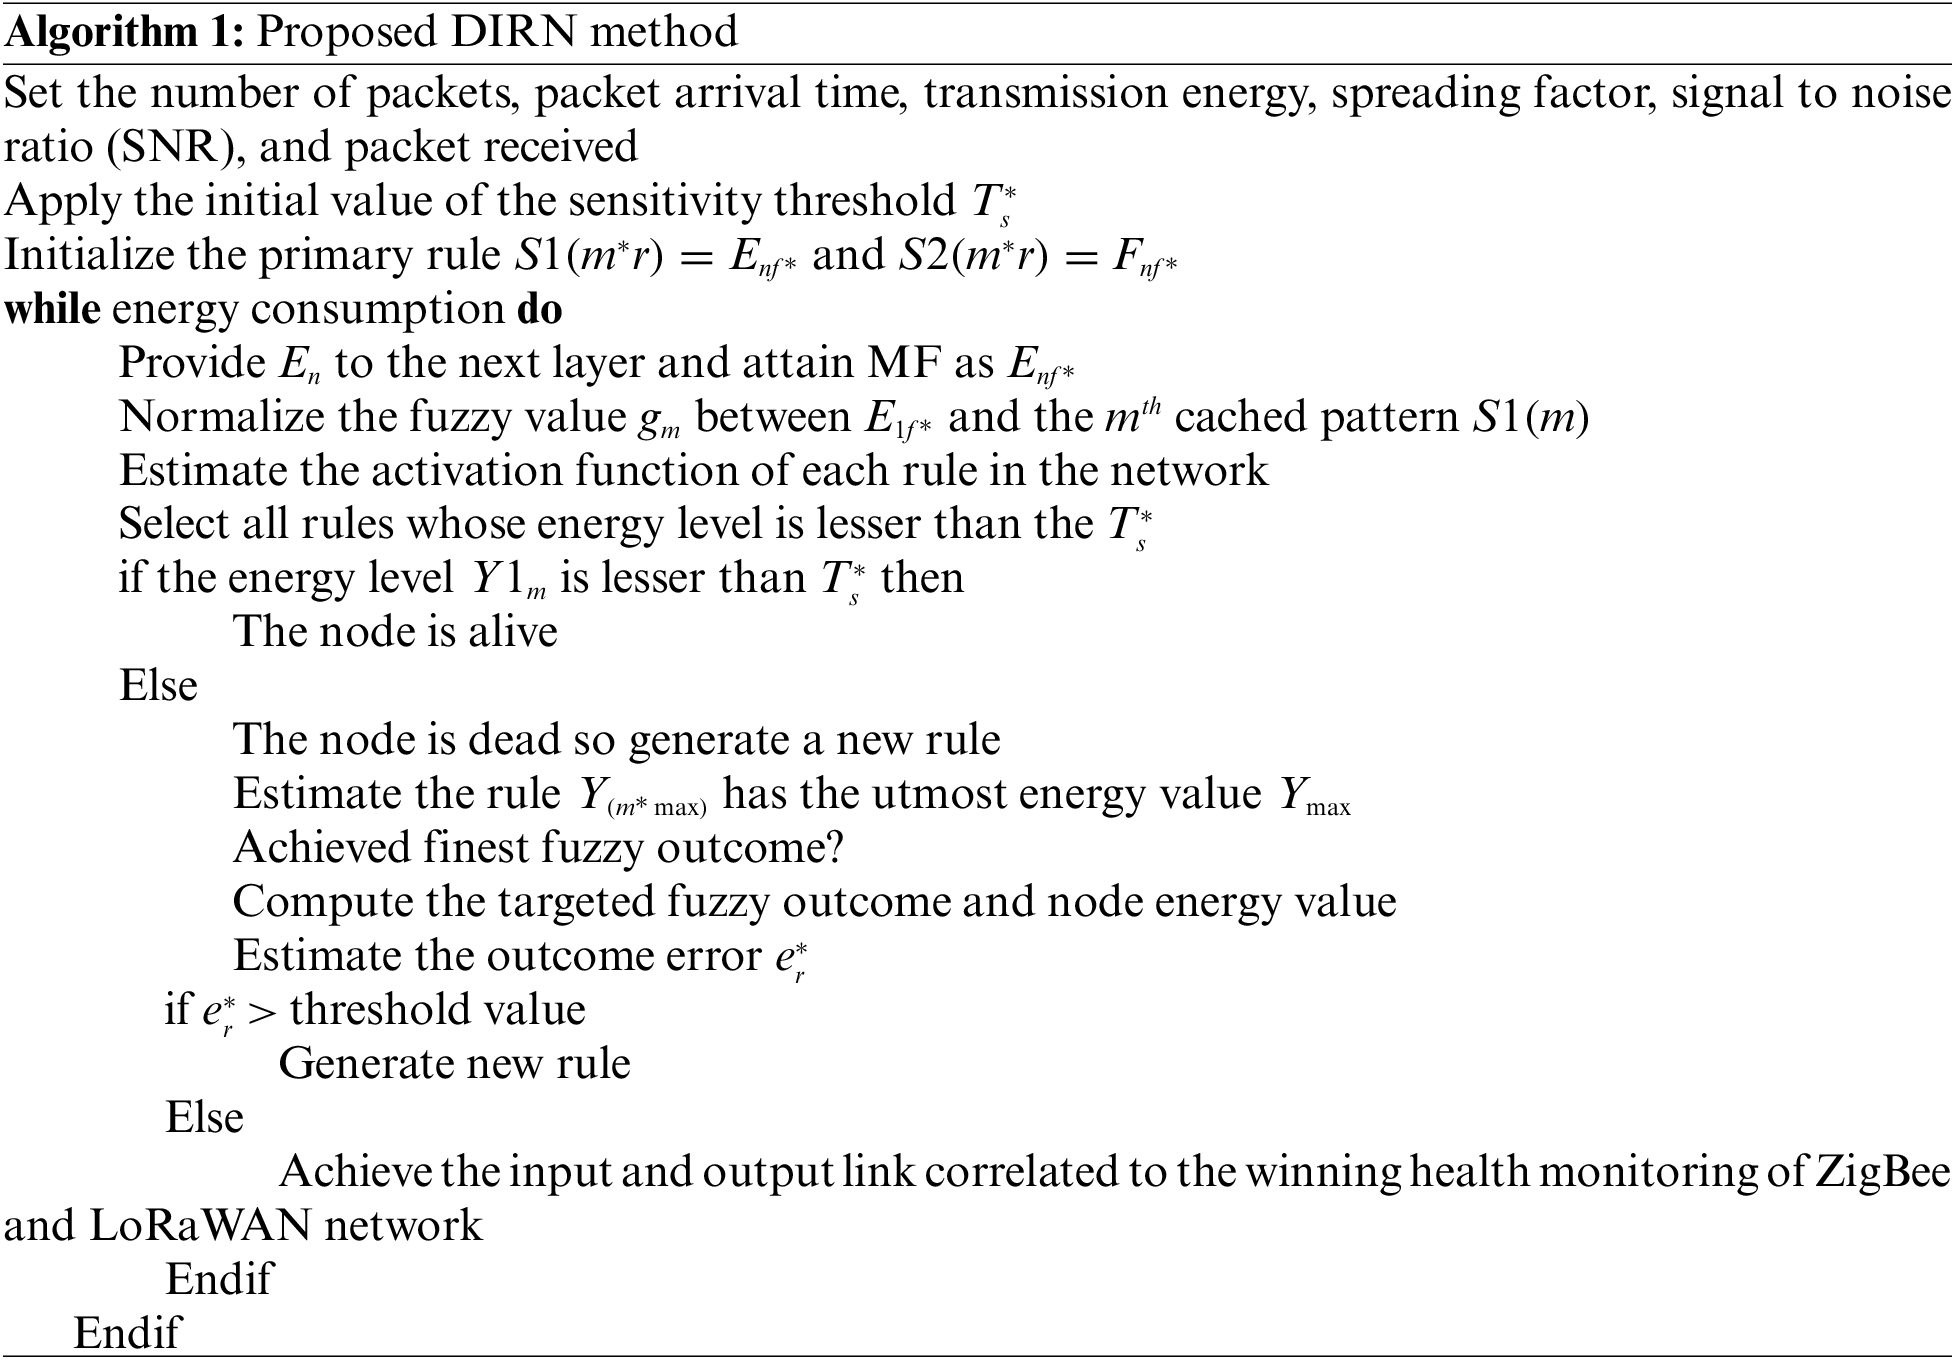
The DIRN method is a sophisticated hybrid of reasoning-based intelligent neural fuzzy methods. The input layer, fuzzification, rule layer, membership function, and defuzzification are all included in this model. The input layer is the first layer. The number of packets, packet arrival time, transmission energy, spreading factor, signal to noise ratio (SNR), and packet received are all contained in the input layer. It sends the input data variable to the next layer, where the data will be fuzzified. Let’s say the input data packet vector is called
The neuron’s rule is symbolized by the symbol
where,
In such a case
If
If
In Eqs. (14) and (15), the sensitivity threshold is given by
Fuzzy output illustrates fuzzy limitations for output variables, and the fourth layer is also referred to as fuzzy output. The data packet and the energy consumption of the node are verified here depending on the header. If the energy level of the data packet is in the nodes within the threshold level, the systems accept the packet and indicate it as a better sensor node; otherwise, the packet is rejected from network transmission of that particular node and indicated as the worst sensor node. The weight vectors
In Eqs. (17) and (18),
In this section, the outcomes obtained from the proposed method using Zigbee and LaRaWAN system with the intelligent approach. The main aim of this research is to monitor the health of the sensor nodes in WSN in terms of data reliability and network lifetime. The suggested technique is also compared to existing methods that attempt to monitor data dependability and network longevity in terms of network lifetime. The proposed technique is simulated with the help of the NS2 simulator program. Tab. 1 lists the simulation parameters.
To estimate the performance of the suggested model, the reliability, network lifetime, energy consumption, packet loss, packet delivery ratio and delay parameters were compared to traditional methods such as the Fuzzy logic algorithm [29], Evidential reasoning rule (ER) [30], Red Deer Algorithm-Black Widow Optimization (RDA-BWO) and FLoRA [31]. In WSNs, clustering is one of the most essential ways for extending the network lifetime. It entails clustering sensor nodes into groups and choosing cluster heads (CHs) for each group. The complete heterogeneous networks become more effective as this study boosts the dynamic clustering performance due to the constantly proposed clustering.
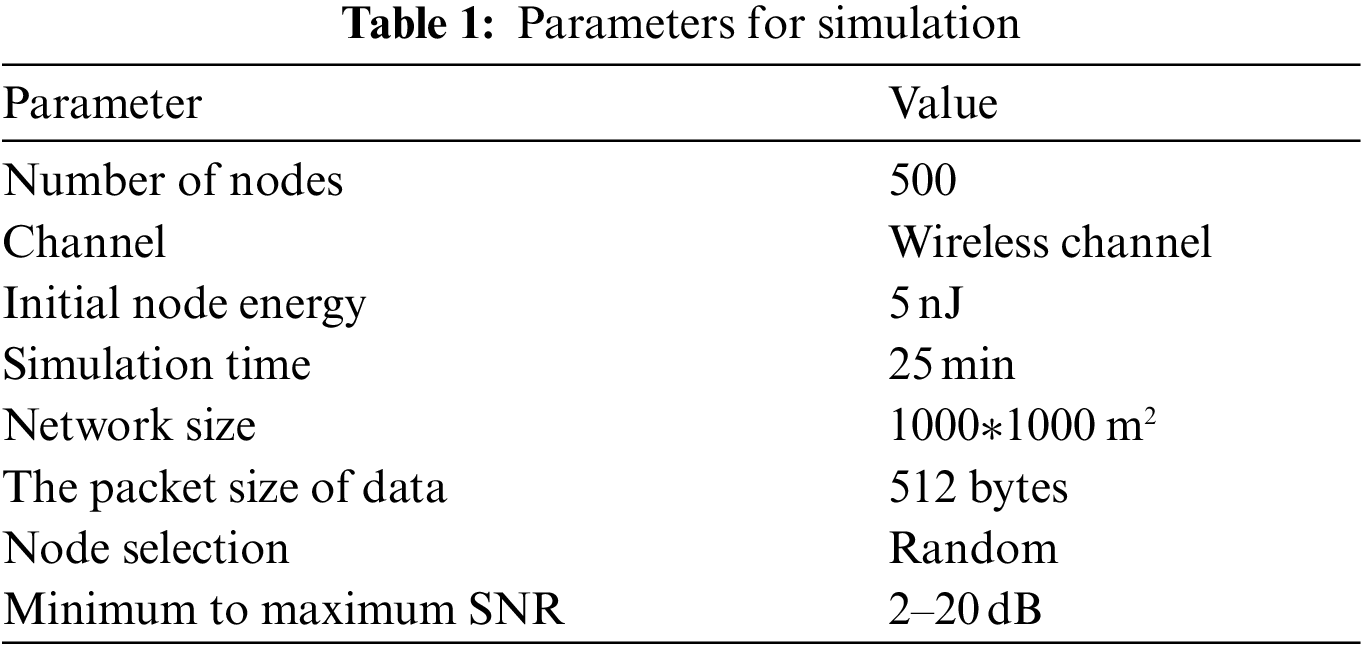
The recommended approach, as illustrated in Fig. 4a has the highest clustering rate. The Fuzzy logic algorithm, ER, RDA-BWO, and FLoRA, on the other hand, all achieved a lower clustering rate than the recommended approach. The time it takes for a packet to go from sender to receiver across a network is referred to as end-to-end delay. The end-to-end latency is another assessment parameter. The suggested method’s end-to-end latency has risen when compared to other approaches, as illustrated in Fig. 4b. The suggested technique examines the correctness of data packets and conducts combining in each hop, increasing the latency. As a result, the suggested technique can be considered for situations where network reliability is much more essential than delay.
Figure 4: (a) A study of clustering rates in comparison (b) in terms of time, the end-to-end delays
The results show that the proposed methodology took 0.0183 s to complete 18 s, which is much less time than the other ways. Standard techniques show that the Fuzzy logic algorithm has 0.0209 s, ER has 0.025 s, RDA-BWO has 0.022 s, and FLoRA has 0.0268 s for various numbers of rounds greater than 18 s. This proves that the recommended strategy is effective. The entire energy consumed by the system to execute sending and receiving is referred to as energy consumption. As the number of nodes grows and so does the simulation time. As the execution time is increased, so is the quantity of energy consumed, as seen in Fig. 5a. Less energy consumption yields better results. Since nodes use less energy, they consume a significant share of the remaining energy. The most energy-dense node in the journey is chosen as the optimal route.
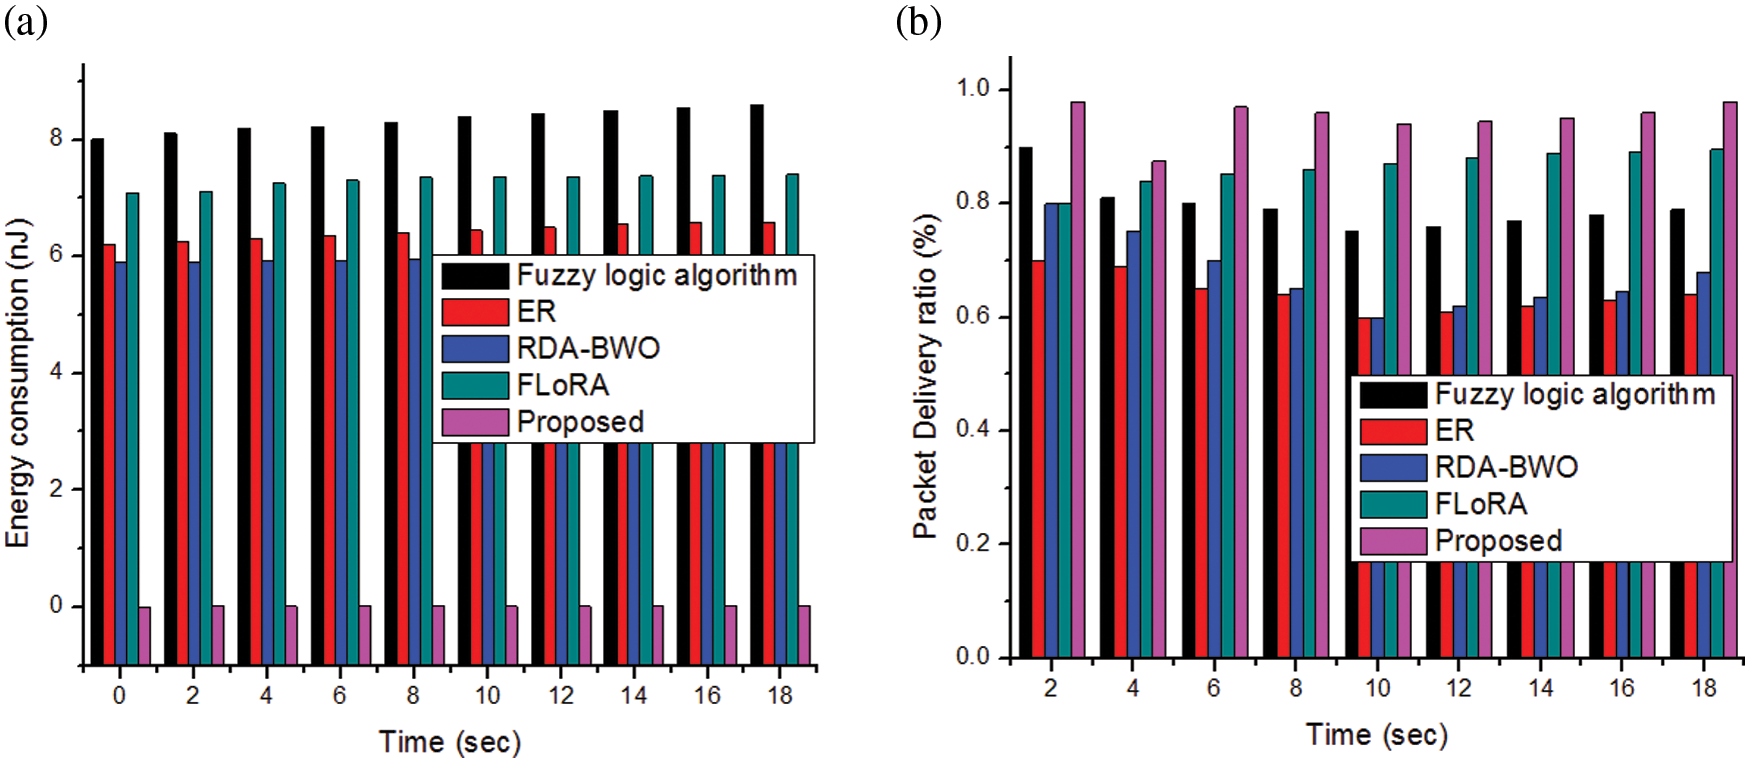
Figure 5: (a) Energy consumption to time (b) packet delivery ratio to time
The packet delivery ratio measures the proportion of total data that is efficiently distributed to all destination nodes, while the total quantity of data created by all source nodes is measured.
The suggested technique obtained a packet delivery ratio of 0.98% for 18 s, whereas the data measured the Fuzzy logic algorithm, ER, RDA-BWO, and FLoRA approaches have produced much lower packet delivery ratios, such as 0.79%, 0.64%, 0.68%, and 0.895%, respectively. The PDR value decreases as the number of time seconds increases. Packet loss is defined as the number of times a specific data packet is not finished at the end destination, as represented by Eq. (20).
Fig. 6 compares the packet loss caused by the proposed methodology to alternative methods with different cycles. The reduction of packet loss during the transmission of communications from data owners to data users is the top priority. In terms of the total number of iterations, the recommended approach has achieved remarkably low packet loss when compared to other existing models.
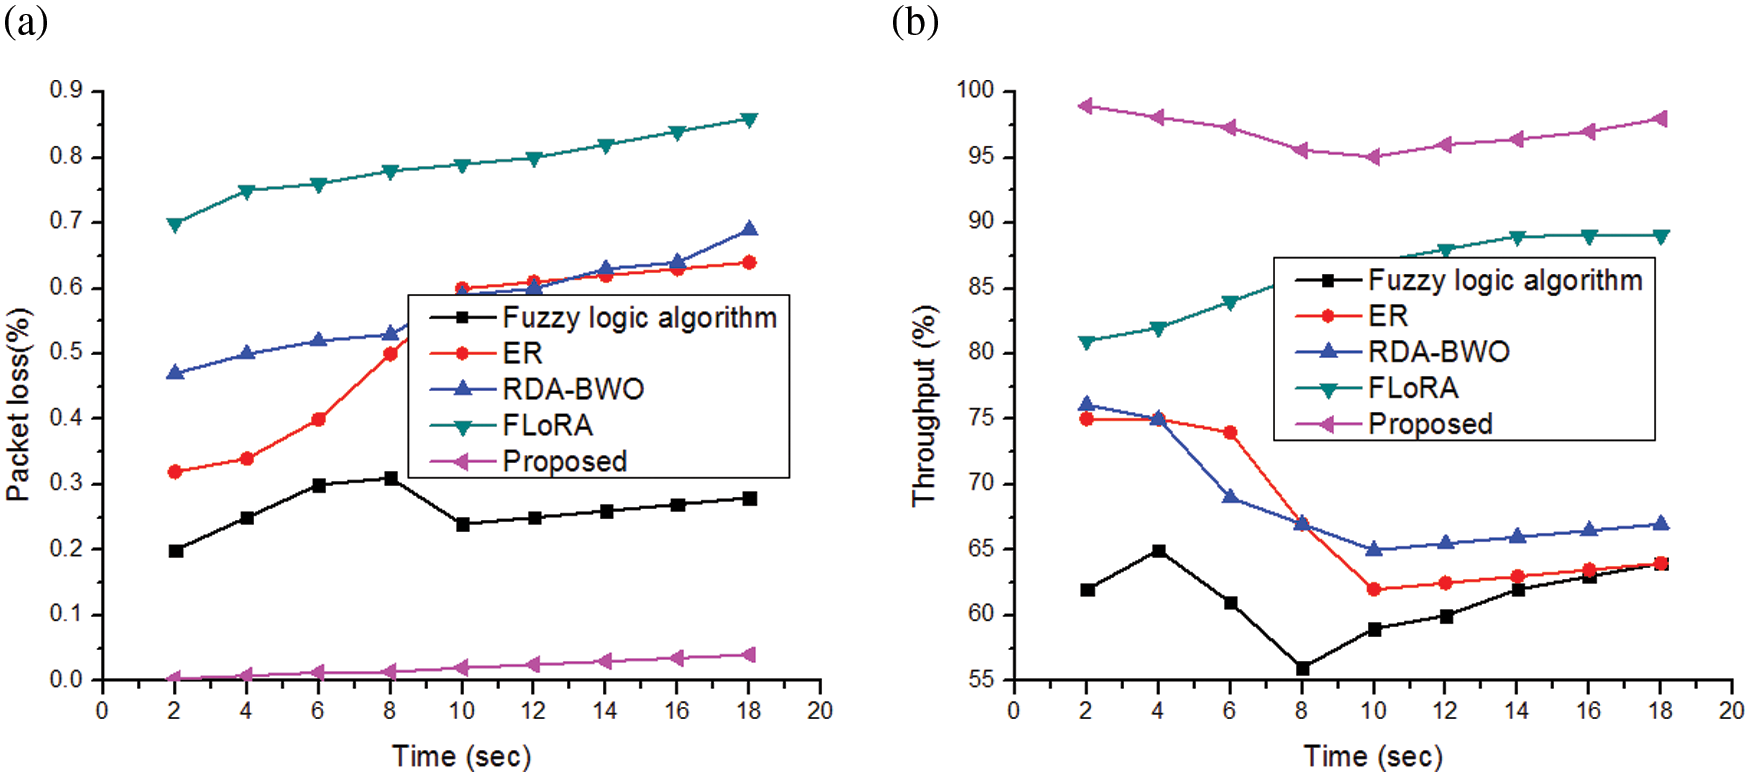
Figure 6: (a) Packet losses to time (b) throughput comparisons to time
As demonstrated in Fig. 6a, the recommended approach caused the least amount of loss when compared to the Fuzzy logic algorithm, ER, RDA-BWO, and FLoRA. The recommended solution exhibits reduced packet loss at all times as compared to standard Fuzzy logic algorithms, ER, RDA-BWO, and FLoRA. The packet loss, on the other hand, increases as the number of periods grows. Furthermore, the proposed packet loss during 18 s is 0.04%, which is lower than standard protocols. As a result, the proposed approach caused less packet loss throughout the broadcast. The quantity of data acquired at the receiver end is measured by the time it takes for data to be transferred through the process, which is referred to as throughput.
For various rounds, Fig. 7b displays the obtained throughput from the recommended method in contrast to existing models. The recommended approach generates a throughput value of 98% in 18 s. As the number of cycles increases, the throughput value drops. The comparison, on the other hand, shows that the proposed technique surpasses existing models in terms of effective performance, such as all-rounds variation. Fig. 7a depicts a comparison between the suggested technique and perhaps other methods to the number of alive nodes and network longevity. The entire network has been formed as a cluster in the suggested technique, and packets are transmitted across small distances to nodes of higher tiers. The number of alive nodes is counted at that moment for better purposes.
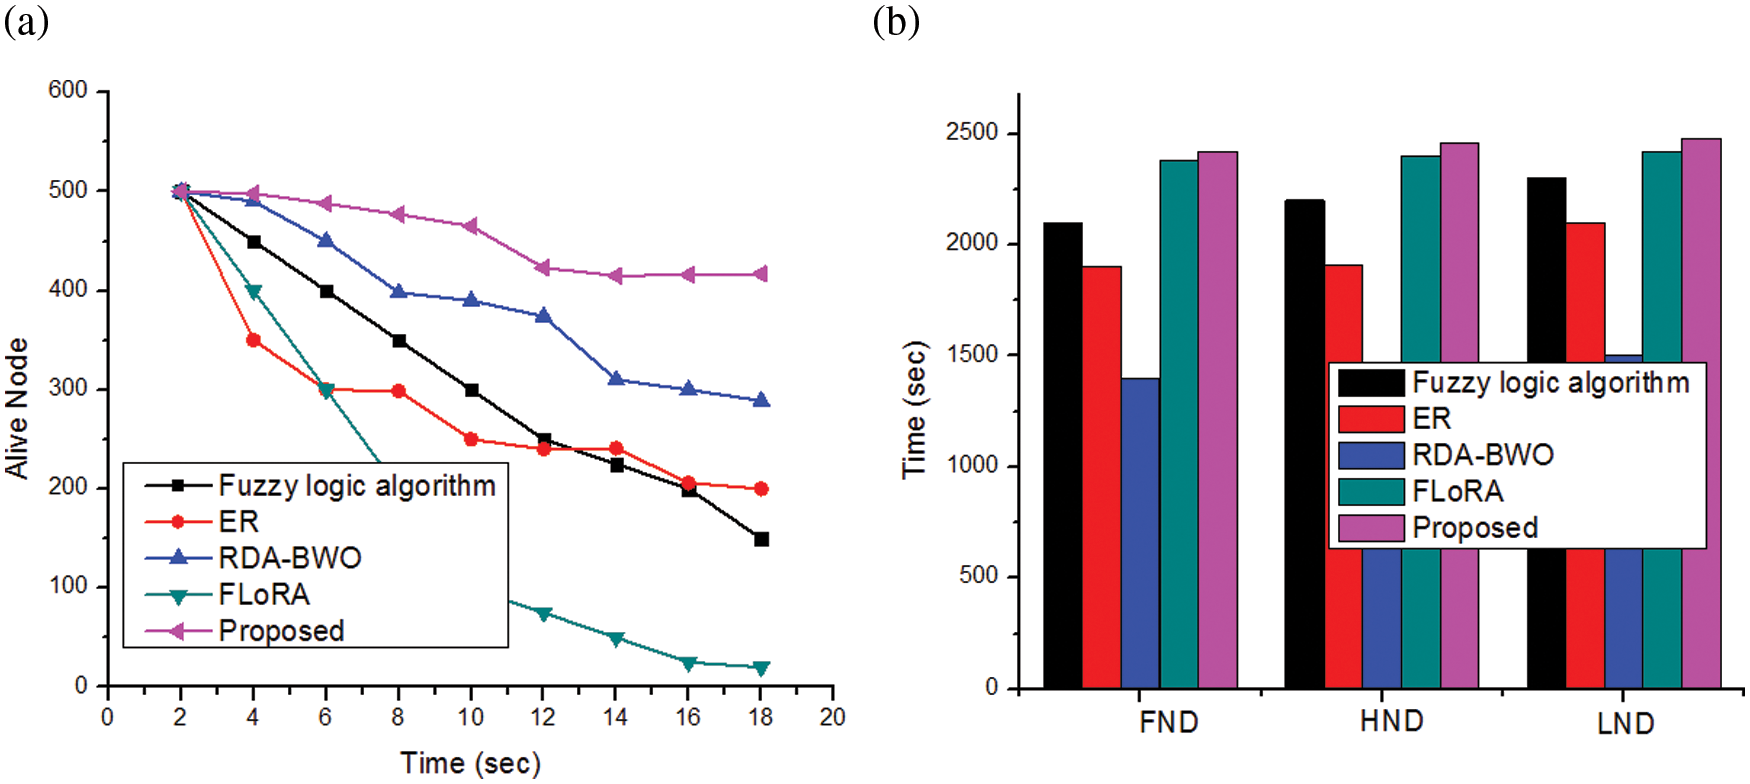
Figure 7: (a) Number of alive to time (b) network lifetime to time
Calculating the time until the first node’s energy runs out is an important performance metric. Every node in a WSN network immediately broadcasts its data over the internet.
In this setup, the data will be delivered to the network instantly or regularly. Fig. 7b compares the Fuzzy logic methods, ER, RDA-BWO, and FLoRA, to the network longevity in terms of the death of the first node, half of the nodes, and all nodes. One of the most significant aims of the suggested approach is to monitor the network lifespan; nevertheless, as shown in Fig. 7, the proposed technique outperforms this algorithm in terms of network lifetime. The network topology is arranged as a tree in the proposed technique, and packets are transferred across small distances to nodes of higher tiers. Since data transmission necessitates the maximum degree of energy consumption, the structure causes nodes to spend less energy. Furthermore, the suggested method’s node-to-node error detection reduces energy consumption.
The proposed approach also has the purpose of lowering energy use. In contrast to existing approaches, the suggested method greatly decreases energy consumption, as shown in Fig. 8. Transmission rate from the previous step is demanded rather than end-to-end transmission in the proposed technique, which uses the node to node error detection methodology. In comparison to the retransmission from the source, it consumes less energy.
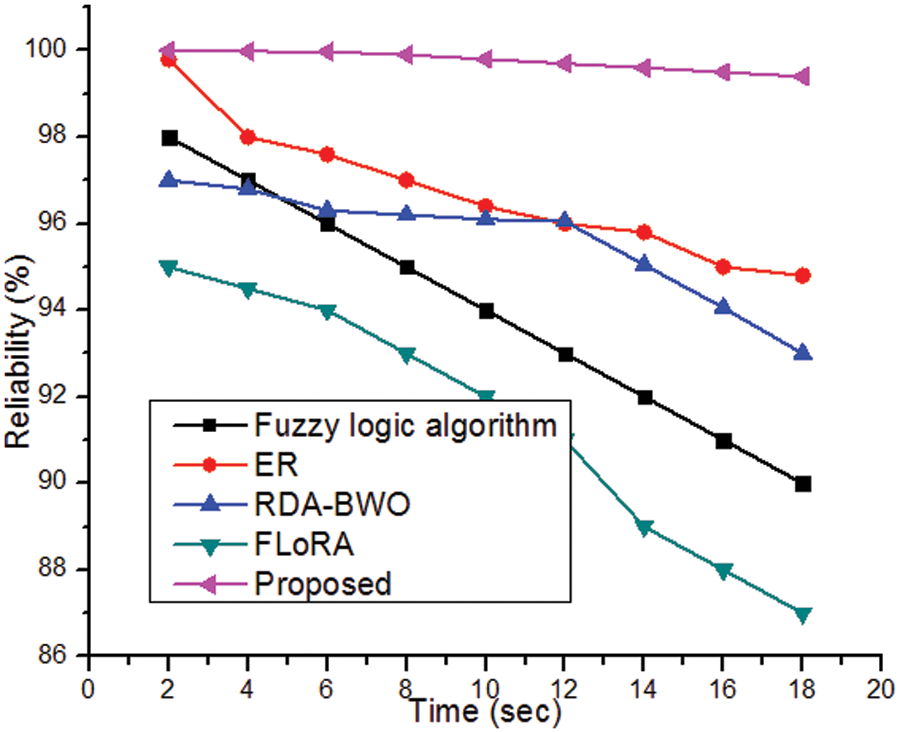
Figure 8: Reliability to time
According to the predicted outcomes and comparison, the recommended approach has obtained the best performance in terms of low energy consumption, better accuracy, packet delivery time, throughput, network alive node estimation, and computing performance value. Using Fuzzy logic approaches, the node’s energy efficiency has been considerably improved. However, there will be more nosiness in data transport, and long-distance transmission will require a lot of energy. This considerably decreased the performance due to the proper estimation of alive nodes and data transmission is important in the heterogeneous-based LoRaWAN and Zigbee network communication. Furthermore, by reducing a significant amount of power signals, the ER model has enhanced node performance. For optimal cluster formulation, the traditional RDA-BWO technique required a larger number of learning parameters. There will, however, be a security concern as well as a delay. Despite this, the suggested approach improved the system’s performance by monitoring and reducing energy consumption, increasing packet delivery rate, keeping nodes alive, and increasing dependability.
In this paper, the hybrid of Zigbee and LoRaWAN based WSN communication is developed and monitoring the health of the sensor nodes used in this system. Therefore, novel GSEO and DIRN based intelligent methods are developed for monitoring the communication system performance in terms of cluster formation and energy consumption monitoring. The simulation results of the proposed method are validated with the different performance metrics. The technology outperformed existing methodologies in terms of packet delivery time, throughput, network longevity, energy usage monitoring, packet loss, and alive nodes, according to the findings. Eventhough LoRaWAN has its inbuilt security system in its MAC layer. a communication system model that would involve external security in terms of transmission might be developed employing a hybrid learning approach.
Acknowledgement: The authors would like to express their Gratitude to the ministry of education and the deanship of scientific research–Najran University for the research work environment.
Funding Statement: The authors would like to express their Gratitude to the ministry of education and the deanship of scientific research–Najran University–Kingdom of Saudi Arabia for their financial and Technical support under code number (code NU/-/SERC/10/638).
Conflicts of Interest: The authors declare that they have no conflicts of interest to report regarding the present study.
1. A. Y. Salman, O. I. Khalaf and G. M. Abdulsahib, “An adaptive intelligent alarm system for wireless sensor network,” Indonesian Journal of Electrical Engineering and Computer Science, vol. 15, no. 1, pp. 142–147, 2019. [Google Scholar]
2. H. Li and A. V. Savkin, “Wireless sensor network-based navigation of micro flying robots in the industrial internet of things,” IEEE Transactions on Industrial Informatics, vol. 14, no. 8, pp. 3524–3533, 2018. [Google Scholar]
3. X. Zhu, “Complex event detection for commodity distribution internet of things model incorporating radio frequency identification and wireless sensor network,” Future Generation Computer Systems, vol. 125, pp. 100–111, 2021. [Google Scholar]
4. V. Reddy and P. Gayathri, “Integration of internet of things with wireless sensor network,” International Journal of Electrical & Computer Engineering, vol. 9, no. 1, pp. 439–444, 2019. [Google Scholar]
5. S. V. Purkar and R. S. Deshpande, “Clustering algorithm for deployment of independent heterogeneous wireless sensor network,” Wireless Personal Communications, vol. 112, no. 2, pp. 1307–1317, 2021. [Google Scholar]
6. A. K. Luhach, A. Khamparia, R. Sihag and R. Kumar, “Honey bee optimization based sink mobility aware heterogeneous protocol for wireless sensor network,” Scalable Computing: Practice and Experience, vol. 20, no. 4, pp. 591–598, 2019. [Google Scholar]
7. W. Ayoub, A. E. Samhat, F. Nouvel, M. Mroue and J. Prevotet, “Internet of mobile things: Overview of LoraWAN, DASH7, and NB-IoT in LPWANs standards and supported mobility,” IEEE Communications Surveys & Tutorials, vol. 21, no. 2, pp. 1561–1581, 2018. [Google Scholar]
8. B. S. Chaudhari, M. Zennaro and S. Borkar, “LPWAN technologies: Emerging application characteristics, requirements, and design considerations,” Future Internet, vol. 12, no. 3, pp. 1–25, 2020. [Google Scholar]
9. S. Ugwuanyi, G. Paul and J. Irvine, “Survey of IoT for developing countries: Performance analysis of LoRaWAN and cellular NB-IoT networks,” Electronics, vol. 10, no. 18, pp. 1–30, 2021. [Google Scholar]
10. S. N. Ghorpade, M. Zennaro and B. S. Chaudhari. “Introduction to Internet of Things,” in Optimal Localization of Internet of Things Nodes, Cham: Springer, pp. 1–15, 2022. [Google Scholar]
11. Z. Wang, “Greenhouse data acquisition system based on zigbee wireless sensor network to promote the development of agricultural economy,” Environmental Technology & Innovation, vol. 24 no. 101689, pp. 1–15, 2021. [Google Scholar]
12. Y. Zhao, “Research on wireless sensor network system based on zigbee technology for short distance transmission,” Journal of Physics: Conference Series, vol. 1802, no. 2, pp. 1–6, 2021. [Google Scholar]
13. C. V. M. Mandanna, H. M. Suman and I. M. T. Aiyanna, “LoRaWAN: An evolution of wi-fi from short range to long range,” EPRA International Journal of Research and Development, vol. 6, no. 7, pp. 611–616, 2021. [Google Scholar]
14. T. Brito, M. Zorawski, J. Mendes, B. Azevedo, A. I. Pereira et al., “Optimizing data transmission in a wireless sensor network based on LoRaWAN protocol,” in Int. Conf. on Optimization, Learning Algorithms and Applications, Italy, pp. 281–293, 2021. [Google Scholar]
15. S. S. Vidhya and S. Mathi, “Investigations on power-aware solutions in low power sensor networks,” Lecture Notes in Networks and systems (LNNS), vol. 311, pp. 911–925, 2022. [Google Scholar]
16. J. R. Rana and S. A. Naveed, “Review of LoRaWAN and its application,” International Journal of Engineering Research & Technology, vol. 8, no. 12, pp. 814–816, 2020. [Google Scholar]
17. G. A. Mutiara, N. S. Herman and O. Mohd, “Using long-range wireless sensor network to track the illegal cutting log,” Applied Sciences, vol. 10, no. 19, pp. 1–17, 2020. [Google Scholar]
18. P. D. P. Adi and A. Kitagawa, “Quality of service and power consumption optimization on the IEEE 802.15. 4 pulse sensor node based on internet of things,” International Journal of Advanced Computer Science and Applications, vol. 10, no. 5, pp. 144–154, 2019. [Google Scholar]
19. T. Brito, A. I. Pereira, J. Lima and A. Valente, “Wireless sensor network for ignitions detection: An IoT approach,” Electronics, vol. 9, no. 6, pp. 1–16, 2020. [Google Scholar]
20. D. Marrero, A. Suarez, E. Macias and V. Mena, “Extending the battery life of the zigbee routers and coordinator by modifying their mode of operation,” Sensors, vol. 20, no. 1, pp. 1–22, 2020. [Google Scholar]
21. S. Yang, X. long, H. Peng and H. Gao, “Optimization of heterogeneous clustering routing protocol for internet of things in wireless sensor networks,” Journal of Sensors, vol. 2022, pp. 1–9, 2022. [Google Scholar]
22. S. Gupta and I. Snigdh, “Clustering in LoRa networks, an energy-conserving perspective,” Wireless Personal Communications, vol. 122, no. 1, pp. 197–210, 2022. [Google Scholar]
23. H. Klaina, I. P. Guembe, P. L. Itturi, M. A. C. Bescos, L. Azpilicueta et al., “Analysis of low power wide area network wireless technologies in smart agriculture for large-scale farm monitoring and tractor communications,” Measurement, vol. 187, pp. 110231, 2022. [Google Scholar]
24. K. R. Rao, D. S. Kumar, M. Shaw and V. Sitamahalakshmi, “Energy efficiency analysis of LoRa and ZigBee protocols in wireless sensor networks,” Revista Geintec-Gestao Inovacao e Tecnologias, vol. 11, no. 4, pp. 2836–2849, 2021. [Google Scholar]
25. Y. Wu, Y. He and L. Shi, “Energy-saving measurement in LoRaWAN-based wireless sensor networks by using compressed sensing,” IEEE Access, vol. 8, pp. 49477–49486, 2020. [Google Scholar]
26. A. Lombardo, S. Parrino, G. Peruzzi and A. Pozzebon, “LoRaWAN vs NB-IoT: Transmission performance analysis within critical environments,” IEEE Internet of Things Journal, vol. 9, no.2, pp. 1068–1081, 2021. [Google Scholar]
27. M. Guerrero, C. Cano, X. Vilajosana and P. Thubert, “Towards dependable IoT via interface selection: Predicting packet delivery at the end node in LoRaWAN networks,” Sensors, vol. 21, no. 8, pp. 1–20, 2021. [Google Scholar]
28. D. Widhalm, K. M. Goeschka and W. Kastner, “An open-source wireless sensor node platform with active node-level reliability for monitoring applications,” Sensors, vol. 21, no. 22, pp. 1–41, 2021. [Google Scholar]
29. W. Zhixue, “Reliability analysis of social network data transmission in wireless sensor network topology,” Journal of Sensors, vol. 2022, pp. 1–10, 2022. [Google Scholar]
30. P. Gupta, S. Tripathi and S. Singh, “RDA-BWO: Hybrid energy efficient data transfer and mobile sink location prediction in heterogeneous WSN,” Wireless Networks, vol. 27, no. 7, pp. 4421–4440, 2021. [Google Scholar]
31. S. V. Akram, R. Singh, M. A. AlZain, A. Gehlot, M. Rashid et al., “Performance analysis of IoT and long-range radio-based sensor node and gateway architecture for solid waste management,” Sensors, vol. 21, no. 8, pp. 1–22, 2021. [Google Scholar]
 | This work is licensed under a Creative Commons Attribution 4.0 International License, which permits unrestricted use, distribution, and reproduction in any medium, provided the original work is properly cited. |