DOI:10.32604/cmc.2022.028847
| Computers, Materials & Continua DOI:10.32604/cmc.2022.028847 | |
| Article |
Real-Time Multi-Class Infection Classification for Respiratory Diseases
1Department of Electrical Engineering, Faculty of Engineering, Ahram Canadian University, Giza, Egypt
2Department of Electronics and Electrical Communications Engineering, Faculty of Electronic Engineering, Menoufia University, Menouf, 32952, Egypt
3Department of Computer Science, Community College, King Saud University, Riyadh, 11437, Saudi Arabia
4Higher Polytechnic School, Universidad Europea del Atlántico, Santander, 39011, Spain
5Electronics and Communications Engineering Department, College of Engineering and Technology, Arab Academy for Science, Technology and Maritime Transport, Alexandria, 1029, Egypt
*Corresponding Author: Abdulaziz Alarifi. Email: abdulazizalarifi@ksu.edu.sa
Received: 19 February 2022; Accepted: 06 May 2022
Abstract: Real-time disease prediction has emerged as the main focus of study in the field of computerized medicine. Intelligent disease identification framework can assist medical practitioners in diagnosing disease in a way that is reliable, consistent, and timely, successfully lowering mortality rates, particularly during endemics and pandemics. To prevent this pandemic’s rapid and widespread, it is vital to quickly identify, confine, and treat affected individuals. The need for auxiliary computer-aided diagnostic (CAD) systems has grown. Numerous recent studies have indicated that radiological pictures contained critical information regarding the COVID-19 virus. Utilizing advanced convolutional neural network (CNN) architectures in conjunction with radiological imaging makes it possible to provide rapid, accurate, and extremely useful susceptible classifications. This research work proposes a methodology for real-time detection of COVID-19 infections caused by the Corona Virus. The purpose of this study is to offer a two-way COVID-19 (2WCD) diagnosis prediction deep learning system that is built on Transfer Learning Methodologies (TLM) and features customized fine-tuning on top of fully connected layered pre-trained CNN architectures. 2WCD has applied modifications to pre-trained models for better performance. It is designed and implemented to improve the generalization ability of the classifier for binary and multi-class models. Along with the ability to differentiate COVID-19 and No-Patient in the binary class model and COVID-19, No-Patient, and Pneumonia in the multi-class model, our framework is augmented with a critical add-on for visually demonstrating infection in any tested radiological image by highlighting the affected region in the patient’s lung in a recognizable color pattern. The proposed system is shown to be extremely robust and reliable for real-time COVID-19 diagnostic prediction. It can also be used to forecast other lung-related disorders. As the system can assist medical practitioners in diagnosing the greatest number of patients in the shortest amount of time, radiologists can also be used or published online to assist any less-experienced individual in obtaining an accurate immediate screening for their radiological images.
Keywords: COVID-19; real-time computerized disease prediction; intelligent disease identification framework; CAD systems; X-rays; CT-scans; CNN; real-time detection of COVID-19 infections
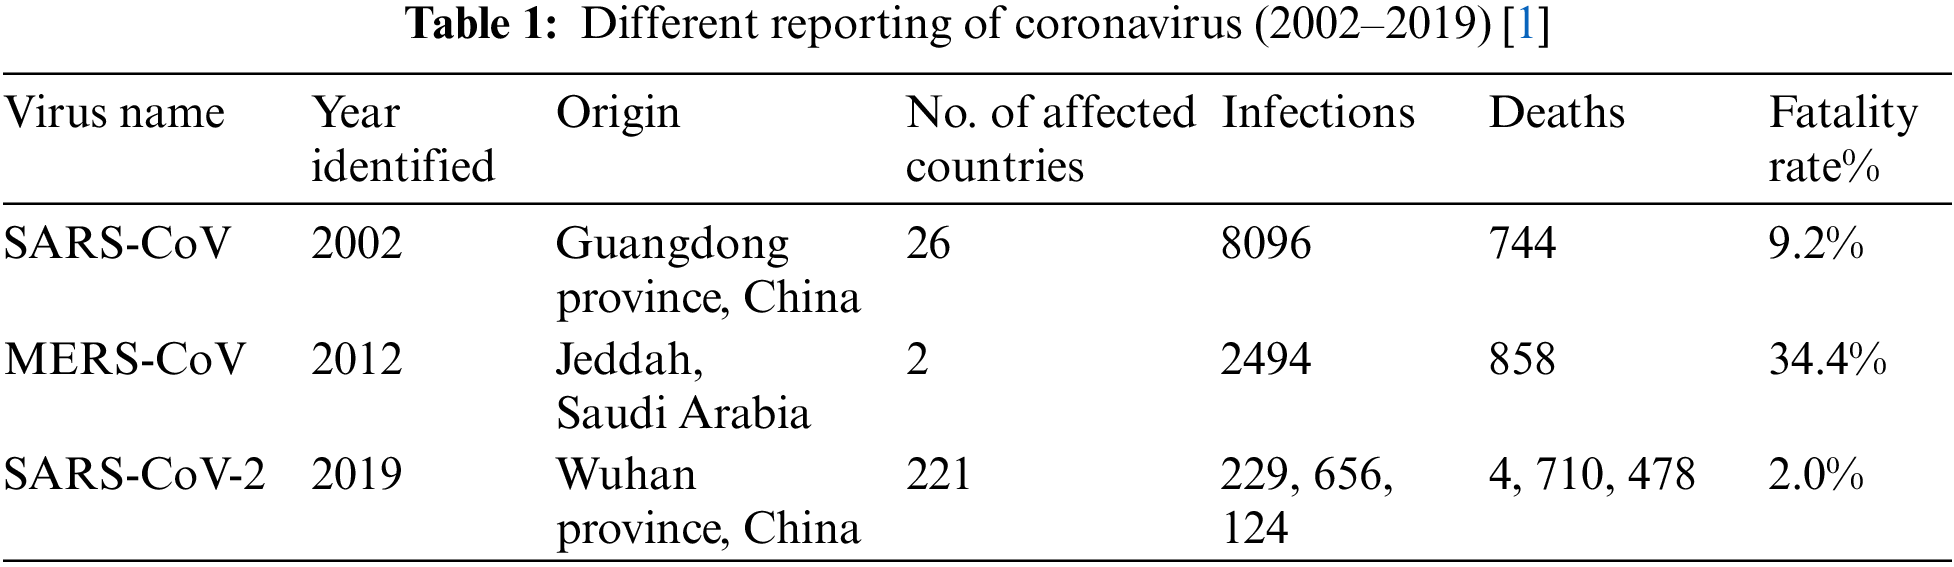
Several coronavirus outbreaks were observed, causing moderate respiratory illness in the upper respiratory tract. These epidemics occurred between 2002 and 2012. In addition, Middle East Respiratory Disease (MERS) of the Lower Respiratory Tract was designated after the 2012 outbreak. It was associated with lower respiratory tract infections associated with Extreme Respiratory Syndrome. The third incident happened in Wuhan, China, near the end of 2019 and aided in the pandemic’s global spread. This virus has wreaked havoc on not only several countries’ health systems, but also on their economies.
Coronavirus 2 caused Extreme Acute Respiratory Syndrome (SARS-CoV-2) until it was renamed COVID-19 by the World Health Organization (WHO) in February 2020. The pandemic was declared a Public Health Emergency of International Significance on January 31, 2020. Since the outbreak began, the daily case count has risen dramatically, reaching 229 million cases, 206 million recoveries, and approximately 4.71 million fatalities globally by September 2021. A total of around 221 nations have been impacted. The United States of America, India, Brazil, United Kingdom, and Russia were the most affected countries. Tab. 1 shows the evolution of COVID virus from 2002 till 2019 [1].
Unlike the normal cold or seasonal flu, the coronavirus rapid spread has confined many individuals and ruined numerous businesses. Due to the coronavirus high transmissibility, this outbreak has significantly affected human life quality. In various parts of the world, factors such as a person age and sex and particular urban elements such as geography, temperature, and humidity, all influence the occurrence of this disease. Two coronavirus strains have been identified as the causative agents of a SARS and MERS. However, disease identification has been hampered due to a lack of dependable detection resources and the inherent limitations of their development. If COVID-19 disease is discovered early, infections and fatalities will be minimized.
Symptoms of new coronavirus infection typically manifest themselves a few days after infection. The common cold to pneumonia, coughing, shortness of breath, and acute respiratory symptoms are all possible symptoms. Even worse, the patient may develop a cough for no apparent reason. In contrast to SARS, which primarily affects the respiratory system, coronavirus also affects other vital organs, including the kidney and liver.
Numerous countries have implemented mandatory lockdowns to prevent virus spread and the widespread use of facemasks and sanitizers to prevent germs from spreading and protect people from unintentionally touching contaminated surfaces. In addition, numerous studies indicate that early detection, hand washing, self-isolation, household quarantine, and travel restrictions all contribute to the pandemic containment [2].
It is critical to recognize the disease, comprehend the symptoms, and utilize distinct waves to diagnose the coronavirus reliably. Early detection of COVID-19 is critical because it allows patient isolation and reduces the risk of infection spreading to other populations. To validate coronavirus diagnosis, gene sequencing or reverse transcription polymerase chain reaction (RT-PCR) were used as initial key screening methods for COVID-19 [3]. The rate of identification for throat swab samples using RT-PCR was estimated to be between 30% and 60%, resulting in undiagnosed patients who may spread disease to healthy people [4]. RT-PCR can be performed on patient samples, and the results will be available within a few hours to a few days.
Because RT-PCR has low sensitivity, of 60%–70%, and is time-consuming, many infected patients are not identified in time and tend to infect others unknowingly. The prevalence of COVID-19 disease will decline with early detection. To address the current COVID-19 test kits’ inadequacy and insufficiency, considerable effort is to be spent searching for alternative test methods. Additionally, using radiological images, such as X-rays or computed tomography to diagnose COVID-19 infections, is a visualization method.
Radiological images of the lungs, such as X-rays and computed tomography (CT) scans, have become important in diagnosing this disease. It should be noted that CT scan is a more sensitive technique for detecting COVID-19 pneumonia than standard tests and can be used in place of them for screening purposes. Alternatively, both RT-PCR and radiological image screening can be used together for a more accurate diagnosis.
Many medical practitioners discovered that identifying pathological effects of COVID-19 by analyzing radiological images of patients’ lungs could result in an earlier and more accurate diagnosis than RT-PCR. As a result, because the main symptoms of COVID-19 are respiratory problems, chest radiography (X-Ray images and CT scans) can accurately diagnose the disease even in asymptomatic or mildly symptomatic individuals. Using these data, one can address the limitations of other approaches, such as a lack of testing kits and production constraints.
CT scans and X-ray imaging systems are available in most hospitals and labs. The radiological imaging provides easy access to the data needed to train any computational diagnosis tool, especially in the absence of common infection symptoms and a shortage of medical practitioners due to the severity of the pandemic. So, radiological image screening aids in rapid and low-cost disease diagnosis.
Recent advances in computer vision and Deep Learning (DL) have made it possible to diagnose a variety of diseases and ailments in the human body, including tumor identification in the lungs, breast, head, and brain, nodule classification, diabetic retinopathy classification, and prostate segmentation, among others. Because COVID-19 is diagnosed with a chest CT scan or X-ray, computer vision and DL may be useful in diagnosing the disease. DL approaches are successful because they do not rely on manually created features; instead, these algorithms learn features automatically from data. With the advancement of disease-related computational science, researchers have employed computer vision and DL approaches to recognize certain features from COVID-19 patients’ chest radiological pictures, resulting in accurate disease prediction and diagnosis methodologies. However, due to the sensitive nature of the COVID-19 diagnosis, one of the major obstacles that researchers may confront in their investigations is diagnostic accuracy.
Many researchers have gathered and exploited recently obtained standardized datasets to train their automated COVID-19 analysis and diagnosis [5]. Our study in this work used a newly developed DL algorithm to predict COVID-19 infections from chest X-ray pictures and CT scans.
Below are some of the advantages of the whole process followed in our proposed work:
1) Generalized model: The Staticians or the Epidemic researcher does not need to tune the factors. Although all the feature extraction and modeling techniques are taking care of by the model itself by fitting into the curve, the plan is to give the liberty to the user for the changes to be done in the forecast value or to fix the hyper parameters.
2) The extensive list of algorithms, both machine learning and time series: Almost most of the DL techniques are considered so that one data that might not work fine in one of the algorithms can be used in the other methods.
3) Customizable: The system can take the effect of the new models, which are now giving some better results, and this can be helpful for the new kind of forecasts generation than the previous one and can help in increasing the accuracy.
4) Point solutions: The solution that the model is giving out is particular for each of the country data and this will be present at one place irrespective of the kind of the different data and the pattern of the actuals of the data.
5) Packages: The whole use case is done by packaging in different sets of functions, and the changes can be done in that particular part which helps in the better.
The paper is arranged as follows. Section 2 presents the related works. Section 3 provides the implementation details of the proposed work. Section 4 displays and discusses the simulation results and analysis. Finally, Section 5 provides conclusions and future work.
In this section, we discuss the most impacting recent emerged in the area of interest to collect historical points of view regarding the determination of infectious regions using computer vision transfer learning from CT-Scans and X-rays to help the medical practitioners’ diagnose doctors and researchers.
To help the medical practitioners, the researchers are also engaged in finding advanced analytical solutions that can help in minimizing the turnaround time of diagnosing a patient. For example, to detect COVID-19, a DL-based neural network was proposed in [6], that extracted the visual features from the CT scan for the COVID-19 suspected patient. Their proposed CT Scan Covid-19 dataset was merged and mixed with different Pneumonia and non-pneumonia CT Scan results. In order to empower the classifiers implemented in the system, a DL network, known as COVNet, proposed in this research work has achieved an accuarcy of 0.96.
Ali et al. [7] proposed an automatic detection system and explained how different convolutional neural networks like ResNet, InceptionV3, and Inception ResNetV2were proposed for the detection of the coronavirus pneumonia infected patient using the images of the X-rays radiographs. The receiver operating characteristic (ROC) analysis and the confusion matrices were used to present the performance measures of the described models for each of the 5-folds cross-validations. It was observed that ResNet50 had the best performance with an accuracy of 98%.
Chaolin et al. [8] found that men (30 [73%] of 41); less than half had underlying diseases (13 [32%]), including diabetes (eight [20%]), hypertension (six [15%]), and cardiovascular disease (six [15%]). The median age was 49 years. In this research analysis, around 41 patient data were included. These findings concluded that the covid-19 infection causes severe respiratory illness that caused an even higher mortality rate than caused by SARS, which was found in the acute respiratory syndrome coronavirus.
Since the emergence of a secondary process by Adhikari at al. [9] which stated that fasten the operation of the detection of the infection of COVID-19 infection accurately and the rise of the computer vision solutions using the X-rays and the CT-scan has emerged as the lifesaver for the patients and decrease the turnaround time of the medical practitioners to save time and check more patients in a short time. In initial experimental results done using the chest X-rays, images produced 96% as the sensitivity for the COVID-19 cases and 76.65% for the non-COVID-19 instances. El-Shafai, et al. [10] used 100 chest X-rays images of around 70 patients that were considered for the testing purpose. This method used deep neural networks to train the model test.
In our proposed method, there are four sections on which the prediction and the detection were achieved, including the anomaly of the screening. The architecture is composed of the pre-trained model and a head layer for performing the prediction. Since transfer learning methods (TLM) proved to be timely but accurate, this research focused on this area to make more accurate and better models. In this regard, another study by Linda et al. [11] proposed a new architecture known as COVID-Net. They found that the patients infected with COVID-19 could be diagnosed using radiography images. This motivated to develop artificial intelligence-based deep learning solutions, which proved to be quite promising in accurately diagnosing the patients with COVID-19 infections.
The proposed network in our paper employs the DL convolutional network designed to detect the infection based on the training data COVIDx. This dataset comprises 16756 chest radiography images of the patients from two open access data repositories. This dataset is made from a total of 13645 patients. This network helps in a better clinical screening with deeper insights into the images. In addition, the polymerase chain reaction (PCR) approach detects the SARS-CoV2 RNS from nasopharyngeal or oropharyngeal swabs in the current and primary tests to better identify the COVID-19. This PCR process is known as the gold standard, although it takes a long time to complete.
The COVIDNet architecture consists of a deep network of CNN used to detect the features and essential elements of the training image dataset. This architecture classifies Pneumonia and COVID19 infection. Another research carried out by Adhikari at al. [9] was to identify the sensitivity of infection caused by COVID-19 in an architecture known as ADMCDS (Automatic Diagnostic Medical Analysis for the COVID-19 Detection System). ADMCDS used both CT-scans and X-Ray images as an input layer. Their proposed system consists of two stages that differently take the kind of images input to the system, separately for the CT Scans and X-Rays images.
The 3-class categorization yields a sensitivity of 95% for the Normal, 91% for the Non-COVID19, and 80% for the COVID-19 when comparing the accuracy achieved by the COVIDNet. Sensitivity as a metric to define a better solution could be the most important observation. Soliman et al. [12] and Nimai et al. [13] took the same approach. The difficulty handled in the ADMCDS is the binary classification to distinguish healthy patients from COVID-19 patients. The major goal is to alleviate medical practitioners’ time restrictions. DenseNet’s pre-trained design outperforms that of other pre-trained networks. When employing X-rays, it was shown to have a sensitivity of 32 out of 34 COVID-19 patients in real-time and an 86.5% specificity when using CT Scans images that were out of sample.
Another research for tailoring building solutions using the X-rays images to help diagnose of COVID-19, was a new Deep Bayes Squeeze Net, that proposed COVIDiagnosis-Net in [14]. An AI-based structure was tuned to make a better diagnosis for the COVID19 by fine-tuning network’s hyperparameters and by using an augmented dataset. This methodology aided in the achievement of higher accuracy and noticeably improved performance. The researchers were focusing on a solution to the RT-PCR (Reverse Transcription-Polymerase Chain Reaction) method for detecting viral Ribonucleic acid (RNA) from sputum to nasopharyngeal swab, which has a lower positive rate during the early stages of COVID-19 detection (named by the WHO).
El-Shafai et al. [15] focused their study on early COVID-19 patient screening using secondary methods such as computed tomography or CT scans, which can help close the gap. Furthermore, the first solution addressed by the research work was to have higher accuracy and faster rate of turn around for the detection of COVID-19 patients. Their work addressed a three-class classification problem that attempted to differentiate between COVID-19, Influenza-A viral Pneumonia, and Healthy cases. The model achieved an overall accuracy of 86.7%. A total of 618 CT samples were collected for this study, with 219 samples from 110 patients who tested positive for COVID-19, 224 samples from 224 patients who tested positive for Influenza Viral Pneumonia, and 175 samples from healthy patients.
In a study to diagnose coronavirus-infected patients, a new model that combines ResNet50 and Support Vector Machine (SVM) was proposed [16]. For the successful identification and diagnosis of the COVID19, this model achieved accuracy, FPR (False Positive Rate), F1 Score, Matthews correlation coefficient (MCC), and Kappa of 95.38%, 95.52%, 91.41%, and 90.76%, respectively. SARS, MERS, and ARDS were all avoided in this scenario. The model was created using open-source data. Another study used RT-PCR to verify SARS-CoV2 specimens in clinical samples [17]. The result of transfer learning with the simple CNN and modified AlexNet model was 98% accuracy with pre-trained models and 94.1% accuracy with the modified CNN [17]. However, the CT scans and X-rays were both fed into the model in this study, potentially skewing the results. The reason for this could be due to the dataset’s various sources.
In this section, we’ll go through the entire technique for detecting the COVID-19 infection and how it will be separated from common Pneumonia and healthy cases. The dataset that we consider comes from various sources that the researchers used in their investigation. Because the data comes from a variety of sources, there will be variations in the data existence as well as the different areas that will be considered in the analysis. The X-Rays and CT-Scans images from the reports are the ones we have picked. Instead of transmitting both the photos and the single source for the model’s training, we create two independent flows for the various data sources. This will aid in the model improved training.
3.1 Dataset for the Transfer Learning
As previously stated, the data for this study is gathered from several sources and then combined into a single database for inflow to the model for training. First, we use data from the GitHub repository for the Open Dataset for the COVID-19 case, which includes X-rays and CT scans [18]. There are around 152 images in this data set. There are a total of 123 X-Ray images and 23 CT Scan images in the metadata report’s information. As a result, one of the 146 images from the source will be used to prepare the dataset. The Kaggle data source for the Pneumonia detection challenge is the second data source. There are around 3723 images of Pneumonia and 1965 images of healthy patients’ X-ray reports in this collection of data [19,20].
When we checked the first source, we discovered that we only had COVID-19 pictures for the CT scans and X-rays. As a result, we need more data types to make the database adequate for the categorization challenge. Therefore, the third source of data comes from Roboflow.ai’s open-source code. Around 5887 images of the data were obtained, while the normal and pneumonia cases in this sample are comparable to those in the Kaggle dataset. As a result, we examined just the COVID-19 folder, which had around 199 images.
To begin with the classification model, we transform all of the digital images into NumPy arrays so that the read files can be readily transferred to various computing environments. In this study, we use Google Colab to conduct our research. We utilized the computer vision (CV) module of Python to read the images and convert them to digital images. Let’s take a look at the dataset that we have just created now that we have extracted all of the required images from the various sources that were open for separate examination by the researchers. Furthermore, we are only considering similar types of data contained in all three groups of X-Ray images. The X-Rays images provide a total of 8027 images for the study of the models. Below is a sampling of each of the images. Fig. 1 shows image samples of COVID-19 dataset, while Fig. 2 presents image samples of Pneumonia dataset.
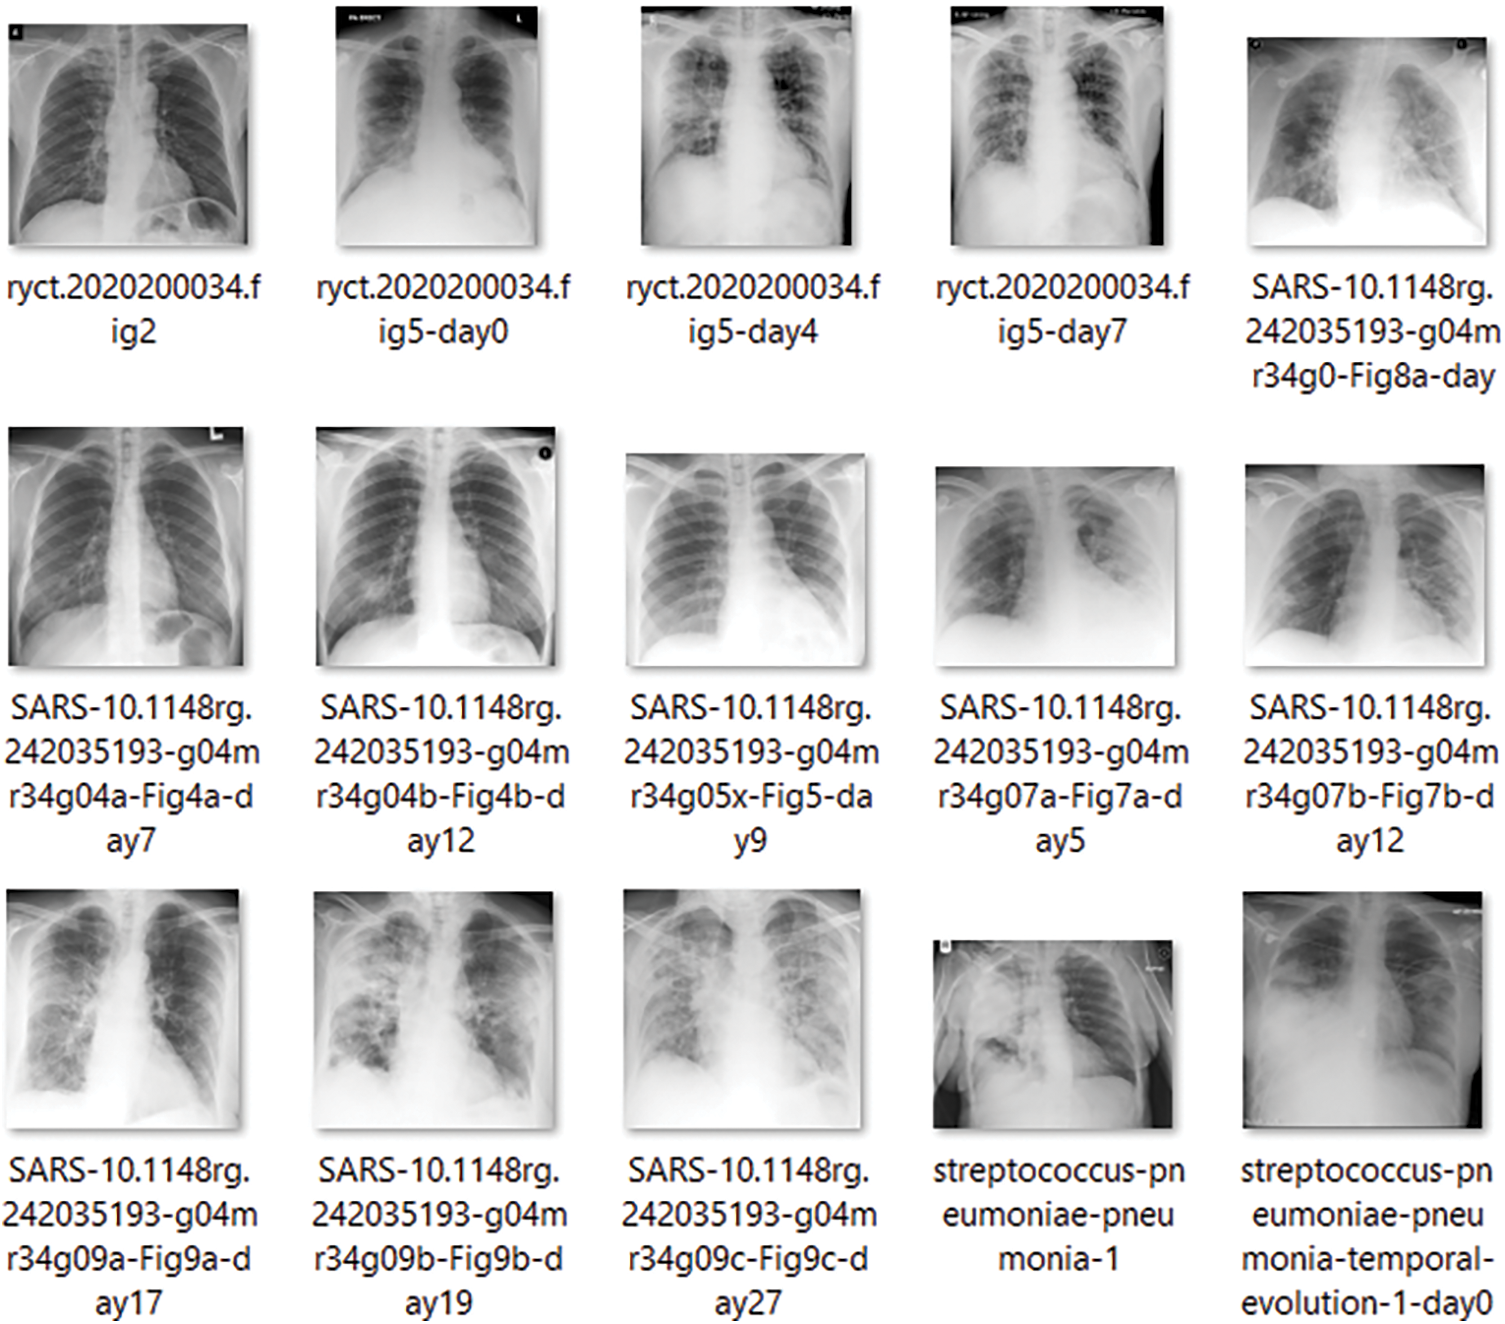
Figure 1: COVID-19 database. 15 images showing the COVID-19 infections
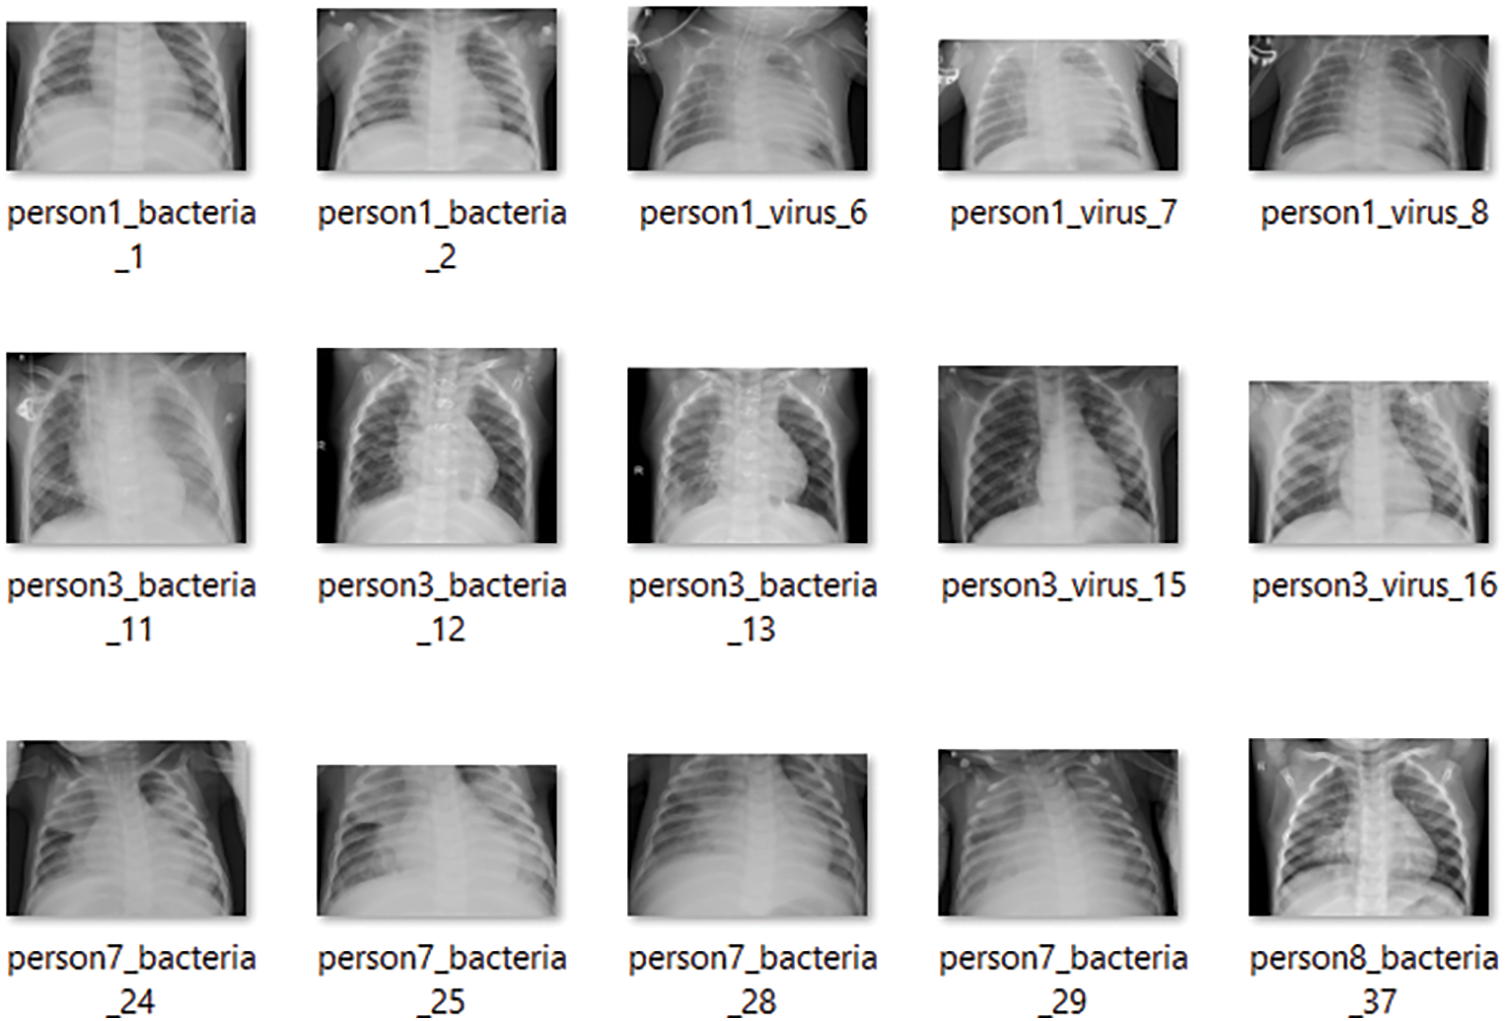
Figure 2: Pneumonia dataset containing the detailed reports of the patients suffering from pneumonia. Here, a sample of 15 images are shown
There are a total of 15 example photos in Fig. 2 that were obtained from the folder containing the images of the linked X-rays of the patients. Similarly, the corresponding Pneumonia and healthy patient X-rays are taken into account in other folders. The pneumonia samples are shown in the same way as the COVID-19 samples. The only images accessible for detecting pneumonia in this situation are X-rays, and CT-scan reports are not available.
The healthy cases of the patients are maintained in the third folder. The example sample of the healthy instances is displayed in Fig. 3. Since we have considered the many types of X-rays, we will also demonstrate the various CT scan samples at a glance.
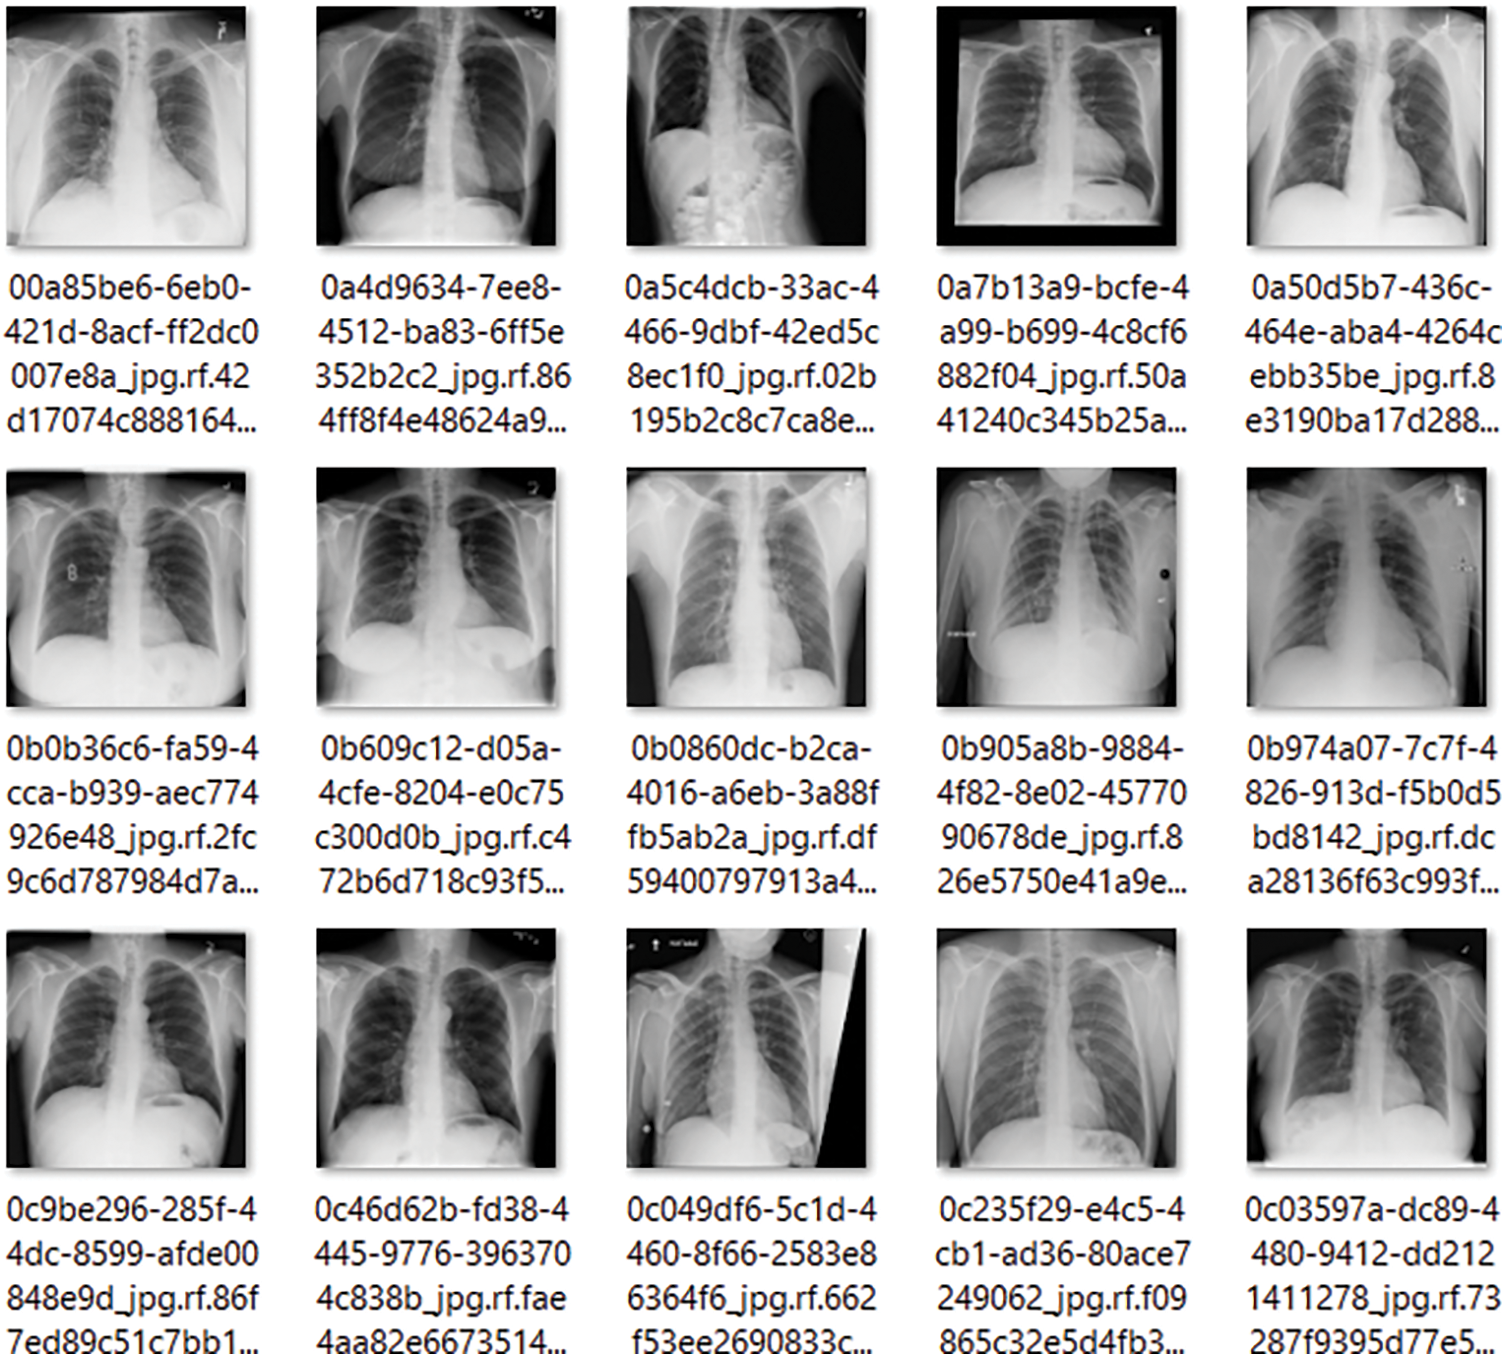
Figure 3: 15 Sample images of the X-rays for the healthy patients
The CT scans for infectious scans are shown in Fig. 4, which seeks to clarify the contents of the scanned report of infection-affected individuals. Since the dataset data will be used to locate infectious locations, medical professionals will be able to determine if the model findings are correct or not. Fig. 5 shows CT scans of healthy patients.
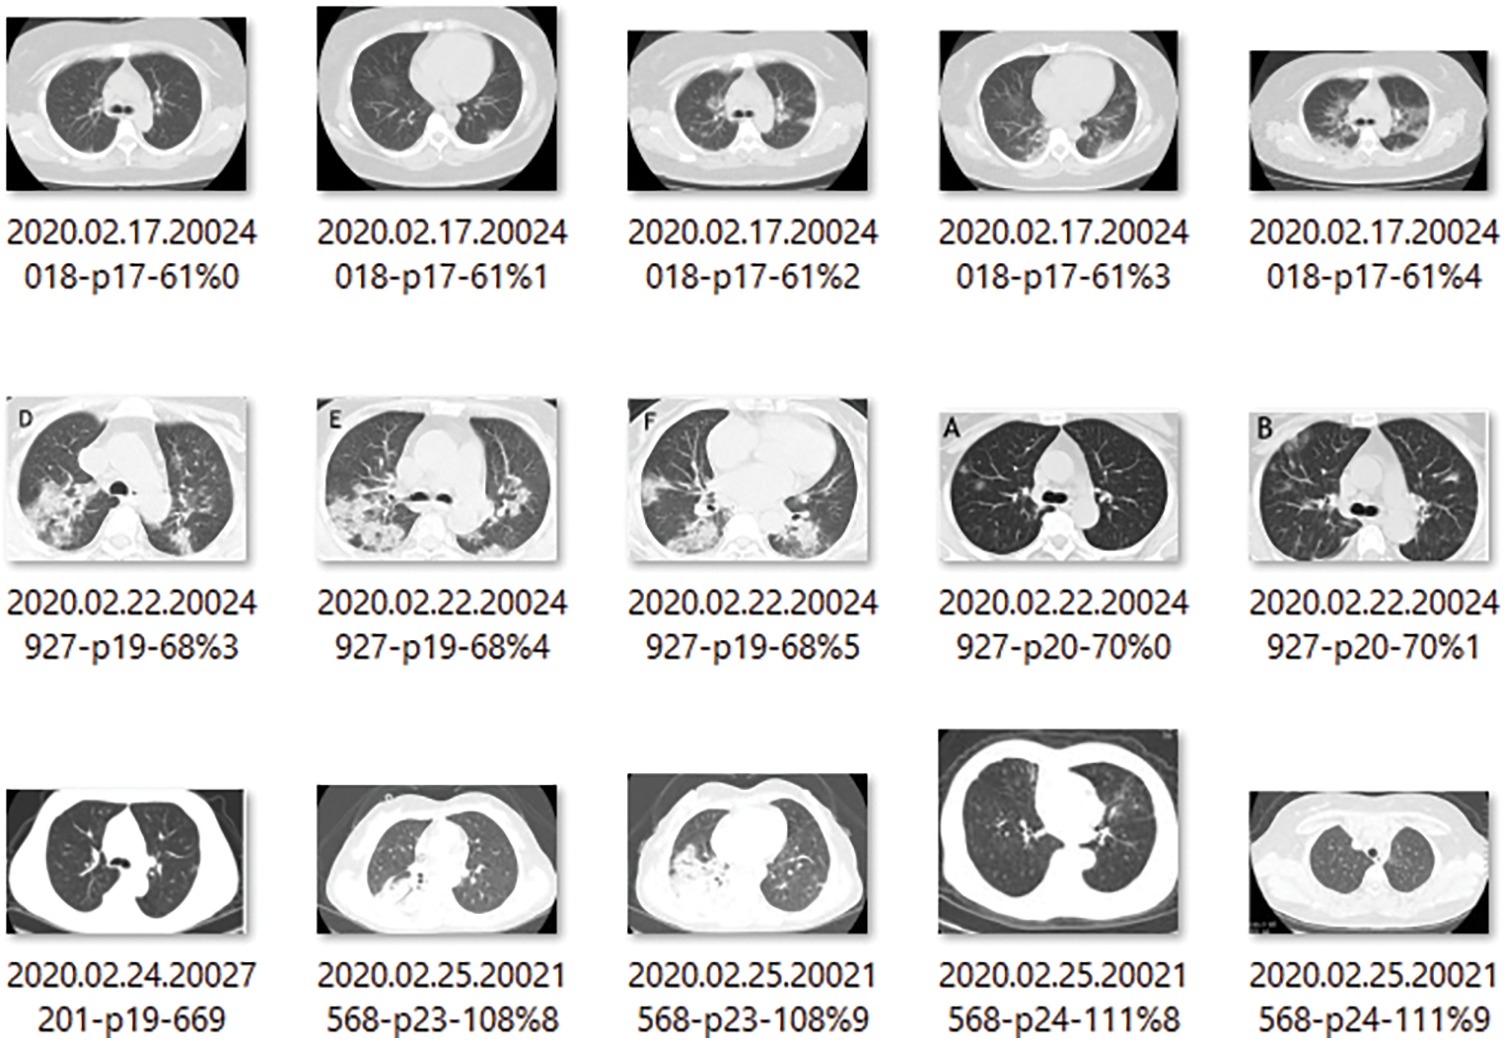
Figure 4: 15 Samples of the images showing the COVID-19 affected patients CT scans reports
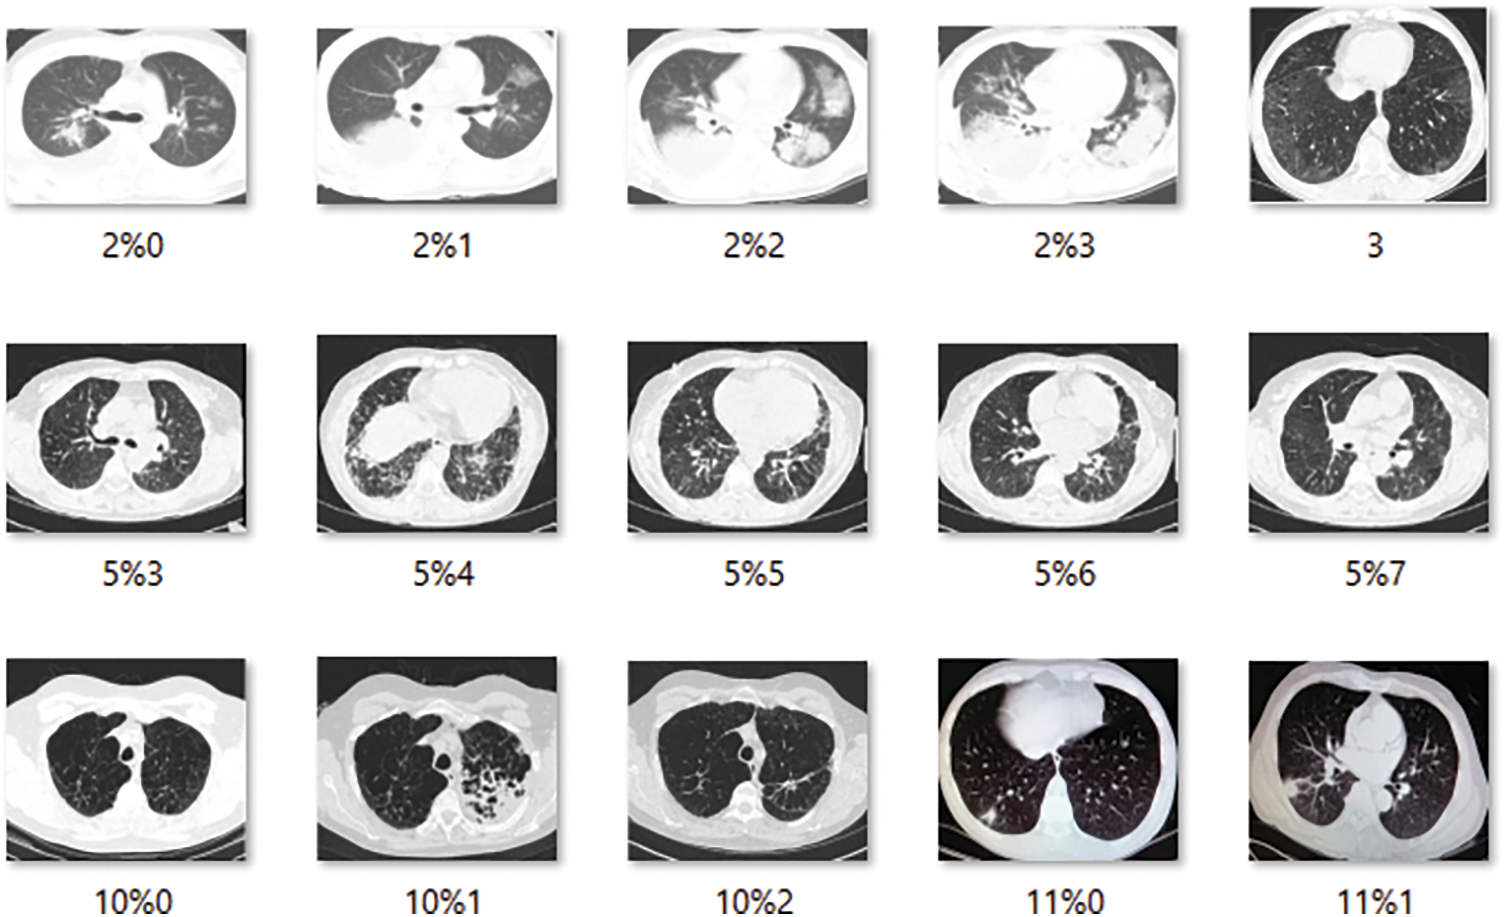
Figure 5: 15 Samples of the images showing the healthy patients CT scans reports
Once the dataset has been extracted and the images have been converted into the format required for modeling, the entire system is designed so that when new real-time data is added to the database, the model should automatically or be triggered to generate the results and send them to the doctor for visualization. In this scenario, two different types of data sources will attempt to trigger the entire process of COVID-19 patient detection. The major goal here is to detect the infected zone in the images and locate it in the images so that the medical practitioner may investigate it and save time. The time saved can be used in a pinch to treat more patients and alleviate the perilous situation that the Pandemic has created, whether in Italy, Spain, or the United States. Now, India is following in its footsteps, and there are places where beds are scarce and doctors are preoccupied with treatment. In a situation like this, a complete answer can be a lifesaver. Once the data is provided, the model should be able to determine what type of data it is, and then proceed to the next step in preparing the answers. After selecting a method, data pre-processing is the next step to consider. We have taken into account image scaling and image enhancement in this circumstance. Images will be collected with varying intensity, size, and source levels.
This must be handled correctly for the model to function properly. In this scenario, two options are considered. The image is resized to 224 × 224 × 1, with the 224 × 224 being the image pixel size and the depth being 1. The photos are read as color to Gray before scaling. As a result, the depth is set to 1. We considered the various types of pre-trained architectures that we discussed in the transfer learning and pre-trained architectures section when doing the feature extraction process. The trained model is subsequently loaded into the device, which is responsible for real-time picture detection. The prediction indicates which class the new image belongs to and attempts to identify and highlight the infectious zone existing in the image. Now, we have covered the architecture flow in detail, let us look at this proposed solution pseudo code and algorithm flow. We utilize a stratification strategy to keep the ratios consistent in the training and validation sample sets, see Fig. 6.
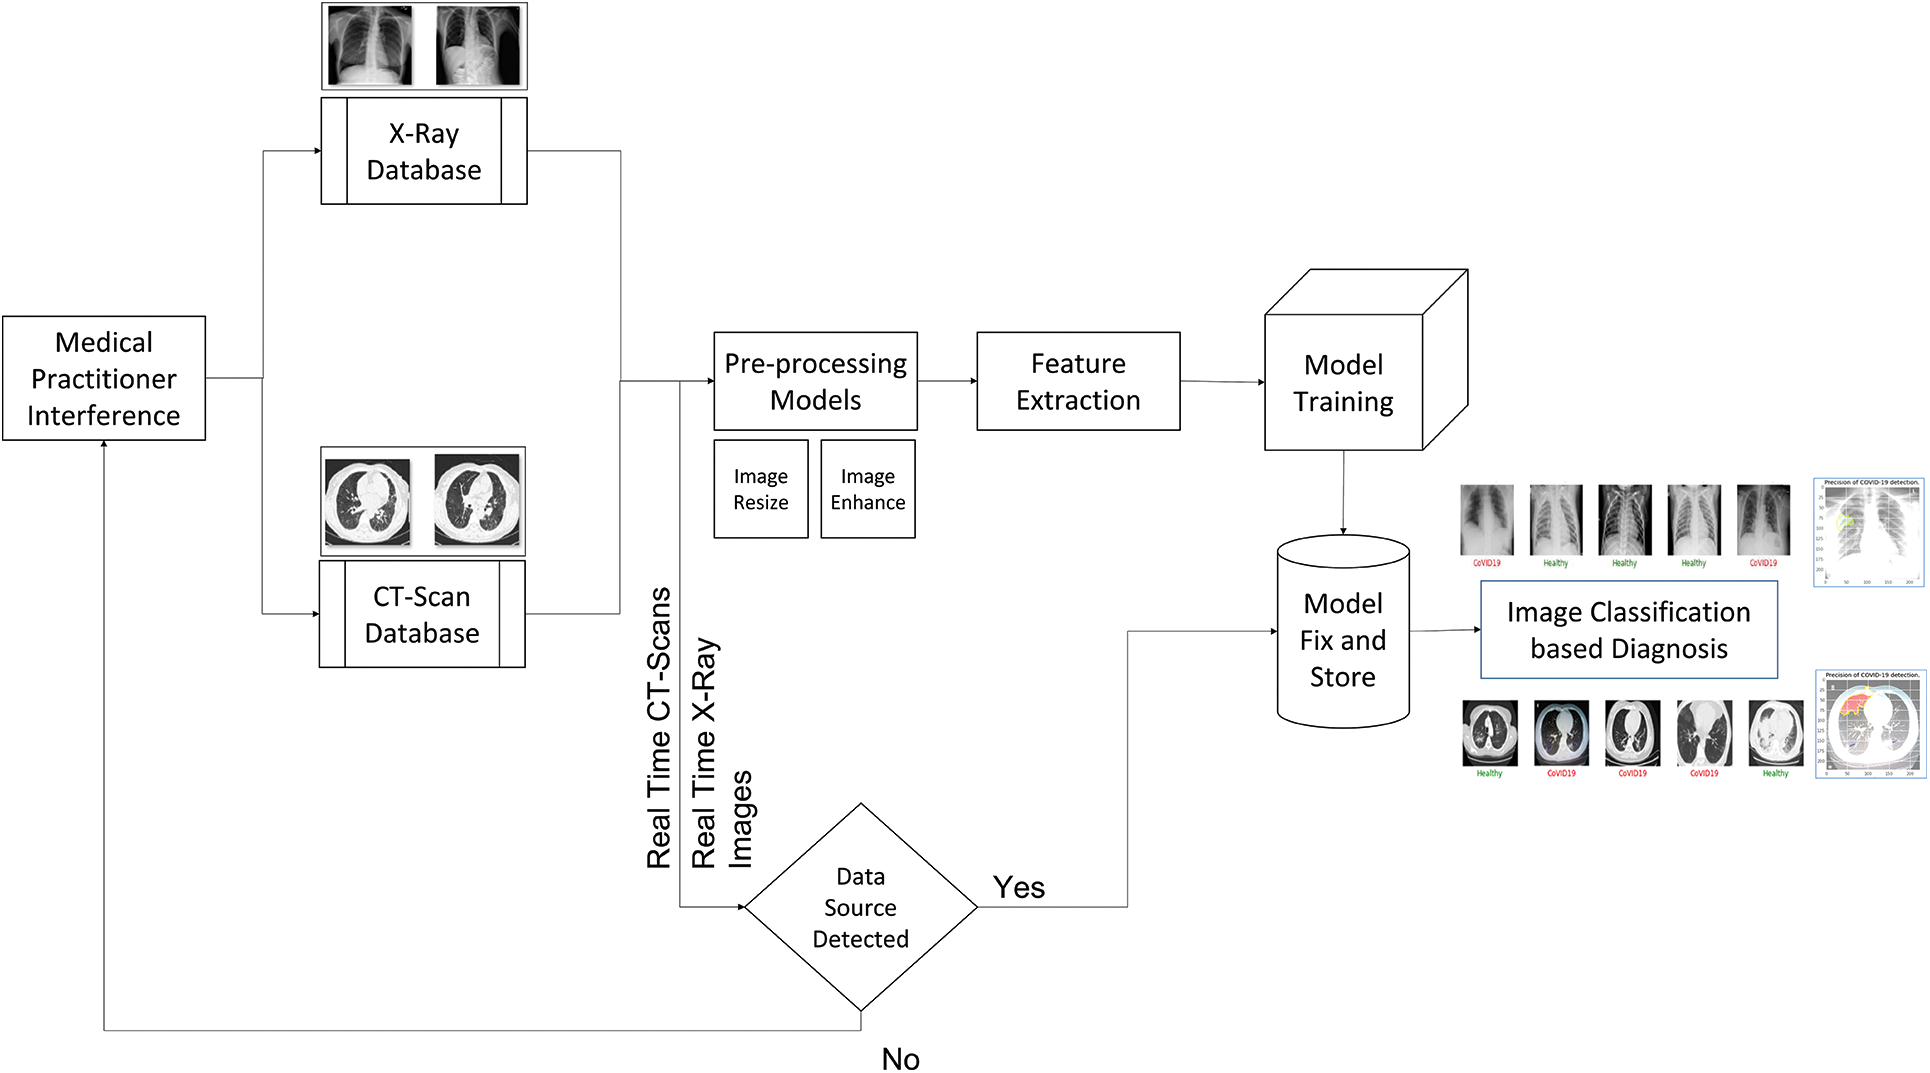
Figure 6: Architecture for the proposed 2-way solution of the COVID-19 detection
The algorithm flow of the scenario of the system in Fig. 6 is as follows:
Step 1: Data Input: Images of the X-rays and the CT-Scans are collected and put into the database
a) X-Rays Database: The X-tays are clustered and passed into this place.
b) CT-Scans Database: similarly, the same thing happens for the CT Scans images as well.
Step 2: Data Pre-Processing: The process carries out resizing and image enhancement.
Step 3: Training and Validation during Final Trained Model Generation: In this case, we have used the Holdout method with varying ratios.
Step 4: Feature Extraction: The pertained models are used to perform the feature extraction and pass the extracted feature image data to the model to train and generate the final classification model.
Step 5: Model Train: The model is Fully Connected Neural Networks of varying shapes to carry out the classification.
Step 6: Model Predict: The real-time data inflow happens and gets the class predicted from the trained model.
Step 7: Infectious Region Markings: It is considered the region which marked the infections based on the features extracted from the last layer of the pre-trained architecture model.
In order to continue with the model analysis, we will use two alternative categorization methods. In the first scenario, we will see if one can find out how the model can tell the difference between the Healthy and COVID-19 cases. The training and testing samples will be divided by 75% and 25% in this binary classification model, respectively. Next, we will run the entire Google Colab with the GPU instance to validate the model. The first data set sample is presented in Fig. 7.
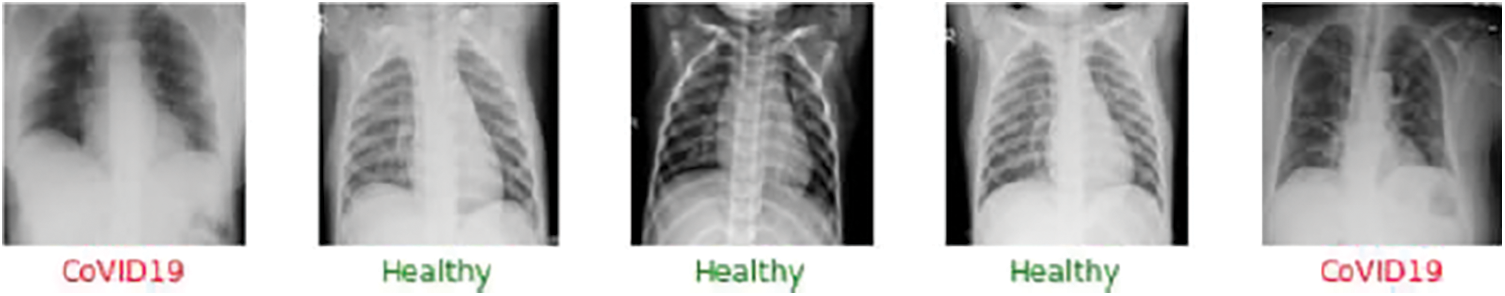
Figure 7: Sample output of the model for the binary classification between the healthy and the COVID-19 cases. The green color in the medical terminology determines the safe
The two-staged scenario will be examined in the binary classification as we have both X-Rays and CT-Scans images. We clean the datasets in a variety of ways, including eliminating data from different angles or the perspectives from which the data was acquired. Some of the photographs are also eliminated since they were improper and blurry. We create three distinct datasets for X-rays and two separate datasets for CT Scans images in order to verify the model performance. One, utilizing a dataset from GitHub’s open-source repository. Second, using open source data with X-rays, we used data from the Roboflow.ai website. The two cases mentioned above are combined to create a third dataset. The Out of sample dataset keeps some of the data out of the modeling context. COVID19 patients accounted for 44 data points in this sample, while healthy data accounted for 532. This ratio will be very close to the real-time situation. The Out of Sample data is included to simulate the real-time scenario of doctors and medical practitioners examining the model and checking for infectious regions in the output. Let’s break up how the various model architectures performed in the various datasets and Out of Sample data. The performance of the model is discussed in Tab. 2.
All of the performance evaluating parameters measured for all pre-trained models are listed in Tab. 2, including Sensitivity, Accuracy, and Specificity. VGG16, ResNet50V2, DenseNet201, DenseNet169, DenseNet121, InceptionV3, InceptionResNetV2, NASNet, MobileNet, VGG19, and Xception are the models we used. The VGG16 and DenseNet performed the best in Dataset 1 and have been highlighted in black. Xception, like the DenseNet, has a similar performance. The specificity here refers to the model that correctly identified the COVID-19 cases. One can say that the model performed well if the Accuracy and Specificity are both great. In the validation sample of dataset 1, VGG16 performs perfectly and accurately identified all of the COVID-19 cases. DenseNet201 comes in second, with an accuracy of 99.3% and a specificity of 94.1%.

DenseNet121 performs with an accuracy of 99.5%, specificity of 88.2%, and sensitivity of 100%, despite its sensitivity being only 99.5%. The Xception Model has a precision of 99.3%, a specificity of 99.3%, and a sensitivity of 100%. When considering dataset two, the model that performs the best is DenseNet201, which has an accuracy of 97.7%, a Specificity of 80%, and a Sensitivity of 99.2%. If we only consider specificity, Xception comes out on top with a score of 90%, but the Sensitivity is 92.6%. When the validation sample from Dataset 3 is considered, DenseNet169 is the best, with 97.9% accuracy, 93.8% specificity, and 98.1% sensitivity. ResNet50V2 is the next best model, with an accuracy of 96.5%, a sensitivity of 97.1%, and a specificity of 87.5%. Finally, MobileNet has a 98% accuracy rate, with a Specificity of 85.4% and a Sensitivity of 98.8%. Before moving on to the employed dataset, let us look at the fact check for the best model in each of the three circumstances. The hypothesis claims that DenseNet architectures fare the best in all three scenarios. The utilized dataset has the similar pattern. DenseNet169 beat everyone with an accuracy of 98.8%, Specificity of 94.1%, and Sensitivity of 99.1% when the trained method is applied to dataset3, which is then merged dataset for all the data from Dataset 1 and Dataset 2. Fig. 8 offers the confusion matrix for DenseNet169.
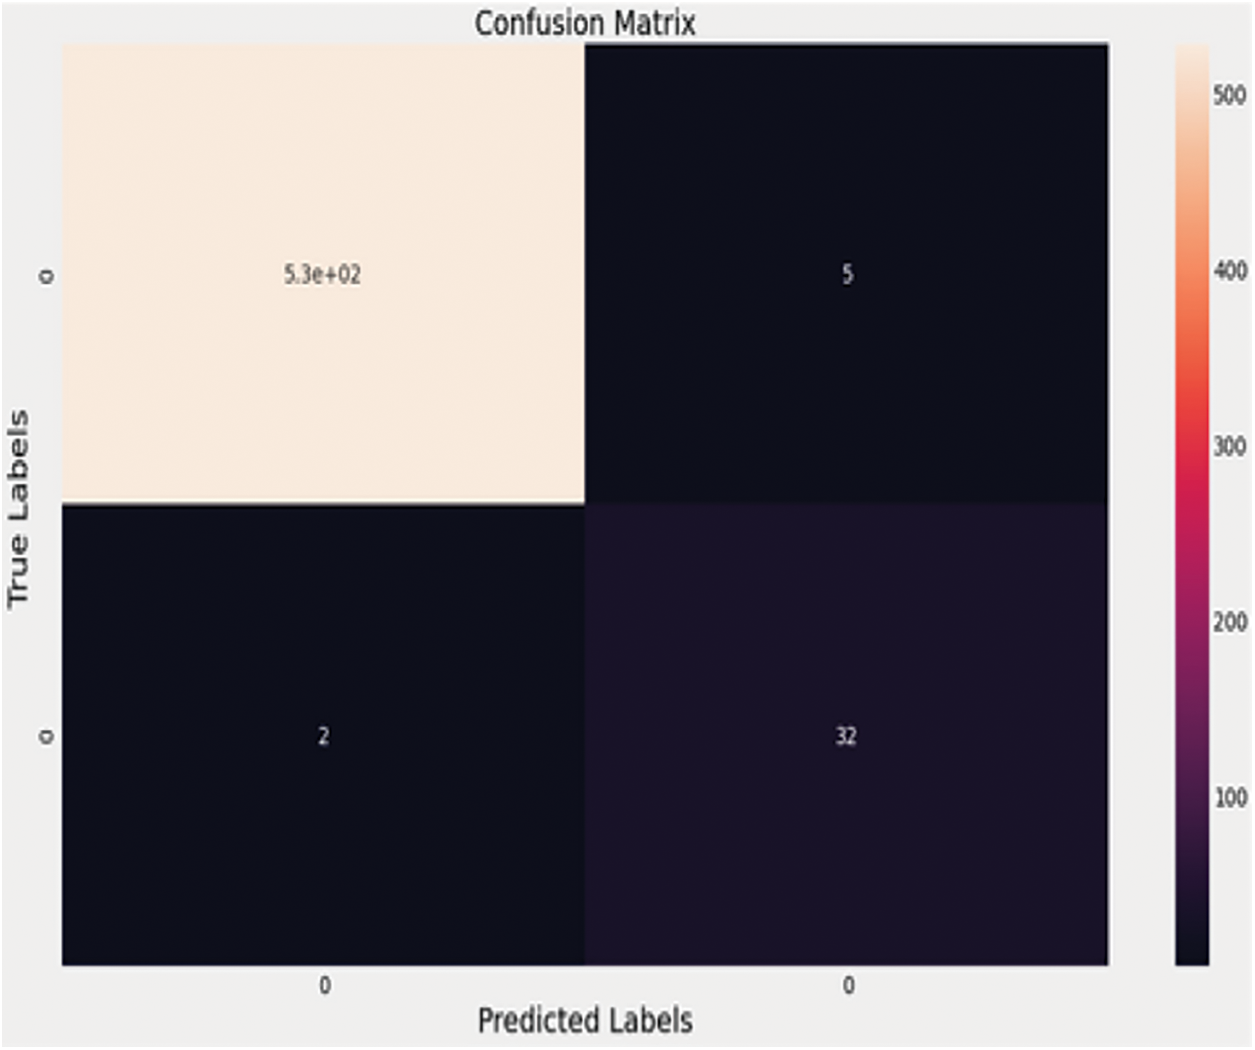
Figure 8: Confusion matrix for densenet169
According to the confusion matrix, the 34 COVID-19 cases are properly predicted, with two examples in the questionable zone. Fig. 9 shows the performance curves for the same architecture. In the real-time scenario, the infected region is visualized using the LIME software, and the area can be highlighted in a color pattern to help clinicians understand how the model works. Below is an example of an X-ray image with the infected zone highlighted. The CT-Scans dataset is likewise subjected to a similar analysis.
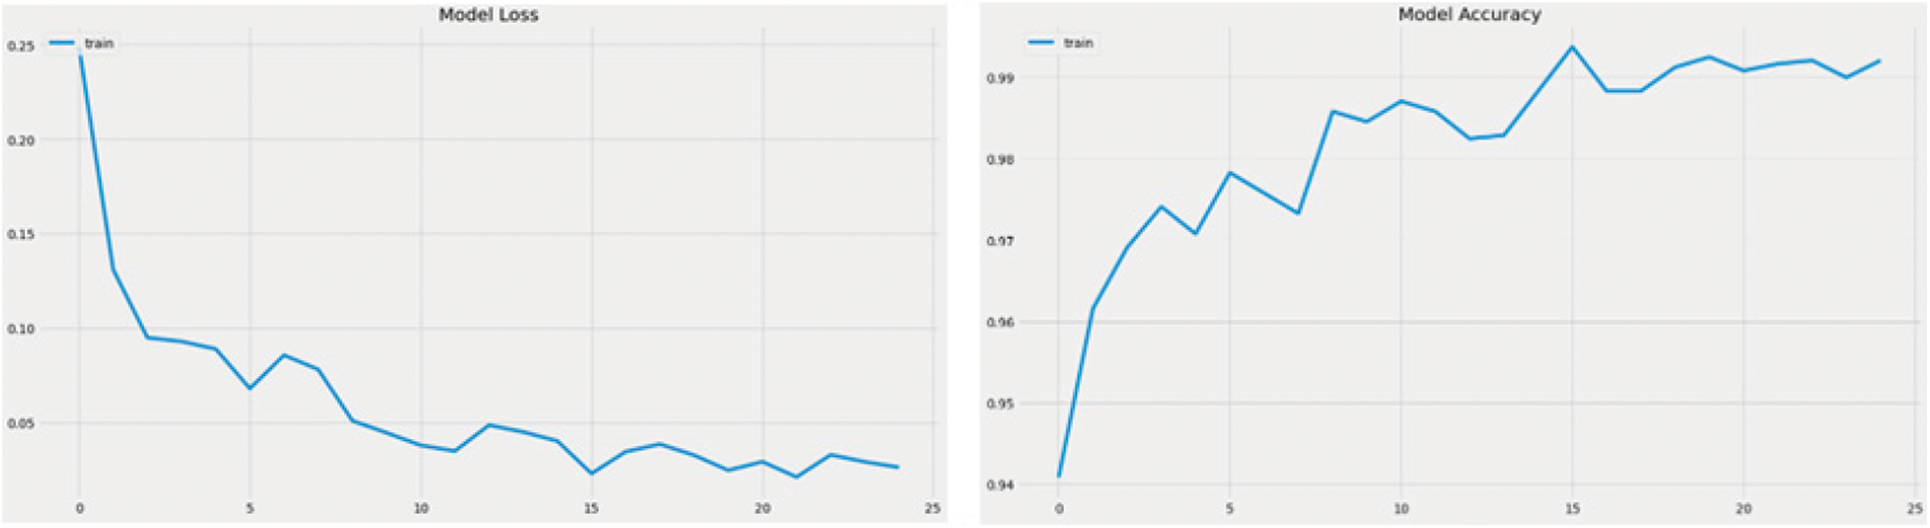
Figure 9: Accuracy curve and the model loss curve of DenseNet 169
A similar procedure is followed in the case of CT-Scans as well. The CT COVID research publication provide the dataset that is utilized to create the model for automatic detection of the infected zone. This dataset contains CT images of 146 COVID-19 infected individuals and 397 images of healthy people. The OOS data is filtered to remove 22 photos from dataset two, including both X-Rays and CT-Scan images. The OOS data is then analyzed to determine the optimal model for infection detection in the future. We utilize the Holdout approach to construct the model. Seventy-five percent of the data is utilized in the training phase, while twenty-five percent is used in the validation process. The model that performs the best in both the validation and the OOS data can be deemed the best. As a result, the model must perform well in OOS data and in the validation sample to be judged superior to others. The performance of all pre-trained designs is compared in Tab. 3. Figs. 10 and 11 show examples of results.
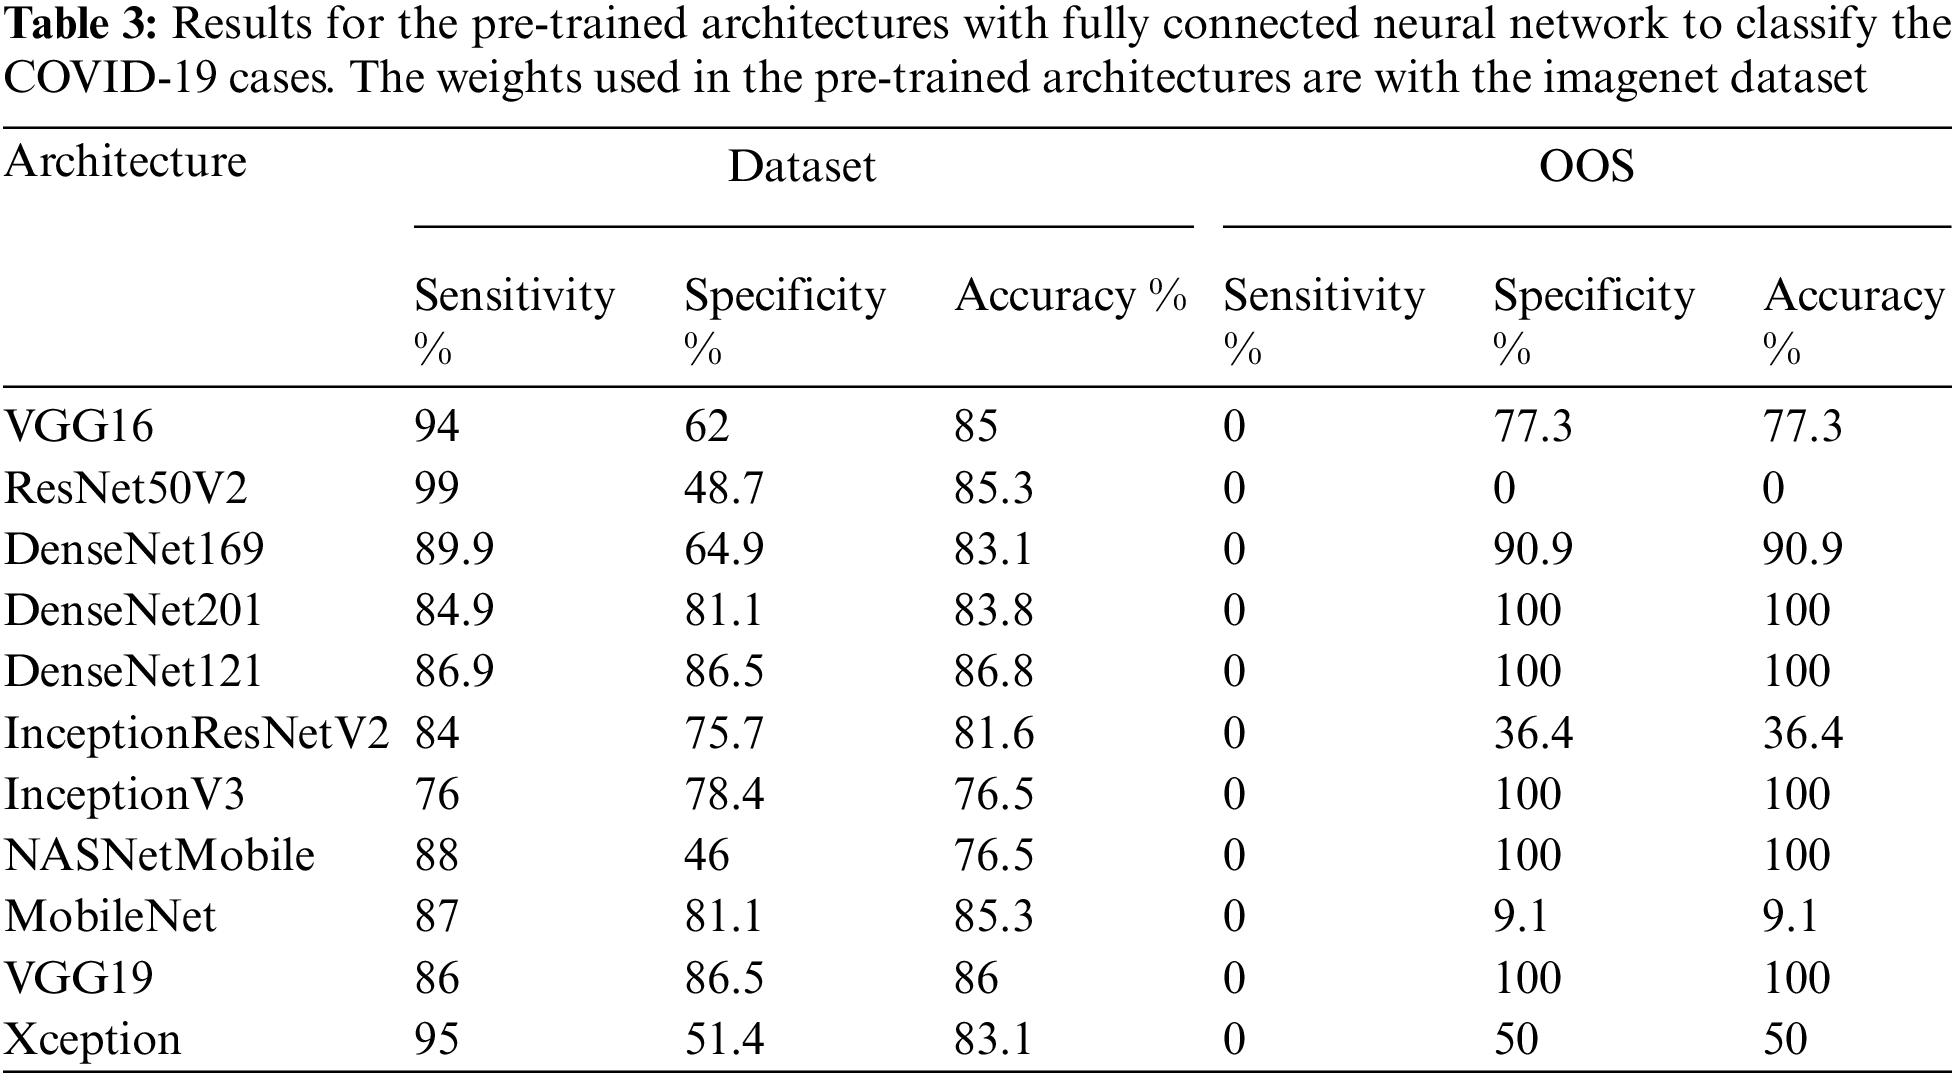
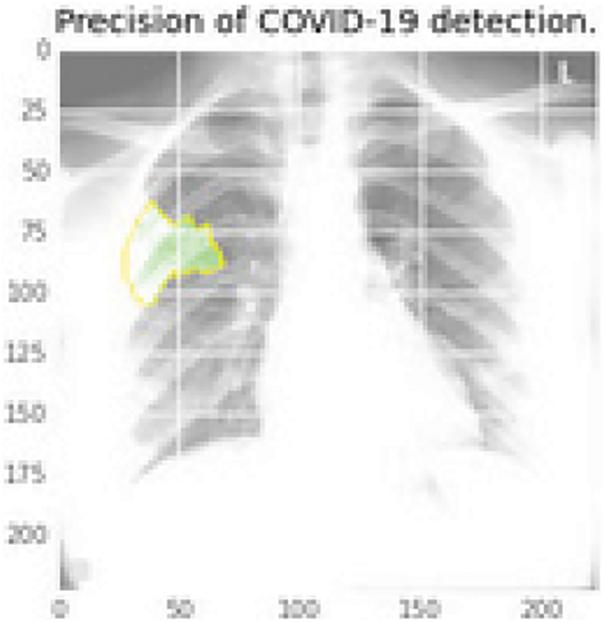
Figure 10: Infectious region in green color using the last layer features of the DenseNet169 that extracted the elements and then mapped into the original image
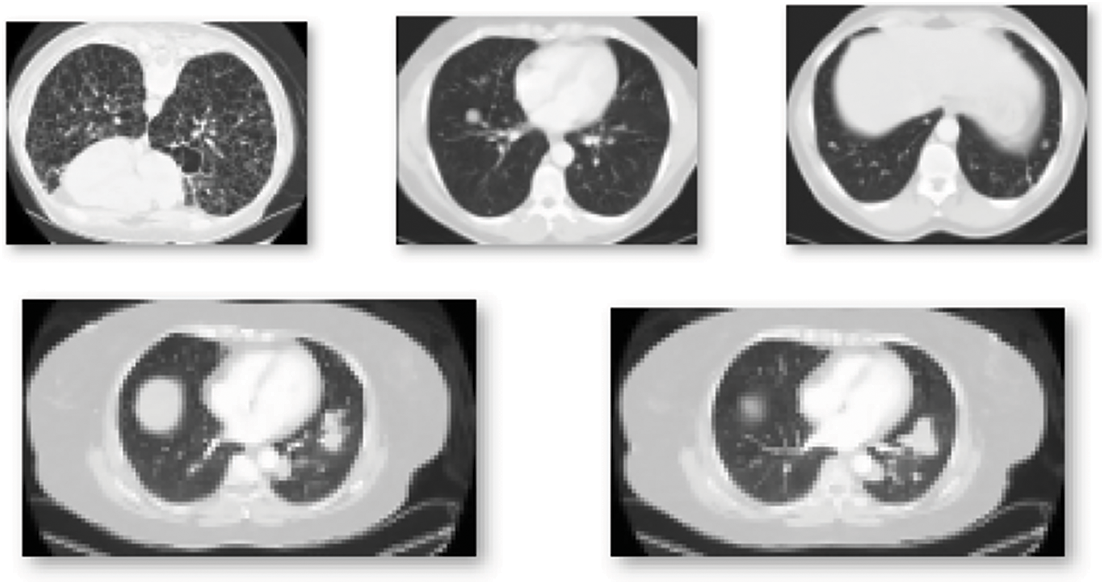
Figure 11: Sample CT scans report for the training of the model for the detection of the COVID-19 infection
The DenseNet networks, as well as the Very Deep Convolutional Networks (VGGNet)19, fare admirably in Tab. 3. DenseNet121 is the most accurate, with an accuracy of 86.8%, a specificity of 86.5%, and a sensitivity of 86.9%, followed by VGG19, which has similar findings. DenseNet169 and DenseNet201 accurately categorize the 22 photos as COVID-19 cases while using the OOS. The model fare the best since the OOS had all the COVID-19 instances. The VGG19 produces 100% correct results as well. The DenseNet121 network’s model accuracy and Loss curve are presented in Fig. 12. Because the DenseNet network is chosen as the model in both the CT scans and the X-rays, the trained model may now sit in the program and assess real-time performance. Figs. 13–16 show examples of results.
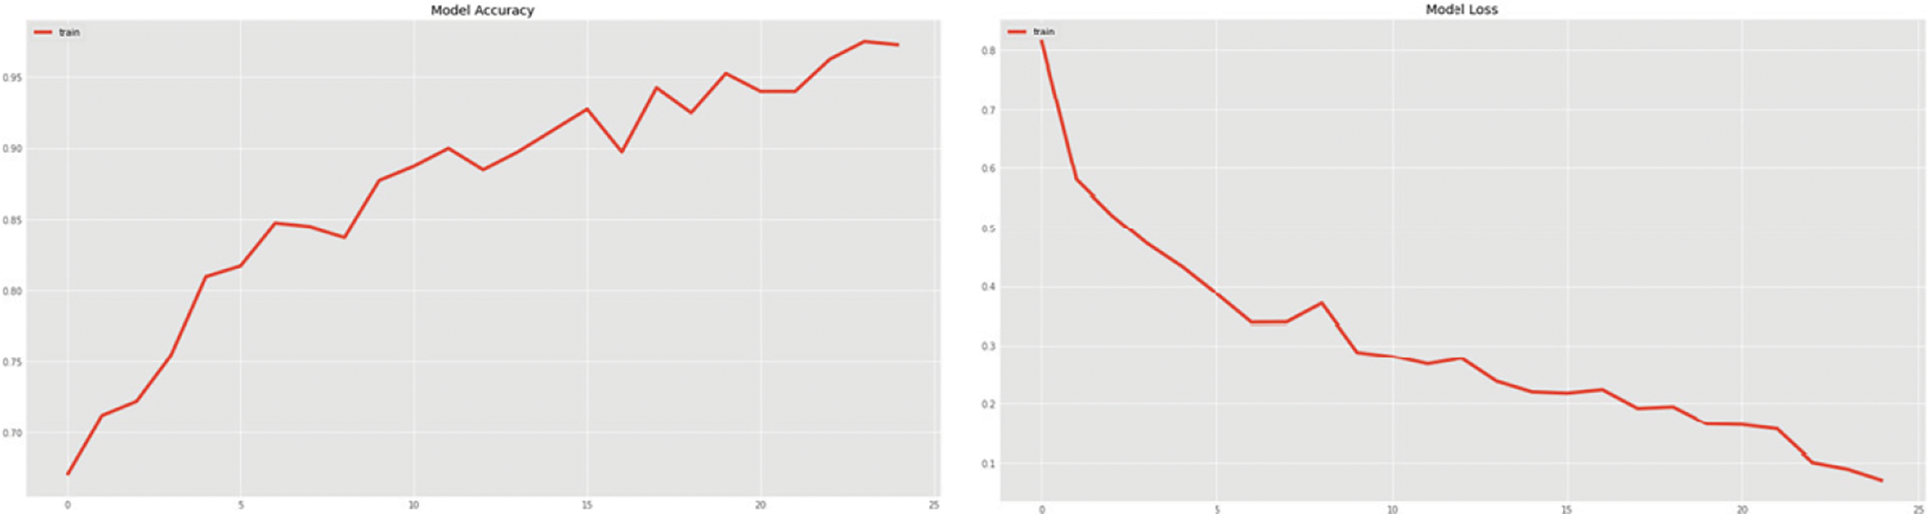
Figure 12: DenseNet121 model accuracy and the loss curve on the training sample for the fitting of the model
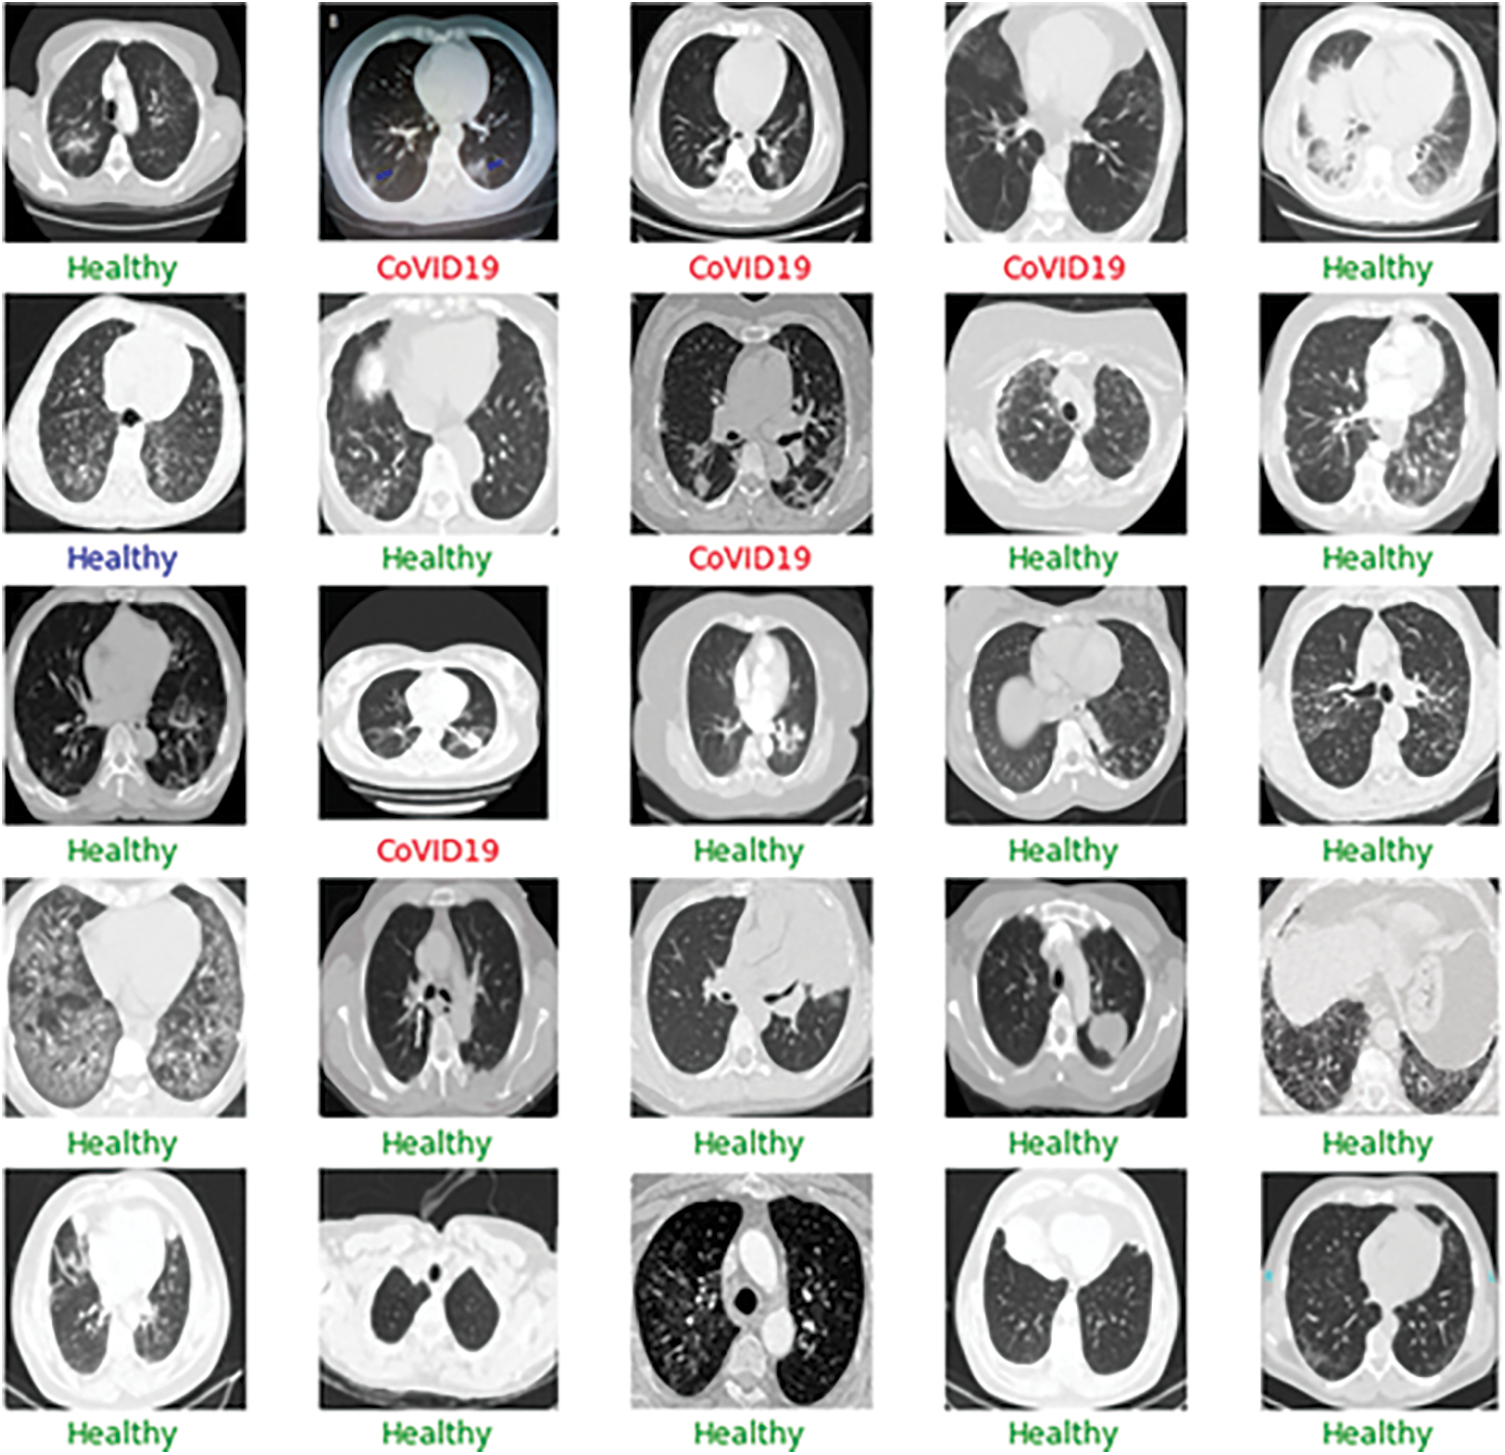
Figure 13: Sample output of the CT-scan results depicting the results of the batch input of the images
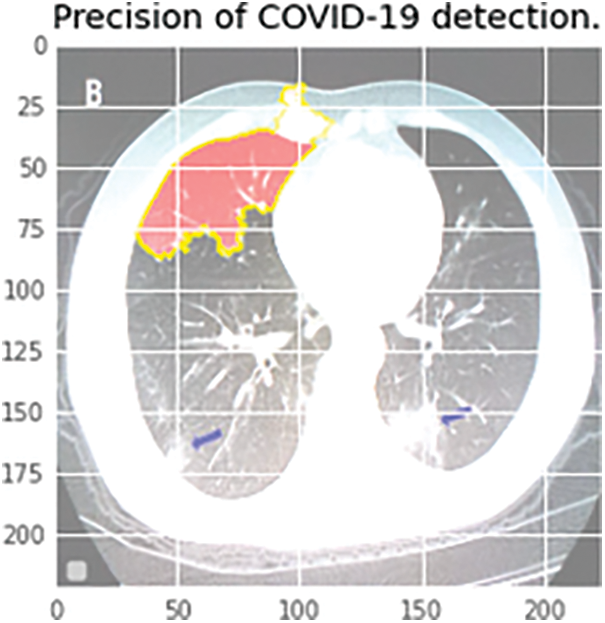
Figure 14: Infectious region depiction in the CT scan report. The colored region highlights the more critical decision-making region
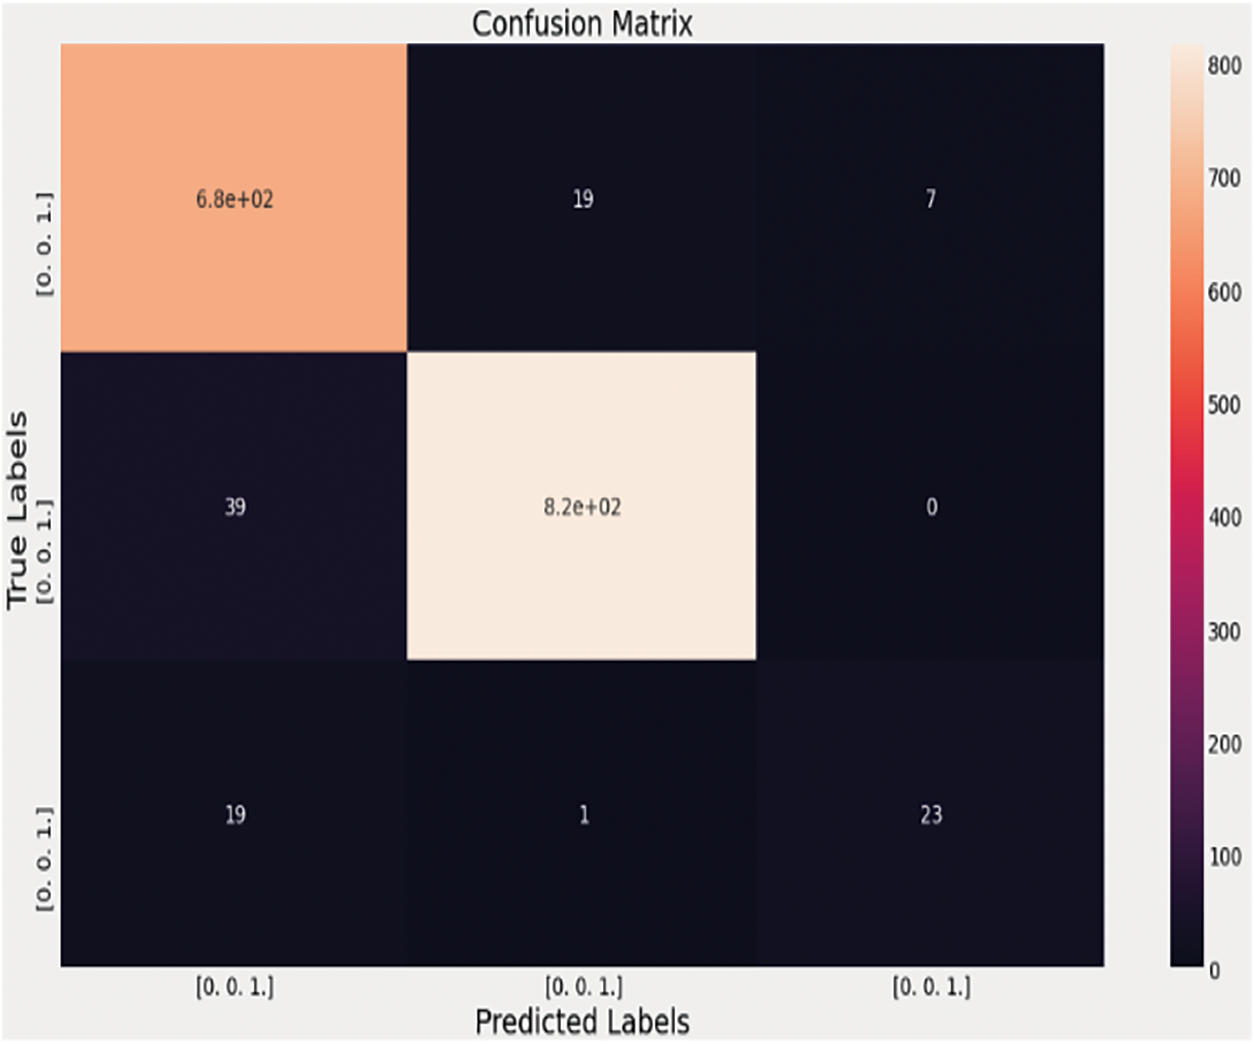
Figure 15: Confusion matrix of the VGG-16 algorithm with the fully connected neural network on the 3-class dataset for the detection of the pneumonia cases, healthy cases, and the COVID-19 pneumonia cases
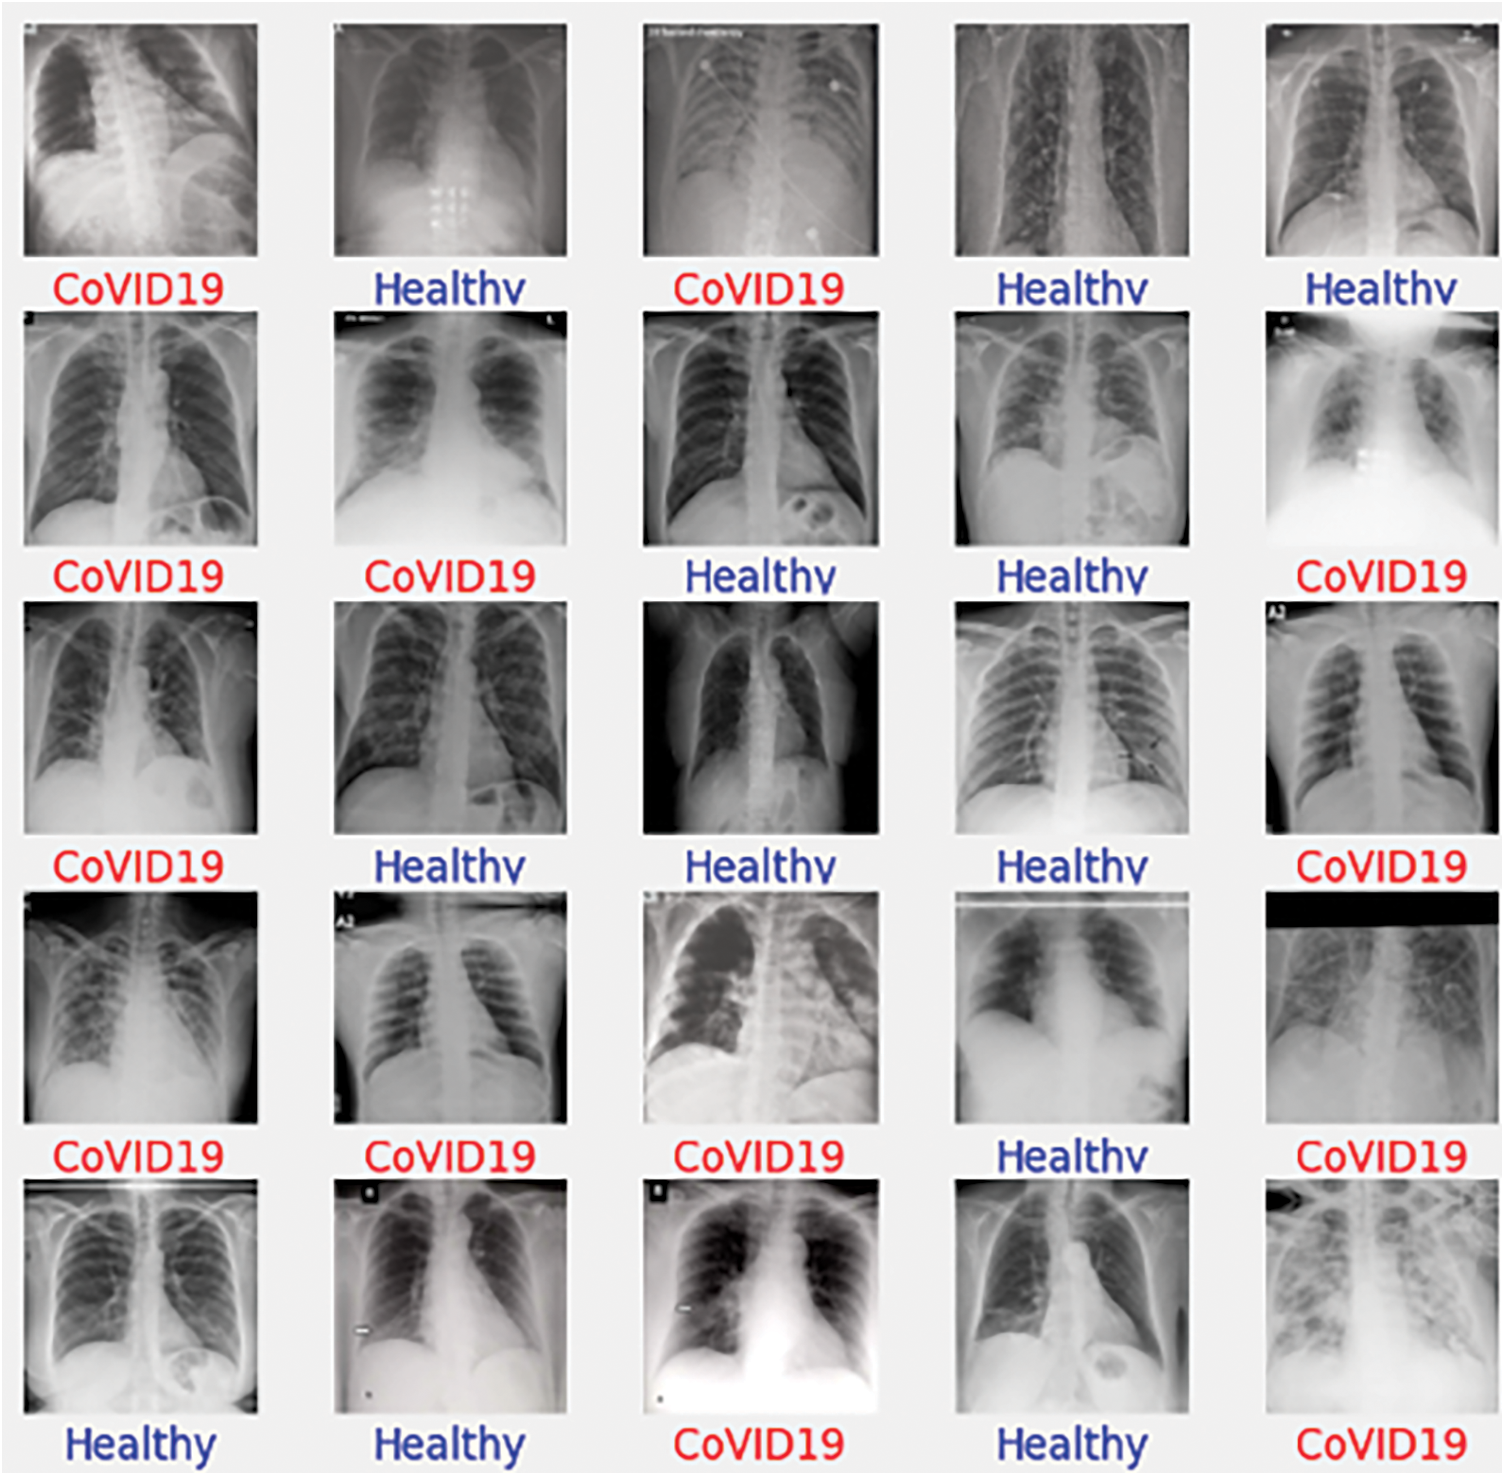
Figure 16: Real-time scenario
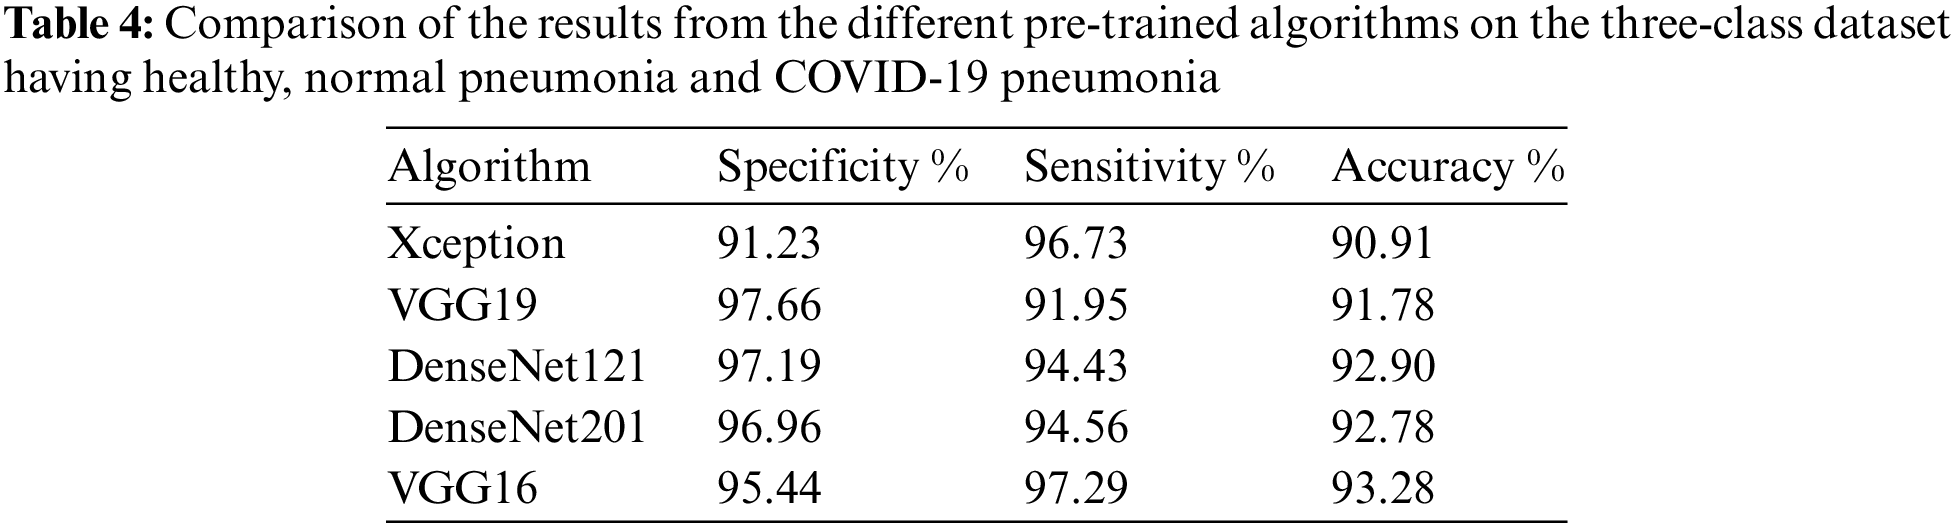
The blue color represents the unpredictability of the classification score, and the green color depicts while the red color depicts Danger. When the infectious region needs to be checked by the Medical Practitioner, the following image can provide more details, similar to X-Rays. The next step in the process is to separate the normal pneumonia cases from the COVID-pneumonia cases and the healthy individuals. The performance of several designs on the 3-class classification issue is shown in Tab. 4. The VGG-16 performs better not only in terms of accuracy but also in terms of specificity and sensitivity, as seen in Tab. 4. The VGG-16 architecture has a precision of 93.28%.
When the image is a typical pneumonia case, the model does not anticipate any COVID-19 cases, as shown in the confusion matrix above. Unlike the examples before, one COVID-19 image is incorrectly labeled as Pneumonia. When attempting to check out a real-time issue, the following graphic depicts how the results will be presented to the doctor or any medical practitioner. The entire idea of this technique and the 2WCD is to reduce the time it takes for physicians and medical professionals to successfully isolate COVID-19 patients from the general population in order to avoid virus transmission. With the DenseNet network on X-ray imaging, we achieved 99% precision, 94.1% specificity, 87% precision, and 86.5% specificity for CT scans in study or confirmation sets. The experiment is carried out with the correct identification of all 22 patients by randomly collecting 22 pictures of COVID-19-infected individuals in a CT-Scans (OOS) out-of-sample. No model can ever replace or decide a doctor because so many other factors influence a decision at any one time. Nevertheless, VGG-16 outperforms all other models in the 3-class classification task.
The key goal of having the solution is to help the doctor increase the diagnostic time so that more patients may be treated in this high-emergency situation when tens of thousands of individuals are infected with SARS-CoV2 every day around the world. In this pandemic condition, time and placement in the hospital are more essential in saving the lives of infected individuals. The model cannot replace a doctor, nor can it judge a doctor who is influenced by a number of different factors at any one time. Our research program is designed to make a doctor’s life easier by providing modest recommendations based on what he has learned from the hundreds of data points sent to him. Data is always a critical component in developing any DL or machine learning model. Because the COVID-19 is such a recent and unexpected issue, data sources are limited. However, if more data is supplied into the system, it will perform better and be more useful in real-time, as we noticed in the results section. We examined the data to a number of pre-trained algorithms and found that DenseNet performs admirably in both OOS datasets. We found that DenseNet architecture predicts 32 of the 34 COVID-19 positive cases in the real-time scenario and 532 safe cases out of 537 real-time samples for X-rays, and predicts 37 COVID-19 instances for CT-scans with 86.5% precision. The VGG-16 outperforms the others in the three-class problem for detecting Pneumonia in COVID-19 cases. We employed pre-trained algorithms due to several constraints in the system environment and dataset.
In the future, we should concentrate on the following points:
1) Getting more data for the deep learning models to work better.
2) Re-Training the architectures to better learn from the input dataset.
3) Ensembling the models to generate more accurate results.
Acknowledgement: This work was funded by the Researchers Supporting Project Number (RSP-2021/300), King Saud University, Riyadh, Saudi Arabia.
Funding Statement: This work was funded by the Researchers Supporting Project Number (RSP-2021/300), King Saud University, Riyadh, Saudi Arabia.
Conflicts of Interest: The authors declare that they have no conflicts of interest to report regarding the present study.
1. X. Jian, “SARS, MERS and COVID-19 among healthcare workers: A narrative review,” Journal of Infection and Public Health, vol. 13, no. 6, pp. 843–848, 2020. [Google Scholar]
2. W. El-Shafai, N. El-Hag, G. El-Banby, A. Khalaf, N. Soliman et al., “An efficient CNN-based automated diagnosis framework from COVID-19 CT images,” Computers, Materials & Continua, vol. 69, no. 1, pp. 1323–1341, 2021. [Google Scholar]
3. G. Wei-jie, “Clinical characteristics of coronavirus disease 2019 in China,” New England Journal of Medicine, vol. 382, no. 18, pp. 1708–1720, 2020. [Google Scholar]
4. W. El-Shafai, S. Abd El-Nabi, E. El-Rabaie, A. Ali and F. Soliman, “Efficient deep-learning-based autoencoder denoising approach for medical image diagnosis,” Computers, Materials and Continua, vol. 70, no. 3, pp. 6107–6125, 2022. [Google Scholar]
5. W. El-Shafai, A. Mohamed, E. El-Rabaie, A. Ali and F. Soliman, “Automated COVID-19 detection based on single-image super-resolution and CNN models,” Computers, Materials and Continua, vol. 69, no. 3, pp. 1141–1157, 2021. [Google Scholar]
6. L. Lin, “Using artificial intelligence to detect COVID-19 and community-acquired pneumonia based on pulmonary CT: Evaluation of the diagnostic accuracy,” Radiology, vol. 296, no. 2, pp. E65–E71, 2020. [Google Scholar]
7. N. Ali, C. Kaya and Z. Pamuk, “Automatic detection of coronavirus disease (COVID-19) using X-ray images and deep convolutional neural networks,” Pattern Analysis and Applications, vol. 4, no. 6, pp. 1–14, 2021. [Google Scholar]
8. H. Chaolin, “Clinical features of patients infected with 2019 novel coronavirus in Wuhan, China,” The Lancet, vol. 3, no. 3, pp. 497–506, 2020. [Google Scholar]
9. A. Nimai, “Infection severity detection of COVID19 from X-rays and CT scans using artificial intelligence,” International Journal of Computer (IJC), vol. 38, no. 1, pp. 73–92, 2020. [Google Scholar]
10. W. El-Shafai, A. Algarni, G. El Banby, F. El-Samie and N. Soliman, “Classification framework for COVID-19 diagnosis based on deep CNN models,” Intelligent Automation and Soft Computing, vol. 30, no. 3, pp. 1561–1575, 2022. [Google Scholar]
11. W. Linda, Z. Lin and A. Wong, “Covid-net: A tailored deep convolutional neural network design for detection of covid-19 cases from chest X-ray images,” Scientific Reports, vol. 10, no. 1, pp. 1–12, 2020. [Google Scholar]
12. N. Soliman, S. Abd-Alhalem, W. El-Shafai, S. Abdulrahman and F. Abd El-Samie, “An improved convolutional neural network model for DNA classification,” Computers, Materials and Continua, vol. 70, no. 3, pp. 5907–5927, 2022. [Google Scholar]
13. A. Nimai, “Prevention of heart problem using artificial intelligence,” International Journal of Artificial Intelligence and Applications (IJAIA), vol. 9, no. 2, pp. 10–19, 2018. [Google Scholar]
14. U. Ferhat and D. Korkmaz, “COVIDiagnosis-net: Deep Bayes-squeezenet based diagnosis of the coronavirus disease 2019 (COVID-19) from X-ray images,” Medical Hypotheses, vol. 14, no. 10, pp. 109–120, 2020. [Google Scholar]
15. W. El-Shafai, A. Mahmoud, E. El-Rabaie, T. Taha and F. El-Samie, “Efficient deep CNN model for COVID-19 classification,” Computers, Materials and Continua, vol. 70, no. 3, pp. 4373–4391, 2022. [Google Scholar]
16. A. Algarni, W. El-Shafai, G. El Banby, F. El-Samie and N. Soliman, “An efficient CNN-based hybrid classification and segmentation approach for COVID-19 detection,” Computers, Materials and Continua, vol. 70, no. 2, pp. 4393–4410, 2022. [Google Scholar]
17. W. Wenling, “Detection of SARS-CoV-2 in different types of clinical specimens,” Jama, vol. 3, no. 3, pp. 1843–1844, 2020. [Google Scholar]
18. O. Tulin, “Automated detection of COVID-19 cases using deep neural networks with X-ray images,” Computers in Biology and Medicine, vol. 12, no. 1, pp. 103–114, 2020. [Google Scholar]
19. W. Jon, “Steps toward architecture-independent image processing,” Computer, vol. 25, no. 2, pp. 21–31, 1992. [Google Scholar]
20. W. El-Shafai and F. Abd El-Samie, “Extensive COVID-19 X-ray and CT chest images dataset,” Mendeley Data, v3, http://dx.doi.org/10.17632/8h65ywd2jr.3, 2020. [Google Scholar]
 | This work is licensed under a Creative Commons Attribution 4.0 International License, which permits unrestricted use, distribution, and reproduction in any medium, provided the original work is properly cited. |