DOI:10.32604/cmc.2022.030445
| Computers, Materials & Continua DOI:10.32604/cmc.2022.030445 | |
| Article |
Optimization Ensemble Weights Model for Wind Forecasting System
1Department of Computer Sciences, College of Computer and Information Sciences, Princess Nourah bint Abdulrahman University, Riyadh, 11671, Saudi Arabia
2Department of Communications and Electronics, Delta Higher Institute of Engineering and Technology, Mansoura, 35111, Egypt
3Faculty of Artificial Intelligence, Delta University for Science and Technology, Mansoura, 35712, Egypt
4Electrical Engineering Department, Faculty of Engineering, Mansoura University, Mansoura, 35516, Egypt
5Delta Higher Institute of Engineering and Technology (DHIET), Mansoura, 35111, Egypt
6Department of Electrical Engineering, Faculty of Engineering at Shoubra, Benha University, Cairo, 11629, Egypt
7Faculty of Engineering, Delta University for Science and Technology, Gamasa, Mansoura, 11152, Egypt
*Corresponding Author: Hussah Nasser AlEisa. Email: haleisa@pnu.edu.sa
Received: 26 March 2022; Accepted: 26 April 2022
Abstract: Effective technology for wind direction forecasting can be realized using the recent advances in machine learning. Consequently, the stability and safety of power systems are expected to be significantly improved. However, the unstable and unpredictable qualities of the wind predict the wind direction a challenging problem. This paper proposes a practical forecasting approach based on the weighted ensemble of machine learning models. This weighted ensemble is optimized using a whale optimization algorithm guided by particle swarm optimization (PSO-Guided WOA). The proposed optimized weighted ensemble predicts the wind direction given a set of input features. The conducted experiments employed the wind power forecasting dataset, freely available on Kaggle and developed to predict the regular power generation at seven wind farms over forty-eight hours. The recorded results of the conducted experiments emphasize the effectiveness of the proposed ensemble in achieving accurate predictions of the wind direction. In addition, a comparison is established between the proposed optimized ensemble and other competing optimized ensembles to prove its superiority. Moreover, statistical analysis using one-way analysis of variance (ANOVA) and Wilcoxon’s rank-sum are provided based on the recorded results to confirm the excellent accuracy achieved by the proposed optimized weighted ensemble.
Keywords: Guided Whale Optimization Algorithm (Guided WOA); forecasting; machine learning; weighted ensemble model; wind direction
Wind energy is intermittent and unpredictable; therefore, increasing wind power absorption into power grids may significantly impact the safe operation of power systems, and the quality of the electricity generated [1,2]. This is due to the amount of wind energy generated being proportional to the speed of the wind. Consequently, designing and implementing an effective wind velocity prediction system may improve the security and safety of power systems that include a large proportion of renewable energy sources [3]. Wind energy is a vital low-carbon energy technology that cannot be ignored. It can offer a long-term energy supply and serve as a critical component in the design of intelligent metering for micro-grids [4].
The evaluation of wind speed prediction confusion provides a comprehensive reference to aid in the operation of power systems [5,6]. Bayesian, delta, and bootstrap probabilistic forecasting techniques are examples of conventional probabilistic forecasting methodologies [7,8]. Constrained data partitioning, massive processing loads, and implementation issues all impede the adoption of these systems due to the tight limits. Several techniques, including quantile regression, kernel density forecasting, and the Gaussian process, have been used to generate prediction intervals (PIs); nevertheless, the ways used to create PIs require complex mathematical calculations or rely on accurate predicting results [9].
Wind energy has attracted the attention of many governments throughout the globe as a source of clean, sustainable, and renewable energy [10,11]. It is seen to improve air quality, reduce greenhouse gas emissions, and reduce dependence on fossil fuels. Wind turbine technology has advanced simultaneously, spurred on by the rise of new industries, and is now considered to be one of the most promising alternative energy power generation alternatives for economic growth [12]. This technique has significantly decreased the issue of a traditional energy shortage, has repaired the fundamental defects in the original energy structure, and has dramatically improved the overall performance of the environmental system.
Wind energy is used in various applications across the globe, including grid-connected and off-grid systems. Consequently, numerous countries have included it in their long-term electricity production plans [13]. However, as the technology of the wind energy company progresses, the company will have to deal with several vital obstacles. Considering that wind speed is erratic, difficult to predict, and unpredictable, the inconsistent volatility of airspeed will also add to the instability of wind power [14]. Despite all the advantages of renewable energy, wind speed is very variable due to its stochastic, discontinuous, and non-stationary nature [15], which makes it difficult to predict. As a result of these qualities, wind energy is a problematic renewable energy source to study [16].
The development of sufficiently exact wind power prediction models, as a result, would play a critical role in lowering the incidence of expensive limits and regulations, as well as boosting the stability of wind power operations [17]. A variety of solutions have been developed in recent years to address the issues raised earlier in the discussion of wind modeling. These solutions are classified as follows [18]: physical prototypes-based models, traditional statistical-based models, machine learning-based models, and hybrid AI-based models.
Several essential publications are worth noting in the literature, and they all indicate the necessity for a new wind speed forecasting technology to be developed. On the other hand, the traditional methodologies are unable to provide sufficient forecasts because of the chaotic characteristics and significant variability of wind series data. Because of their considerably enhanced prediction accuracy, artificial neural networks [19] have risen in prominence as a means of overcoming this difficulty. According to the conclusions of extensive testing, testing data and statistical analysis demonstrate that DNR may achieve exceptionally competitive wind velocity forecasting results compared to other cutting-edge prediction systems.
Accurate and thorough short-term wind speed prediction is a significant problem for integrating wind turbine power generation into the electrical grid. To solve the difficulty of defining the set of parameters and attaining accurate prediction performance for wind speed prediction randomized forest, authors in [20] employed an updated fruit fly optimization approach to optimize the wind parameters. Experiments have shown that the combination model has superior prediction performance than other techniques, demonstrating the method’s applicability in parameter estimation [21]. On the other hand, wind speed’s yearly and variable characteristics make forecasting problematic. To improve the accuracy of wind speed predictions, a hybrid deep learning evolutionary technique was developed in-house and presented in [15]. This approach provided a short-term stochastic prediction technique of airspeed using nonlinear regression analysis based on evolutionary absolute shrinkage and selection controllers as well as integrated criteria to improve the efficacy of the PIs [22] to improve their effectiveness.
This study contributes to developing a one-of-a-kind hybrid model capable of accurately forecasting future wind speeds [23]. This study split the principal wind speed data set into several sub-series using the rapid decomposition technique analysis, which was then integrated using the runs test. The non-linear features of wind speed data can be captured appropriately by the hybrid model that has been proposed. A short-term wind speed forecasting strategy based on a combination of wind speed information extraction and classification approaches was provided in this study [24]. The wind speed is determined by integrating wavelet transformation with correlation and other techniques. The advanced method is then used to optimize the computational model to boost the accuracy of the predictions. The data show that the recommended solution exceeds existing prediction techniques when it comes to accuracy. There have been numerous optimization algorithms developed and applied to various engineering problems, including the Stochastic Paint Optimizer [25], Whale Optimizer [26], Arithmetic Optimization Algorithm [27], Moth-flame Optimizer [28], Aquila Optimizer [29], Reptile Search Algorithm [30], Water Strider Algorithm [25], and Crystal Structure Algorithm [31].
In this paper, we propose a novel approach for predicting the optimizing the parameters of ensemble models using whale optimization algorithm (WOA), which is guided by particle swarm optimization (PSO); which is referred as (PSO-Guided WOA) in the text. To evaluate the effectiveness of the proposed approach, the wind forecasting problem is employed as a case study. In addition, the proposed model is compared with the traditional approach of ensemble models and the other literature approaches that are used in parameter prediction to emphasize the superiority of the proposed approach.
The organization of this paper comes as follows. The dataset and the proposed model are presented and explained in Section 2. The conducted experiments are presented and discussed in Section 3 including the comparisons with other competing approaches. Then, Section 4 examines the conclusions and future perspectives.
In this section, the methodology proposed to optimize the parameters of ensemble models using PSO-Guided WOA is presented and discussed. For further evaluation of the proposed approach, the dataset of wind forecasting is employed as a case study. Therefore, this section starts with presenting the dataset, then discusses the proposed approach’s main components.
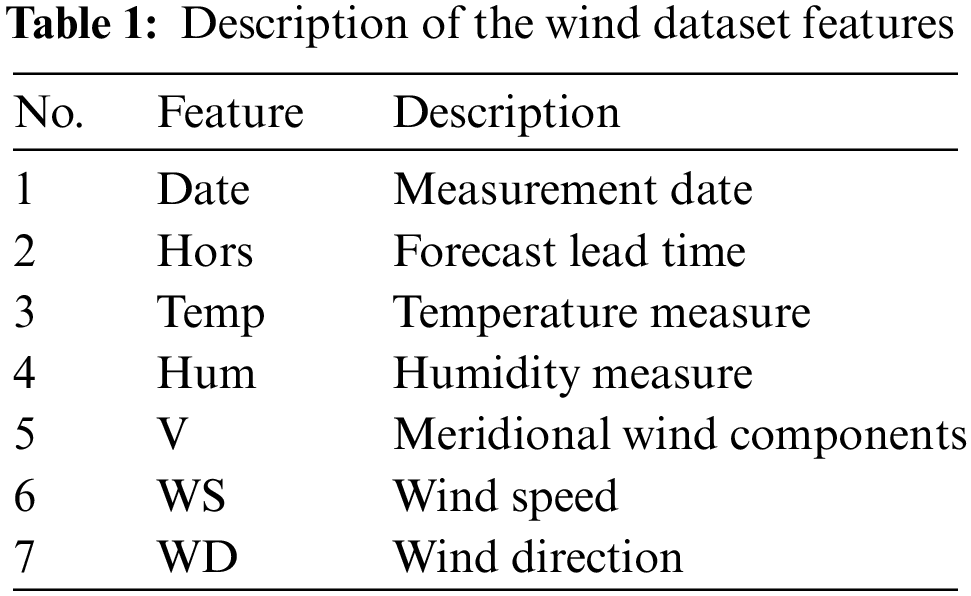
The approach presented in this paper is evaluated in terms of the freely available dataset entitled “Global Energy Forecasting Competition 2012 - Wind Forecasting,” which is published on Kaggle [32]. This dataset is used to predict hourly power generation at seven wind farms for the upcoming forty-eight hours. The description of the dataset features is presented in Tab. 1. As shown in the table, the dataset is composed of seven features namely, Date, Hors, Temp, Hum, V, WS, and WD.
The values of the dataset are normalized for the wind farms not to be recognized. Fig. 1 depicts the correlation between the dataset features. From this figure, we can note that there is high correlation between the wind direction and the temperature. The other features are also correlated with wind direction but in different degrees. In this paper, we target predicting the values of the wind direction using a novel approach based on optimizing the weights of an ensemble model using the recently emerged PSO-Guided WOA.
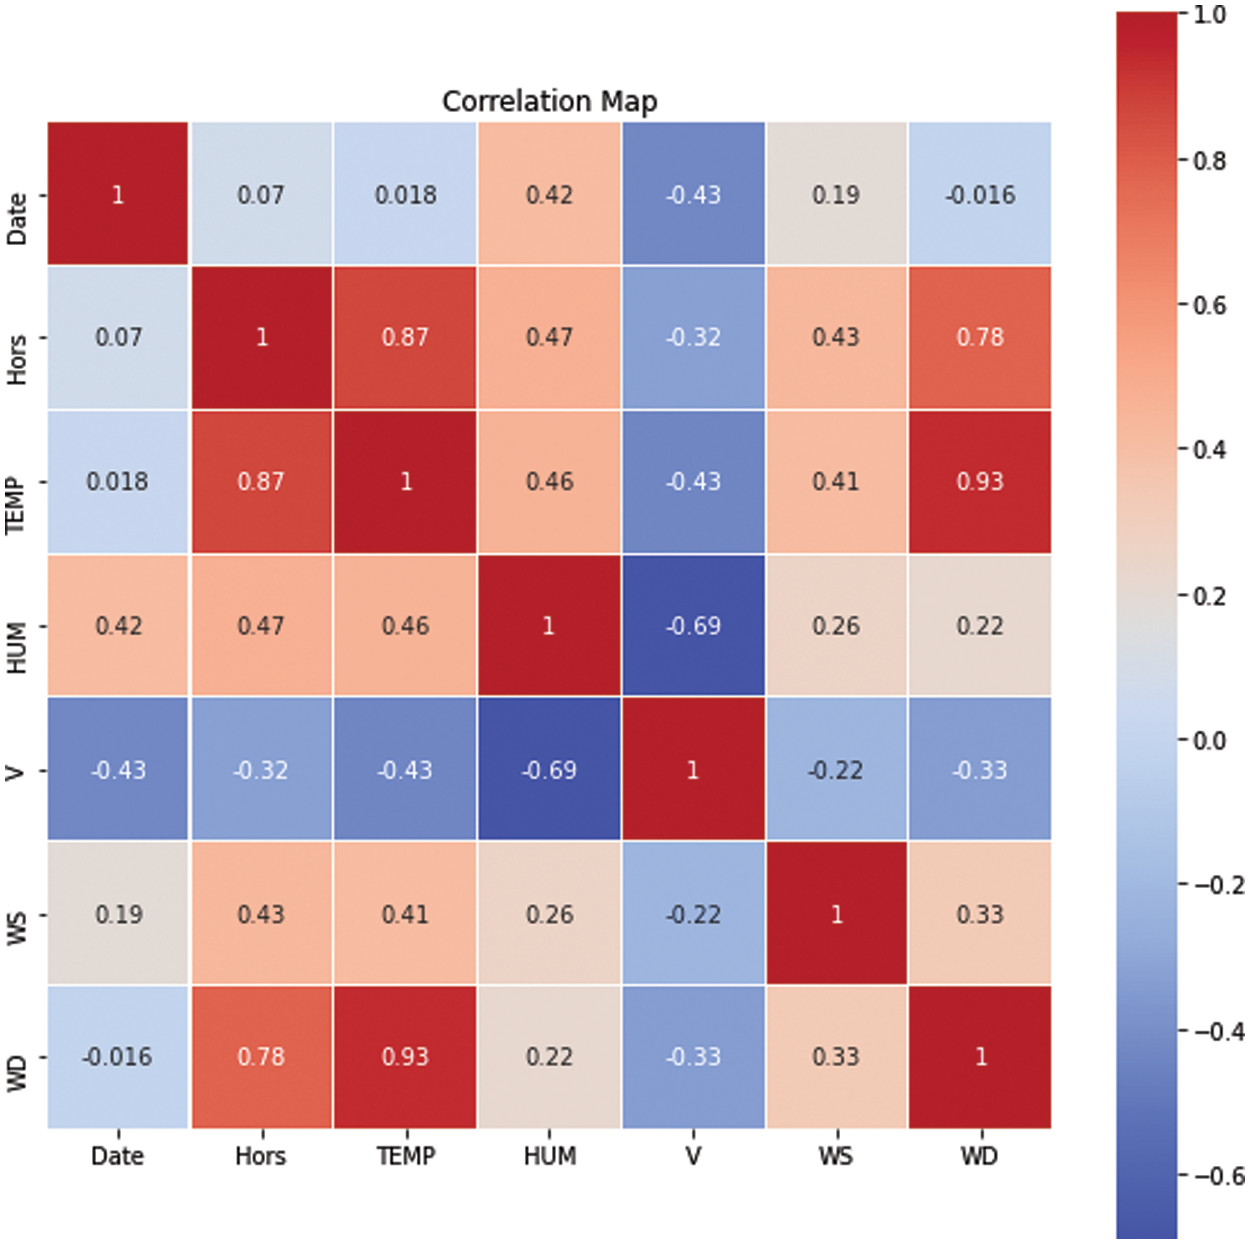
Figure 1: The correlation matrix for the wind dataset features
As the proposed model targets predicting the wind direction features in the wind dataset, as a case study, Fig. 2 shows the histogram of this feature. As shown in the figure, there are four values of the wind directions having many records in the dataset. On the other hand, the records of the dataset have almost all the potential values of but with different counts. This represents a challenge in predicting the direction of the wind accurately given the other features of the dataset.
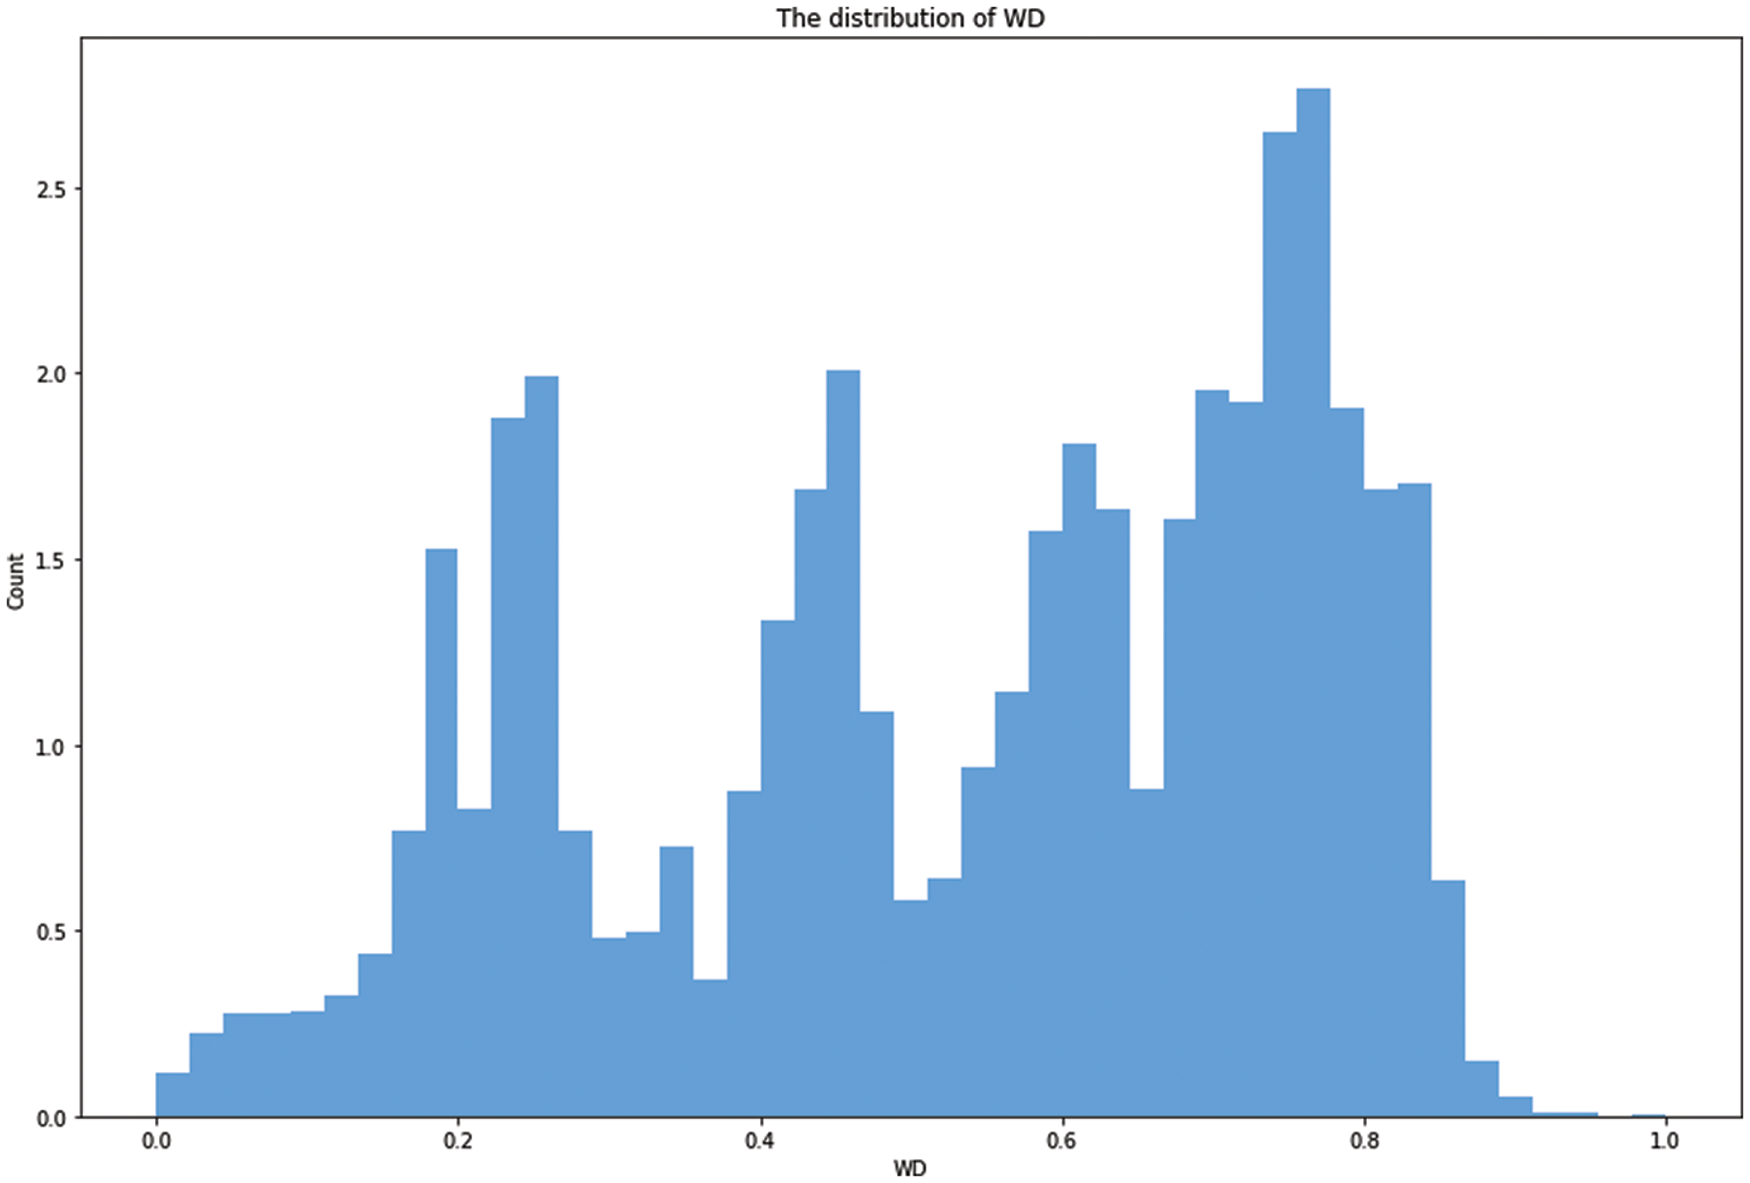
Figure 2: Histogram of the wind direction in the wind dataset
Decision tree is a non-parametric machine learning model that is uses a tree structure to learn the inherent relationship between the independent and dependent variables in the given dataset. In this approach the set of records in the dataset is split into smaller subsets. While the split operation is running a decision tree is built incrementally. This results in decision tree composed of decision and leaf nodes. Each node consists of two branches, each represents a value of the tested feature. This approach can be used for both prediction and classification tasks. In this paper, decision tree regression is used to predict the wind direction based on the features of the given dataset.
2.3 Multi-Layer Neural Network Regression
The neural networks approach is a widespread approach that can be used for both prediction and classification. This approach simulates the human brain in which the information is processed based on a set of activation functions. A set of linked processing units called neurons is used to build the neural network to solve tandem issues. The multi-layer neural network is a type of neural network consisting of a set of layers, each of which is composed of a set of neurons. These layers are referred as input, hidden, and output layers. These layers help in learning the complex functions and interleaved relationships between the dependent and independent variables. In this paper, a multi-layer neural network, which is also referred as multi-layer perceptron (MLP), is used as part of the proposed optimized ensemble model. The structure of MLP used in this paper consists of one input layer, one hidden layer, and one output layer. The weighted sum at each node of the hidden and output layers is calculated as follows:
where
The final predicted output of the network can be measured using the following equation:
Support vector regression (SVR) approach has been developed based on the concept of support vector machines (SVM). This approach can achieve a good prediction and regression performance, resulting in a proper handling of the overfitting challenge. SVR has the same behavior as SVM in case of non-linear data. In this case, SVR employs a kernel to maximize margin of the training data. After training the SVR model using the input features represented by
where
Random forest (RF) is a modified version of decision trees, in which a group of trees is employed to learn the relationship between the dataset features. In addition, a set of randomly chosen predictors is analyzed to select the best predictor at each node of the tree. Therefore, the operation of random forest depends on two variables: the number of trees in the random forest and the size of the set of randomly chosen predictors at each node. To improve the generalization accuracy and reduce the potential overfitting, random forest utilizes the bagging approach based on bootstrap aggregation. In this paper, we employed random forest for predicting the wind direction of the wind dataset as an individual regressor and in conjunction with an ensemble model. The developed regression tree
2.6 The Proposed Optimized Ensemble Model
The proposed optimized ensemble model is depicted in Fig. 3. As shown in the figure, four regressors are employed to predict the wind forecasting dataset’s wind direction. These regressors are decision tree (DT), MLP, SVR, and RF. The performance and accuracy of these regression models are variable; therefore, we propose optimizing a set of weights representing the contribution of each regression model in the final decision of the predicted wind direction. In this paper, we adopted the PSO-Guided WOA to optimize the weight vector which consists of four weights: one for each regression model. In Fig. 3, W1 represents the optimized weight of the DT regression model, W2 represents the optimized weight of the MLP regressor, W3 represents the optimized weight of the SVR regressor, and W4 represents the optimized weight of the RF regression model. Once the optimized weights are calculated for the four models, the final prediction of the wind direction is calculated using the average of the ensemble. The output,
where
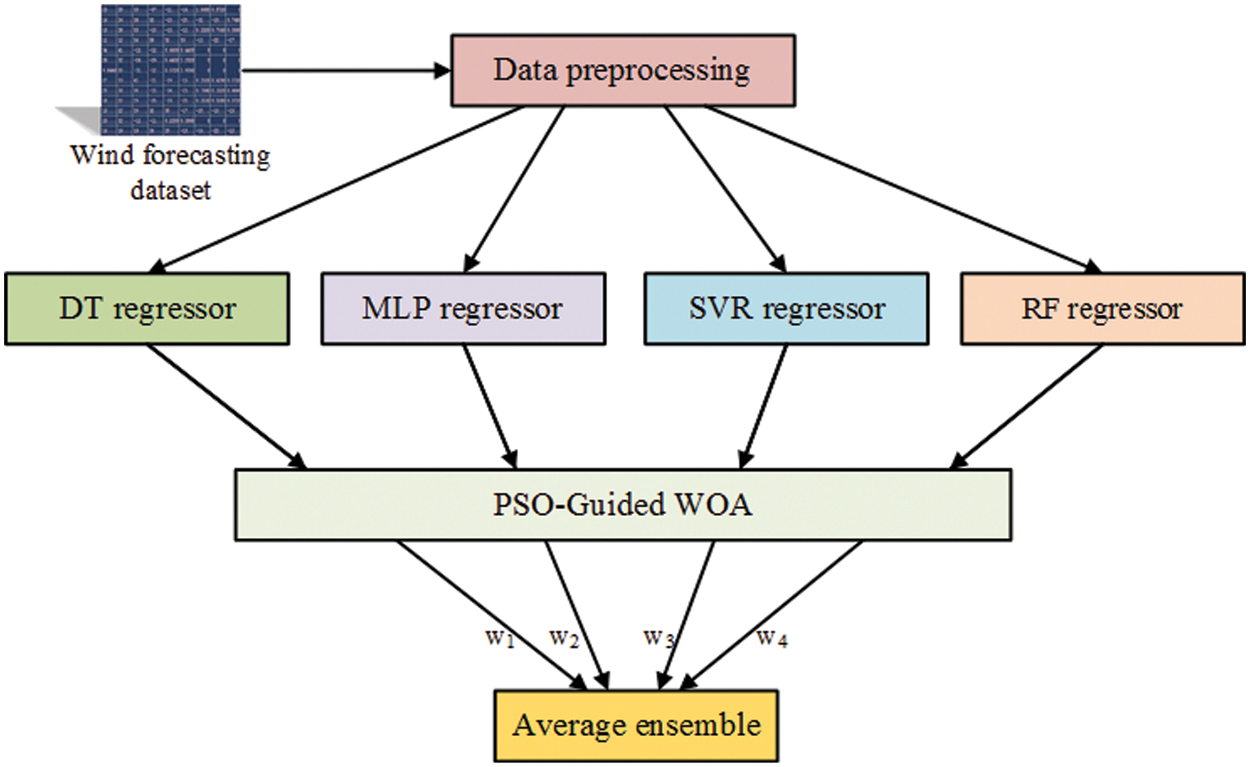
Figure 3: The proposed optimized ensemble model for wind direction prediction
2.7 Ensemble Model Optimization Using PSO-Guided WOA
One of the most efficient optimization algorithms in the literature is the wolf optimization algorithm (WOA). However, this algorithm suffers from one shortage: low exploration capability. Therefore, the guided WOA is then developed to alleviate the performance of the original WOA by updating the search strategy using PSO algorithm. The key idea of the guided WOA is to move the agents in the direction of the best solution with the help of a set of agents instead of one agent. The optimization algorithm is initially initialized Then, the evaluation of a fitness function is performed for each solution in the population. Consequently, the best agent can be determined by the optimization algorithm based on the value of the best fitness. The full operation of the optimization algorithm starts with splitting the group of agents into two subsets, namely exploration and exploitation subgroups, as shown in Fig. 4. The main role of the exploration agents is to explore the space around the best solutions found by the exploitation agents. On the other hand, the role of the exploitation agents is to look for the move the model towards the best solution. The initial population of agents is split into 50% of them as exploration agents and 50% as exploitation agents, then during the optimization process, the agents can change their role dynamically.
PSO algorithm is used to guide the movements of the agents toward the best solution in the search space. This could result in enhancing the exploration process. The following equation is used to guide the agents of the exploration group based on three leading agents.
where
where
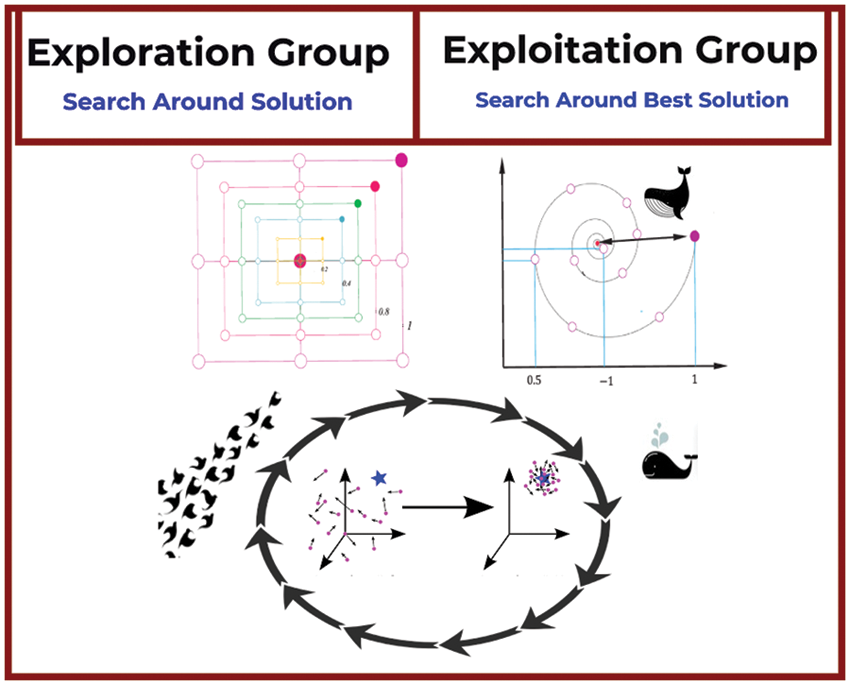
Figure 4: The exploitation and exploration of the PSO-Guided WOA algorithm [1]
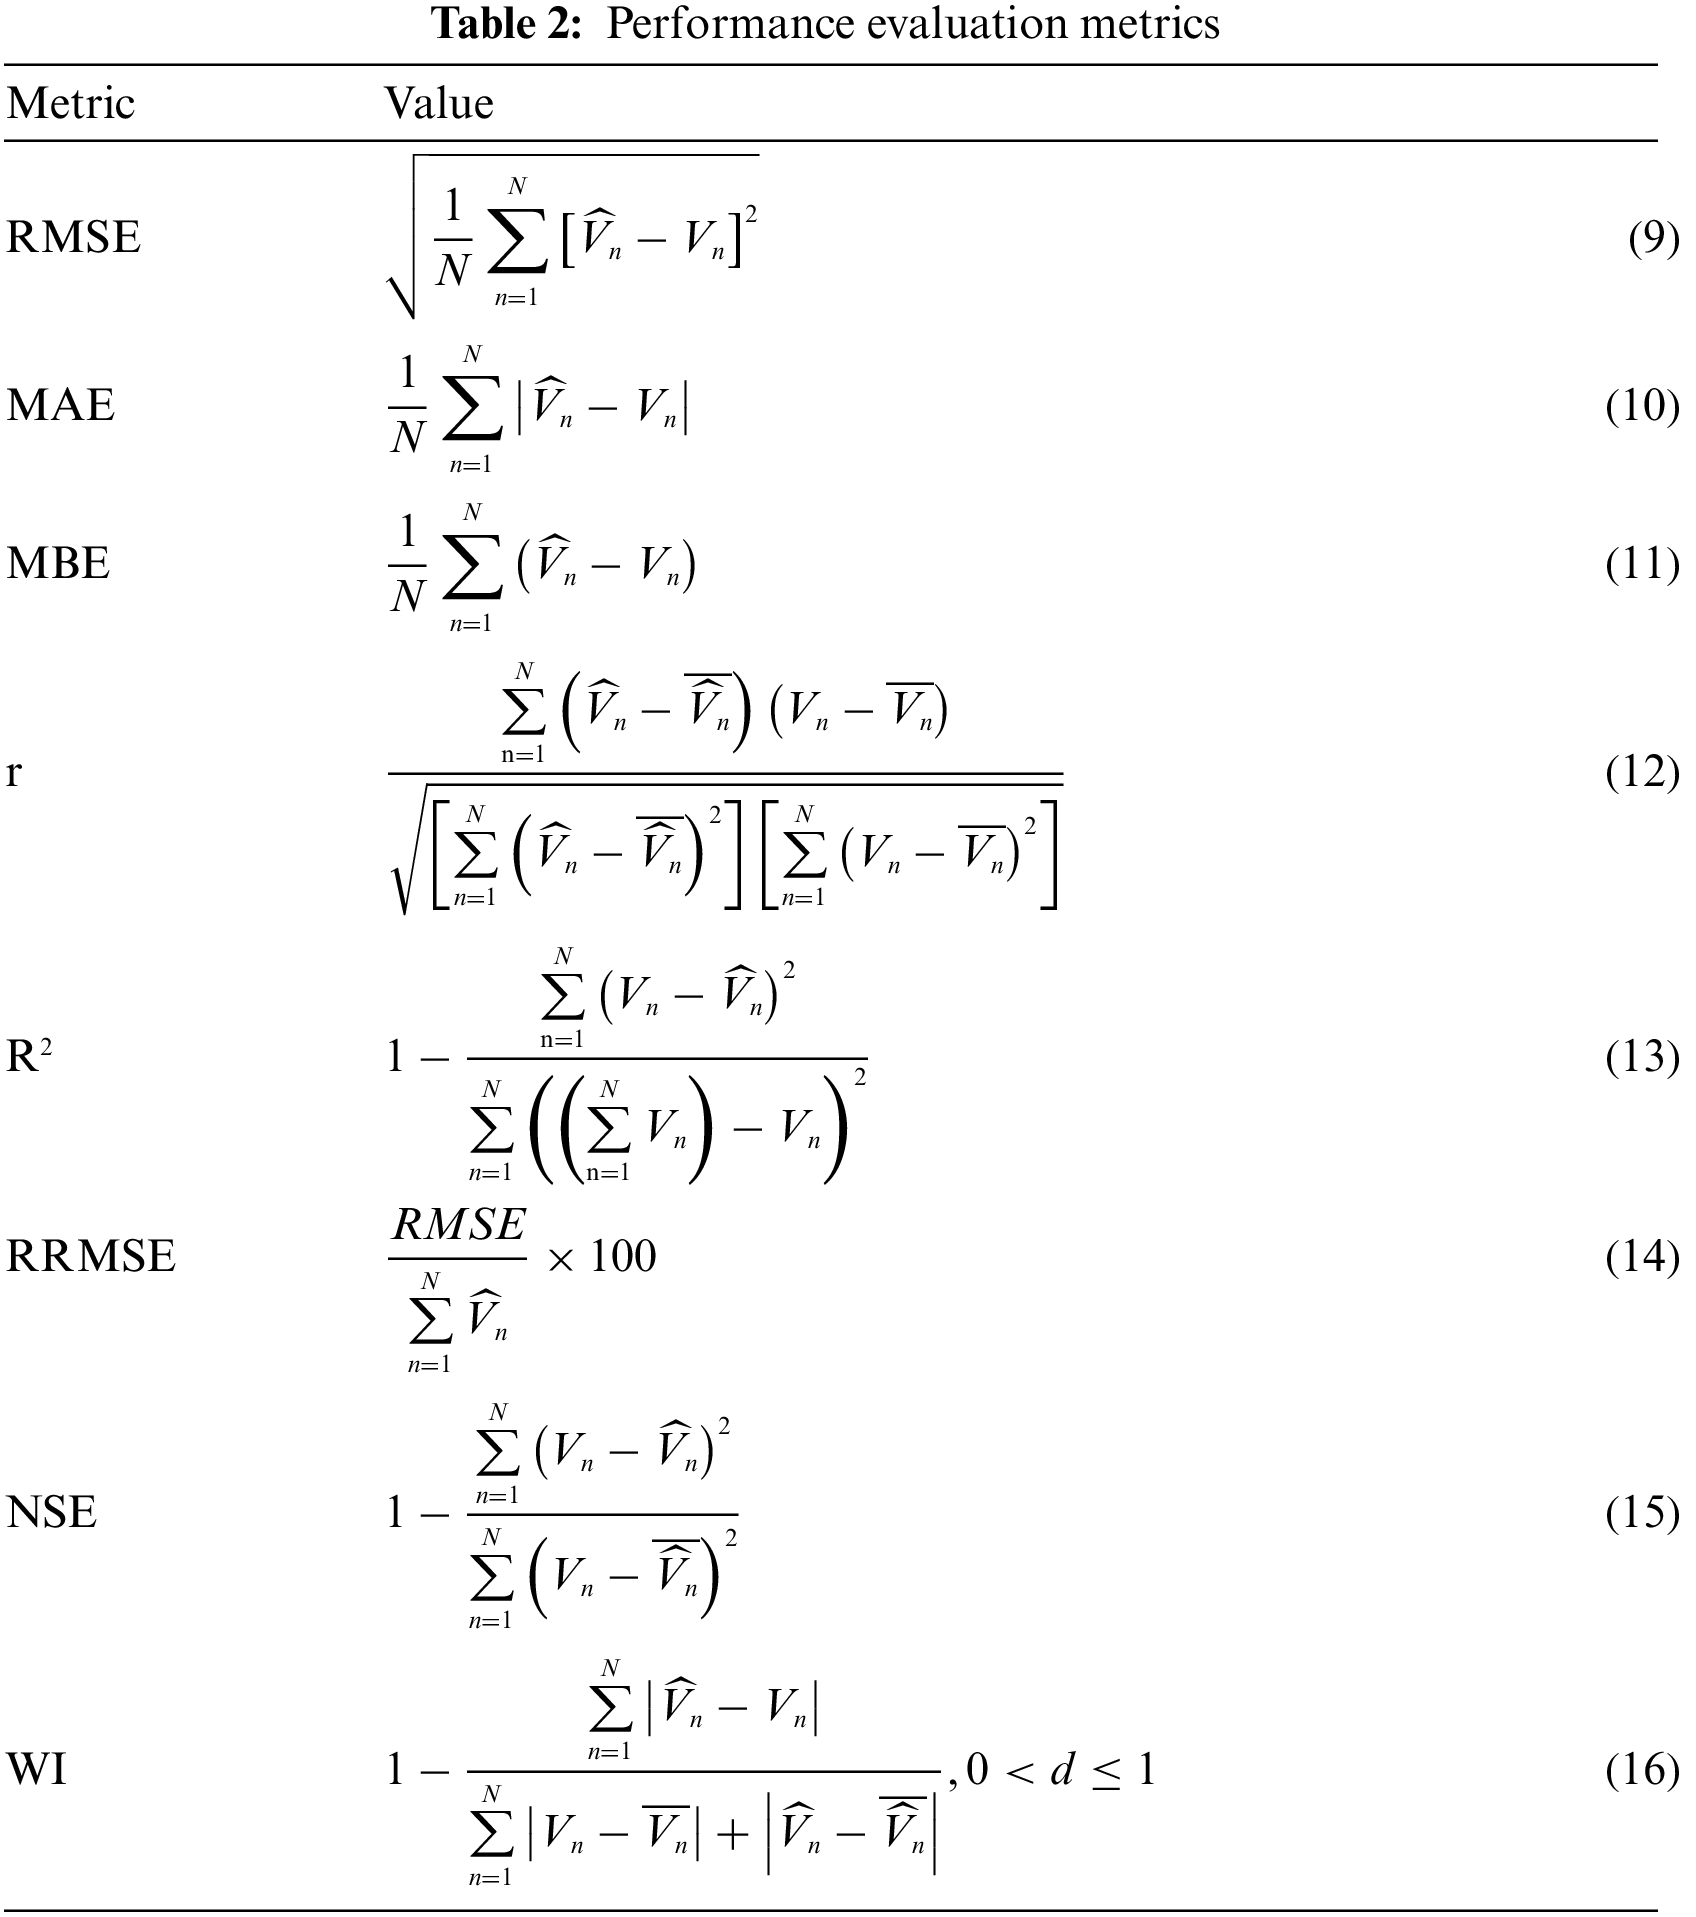
A set of experiments were conducted to evaluate the proposed model and comparing it with the other competing models recently published in the literature. These models are MLP, DT, SVR, and RF. The evaluation of the proposed model is performed in terms of the metrics presented in Tab. 2. These metrics are root mean error (RMSE), mean absolute error (MAE), mean bias error (MBE), Pearson’s correlation coefficient (r), coefficient of determination (R2), Relative RMSE (RRMSE), Nash Sutcliffe Efficiency (NSE), determine agreement (WI), where N is the number of observations in the dataset;
A set of experiments were established and evaluated to measure the performance of the proposed approach. These experiments were categorized into 3 groups. The first group of experiments predicts the wind direction of the wind forecasting dataset using each of the four regression models, described in the previous section, separately. The second group of is based on utilizing the ensemble model but with optimizing the weight parameters using four optimizing techniques namely, PSO, WOA, genetic algorithm (GA), and gray wolf optimizer (GWO). The third group of experiments is based on utilizing the proposed model in which the weights of the ensemble model are optimized using the PSO-Guided WOA. In the following, we discuss the results achieved by these group of experiments.
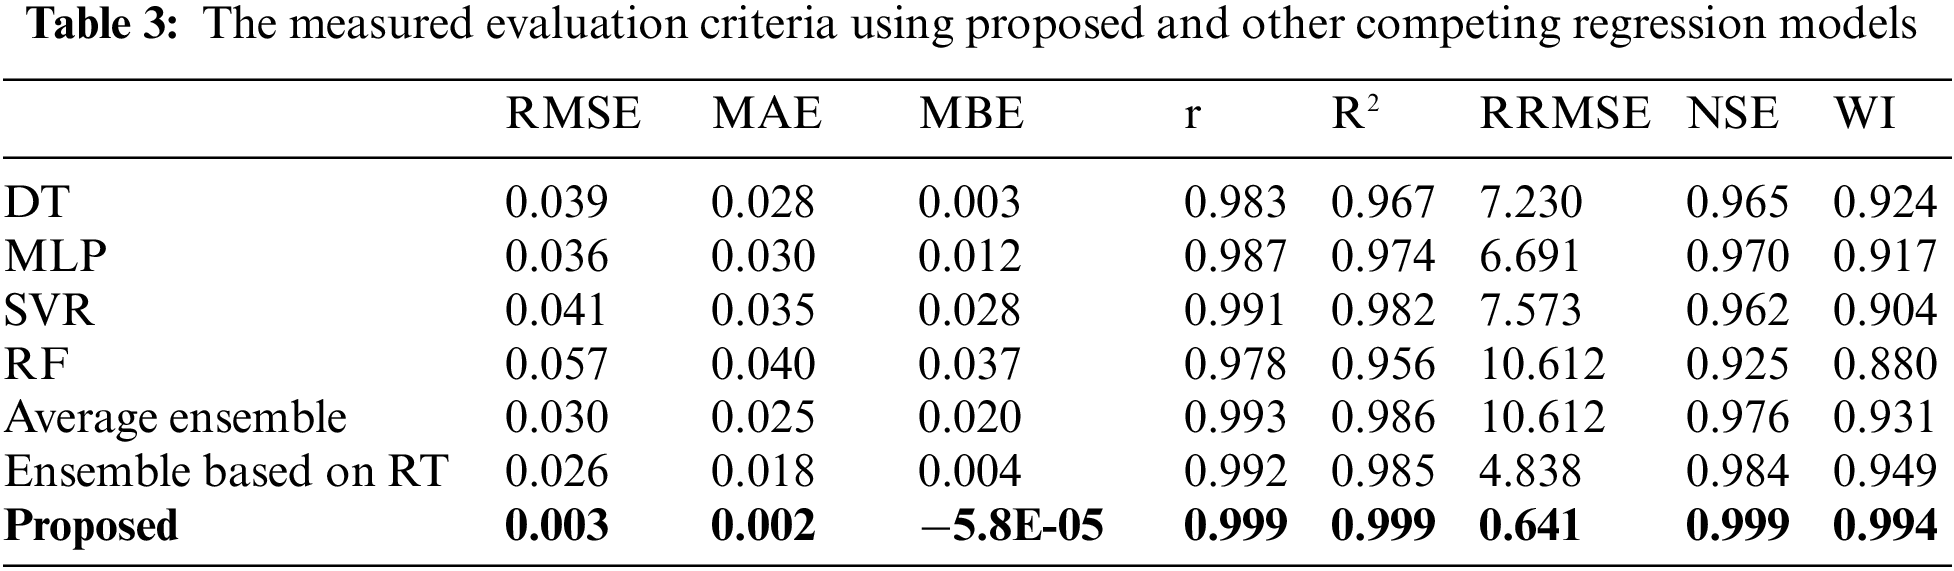
Tab. 3 presents the recorded measurement of the evaluation criteria listed in Tab. 2 based on the separate application of the four regression models along with the average ensemble, optimized ensemble using RF, and the optimized ensemble using PSO-Guided WOA (proposed). As shown in the table, the proposed model could achieve the best performance in terms of the full list of evaluation criteria.
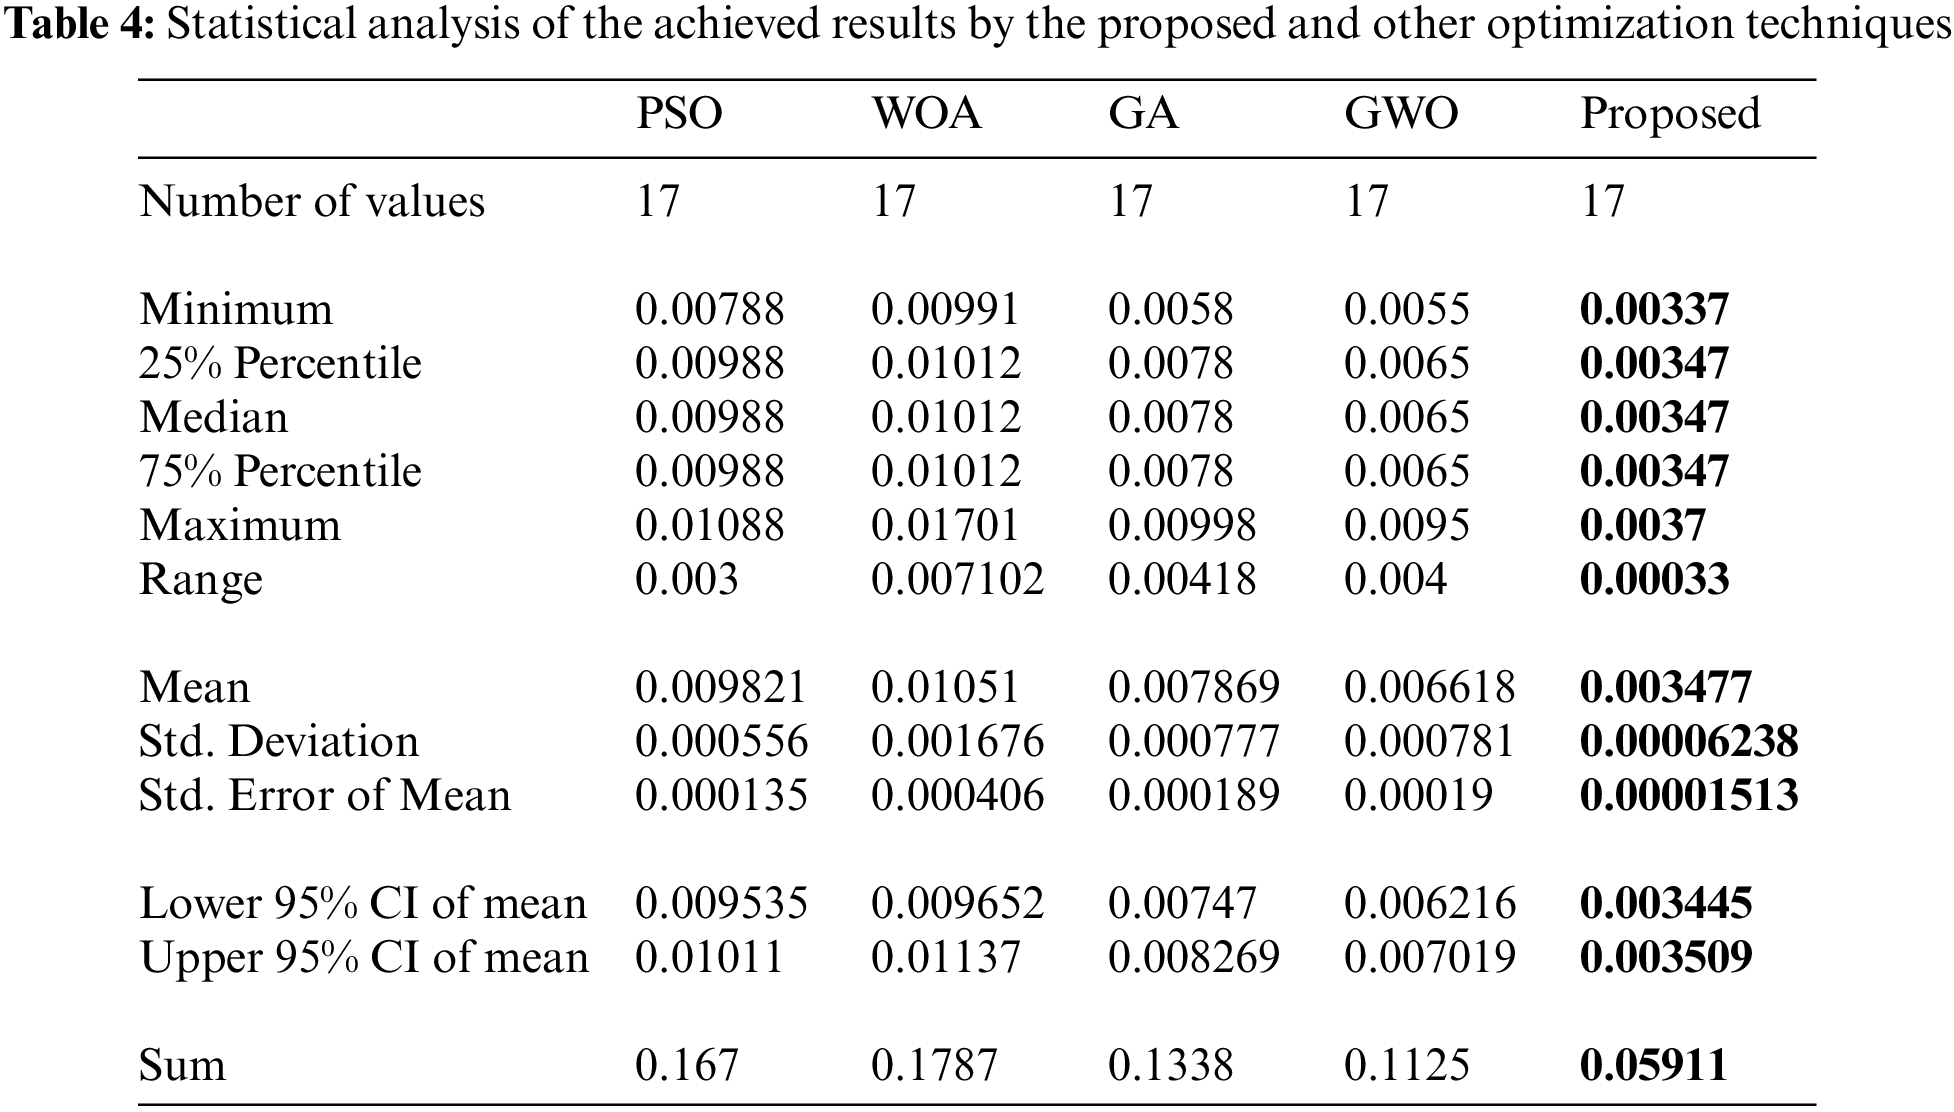
To measure the efficiency of the proposed model with comparison to the other approaches used in optimizing the weights of the ensemble mode, Tab. 4 presents a statistical analysis for the achieved results. Based on this analysis, it can be noted that the proposed model could achieve the best prediction of the wind direction when compared with other approaches.
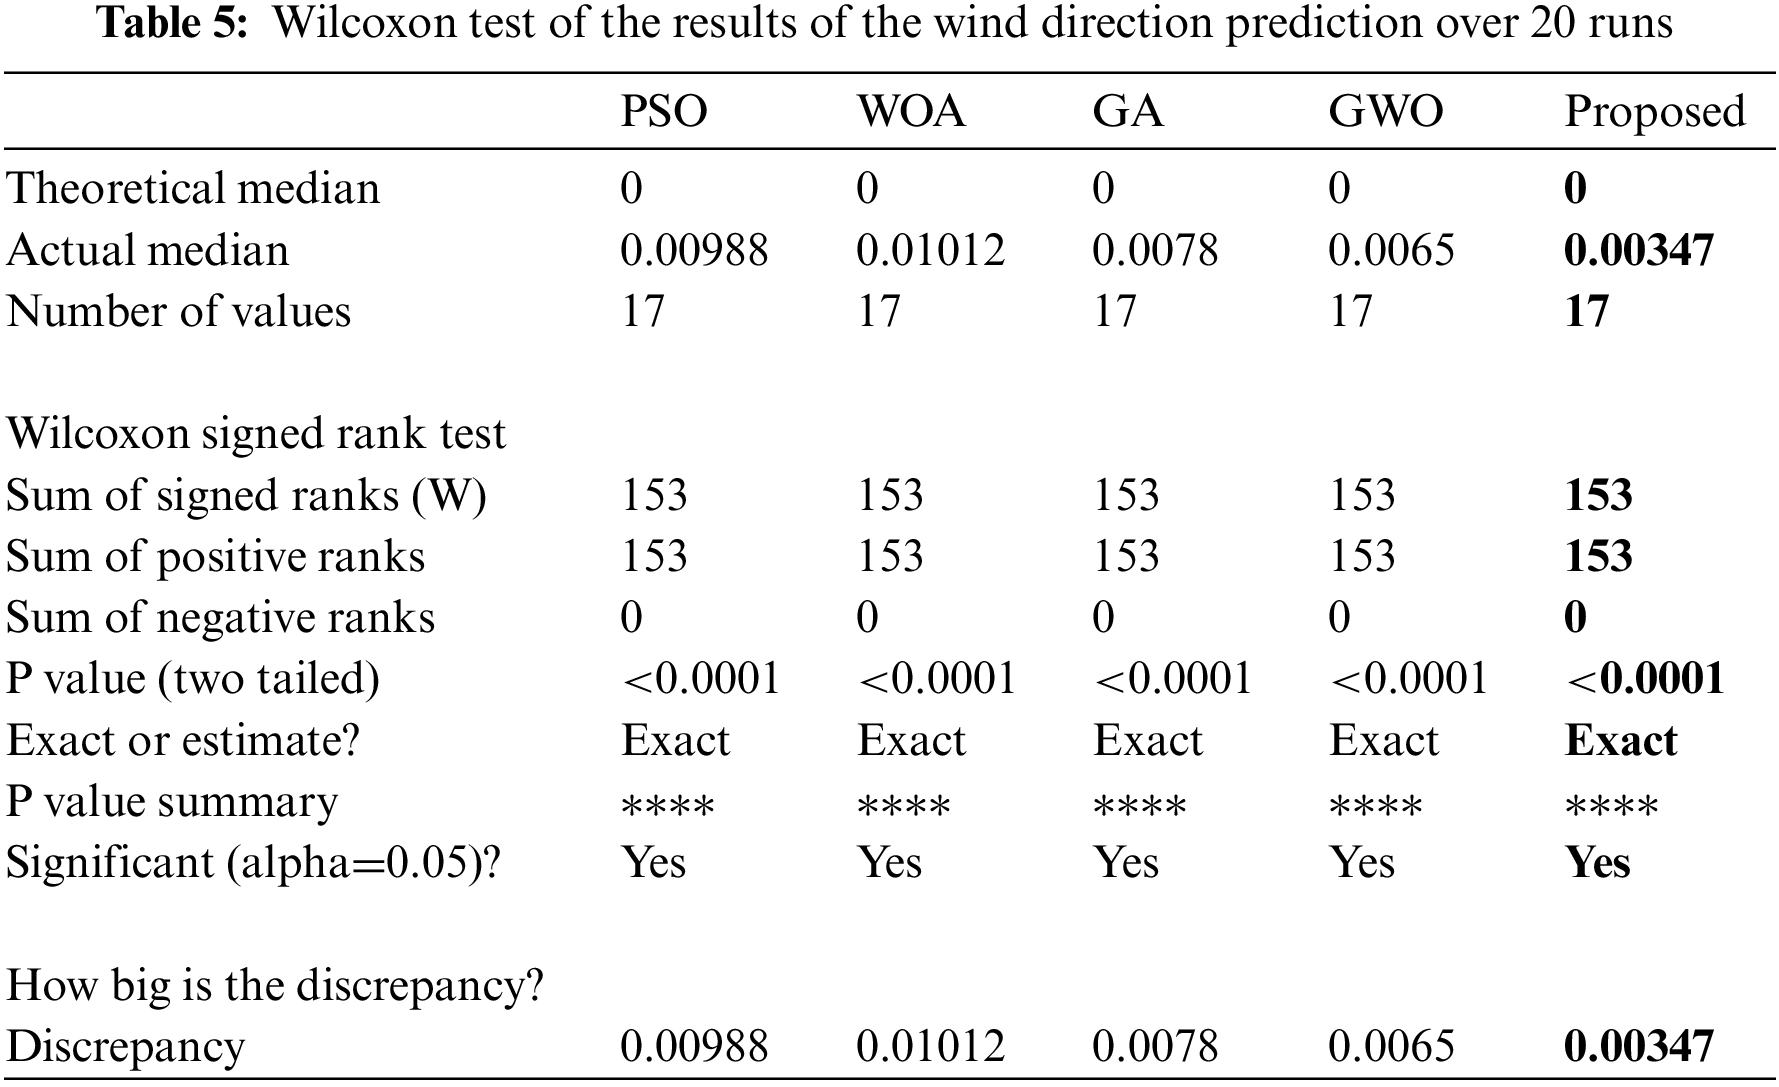
On the other hand, the Wilcoxon signed rank test of the achieved results using the proposed optimized ensemble model and optimized ensemble models using other approaches is presented in Tab. 5. These results show that the proposed model achieves the lowest discrepancy values when compared with the other approaches.
The RMSE of the ensemble models optimized using the proposed model and other approach along with the heatmap of the prediction results are shown in Fig. 5. The results presented in this figure indicate the superiority of the proposed approach, as it achieves the smallest RMSE value which is also clear in the heat map.
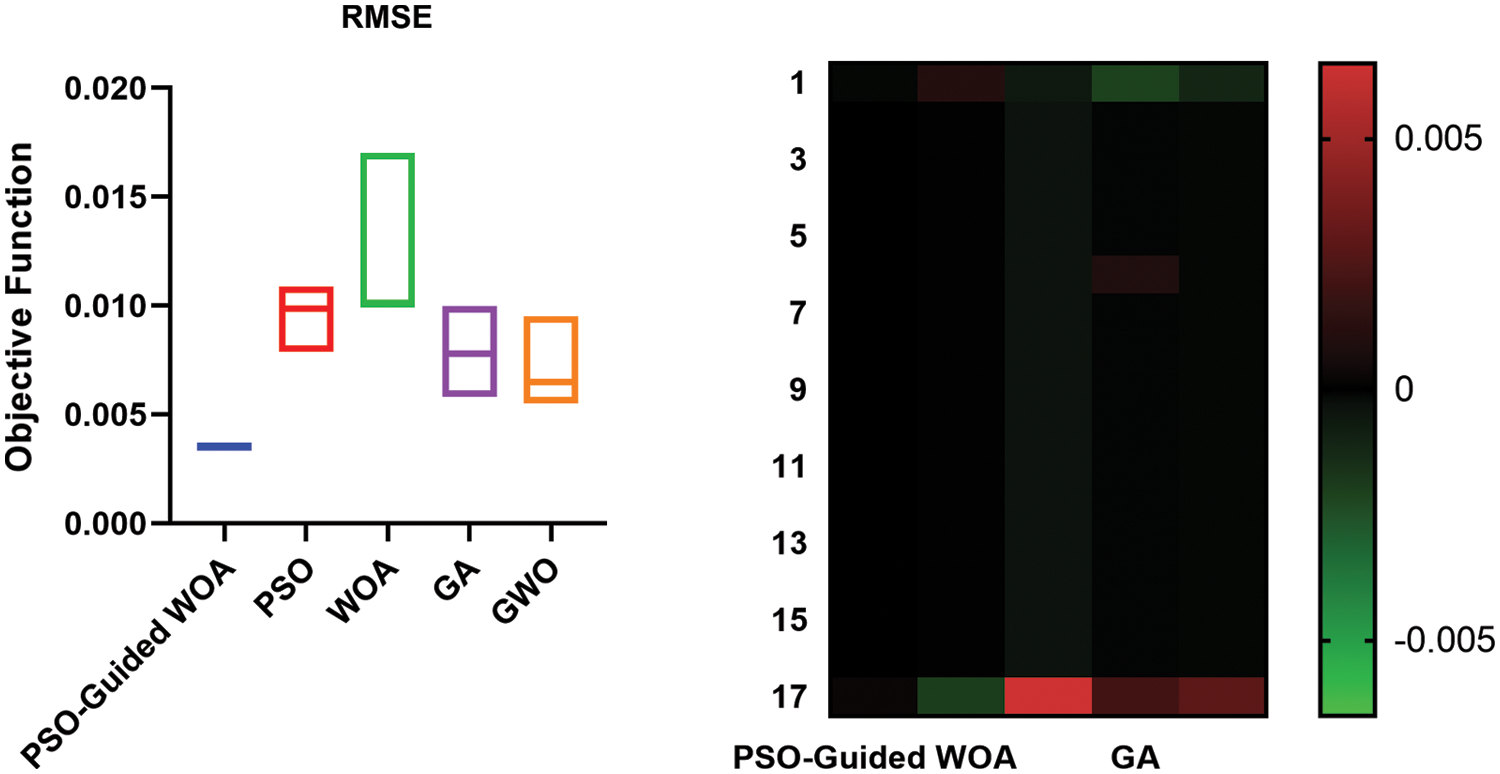
Figure 5: The RMSE and heat map of the achieved predictions using the proposed and other approaches
The histogram of the RMSE is depicted in Fig. 6. In this figure, the proposed model could achieve the maximum number of predictions with the smallest value of RMSE. These results emphasize the effectiveness of the proposed mode land its efficiency in predicting the wind direction accurately.
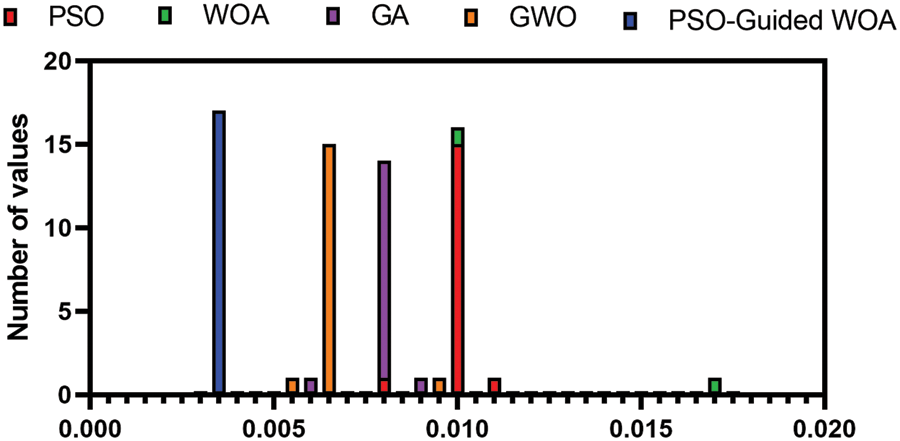
Figure 6: Histogram of RMSE of the achieved results using the proposed and other approaches
Fig. 7 depicts the Homoscedasticity, quantile-quantile (QQ), residual, and prediction plots based on the results achieved by the proposed approach. The homoscedasticity plot shows that the error is the same for the independent variables against the predicted values. In addition, the QQ plot shows that the predictions of the wind direction fit the predetermined line. Moreover, the residual plot shows that the prediction errors are close to zero which indicates the robustness of the proposed approach. On the other hand, the predictions (red) are properly fit the actual values (green), which confirms the achieved results.
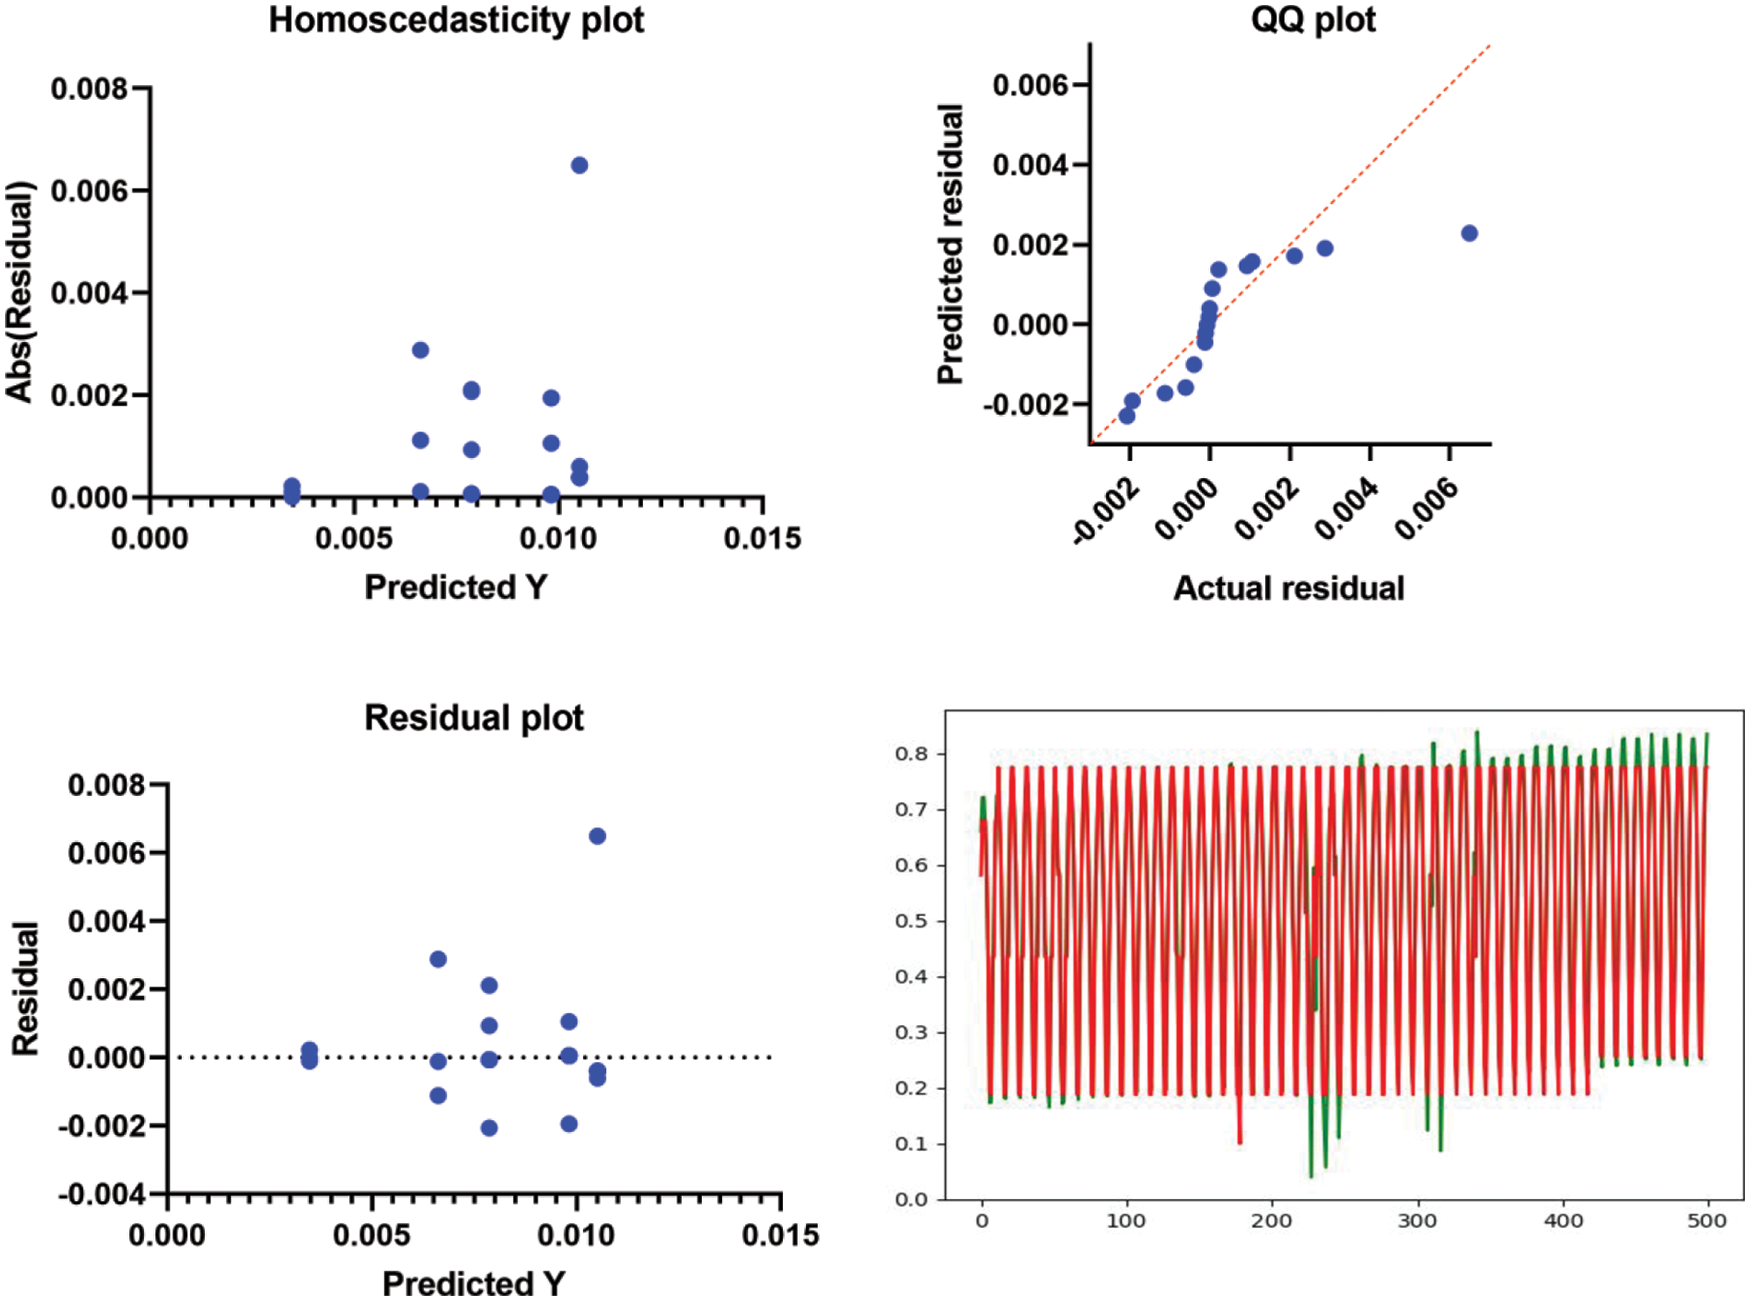
Figure 7: Homoscedasticity, QQ, residual, and prediction plots using the proposed approach
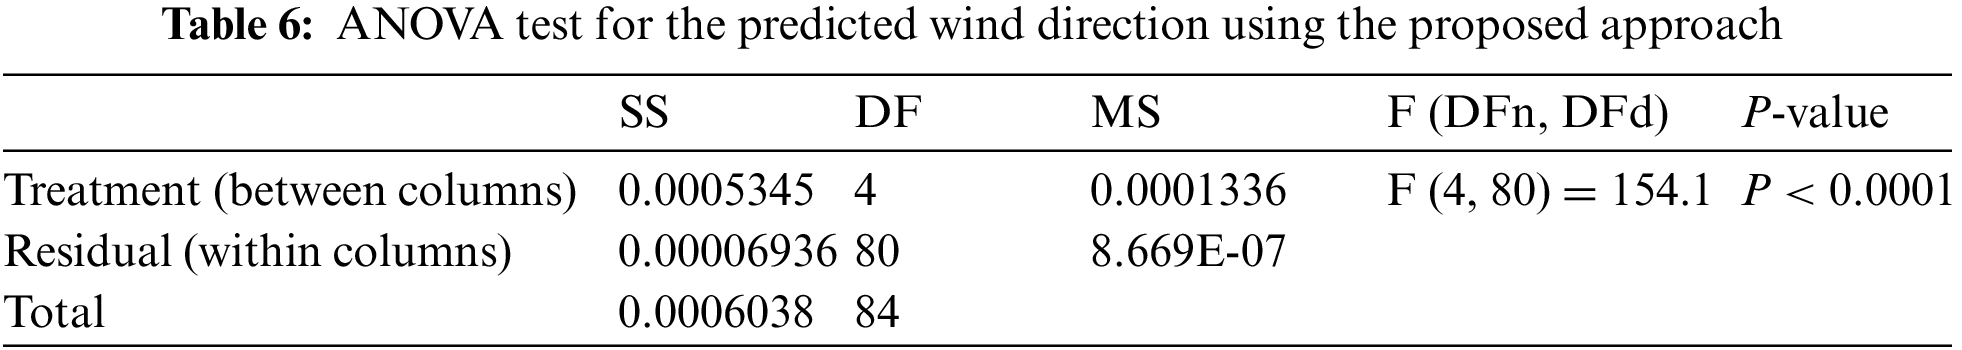
A mapping between the actual and predicted values resulting from ensemble using DT regressor is presented in Fig. 8. In this figure, the value of the achieved R2 criterion is (0.98494), and the predicted values are not properly fit a line, which indicates the lack of generalization of this approach. On the other hand, the mapping presented in Fig. 9 is achieved by the proposed approach. In this figure, the value of R2 is (0.999719), and the predicted values properly fit a straight line, which proves the generalization of the proposed model and its ability to predict the wind direction accurately. Moreover, The ANOVA test results using the predicted wind direction are presented in Tab. 6. These results prove the superiority of the proposed model and its effectiveness for the task of wind forecasting.
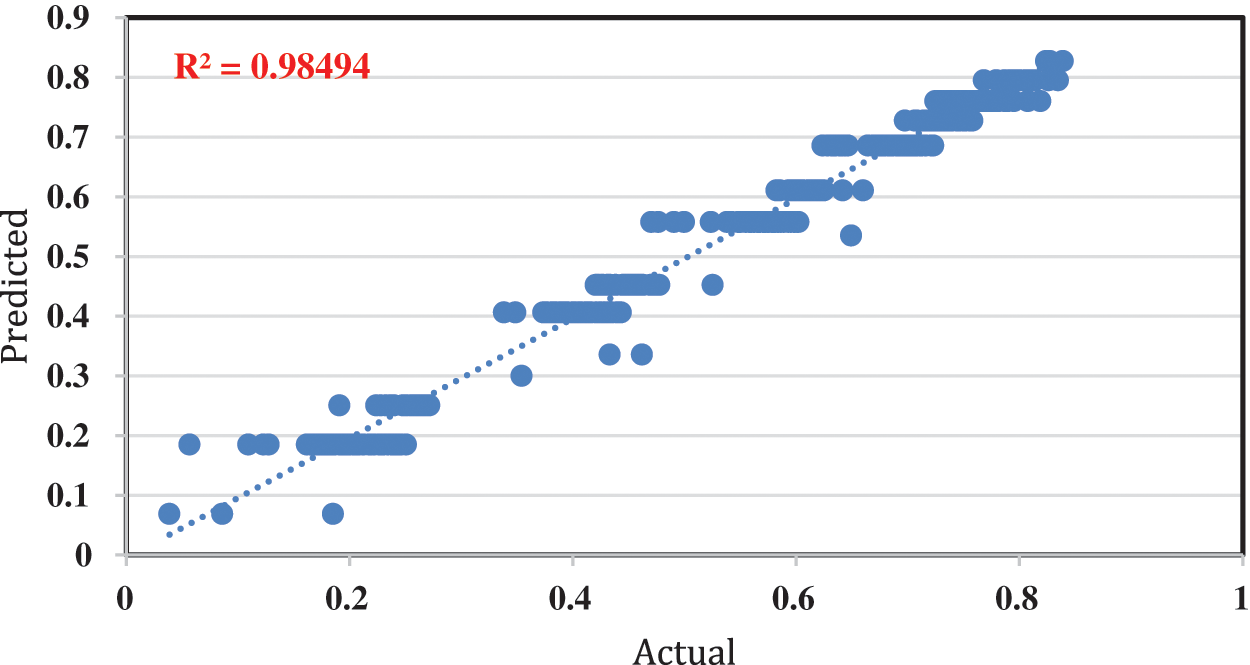
Figure 8: Mapping between the actual and predicted values resulting from ensemble using DT regressor
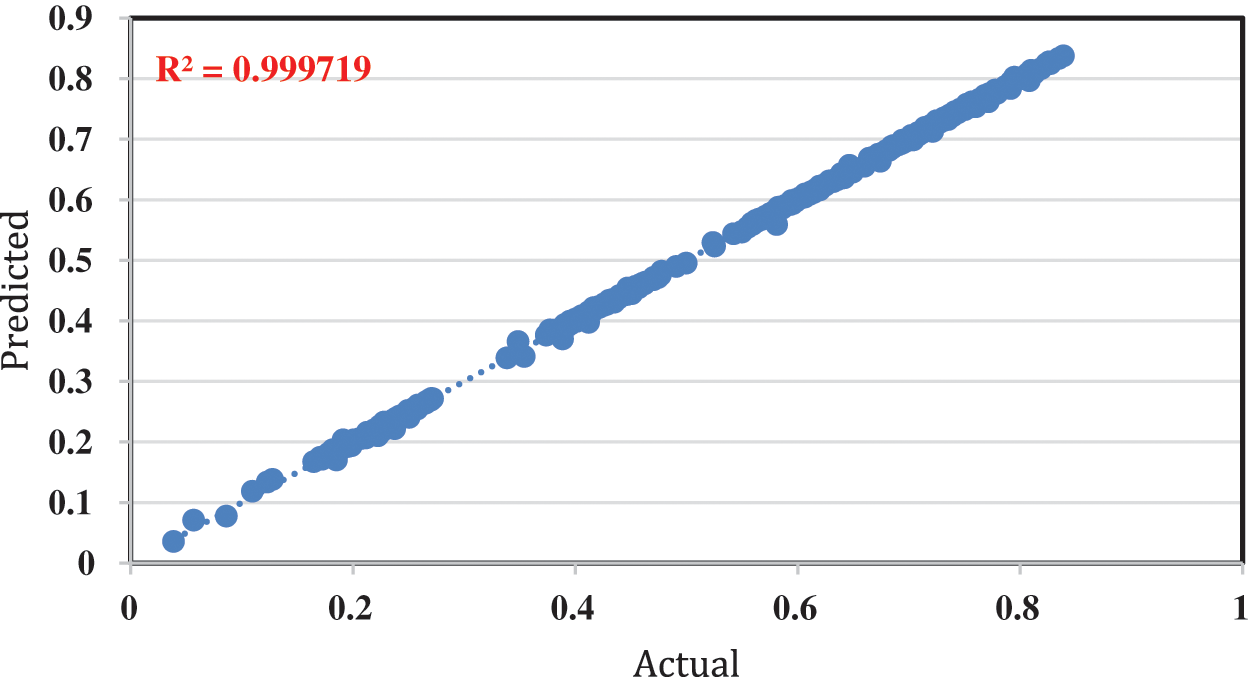
Figure 9: Mapping between the actual and predicted values resulting from the proposed optimized model
4 Conclusions and Future Perspective
In this paper, the wind forecasting dataset is employed to verify the effectiveness of the proposed optimized ensemble model. The proposed model is based on an ensemble composed of four regression models namely, random forest, multi-layer perceptron, support vector regression and random forest. The proposed ensemble model is used to find the best prediction by weighted averaging the results from the four regression models. The weights of the proposed ensemble are optimized using a strong optimizer referred as PSO-Guided WOA. This optimizer depends on two groups of agents: exploration and exploitation. These agents are guided by means of PSO algorithm. To prove the effectiveness of the proposed approach, a set of experiments were conducted to evaluate its performance and compare the achieved results with those of the four regression models and other competing optimized ensemble models. The competing ensemble models considered in this paper include optimized ensembles based on PSO, WOA, GA, and GWO optimization techniques. The evaluation of the achieved results is performed in terms of eight evaluation criteria. In addition, several analysis plots and statistical measurements were extracted from the achieved results to emphasize the stability and efficiency of the proposed approach. The comparison results with the other optimized ensembles confirm the superiority of the proposed optimized ensemble model over the other ensembles. The future perspective of this work includes testing the proposed model for other datasets and evaluating its adaptability to other prediction tasks.
Acknowledgement: Princess Nourah bint Abdulrahman University Researchers Supporting Project number (PNURSP2022R308), Princess Nourah bint Abdulrahman University, Riyadh, Saudi Arabia.
Funding Statement: Princess Nourah bint Abdulrahman University Researchers Supporting Project number (PNURSP2022R308), Princess Nourah bint Abdulrahman University, Riyadh, Saudi Arabia.
Conflicts of Interest: The authors declare that they have no conflicts of interest to report regarding the present study.
1. A. Ibrahim, S. Mirjalili, M. El-Said, S. Ghoneim, M. Al-Harthi et al., “Wind speed ensemble forecasting based on deep learning using adaptive dynamic optimization algorithm,” IEEE Access, vol. 9, no. 1, pp. 125787–125804, 2021. [Google Scholar]
2. M. Hassan, S. Kamel, L. Abualigah and A. Eid, “Development and application of slime mould algorithm for optimal economic emission dispatch,” Expert Systems with Applications, vol. 182, no. 1, pp. 115205, 2021. [Google Scholar]
3. M. Nadimi-Shahraki, S. Taghian, S. Mirjalili, L. Abualigah, M. Abd Elaziz et al., “EWOA-OPF: Effective whale optimization algorithm to solve optimal power flow problem,” Electronics, vol. 10, no. 23, pp. 2975, 2021. [Google Scholar]
4. A. Ibrahim, H. Abutarboush, A. Mohamed, M. Fouad and E. El-kenawy, “An optimized ensemble model for prediction the bandwidth of metamaterial antenna,” CMC-Computers, Materials & Continua, vol. 71, no. 1, pp. 199–213, 2022. [Google Scholar]
5. E. El-kenawy, A. Ibrahim, S. Mirjalili, Y. Zhang, S. Elnazer et al., “Optimized ensemble algorithm for predicting metamaterial antenna parameters,” Computers, Materials & Continua, vol. 71, no. 3, pp. 4989–5003, 2022. [Google Scholar]
6. V. Geert, B. Sjouke and S. Frans, “Smart grids or smart users? Involving users in developing a low carbon electricity economy,” Energy Policy, vol. 52, no. 1, pp. 117–125, 2013. [Google Scholar]
7. Y. Li, X. Chen, C. Li, G. Tang, Z. Gan et al., “A hybrid deep interval prediction model for wind speed forecasting,” IEEE Access, vol. 9, no. 1, pp. 7323–7335, 2020. [Google Scholar]
8. H. Hassan, A. I. El-Desouky, A. Ibrahim, E. M. El-Kenawy and R. Arnous, “Enhanced QoS-based model for trust assessment in cloud computing environment,” IEEE Access, vol. 8, no. 1, pp. 43752–43763, 2020. [Google Scholar]
9. M. M. Eid, E.-S. M. El-Kenawy and A. Ibrahim, “Anemia estimation for covid-19 patients using a machine learning model,” Journal of Computer Science and Information Systems, vol. 17, no. 11, pp. 1--7, 2021. [Google Scholar]
10. H. R. Hussien, E.-S. M. El-Kenawy and A. I. El-Desouky, “EEG channel selection using a modified grey wolf optimizer,” European Journal of Electrical Engineering and Computer Science, vol. 5, no. 1, pp. 17–24, 2021. [Google Scholar]
11. E. M. Hassib, A. I. El-Desouky, L. M. Labib and E.- S. M. T. El-Kenawy, “Woa + brnn: An imbalanced big data classification framework using whale optimization and deep neural network,” Soft Computing, vol. 24, no. 8, pp. 5573–5592, 2020. [Google Scholar]
12. A. Ibrahim, H. A. Ali, M. M. Eid and E.-S. M. El-Kenawy, “Chaotic harris hawks optimization for unconstrained function optimization,” in 2020 16th International Computer Engineering Conf. (ICENCO), Cairo, Egypt, IEEE, pp. 153–158, 2020. [Google Scholar]
13. E. M. Hassib, A. I. El-Desouky, E. M. El-Kenawy and S. M. El-Ghamrawy, “An imbalanced big data mining framework for improving optimization algorithms performance,” IEEE Access, vol. 7, no. 1, pp. 170774–170795, 2019. [Google Scholar]
14. G. Zhang and D. Liu, “Causal convolutional gated recurrent unit network with multiple decomposition methods for short-term wind speed forecasting,” Energy Conversion and Management, vol. 226, pp. 113500, 2020. [Google Scholar]
15. M. Jamei, K. Masoud, M. Mehdi, A. Ismail, A. Laith et al., “Estimating the density of hybrid nanofluids for thermal energy application: Application of non-parametric and evolutionary polynomial regression data-intelligent techniques,” Measurement, vol. 189, no. 1, pp. 110524, 2021. [Google Scholar]
16. J. Hwang and A. Ding, “Prediction intervals for artificial neural networks,” Journal of the American Statistical Association, vol. 92, no. 438, pp. 748–757, 1997. [Google Scholar]
17. Y. He and Y. Zheng, “Short-term power load probability density forecasting based on Yeo-Johnson transformation quantile regression and Gaussian kernel function,” Energy, vol. 154, no. 1, pp. 143–156, 2018. [Google Scholar]
18. C. Chatfield, “Prediction intervals for time-series forecasting, in Principles of forecasting,” International Series in Operations Research & Management Science, vol. 30, no. 1, pp. 475–494, 2001. [Google Scholar]
19. L. Abualigah, D. Yousri, M. Abd Elaziz, A. Ewees, M. l-qaness et al., “Aquila Optimizer: A novel meta-heuristic optimization Algorithm,” Computers & Industrial Engineering, vol. 157, no. 1, pp. 107250, 2021. [Google Scholar]
20. M. Fouad, A. El-Desouky, R. Al-Hajj and E. El-Kenawy, “Dynamic group-based cooperative optimization algorithm,” IEEE Access, vol. 8, pp. 148378–148403, 2020. [Google Scholar]
21. E. El-Kenawy, A. Ibrahim, S. Mirjalili, M. Eid and S. Hussein, “Novel feature selection and voting classifier algorithms for COVID-19 classification in CT images,” IEEE Access, vol. 8, pp. 179317–179335, 2020. [Google Scholar]
22. E. El-Kenawy, M. Eid, M. Saber and A. Ibrahim, “MBGWO-SFS: Modified binary grey wolf optimizer based on stochastic fractal search for feature selection,” IEEE Access, vol. 8, pp. 107635–107649, 2020. [Google Scholar]
23. A. A. Salamai, E.-S. M. El-kenawy and A. Ibrahim, “Dynamic voting classifier for risk identification in supply chain 4. 0,” Computers, Materials & Continua, vol. 69, no. 3, pp. 3749–3766, 2021. [Google Scholar]
24. M. M. Eid, E. -S. M. El-kenawy and A. Ibrahim, “A binary sine cosine-modified whale optimization algorithm for feature selection,” in 2021 National Computing Colleges Conf. (NCCC), Taif, Saudi Arabia, pp. 1–6, 2021. [Google Scholar]
25. E. -S. M. El-Kenawy, S. Mirjalili, A. Ibrahim, M. Alrahmawy, M. El-Said et al., “Advanced meta-heuristics, convolutional neural networks, and feature selectors for efficient COVID-19 X-Ray chest image classification,” IEEE Access, vol. 9, pp. 36019–36037, 2021. [Google Scholar]
26. E. S. M. El-kenawy, H. F. Abutarboush, A. W. Mohamed and A. Ibrahim, “Advance artificial intelligence technique for designing double T-shaped monopole antenna,” Computers, Materials & Continua, vol. 69, no. 3, pp. 2983–2995, 2021. [Google Scholar]
27. E.-S. M. El-kenawy and M. Eid, “Hybrid gray wolf and particle swarm optimization for feature selection,” International Journal of Innovative Computing, Information and Control, vol. 16, no. 3, pp. 831–844, 2020. [Google Scholar]
28. A. Ibrahim and E.-S. M. El-Kenawy, “Image segmentation methods based on superpixel techniques: A survey,” Journal of Computer Science and Information Systems, vol. 15, no. 3, pp. 1–11, 2020. [Google Scholar]
29. A. Ibrahim and E.-S. M. El-Kenawy, “Applications and datasets for superpixel techniques: A survey,” Journal of Computer Science and Information Systems, vol. 15, no. 3, pp. 1–6, 2020. [Google Scholar]
30. L. Abualigah, M. Abd Elaziz, P. Sumari, Z. Geem and A. Gandomi, “Reptile Search Algorithm (RSAA nature-inspired meta-heuristic optimizer,” Expert Systems with Applications, vol. 191, no. 1, pp. 116158, 2022. [Google Scholar]
31. N. Khodadadi, M. Azizi, S. Talatahari and P. Sareh, “Multi-objective crystal structure algorithm (MOCryStAlIntroduction and performance evaluation,” IEEE Access, vol. 9, no. 1, pp. 117795–117812, 2021. [Google Scholar]
32. Global Energy Forecasting Competition, “Wind forecasting,” Accessed: Feb. 20, 2022, 2012. [Online]. Available: https://www.kaggle.com/c/GEF2012-wind-forecastings. [Google Scholar]
 | This work is licensed under a Creative Commons Attribution 4.0 International License, which permits unrestricted use, distribution, and reproduction in any medium, provided the original work is properly cited. |