DOI:10.32604/cmc.2022.030575
| Computers, Materials & Continua DOI:10.32604/cmc.2022.030575 | |
| Article |
Intelligent Resource Allocations for Software-Defined Mission-Critical IoT Services
1Department of Software Convergence, Soonchunhyang University, Asan, 31538, Korea
2Department of Computer Software Engineering, Soonchunhyang University, Asan, 31538, Korea
*Corresponding Author: Seokhoon Kim. Email: seokhoon@sch.ac.kr
Received: 29 March 2022; Accepted: 18 May 2022
Abstract: Heterogeneous Internet of Things (IoT) applications generate a diversity of novelty applications and services in next-generation networks (NGN), which is essential to guarantee end-to-end (E2E) communication resources for both control plane (CP) and data plane (DP). Likewise, the heterogeneous 5th generation (5G) communication applications, including Mobile Broadband Communications (MBBC), massive Machine-Type Commutation (mMTC), and ultra-reliable low latency communications (URLLC), obligate to perform intelligent Quality-of-Service (QoS) Class Identifier (QCI), while the CP entities will be suffered from the complicated massive HIOT applications. Moreover, the existing management and orchestration (MANO) models are inappropriate for resource utilization and allocation in large-scale and complicated network environments. To cope with the issues mentioned above, this paper presents an adopted software-defined mobile edge computing (SDMEC) with a lightweight machine learning (ML) algorithm, namely support vector machine (SVM), to enable intelligent MANO for real-time and resource-constraints IoT applications which require lightweight computation models. Furthermore, the SVM algorithm plays an essential role in performing QCI classification. Moreover, the software-defined networking (SDN) controller allocates and configures priority resources according to the SVM classification outcomes. Thus, the complementary of SVM and SDMEC conducts intelligent resource MANO for massive QCI environments and meets the perspectives of mission-critical communication with resource constraint applications. Based on the E2E experimentation metrics, the proposed scheme shows remarkable outperformance in key performance indicator (KPI) QoS, including communication reliability, latency, and communication throughput over the various powerful reference methods.
Keywords: Mobile edge computing; Internet of Things; software defined networks; traffic classification; machine learning; resource allocation
In the next-generation networks (NGN) era, numerous applications and services are rapidly converged to network systems that significantly obligated the intelligent network operation, and management and orchestration (MANO). The end-to-end (E2E) communication and computation resources of the control plane (CP) and the data plane (DP) obligate to extend MANO to meet the perspective of various quality of service (QoS) 5th generation (5G) and beyond 5th generation (B5G) networking applications. The intelligent QoS class identifier (QCI) based on the applied machine learning and deep learning algorithms take essential functions and deliver novelty opportunities to overcome the multi-level resources, application, and services requirements [1–3]. Furthermore, due to the insufficient computation capacity of mobile devices, applied mobile edge computing (MEC) empowers the computation resources and capability for real-time and mission-critical Internet of Things (IoT) services. The current network system still relies on mobile cloud computing (MCC). When data is transmitted to the cloud server, time delay problems occur due to limited data transmission speed, consumption of network resources, and server loading. The mission-critical and real-time applications will suffer from the remote cloud infrastructure. MEC has proposed succeeding with 5G/B5G networking to shorten latency and reduce energy consumption, which has emerged as a new paradigm [4]. However, edge computing operates with limited resources than the existing centralized cloud. Therefore, to accommodate QCI in the heterogeneous IoT (HIoT) environment, this paper proposes an intelligent resource allocation scheme (IRAS) is to minimize the time delay problem. The IRAS proposed in this paper aims to compute the real-time and mission-critical applications at the edge areas. In particular, the software-defined networking (SDN) controller will be configured to handle the user requests based on the priority assignment approach. Furthermore, the proposed IRAS classifies traffic-utilizing in a support vector machine (SVM) algorithm. The SVM enables the QCI classification of the user services and edge computation levels clustering. Finally, significant experimentation and result validation are conducted in this paper.
The rest of the paper has been organized as follows—the related research on MEC resource allocation and QCI classification are elaborated in Section 2. The proposed IRAS method is conducted in Section 3. Section 4 discusses the performance evaluation results. Finally, Section 5 describes the conclusion and future work.
2.1 Network Traffic Classification
There are several existing network traffic classification methods, including port-based traffic classification, payload-based traffic classification, and machine learning-based traffic classification. Port-based traffic classification is a method of classifying the corresponding application traffic by checking the port number when a network port number used by all programs is assigned through the Internet Assigned Numbers Authority (IANA). However, the port-based traffic classification remains poor accuracy for the dynamic-port application. For example, the dynamic-ports application has rapidly increased in the 5G/B5G era [5–9]. Furthermore, the payload-based traffic classification method inspects the application layer’s payload and the actual content of packets in network traffic utilizing deep packet inspection (DPI) [10,11].
Due to the machine learning-based traffic classification method operating without utilizing payload, traffic classification can be performed regardless of whether the application is encrypted [12,13]. Machine learning-based traffic classification is a method of classifying traffic using machine learning classification and clustering techniques after learning items that can be characteristic of traffic for each application. Recently, network traffic classification utilizing deep learning is being actively conducted, and network traffic classification using machine learning in SDN has become the practical solution for vertical and horizontal network and traffic level classification [14]. The SVM-based classification is suitable for binary classification. However, the binary classification approach challenges implementing multiple classifications, while the one-to-many or one-to-one methods are used. One-to-many is a method of selecting the class with the highest decision score by creating a binary classifier for each category. One-to-one is a method of choosing the most classified as positive by creating a binary classifier for all the cases in the combination of two classes. Therefore, a binary classification algorithm is selected in the multiple classifications from the one-to-many or one-to-one method is automatically selected and executed in scikit-learn [15].
Random forest algorithms were conducted to achieve more prediction reliability. The data set that the generated individual decision tree learns is data sampled to overlap some of the entire data, called bootstrapping partitioning. Random forest is characterized by easy handling of missing values and providing a practical algorithm for processing extensive data. And without adjusting the hyperparameters, reasonable accuracy can be achieved only with the default values. Also, it has the advantage of not modifying the data separately. However, it has the disadvantage that it uses more memory than a general linear model and takes a long time to train and predict. Naive Bayes is a statistical classification algorithm based on the Bayes theorem. The most straightforward, fastest, and most reliable algorithm takes less training speed than a linear classifier and has the characteristics of processing large amounts of data more quickly. In addition, it is characterized by relatively good performance without adjusting parameters separately. However, it can be complex when there are many features by considering all correlations between features. Therefore, it is used to classify simplified data in a short time.
SVM is an algorithm that finds the decision boundary that maximizes the margin by distinguishing two groups separated linearly. The dividing line used to separate the two groups is called a decision boundary, and the key is to find the decision boundary that best separates the two groups. We need to find the optimal weights and biases to define decision boundaries. SVM was initially being developed for binary classification problems and finding an expression that fits multiple classes is still a problem that needs to be continuously studied [16]. SVM can be used for prediction problems of numerical or categorical data, and at least the data characteristics show good performance. Also, since it is less affected by erroneous data, overfitting can be avoided. However, various tests are required to find the optimal model to adjust multiple kernels and hyperparameters.
Offloading operations enable resource limited IoT devices to perform complex and large amounts of functions [17]. Because IoT devices have a fixed battery life, they perform sophisticated application operations using mobile cloud computing or mobile edge computing. Resource allocation solves the problem of selecting an edge server to be offloaded among several edge servers. Computational offloading can use mobile cloud computing and mobile edge computing. Among them, mobile cloud computing has the advantage of enabling more complex operations. Still, because it is centralized and far from IoT devices, it is vulnerable to security and data defects and may cause time delays. Therefore, real-time processing is required, and it is a distributed structure for applications and stable data storage. Consequently, it is helpful to offload operations using mobile edge computing techniques close to users.
Computational offloading can be primarily divided into binary offloading and partial offloading [18–20]. Binary offloading performs tasks that cannot be split locally on a mobile device as a whole or offload them all to the MEC server. Sub-loading is achieved by performing a subset of operations on the IoT devices and offloading the rest to the edge server. An essential point in partial offloading is in what order operations are performed because the subsets divided in the application are interdependent.
3.1 Requirements for Each Service
The QCI represents QoS characteristics such as priority steps, packet delays, and packet error rates in the 5G/B5G mobile communication. The default priority level of resource scheduling among the QoS flows of the packet delay budget implies the peak of the time a packet can be delayed. Packet error rate (PER) refers to the upper limit of the percentage of protocol data units (PDUs) that are not successfully delivered to the upper layer when data is transmitted. The Default Maximum Data Burst Volume (DMDBV) represents an immense amount of data which 5G access networks should be served. The default averaging window instead of the period during which the guaranteed flow bit rate (GFBR) and the maximum flow bit rate (MFBR) should be calculated. This value is also used instead of the preconfigured value when received. In this paper, data were generated considering the characteristics of the classes 5G QoS identifier (5QI), and the maximum default data burst volume and default barging window were excluded from the feature extraction stage.
3.2 Classification of Network Traffic Using Machine Learning
Since this paper targets IoT devices that require rapid computational processing, a lightweight traffic classification algorithm is targeted [21]. Since the machine learning-based traffic classification method can overcome and utilize the limitation of the existing traffic classification method, such as backbone of communication in the networking area to ensure investigation of the QoS support for diverse applications. Therefore, in this paper, machine learning-based traffic classification to identify characteristics for establishing a classification model of offline data.
Data collection is divided into data measurement and label allocation. After data is collected in the data measurement stage, consideration on sending packets, forming IP flows, and assigning the application’s name. Then, capturing the transmitting packets and binary data are extracted from each captured point. Next, the IP flow is formed, as shown in Figs. 1a and 1b. Flow is used in traffic classification, a set of packets transmitted from the source to the destination. Packets belonging to one identical flow have transported headers or application headers such as source and destination IP addresses, port numbers, or protocol types [22–25].
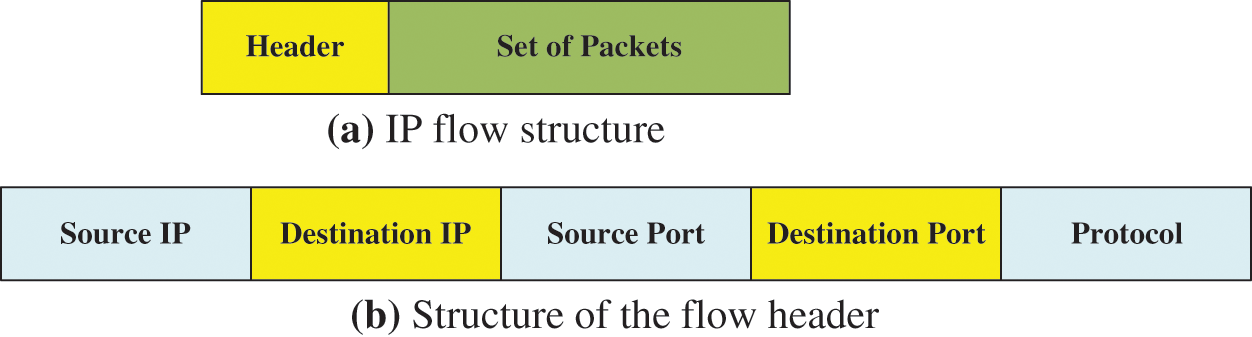
Figure 1: (a) IP flow structure and (b) Structure of the flow header
In the flow structure, the packet is to achieve notice the flow proceeds in association with a specific pattern of application. In this process, verification of traffic classification is essential, and DPI is mainly processed to inspect applications detail from data traffic. Furthermore, generating end-to-end simulation in the proposed network environment for data collection, which traffic can be obtained and identified through simulation or traffic generation systems in an environment capable of controlling the network configuration.
To extract necessary data, be unused defect data can be removed, organized, and modified through normalization or a combination of data. Feature reduction and selection are facilitated for omitting the useless data featuring, and several features can be selected or reduced from the extracted features. Data extracted from flow are learned based on stochastic features such as flow duration, packet arrival interval, packet length, etc. [26]. The packet arrival interval and packet length are essential characteristics for traffic classification learning using machine learning. They can be used with measurement items such as maximum, minimum, average, and standard deviation. In this paper, since the class characteristics are shown in 5QI were considered, it consisted of PER and packet delay budget.
Several machine learning algorithms such as classification, clustering, and regression have been developed to perform various tasks. Moreover, machine learning algorithms can be selected according to prospectively purpose methods. In this paper, the communication traffic is classified using random forests, knife bases, and SVMs, which are well known as multiple classification algorithms. Otherwise, comparing the accuracy of each machine learning, a method is selected for resource allocation to provide differentiated QoS according to a specific application.
First, the random forest creates a training dataset through a bootstrap. Then, the training datasets are learned individually. Each tree node has a partition function divided into binary decisions the parameter characteristics for being randomly selected. The tree is divided, and then the features are compared with the threshold values of each tree to distinguish in conditions true and false. And find the best attributes among them as shown in Eq. (1). Thus, it goes through the process of selecting the result through voting as a result of performing predictions with sub-datasets in individual trees through learning.
The Naive Bayes algorithm has a slightly different classifier method depending on the categorical independent variable and the continuous independent variable. The proposed method in this paper, since the independent variable is continuous with packet loss ratio and delay time, the conditional probability can be calculated as depicted in Eq. (2) using the independent variable X, a normal distribution. The symbol
See in Eq. (3),
Since the dataset configuration used in this paper is difficult to distinguish in the support vector machine linearly, it can be determined using a soft margin SVM and a nonlinear kernel SVM. Norm is a method of measuring the size or length of a vector, and the distance of the margin is calculated using norm as presented in Eq. (6). The objective and constraint equations of the soft margin SVM are as Eqs. (7) and (8), respectively.
Root in the gambling of
for
Next, the minimum value of Eq. (10) is obtained to optimize with this Equation. In the Karush-Kuhn-Tucker (KKT) condition, since Eq. (10) is in the form of a continuous and convex function, it becomes the minimum value when the differential value is 0. Therefore, a Lagrange dual-format such as Eq. (11) may be obtained as a value attained by partial differentiation of this Equation.
for
Among the results of partial differentiation through the KKT conditions,
Finally, the optimal solution can be illustrated in the dual problems only when Eq. (13) satisfies the KKT condition.
To finally allows
3.2.4 Model Performance Evaluation
The execution process of the classification algorithm, see in Fig. 2. Several types of performance evaluation index methods of machine learning models used to derive results are among these. The classification evaluation method generally obtains accuracy by calculating the error between the actual and predicted results. However, in the case of binary classification, there is a limitation that the evaluation result may be wrong only with accuracy. Therefore, performance is evaluated using accuracy, error matrix, precision, recall, F1 score, and receiver operating characteristic (ROC)/area under the ROC curve (AUC). Our proposed method operates for a multiclass classification that is unsuitable to be divided into two class values of 0 and 1, and performance evaluation is performed through accuracy.
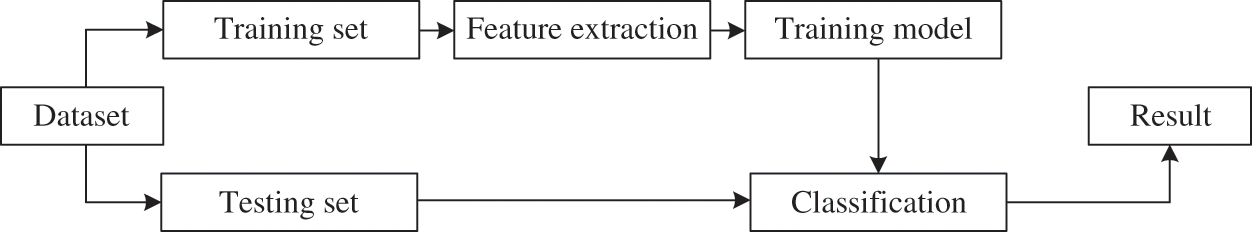
Figure 2: Classification algorithm
3.3 SDN-based Intelligent Resource Allocation Scheme
As presented in Fig. 3, the SDN controller performs traffic classification for coming. It is also realized that the SDN controller already knows the edge server resource usage status. Creating a rule to be stored in the flow table in the SDN controller in which resources are allocated from a specific edge server according to the application requirements of each class. The created rule is saved in the flow table of the OpenFlow switch. This structure divides the control area and the data areas to enable flexible network management and faster time delay-sensitive applications.
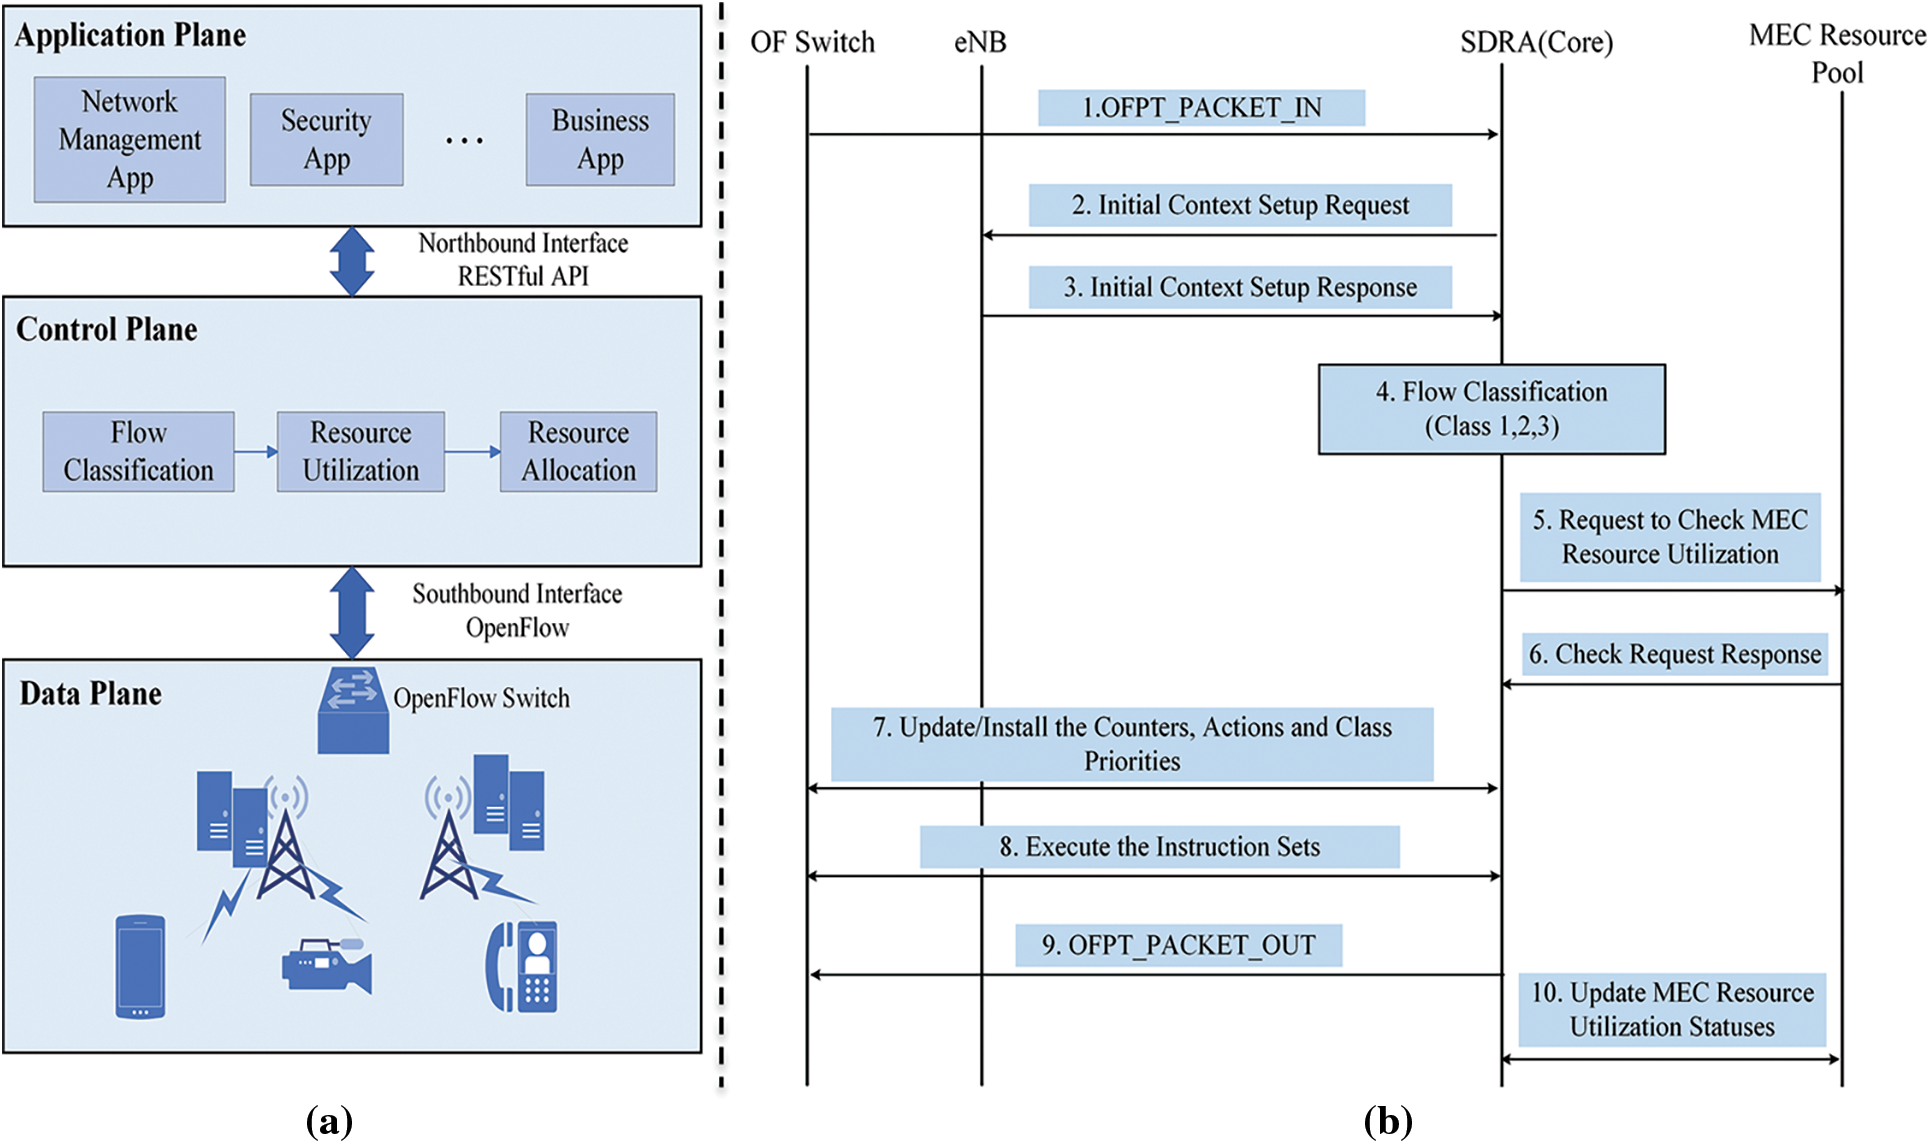
Figure 3: (a) SDN-based traffic classification and resource allocation and (b) SDN-based intelligent resource allocation scheme (IRAS)
Resource identification and allocation are necessary processes for IoT computation [27,28]. Resource verification is the stage in which the SDN controller gathers the resource information of the edge server. To obtain efficient execution of each application in resource allocation, the capacities in resource allocation, resource information, and resource utilization must be well-known.
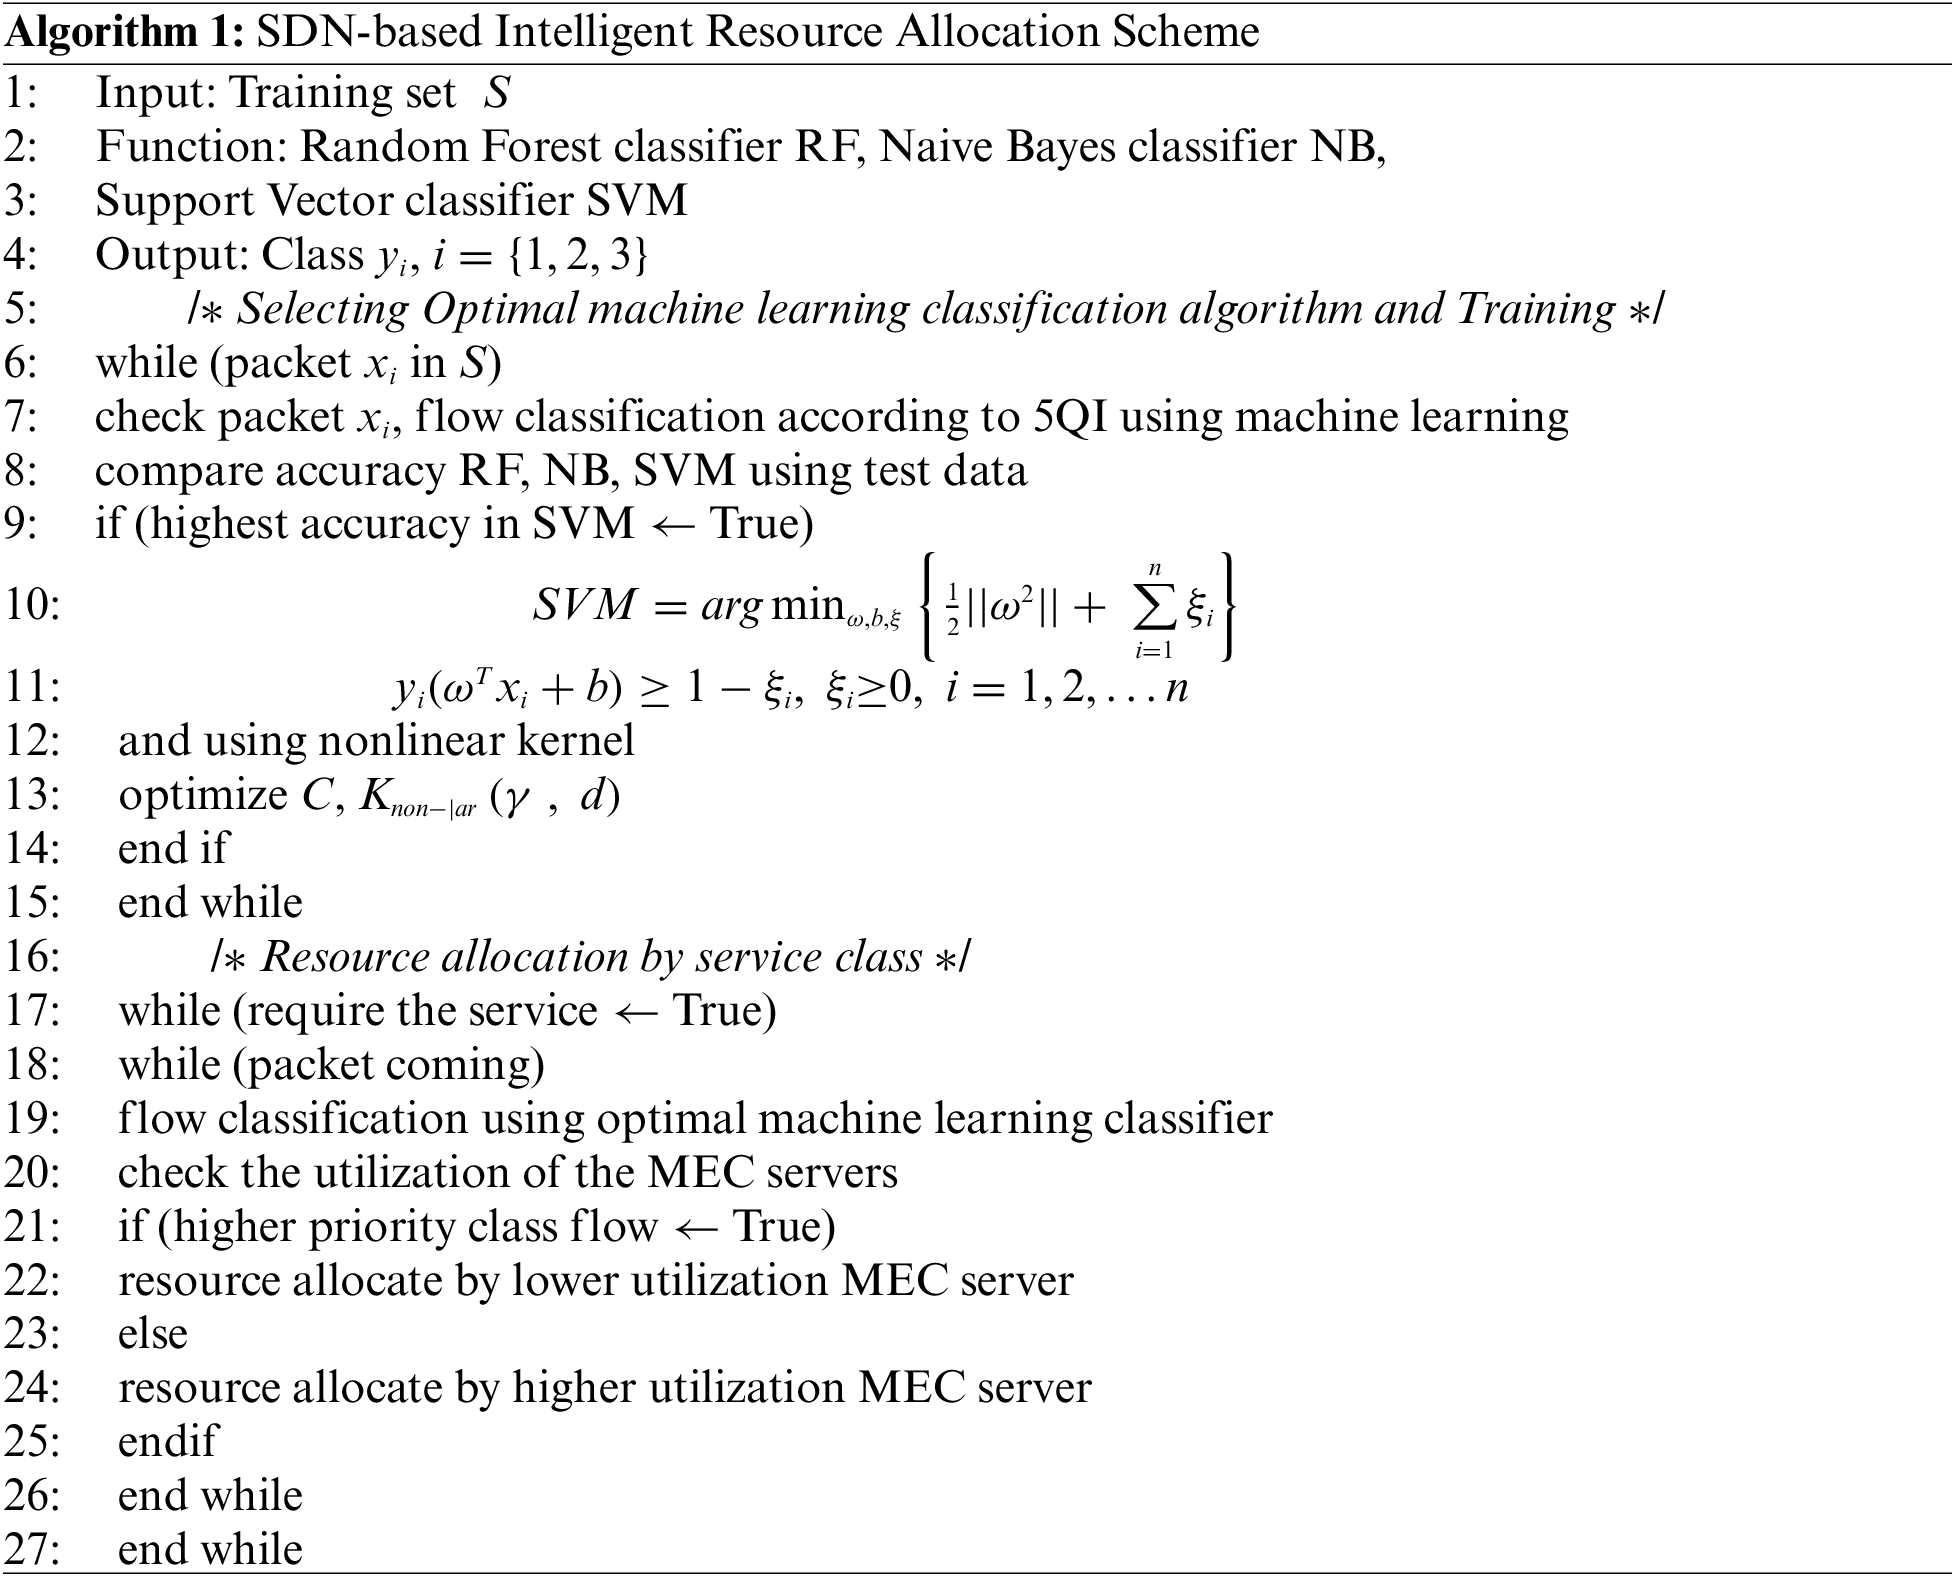
In this paper, IRAS is proposed to minimize the execution time of the deterministic operation model to shorten the transmission latency. Processing states from 1 to 3 and 7 to 9 are the same as the operation method of OpenFlow [29]. First, when the user connected to the wireless connection with a base station. Then, the SDN controller sends request packets for the initial global view to the base station. Afterward, packets are prioritized by the application through a traffic classifier that performs machine learning-based traffic classification of the SDN controller. At this time, the set of packets entering the traffic classifier is defined as a flow according to the SVM classification.
Meanwhile, the SDN controller requests the edge server and receives a response to determine the resource utilization rate of the MEC. As a result, the SDN controller can determine the utilization rate of each edge server. Then, by mapping the server that will use the MEC resource according to the class priority divided according to the flow classification result, the rules configured in the SDN controller flow table are created, and these rules are delivered to the OpenFlow switch through the PACKET_OUT message. Finally, since the resource utilization had changed due to the server’s resource usage, the changed edge server resource utilization status is updated in the state management module of the SDN controller. The procedure code of IRAS, the proposed method.
4.1 Evaluation of Network Traffic Classification Performance Using Machine Learning
The dataset generated with the characteristics of PER and delay time (Delay) is depicted in Fig. 4a. Although there is a difference in the distribution ranges, the number of data was used the same as 300 each class, see in Fig. 4b. Data were normalized to proceed with classification by uniformly adjusting the distribution range. The machine learning algorithm used in this paper was implemented using the scikit-learn library. When the data to be learned were classified into the random forest, knife bay, and SVM, the accuracy was shown in Tab. 1. The accuracy of the SVM and random forest was high, of which it was confirmed that the accuracy of the SVM was the best. In the actual experiment that reflects the proposed IRAS, the kernel was selected, and hyperparameters were adjusted to improve the accuracy of the SVM.
To find the optimal hyperparameters, optimization was performed based on commonly used values, as shown in Tab. 2.
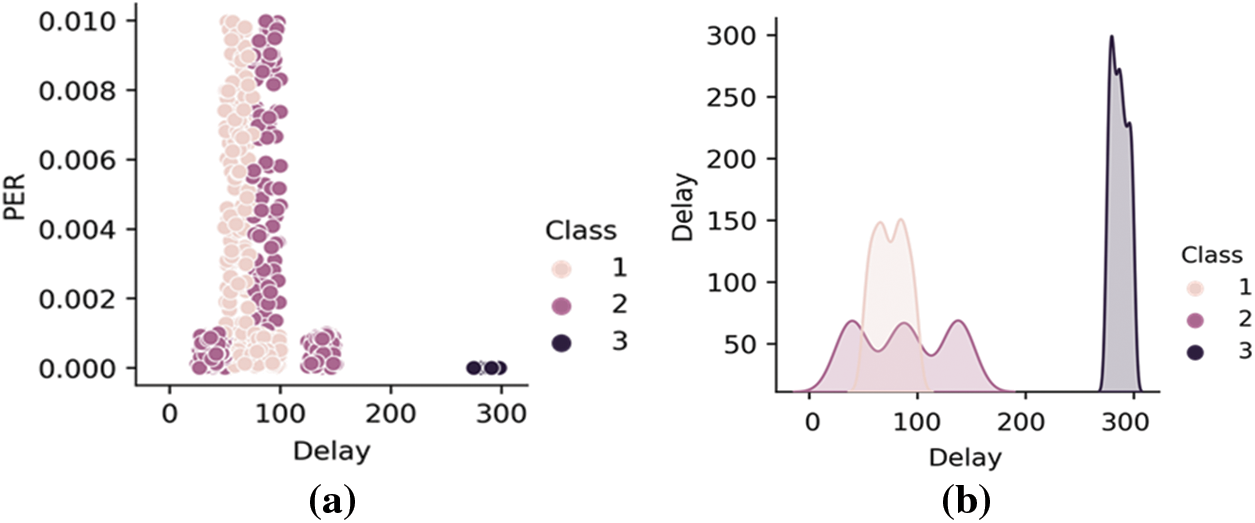
Figure 4: (a) Distribution of learning data by class according to data characteristics, and (b) Amount of learning data by class


Kernel, which is classification in nonlinear, includes four types: Linear kernel, Gaussian kernel, Polynomial kernel, and Sigmoid kernel. C represents the curvature of the kernel function in the training data. The degree means the order of the polynomial kernel. Therefore, the hyperparameters C, gamma, and degree values were adjusted to raise accuracy. As a result, when the optimal hyperparameters were the Gaussian kernel, C was 10, and gamma was 1, the accuracy was the highest at 97.8%.
4.2 SDN-based Intelligent Resource Allocation Technique Performance Evaluation
To illustrate the outperformance of the proposed IRAS algorithm, the conventional approaches of random and static algorithms were simulated, where random algorithm aimed to randomly allocate the resource for edge server utilization and state algorithm fully relied on experience-based allocation based on user experienced performance associated with nearby edge server correspondingly. Additionally, the Equal Cost Load Balancing (ECLB) algorithm was extensively simulated to perform traffic distribution with optimization of edge server by readjusting the loading path. Therefore, the proposed three conventional approaches, namely random, static, and ECLB, were conducted to present the efficiency indication.
The simulation is conducted in NS-3 for end-to-end, see in Fig. 5, in which flows are classified into three classes: mission-critical, real-time, and non-real-time, for the mapping to the MEC server according to priorities for each class is mentioned. Additionally, the mission-critical service for class 1 is required at least delay time, as depicted in Tab. 3, PER does not require relatively high reliability at
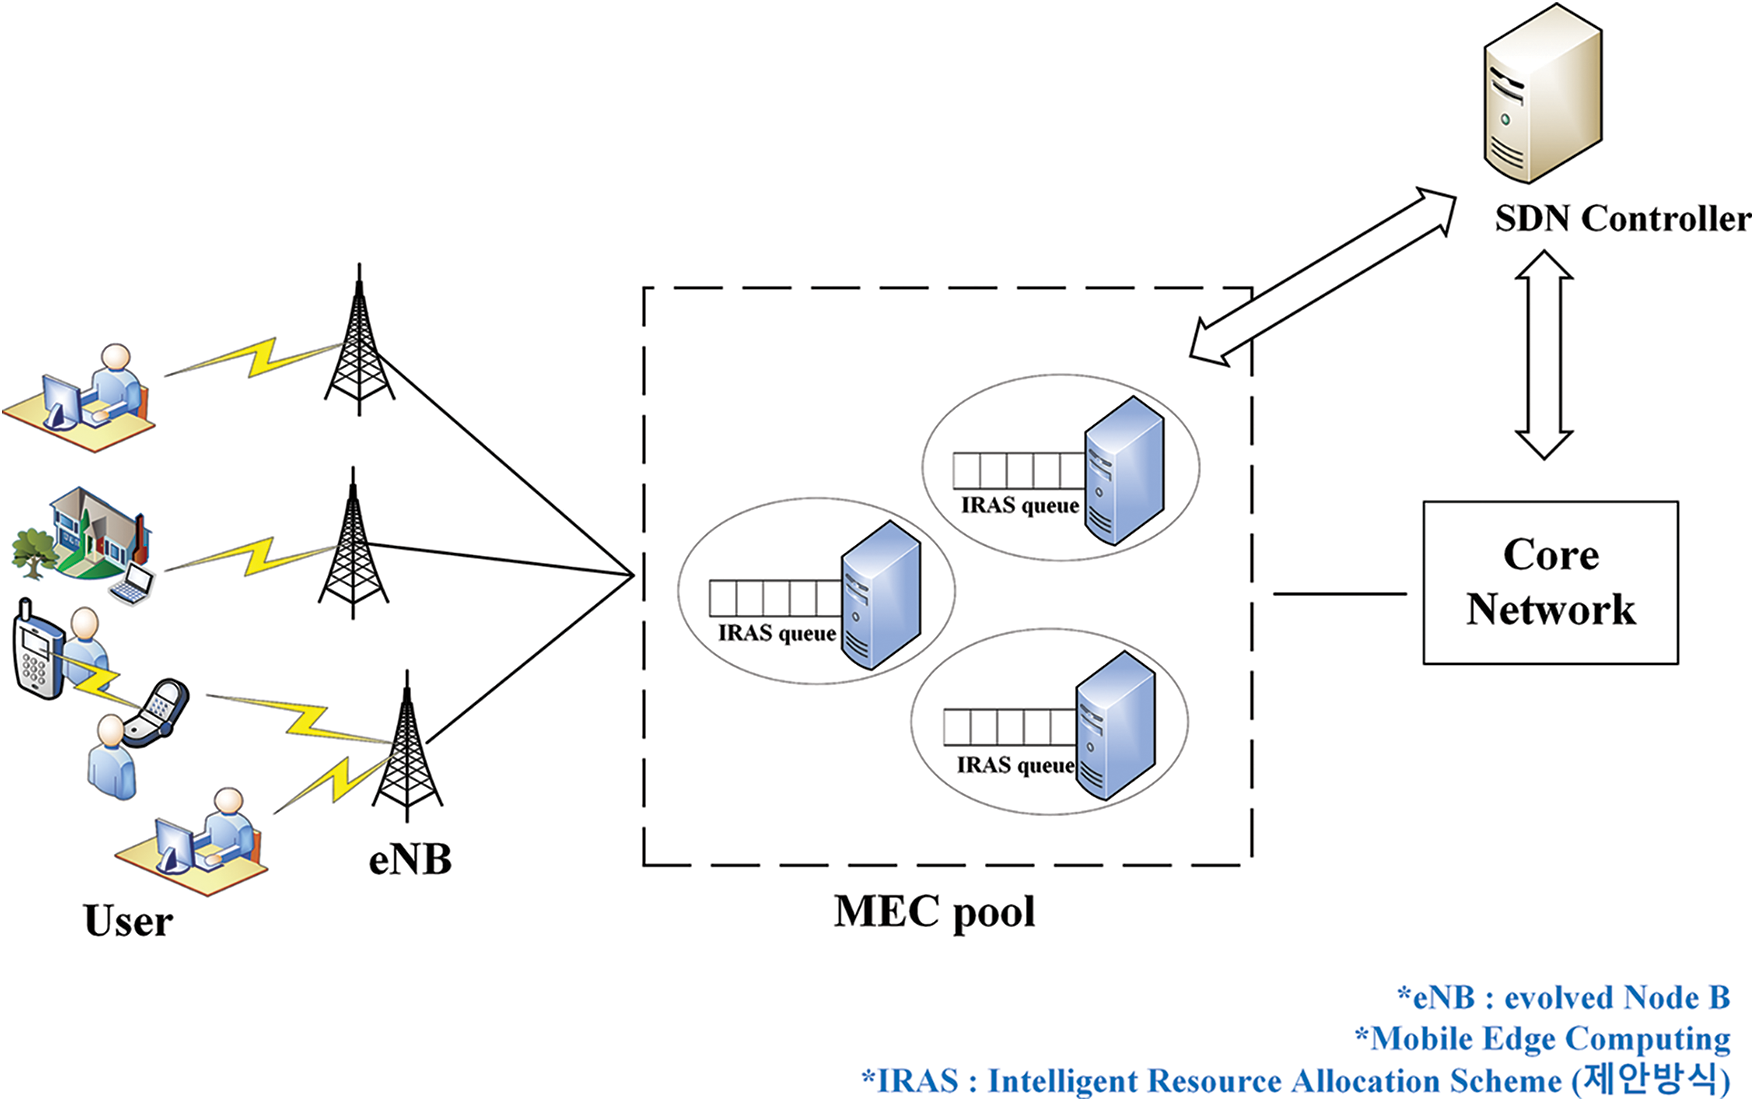
Figure 5: Simulation topology
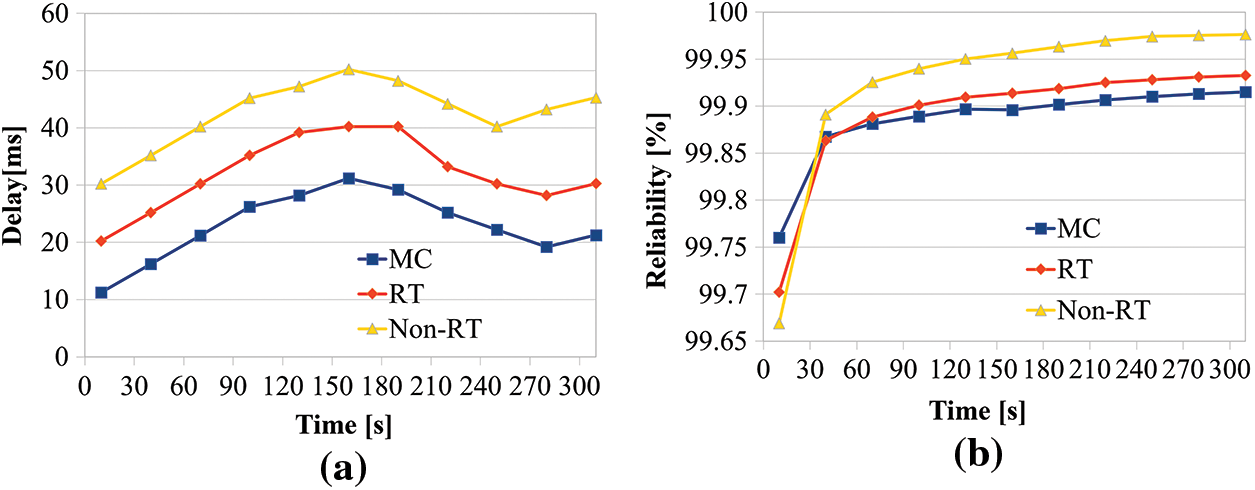
Figure 6: (a) Comparison of IRAS latency and (b) Reliability comparison of IRAS

The delay comparisons of the three services, see in Fig. 6a. For the Mission-Critical communication, RT is Real-Time, and Non-RT is Non-Real-Time, respectively, with the lowest latency of 11.24 ms and the highest latency of 31.21 ms according to the class priorities. The minimum delay time of RT is 20.24 ms, and the maximum delay time is 40.22 ms. The minimum delay time of the non-RT is 30.25 ms, and the maximum delay time is 50.21 ms. Furthermore, the average latency of the MC is 22.86 ms, the average latency of RT is 32.04 ms, and the average latency of non-RT is 42.68 ms. This paper is proposed IRAS complies with the requirements of 3GPP Release 17.
Reliability is determined by the degree to which the loss ratio is low according to the packet loss ratio, see in Fig. 6b. In the beginning, packet losses occurred relatively much due to the initial network setting, so reliability was low, but after that, all three services showed a reliability of 99.86% or more. The average reliability of MC is 99.89%, the average reliability of RT is 99.89%, and the average reliability of non-RT is 99.92%. Regarding Fig. 6a, the MC has relatively low reliability due to a shorter average delay time, while the packet loss is somewhat lower than that of RT and Non-RT. Conversely, RT and Non-RT have a relatively long average latency but have higher reliability than MC. This shows that the proposed IRAS complies with the requirements of 3GPP Release 17, as mission-critical services require rapid data transmission but do not require high reliability.
See in Fig. 7a, the graph presents the comparing packet loss ratios. The same context as reliability, it was confirmed that the packet loss ratio was high at first but then overall decreased to less than 0.1%. In addition, the ratio gradually decreases over time. Therefore, data transmission is stably performed in all services over time. The average packet loss ratio of the MC is 0.11%.
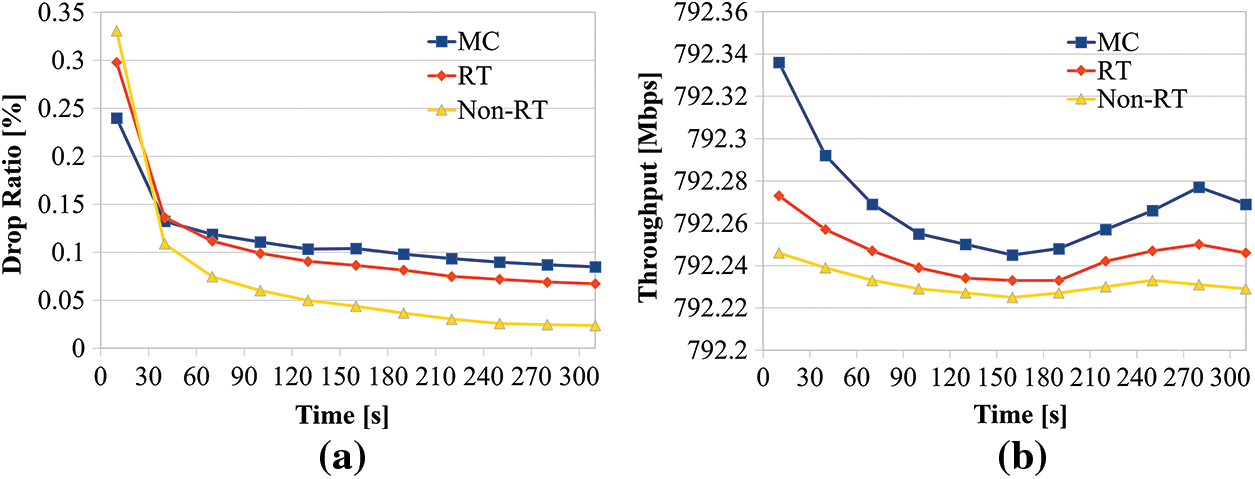
Figure 7: (a) Comparison of a packet loss ratio of IRAS. And (b) Comparison of IRAS throughput
The average packet loss ratio of RT is 0.11%. The average packet loss ratio of non-RT is 0.07%. See in Fig. 6a, the average delay time of MC is short, while the packet loss rate is somewhat higher than that of RT and Non-RT. Conversely, RT and Non-RT have a relatively long average latency, while the packet loss ratio is higher than that of MC. Fig. 7b shows that the average throughput of MC is the highest at 792.27 Mbps, the average throughput of RT is the second highest at 792.25 Mbps, and the average throughput of non-RT is the lowest at 792.23 Mbps. Through this, it was confirmed that as the utilization rate of the edge server decreases, the delay time occurs less, and the throughput increases.
As depicted in Fig. 8a, the comparing of latency at MC. In the case of Random, the latency value varies greatly depending on the simulation time because the edge server with high utilization and low utilization are connected without considering in advance. In the case of Static, communication is achieved by reflecting the previously connected edge server and reflecting the connection experience of the user and the server at the next connection. Therefore, the delay time changes by a smaller width compared to Random. ECLB processes data using all paths to the edge server, so all servers were used regardless of utilization rate. It was verified that a higher latency occurred than IRAS, which connects to the edge server with the lowest utilization rate. Fig. 8b presents a graph comparing reliability in mission-critical services. Although IRAS requires rapid data transmission in mission-critical services, the packet loss was not muchly considered significantly because reliability packet was not needed high. For this reason, it was confirmed that the average reliability of the proposed IRAS was 99.89%, the average reliability of Random was 99.91%, the average reliability of Static was 99.89%, and the average reliability of ECLB was 99.90%. As a result, due to various measures in the diver’s comparison of the mission-critical services. IRAS is relatively less reliable than Random, Static, and ECLB in mission-critical services.
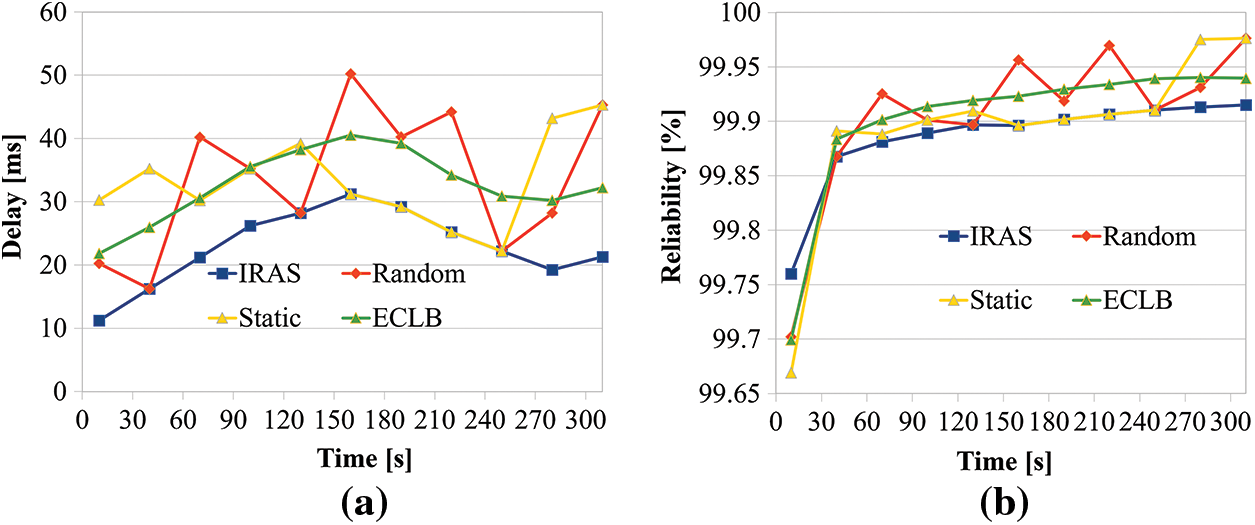
Figure 8: (a) Delay time comparison of mission-critical services. And (b) Reliability comparison of mission-critical services
The comparing packet loss ratios, see in Fig. 9a. The IRAS requires rapid data transmission and does not require much reliability in mission-critical services, so the average packet loss rate is 0.115%, 0.095%, 0.107%, and 0.098%, respectively, indicating that IRAS, Random, Stat, and ECLB packet loss rates are all low over time. Through this, it was confirmed that the proposed IRAS had a slightly higher packet loss rate than Random, Static, and ECLB, which did not differentiate the requirements of mission-critical services. And Fig. 9b illustrates the result of comparing throughput in mission-critical services. It was confirmed that the average throughput of IRAS was 792.27 Mbps, the average throughput of Random was 792.25 Mbps, the average throughput of Static was 792.24 Mbps, and the average throughput of ECLB was 792.25 Mbps, compared to other algorithms such as Random or Static. This confirms that IRAS can process large amounts of data in a shorter time than other algorithms in mission-critical services.
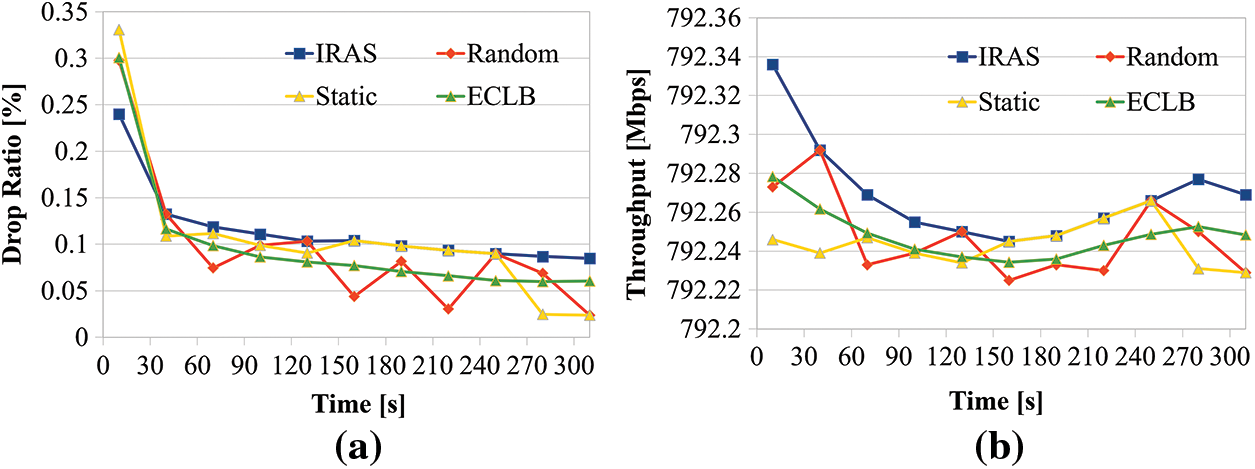
Figure 9: (a) Compare packet loss rates of mission-critical services. And (b) Throughput comparison of mission-critical services
This paper proposes an SDN-based intelligent resource allocation technique that classifies traffic transmitted to edge servers by service to provide improved QoS to each application performed by IoT devices and guarantees QoS according to the priority of QCI. Existing resource management models require a complex process to perform applications requested by IoT devices and are not suitable for allocating and utilizing resources in large and complex network environments. In this paper, IRAS, an intelligent resource allocation technique to minimize the time delay problem, was proposed to solve this problem. Since the proposed IRAS focused on performing latency-sensitive applications, machine learning-based traffic classification, a lightweight algorithm among various traffic classification methods, was used. The machine learning algorithm adopted and used a support vector machine capable of fast, light computational processing. After classifying the traffic, the SDN controller allocated each traffic to an edge server capable of providing rapid service among several edge servers according to the priority of the QCI. SDN-based intelligent resource allocation techniques that can guarantee E2E data transmission considering both control and data areas through this efficient network operation and management method were evaluated through E2E experiments. As a result, it was confirmed that high performance was exhibited in results, including communication reliability, delay time, and communication throughput in terms of QoS, which is a KPI. In the future, if research is added to predict network conditions such as edge server utilization, data inflow, and data transmission cycle through intelligent algorithms, it will reduce time and cost to identify edge server utilization and quickly respond to network congestion. In addition, since the calculation time of the MEC server can be identified through the calculation model, the resource allocation method considering the calculation time can be regarded as a future study.
Funding Statement: This work was funded by Basic Science Research Program through the National Research Foundation of Korea (NRF) funded by the Ministry of Education (NRF-2020R1I1A3066543) and this research was supported by the Bio and Medical Technology Development Program of the National Research Foundation (NRF) funded by the Korean government (MSIT) (No. NRF-2019M3E5D1A02069073). In addition, this work was supported by the Soonchunhyang University Research Fund.
Conflicts of Interest: The authors declare that they have no conflicts of interest to report regarding the present study.
1. Y. Mao, C. You, J. Zhang, K. Huang and K. B. Letaief, “A survey on mobile edge computing: The communication perspective,” IEEE Communications Surveys & Tutorials, vol. 19, no. 4, pp. 2322–2358, 2017. [Google Scholar]
2. F. Spinelli and V. Mancuso, “Toward enabled industrial verticals in 5G: A survey on MEC-based approaches to provisioning and flexibility,” IEEE Communications Surveys & Tutorials, vol. 23, no. 1, pp. 596–630, 2021. [Google Scholar]
3. P. Porambage, J. Okwuide, M. Liyanage, M. Ylianttila and T. Taleb, “Survey on multi-access edge computing for internet of things realization,” IEEE Communications Surveys & Tutorials, vol. 20, no. 4, pp. 2961–2989, 2018. [Google Scholar]
4. S. D. A. Shah, M. A. Gregory, S. Li and R. D. R. Fontes, “SDN enhanced multi-access edge computing (MEC) for E2E mobility and QoS management,” IEEE Access, vol. 8, pp. 77459–77469, 2020. [Google Scholar]
5. H. Li, G. Shou, Y. Hu and Z. Guo, “Mobile edge computing: Progress and challenges,” in Proc. 2016 4th IEEE Int. Conf. on Mobile Cloud Computing, Services, and Engineering (MobileCloud), Oxford, UK, pp. 83–84, 2016. [Google Scholar]
6. H. Li, H. Xu, C. Zhou, X. Lü and Z. Han, “Joint optimization strategy of computation offloading and resource allocation in multi-access edge computing environment,” IEEE Transactions on Vehicular Technology, vol. 69, no. 9, pp. 10214–10226, 2020. [Google Scholar]
7. W. Rafique, L. Qi, I. Yaqoob, M. Imran, R. U. Rasool et al., “Complementing IoT services through software defined networking and edge computing: A comprehensive survey,” IEEE Communications Surveys & Tutorials, vol. 22, no. 3, pp. 1761–1804, 2020. [Google Scholar]
8. F. Pacheco, E. Exposito, M. Gineste, C. Baudoin and J. Aguilar, “Towards the deployment of machine learning solutions in network traffic classification: A systemic survey,” IEEE Communications Surveys & Tutorials, vol. 21, no. 2, pp. 1988–2014, 2019. [Google Scholar]
9. J. Zhang, Y. Xiang, Y. Wang, W. Zhou, Y. Xiang et al., “Network traffic classification using correlation information,” IEEE Transactions on Parallel and Distributed Systems, vol. 24, no. 1, pp. 104–117, 2013. [Google Scholar]
10. M. Korczyński and A. Duda, “Classifying service flows in the encrypted skype traffic,” in Proc. 2012 IEEE Int. Conf. on Communications (ICC), Ottawa, ON, Canada, pp. 1064–1068, 2012. [Google Scholar]
11. R. Lin, O. Li, Q. Li and Y. Liu, “Unknown network protocol classification method based on semi-supervised learning,” in Proc. 2015 IEEE Int. Conf. on Computer and Communications (ICCC), Chengdu, China, pp. 300–308, 2015. [Google Scholar]
12. I. F. Akyildiz, A. Lee, P. Wang, M. Luo and W. Chou, “Research challenges for traffic engineering in software defined networks,” IEEE Network, vol. 30, no. 3, pp. 52–58, 2016. [Google Scholar]
13. F. Pedregosa, G. Varoquaux, A. Gramfort, V. Michel, B. Thirion et al., “Scikit-learn: Machine learning in python,” Journal of Machine Learning Research, pp. 2825–2830, 2011. [Google Scholar]
14. J. Bajard, P. Martins, L. Sousa and V. Zucca, “Improving the efficiency of SVM classification with FHE,” IEEE Transactions on Information Forensics and Security, vol. 15, pp. 1709–1722, 2020. [Google Scholar]
15. Y. Gao, Y. Cui, X. Wang and Z. Liu, “Optimal resource allocation for scalable mobile edge computing,” IEEE Communications Letters, vol. 23, no. 7, pp. 1211–1214, 2019. [Google Scholar]
16. C. You, K. Huang, H. Chae and B. -H. Kim, “Energy-efficient resource allocation for mobile-edge computation offloading,” IEEE Transactions on Wireless Communications, vol. 16, no. 3, pp. 1397–1411, 2017. [Google Scholar]
17. J. Feng, L. Liu, Q. Pei, F. Hou, T. Yang et al., “Service characteristics-oriented joint optimization of radio and computing resource allocation in mobile-edge computing,” IEEE Internet of Things Journal, vol. 8, no. 11, pp. 9407–9421, 2021. [Google Scholar]
18. T. -K. Le, U. Salim and F. Kaltenberger, “An overview of physical layer design for ultra-reliable low-latency communications in 3GPP releases 15, 16, and 17,” IEEE Access, vol. 9, pp. 433–444, 2021. [Google Scholar]
19. L. Peng, B. Yang, Y. Chen and Z., Chen, “Effectiveness of statistical features for early stage internet traffic identification,” International Journal of Parallel Programming, vol. 44, no. 1, pp. 181–197, 2016. [Google Scholar]
20. A. Finamore, M. Mellia, M. Meo, M. M. Munafo, P. D. Torino et al., “Experiences of internet traffic monitoring with tstat,” IEEE Network, vol. 25, no. 3, pp. 8–14, 2011. [Google Scholar]
21. P. Khandait, N. Hubballi and B. Mazumdar, “Efficient keyword matching for deep packet inspection based network traffic classification,” in Proc. 2020 Int. Conf. on Communication Systems & NETworkS (COMSNETS), Bengaluru, India, pp. 567–570, 2020. [Google Scholar]
22. I. Klyueva, “Improving quality of the multiclass SVM classification based on the feature engineering,” in Proc. 2019 1st Int. Conf. on Control Systems, Mathematical Modelling, Automation and Energy Efficiency (SUMMA), Lipetsk, Russia, pp. 491–494, 2019. [Google Scholar]
23. R. Hofstede, P. Celeda, B. Trammell, I. Drago, R. Sadre et al., “Flow monitoring explained: From packet capture to data analysis with NetFlow and IPFIX,” IEEE Communications Surveys & Tutorials, vol. 16, no. 4, pp. 2037–2064, 2014. [Google Scholar]
24. J. Ren, G. Yu, Y. Cai and Y. He, “Latency optimization for resource allocation in mobile-edge computation offloading,” IEEE Transactions on Wireless Communications, vol. 17, no. 8, pp. 5506–5519, Aug. 2018. [Google Scholar]
25. S. Barbarossa, S. Sardellitti and P. Di Lorenzo, “Joint allocation of computation and communication resources in multiuser mobile cloud computing,” in Proc. 2013 IEEE 14th Workshop on Signal Processing Advances in Wireless Communications (SPAWC), Darmstadt, Germany, pp. 26–30, 2013. [Google Scholar]
26. J. Pan and J. McElhannon, “Future edge cloud and edge computing for internet of things applications,” IEEE Internet of Things Journal, vol. 5, no. 1, pp. 439–449, 2018. [Google Scholar]
27. A. Ksentini and P. A. Frangoudis, “On extending ETSI MEC to support LoRa for efficient IoT application deployment at the edge,” IEEE Communications Standards Magazine, vol. 4, no. 2, pp. 57–63, 2020. [Google Scholar]
28. O. Almomani, O. Ghazali and S. Hassan, “Performance study of large block forward error correction with random early detection queue policy,” in Proc. 2009 IEEE Symp. on Industrial Electronics & Applications, Kuala Lumpur, Malaysia, pp. 457–462, 2009. [Google Scholar]
29. M. Dzida, M. Zagozdzon, M. Pioro and A. Tomaszewski, “Optimization of the shortest-path routing with equal-cost multi-path load balancing,” in Proc. 2006 Int. Conf. on Transparent Optical Networks, Nottingham, UK, pp. 9–12, 2006. [Google Scholar]
 | This work is licensed under a Creative Commons Attribution 4.0 International License, which permits unrestricted use, distribution, and reproduction in any medium, provided the original work is properly cited. |