DOI:10.32604/cmc.2022.031147
| Computers, Materials & Continua DOI:10.32604/cmc.2022.031147 | |
| Article |
Metaheuristic Optimization Through Deep Learning Classification of COVID-19 in Chest X-Ray Images
1Department of Information Technology, College of Computer and Information Sciences, Princess Nourah bint Abdulrahman University, Riyadh 11671, Saudi Arabia
2Department of Communications and Electronics, Delta Higher Institute of Engineering and Technology, Mansoura 35111, Egypt
3Faculty of Artificial Intelligence, Delta University for Science and Technology, Mansoura 35712, Egypt
4Department of Computer Sciences, College of Computer and Information Sciences, Princess Nourah bint Abdulrahman University, Riyadh 11671, Saudi Arabia
5Computer Engineering and Control Systems Department, Faculty of Engineering, Mansoura University, 35516, Mansoura, Egypt
6Department of Computer Science, Faculty of Computer and Information Sciences, Ain Shams University, 11566, Cairo, Egypt
7Department of Computer Science, College of Computing and Information Technology, Shaqra University, 11961, Saudi Arabia
8Faculty of Computers and Artificial Intelligence, Benha University, Egypt
9School of Science, Engineering, and Environment, University of Salford, UK
10Faculty of Computers and Informatics, Suez Canal University, Ismailia, 41522, Egypt
11Koszalin University of Technology, Poland
12Faculty of Artificial Intelligence, Kafrelsheikh University, Kafrelsheikh, 33511, Egypt
*Corresponding Author: Ghada Atteia. Email: geatteiaallah@pnu.edu.sa
Received: 11 April 2022; Accepted: 17 May 2022
Abstract: As corona virus disease (COVID-19) is still an ongoing global outbreak, countries around the world continue to take precautions and measures to control the spread of the pandemic. Because of the excessive number of infected patients and the resulting deficiency of testing kits in hospitals, a rapid, reliable, and automatic detection of COVID-19 is in extreme need to curb the number of infections. By analyzing the COVID-19 chest X-ray images, a novel metaheuristic approach is proposed based on hybrid dipper throated and particle swarm optimizers. The lung region was segmented from the original chest X-ray images and augmented using various transformation operations. Furthermore, the augmented images were fed into the VGG19 deep network for feature extraction. On the other hand, a feature selection method is proposed to select the most significant features that can boost the classification results. Finally, the selected features were input into an optimized neural network for detection. The neural network is optimized using the proposed hybrid optimizer. The experimental results showed that the proposed method achieved 99.88% accuracy, outperforming the existing COVID-19 detection models. In addition, a deep statistical analysis is performed to study the performance and stability of the proposed optimizer. The results confirm the effectiveness and superiority of the proposed approach.
Keywords: Covid-19; feature selection; dipper throated optimization; particle swarm optimization; deep learning
Corona virus disease (COVID-19) has swept the globe, resulting in millions of confirmed cases and millions of fatalities in 192 nations and territories [1]. Because of its extended incubation time and lack of visible early symptoms, it is easy to miss the ideal treatment window, which, along with its highly infectious nature, resulted in a large-scale pandemic. COVID-19 must be diagnosed as soon as possible to prevent the disease from spreading. The Polymerase Chain Reaction (PCR), which identifies viral nucleic acid to determine whether the tester is infected, is a frequently used method for COVID-19 detection. However, employing nasopharyngeal and throat swabs, which might be impacted by low viral load and sampling problems, this approach may provide low accuracy [2].
Screening using Chest computed tomography (CT) performed better than PCR in terms of sensitivity and accuracy at the time of initial patient presentation. However, as the number of patients suspected of having COVID-19 increased, the limited CT capacity became even more overwhelmed. As a result, the chest X-ray (CXR) is increasingly important in identifying COVID-19 characteristics. However, the early chest X-ray results are less accurate than PCR [3]. The sensitivity and accuracy of CXR-based COVID-19 detection have grown to a high level as a result of the accumulation of staff experience, and it has shown to be a helpful instrument for detecting COVID-19 instances. More and more researchers are focusing on machine learning-based supplementary diagnostic technologies.
According to previous publications, the field of COVID-19 detection is primarily focusing on the classification of raw chest X-ray images using classic machine learning methods. However, authors in [4] could classify lung infection resulting from COVID-19 based on portable CXR and AI imaging analysis tools. The authors employed classifiers including K-nearest classifier (KNN), CART (DT), XGB-Tree, XGB-L, and Naive Bayes in their study to introduce five supervised machine learning models for COVID-19 CXR image categorization. The combined classifier obtained 79.52% accuracy on multi-class classification, according to the results of the experiments. Authors in [5] reviewed many cardiovascular uses of machine learning models and their prospective applicability to COVID-19 infection cardiovascular diagnosis and therapy. The authors investigated the risk stratification tools and COVID-19 early detection. They discovered that machine learning methods could enable a software solution application to assess vast volumes of training data and generate predictions without previous programming. Machine learning algorithms can swiftly give answers to novel issues with unique obstacles, such as the COVID-19 pandemic, by analyzing vast amounts of training data and identifying linkages that may have been ignored previously.
There have been several achievements in COVID-19 detection thanks to the deep convolution neural network method’s unique advantage in image processing. Authors in [6] proposed a method for COVID-19 diagnosis using a patch-based convolutional neural networks (CNN) with a small set of parameters to be trained. This method is based on analyzing CXR radiographs statistically. They also presented a training of a limited set of training samples using a deep neural network for COVID-19 CXR image analysis. The authors investigated the imaging biomarkers seen in CXR images and developed a network for the categorization of random patch cropping. The suggested approach accurately represents radiological findings according to the results of the experiments. Authors [7] developed an automated COVID-19 identification approach based on raw chest X-ray images. The authors classified COVID-19 images into multi-classes (COVID-19, Pneumonia, Normal) and binary classes (COVID-19 or Normal) using you-only-look-once (YOLO) and DarkNet architectures. The number of convolutional layers was 17 in the approach developed by the authors with varied filtering on each layer. It may be used to help radiologists validate their first screening results. The suggested technique has a multi-class accuracy of 87.02% and binary class accuracy of 98.08%. A chest X-ray image analysis and classification model based on ResNet-50 was presented by the authors in [8]. The authors first evaluated the COVID-19 photos to identify the sick people in the X-ray images of the chest, after which they classified them using ResNet-50. In terms of using computer-aided in pathology, the trial findings were favorable. The authors of [9] created a novel deep CNN particularly for segmenting COVID-19 infections in chest CT images. The authors were motivated by the fact that modifying the global intensity of the features for COVID-19 infection segmentation can enhance the border of the infected lung. Therefore they designed a feature variation block that adaptively changes the global properties of the features.
It can be noted that the performance of the previously mentioned methods is satisfactory; however, practically, a significant amount of background noise (such as skeleton, lines, shoulder, etc.) is usually contained in the images of the original CXR as depicted in Fig. 1. Consequently, the sensitivity of classifiers can be reduced significantly. Although some models have reached state-of-the-art performance, the background features were most likely employed for feature learning. On the other hand, although training the machine learning models with a high number of background noises may yield better results, these noises will result in significant interference with the recognition impact, practically.
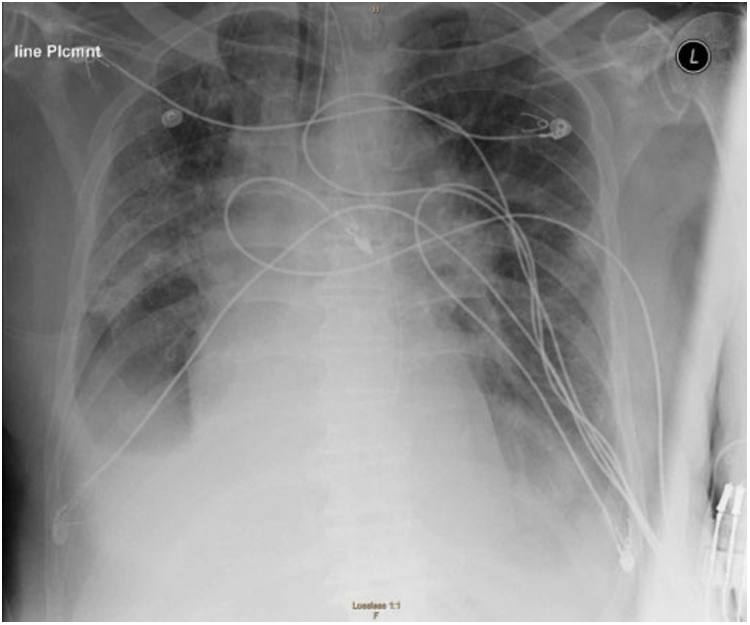
Figure 1: Original CXR image
In this study, we proposed a novel method for classifying COVID-19 in CXR images using a hybrid meta-heuristic between two powerful optimizers for the purposed of feature selection and the optimization of the machine learning model. The features are extracted from a deep neural network and use transfer learning. The proposed hybrid optimizer comprises the dipper throated and particle swarm optimizers. In addition, we have come up with a new feature selection method that can select the significant features automatically based on the proposed hybrid optimizer. The main contributions of this study are as follows.
1. A novel hybrid optimizer based on the dipper throated and the particle swarm optimizers.
2. Efficient optimization of a neural network using the proposed hybrid optimizer.
3. Accurate classification of Covid-19 cases using the proposed method.
4. Comparison with other competing optimization and feature selection methods.
The following is a short description of the rest of this paper. Section 2 presents the related research efforts. The proposed method is discussed in Section 3. The discussion of the experimental is presented in Section 4. Then, Section 5 contains the conclusions.
Some of the most recent COVID-19 research calls for deep learning techniques. Most researchers have been obliged to employ transfer learning due to the novelty of COVID-19 and the corresponding lack of big data sets. The performance of latent CNN architectures employed in medical image categorization in recent years is evaluated by authors [9]. These architectures include Inception, Inception-ResNetv2, Xception, MobileNet v2, VGG19. Transfer learning is used by authors because it is effective in using small medical image datasets to detect numerous anomalies [10]. They analyzed 1,442 patient X-ray data sets, comprising 714 instances of viral and bacterial pneumonia, positive COVID-19 infection in 224 cases, and normal cases of 504 instances. The findings suggest that VGG19 and MobileNet-v2 are the most accurate among the other CNNs in terms of classification accuracy. The network that exceeds the performance of other approaches in terms of accuracy (around 98.75%) is VGG19. On the other hand, MobileNet-v2 outperforms the other strategies in terms of specificity and sensitivity (around 97.09% and 99.10%, respectively).
The problem of limited COVID-19 test kits available in public hospitals was handled by the authors in [11]. They advise using an automated detection system as a second quick diagnosis option to stop COVID-19 from spreading and putting a strain on medical facilities. The author developed three CNN-based models (ResNetV2, InceptionV3, and Inception-ResNetV2) that used 100 chest X-ray images to detect patients afflicted with coronavirus pneumonia (50 COVID-19 images and 50 health images). It can be noted that the pre-trained ResNet50 model achieves 98% accuracy when compared to the other two suggested models because of the high-performance outcomes achieved (Inception-ResNetV2 attained an accuracy of 87%, and InceptionV3 attained an accuracy of 97%).
Authors in [12] proposed a model that uses raw radiography images to automatically diagnose COVID-19 to overcome the absence of expert doctors in distant regions and to detect COVID-19 cases reliably. The DarkNet model, which comprises 17 convolutional layers, is used as the classifier for the real-time object detection system. At each layer’s level, the writers use various filters. This algorithm aims to provide an accurate diagnosis for both multi-class (COVID/Pneumonia/Normal) and two-class (COVID/Normal) classifications. The multi-classification accuracy is 87.2%, while the binary classification accuracy is 98.8%.
The authors of [13] suggested using X-ray images to detect patients with COVID-19 infections using an approach based on a support vector machine (SVM) and in-depth features. They employed SVM-based classifiers instead of deep learning to classify the data. The CNN model’s fully linked layers are used to retrieve the in-depth features. After that, they classify them using SVM. SVM is used to categorize coronavirus-infected X-ray images. COVID-19, pneumonia, and normal X-ray images are among the X-ray images used in the procedure. By combining the deep functionalities of 13 distinct CNN models, the author used SVM to identify COVID-19. SVM can achieve the most satisfactory results by utilizing ResNet50’s advanced capabilities. SVM and ResNet50 had the highest accuracy (98.66%). In [14], the authors present COVID-Net, a CNN model, for detecting coronavirus cases from chest X-rays. The author employed the dataset of chest X-ray images, which only had 76 COVID-19 cases, 5526 pneumonia cases, and 8066 normal cases. The COVID-Net uses the design pattern, which is a projection of lightweight residual. A good balance is obtained between computing effort, accuracy, and complexity by attaining 2.26 billion MAC operations with a test accuracy of 92.4%.
More studies have identified COVID-19 using CT scans rather than chest X-ray images. The CT imaging properties of this novel virus, for example, are different from those of existing kinds of viral pneumonia, according to the authors of [15]. They categorize computed tomography images using multiple CNN models, determine the likelihood of COVID-19 infection, and help in COVID-19 early detection. They collected 618 CT scans, including 219 COVID-19 infected cases, 224 influenza A virus pneumonia CT cases, and 175 healthy cases. They segment numerous potential image cubes using a 3D CNN model based on the traditional ResNet-18 network topology. All image blocks are classified by authors using a 3D image classification model. The goal of this classification model is to figure out how plaques on lung images are related to each other. They also employ Noisy or Bayesian methods to determine the infection (Normal, influenza viral pneumonia, or COVID-19) and the overall confidence score of CT cases. For the three groups, the suggested model achieved a classification accuracy of 86.7%.
Authors in [16] proposed using a deep learning system (VB Net) to automate the segmentation and classification of COVID-19 infected regions in CT images. V-Net and bottleneck models are combined in the “VB Net” model. VNet extracts global image features by down-sampling and convolution, whereas the bottleneck model merges fine-grained image information through up-sampling and convolution. The system was trained with data from 249 COVID-19 patients and then validated in 300 fresh COVID 19 patients. The author presented a technique, which attempts to create training samples iteratively, to speed up the time-consuming process of delivering COVID-19 CT images for training. The suggested manual loop technique cuts the drawing time to 4 min after three rounds of the model update. In the complete 300 verification set, the Dice correspondence coefficient is utilized to measure the deep learning model’s subdivision accuracy, which is 91.6%.
Fig. 2 presents the architecture of the proposed approach for classifying COVID-19 cases. In this architecture, the images in the dataset are augmented to increase the number of samples and to boost the performance of the proposed approach. In addition, a set of preprocessing steps is applied to the augmented dataset, including image segmentation and resizing the resulting image to fit the input to the feature extraction module. In addition, the feature extraction process is performed using transfer learning to extract the features of the input image based on three deep learning feature extractors, namely, VGG16, ResNet50, and InceptionV3. On the other hand, we propose a new optimization algorithm for feature selection and for optimizing the parameters of the adopted classifier. The proposed algorithm is a hybrid of two powerful optimization algorithms, namely, dipper throated optimizer (DTO) and particle swarm optimizer (PSO). The proposed algorithm is referred to as DTPSO in this text. The binary version of this algorithm is used in selecting the significant features from the extracted features, and the continuous version of the optimizer is used to train the neural network (NN) classifier. In this section, the main steps in the proposed architecture are presented and discussed.
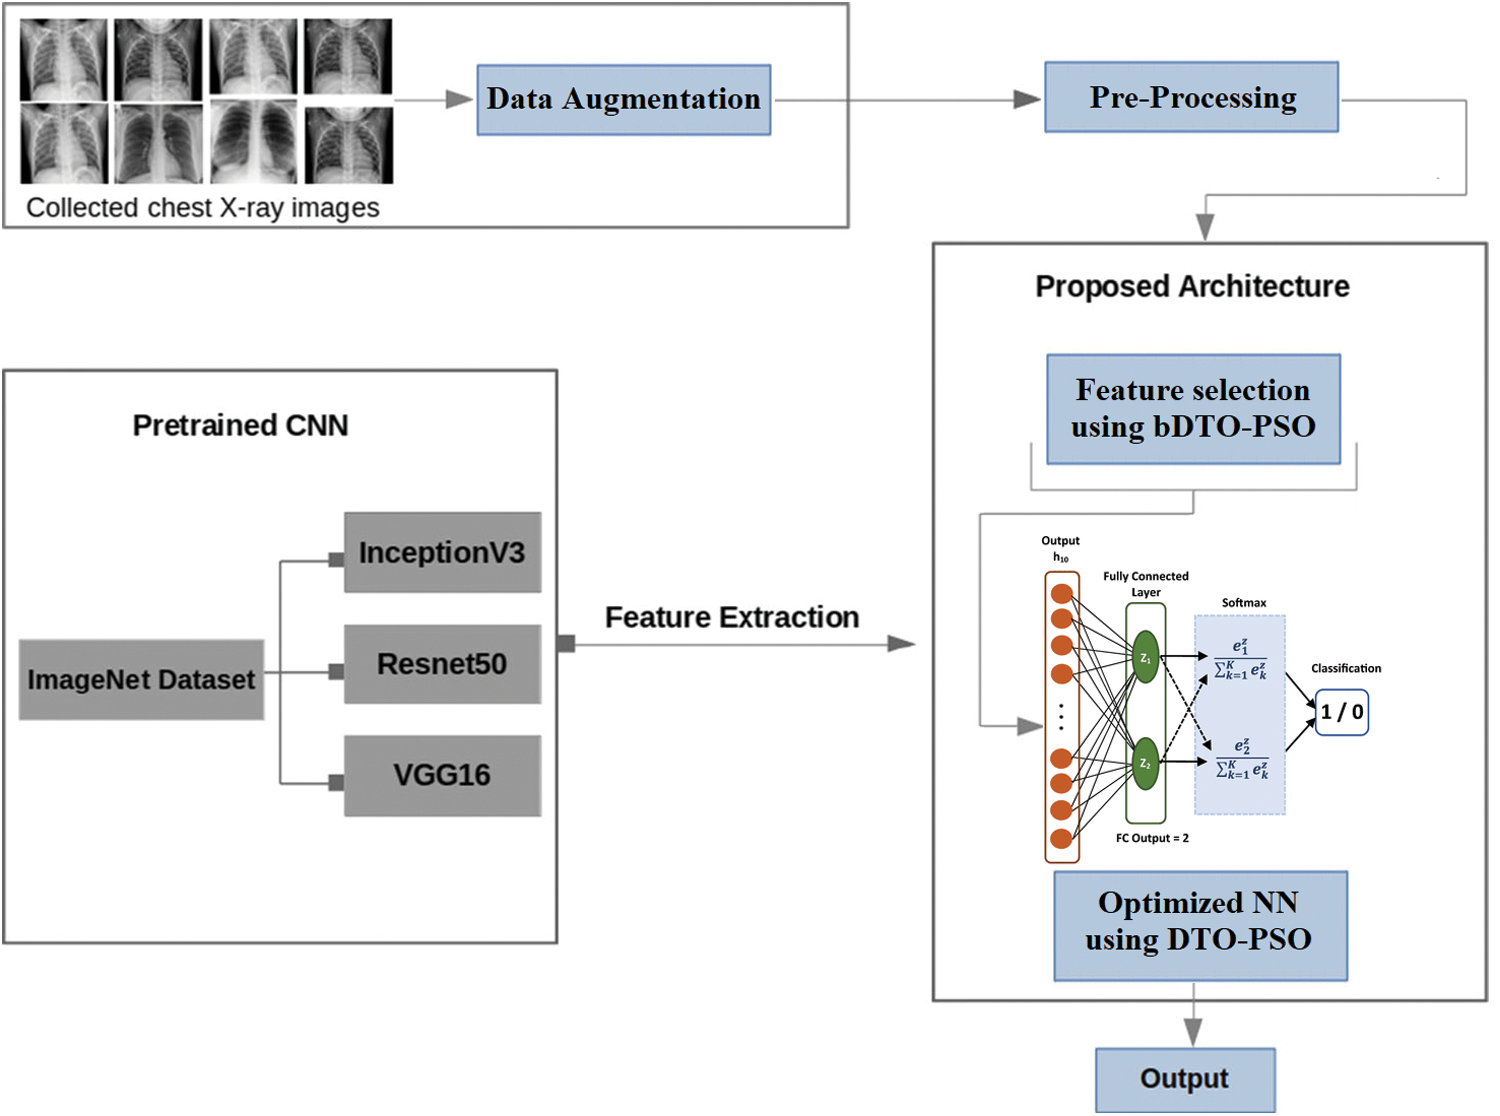
Figure 2: The architecture of the proposed approach
The employed dataset of this work is collected by various researchers from Qatar University, Doha, Qatar, and the University of Dhaka, Bangladesh, along with a team of doctors. The dataset comprises chest X-ray images of covid19 positive patients, along with normal cases. The total number of images is 2850. Out of which 1468 images are positive COVID-19 cases, and 1382 are normal cases. To boost the performance of the proposed model, this dataset is augmented by randomly applying various transformation operations. The size of the dataset after augmentation is 8550 images. Fig. 3 shows sample images from the dataset for normal and COVID-19 cases.
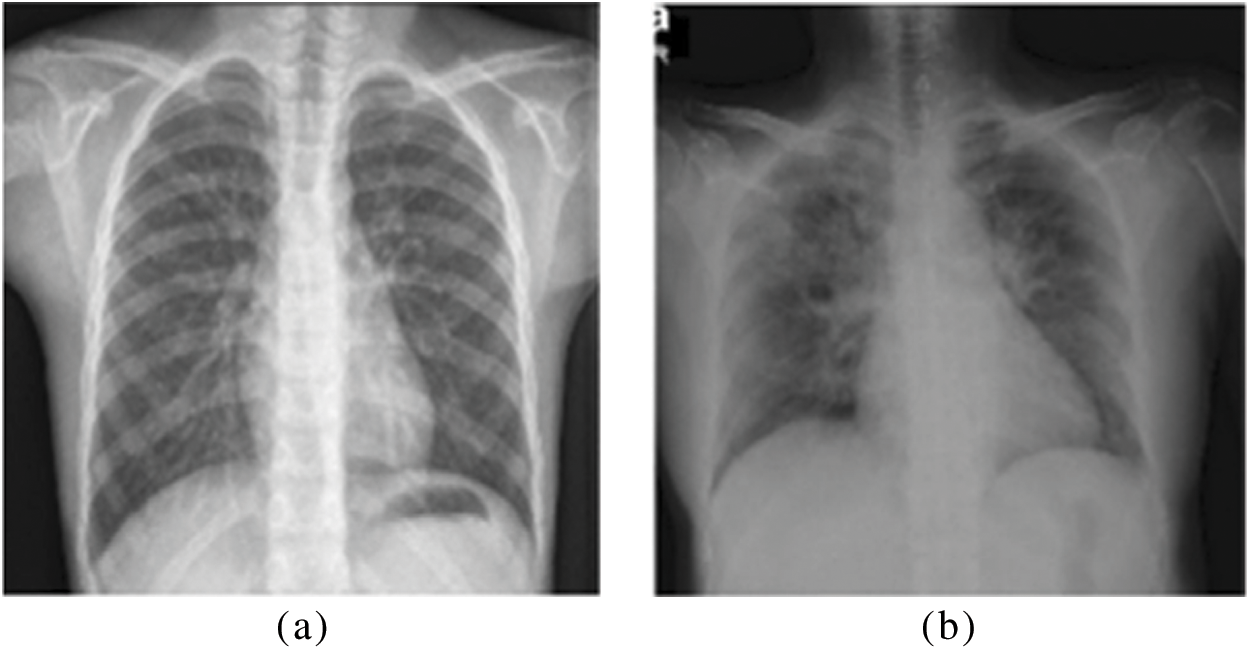
Figure 3: Sample CXR images in the dataset (a) Normal image (b) Covid19 Image
To train deep learning models, an extensive database is needed, and this is a problem with the medical image datasets. To cope with this problem, data augmentation is employed to expand the size of the X-ray image datasets used during training. There are several benefits to data augmentation, including solving overfitting issues and increasing the DCNN model’s scalability. Rotating each detected patch with angles (0°, 90°, 180°, and 270°), then flipping these four images from left to right to obtain eight images for each patch, as illustrated in Fig. 4, was used in this study.
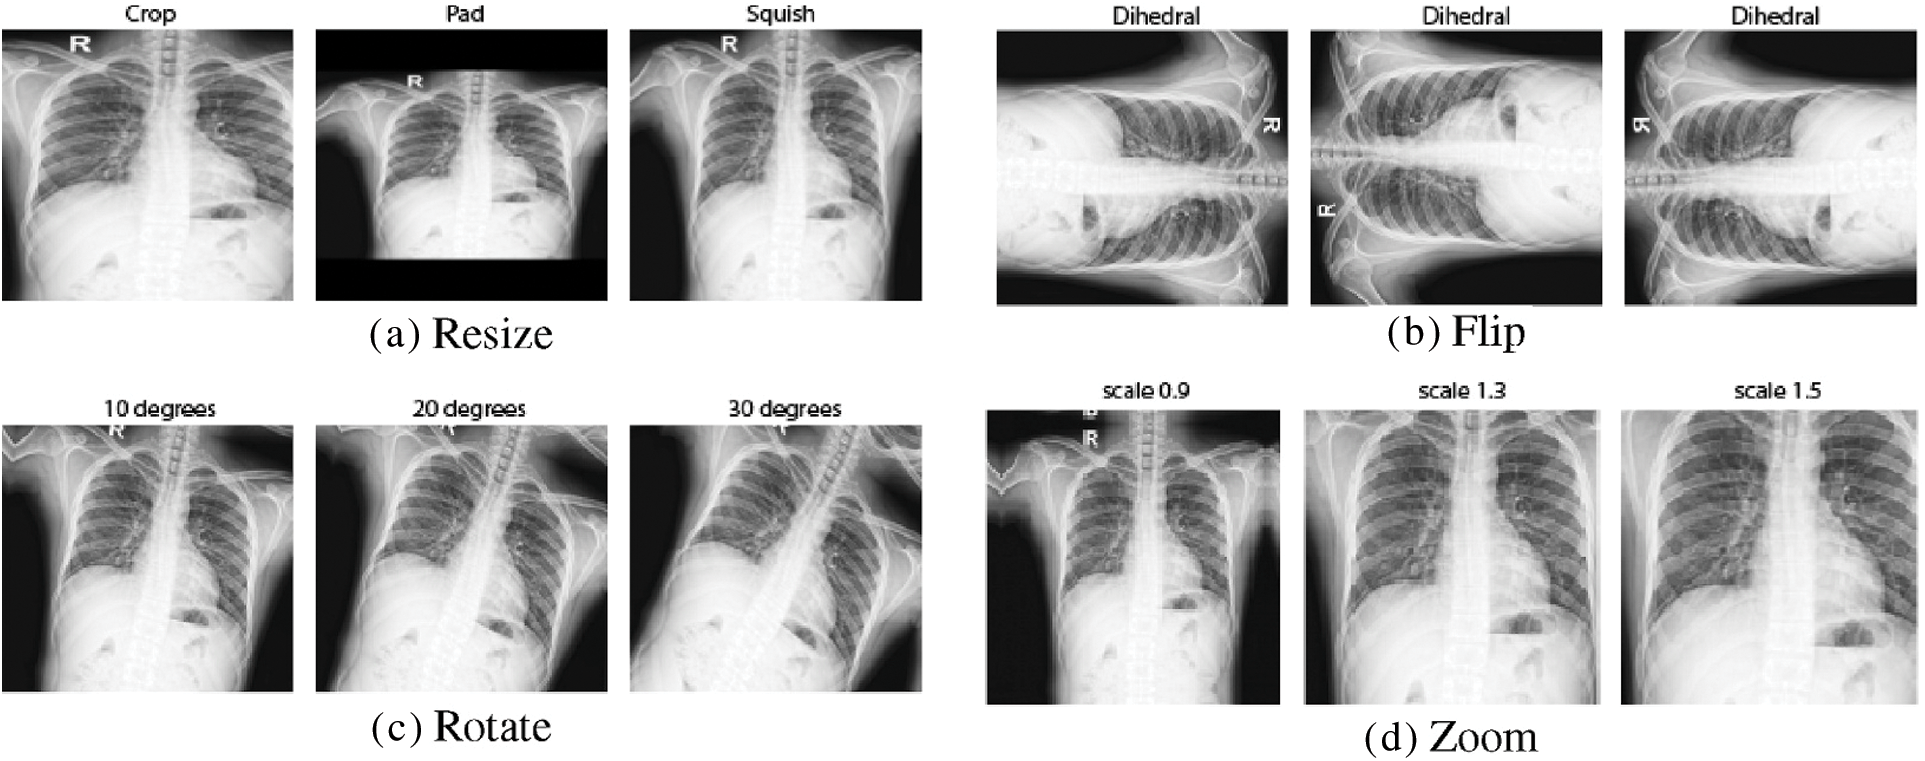
Figure 4: Visualizing the effects of data augmentation on CXR images
3.3 Lung Segmentation Algorithm
An important step in pre-processing CXR images for better classification is the segmentation step. The segmentation algorithm presented in [17] is used to extract lung parts from CXR images in both COVID-19 and normal cases. The applied algorithm is based on a data imputation encoder and a U-net segmentation network. In this algorithm, the variational encoder is used four 1-D convolutional layers to transform 2-D features. Fig. 5 shows the results of the segmentation algorithm.
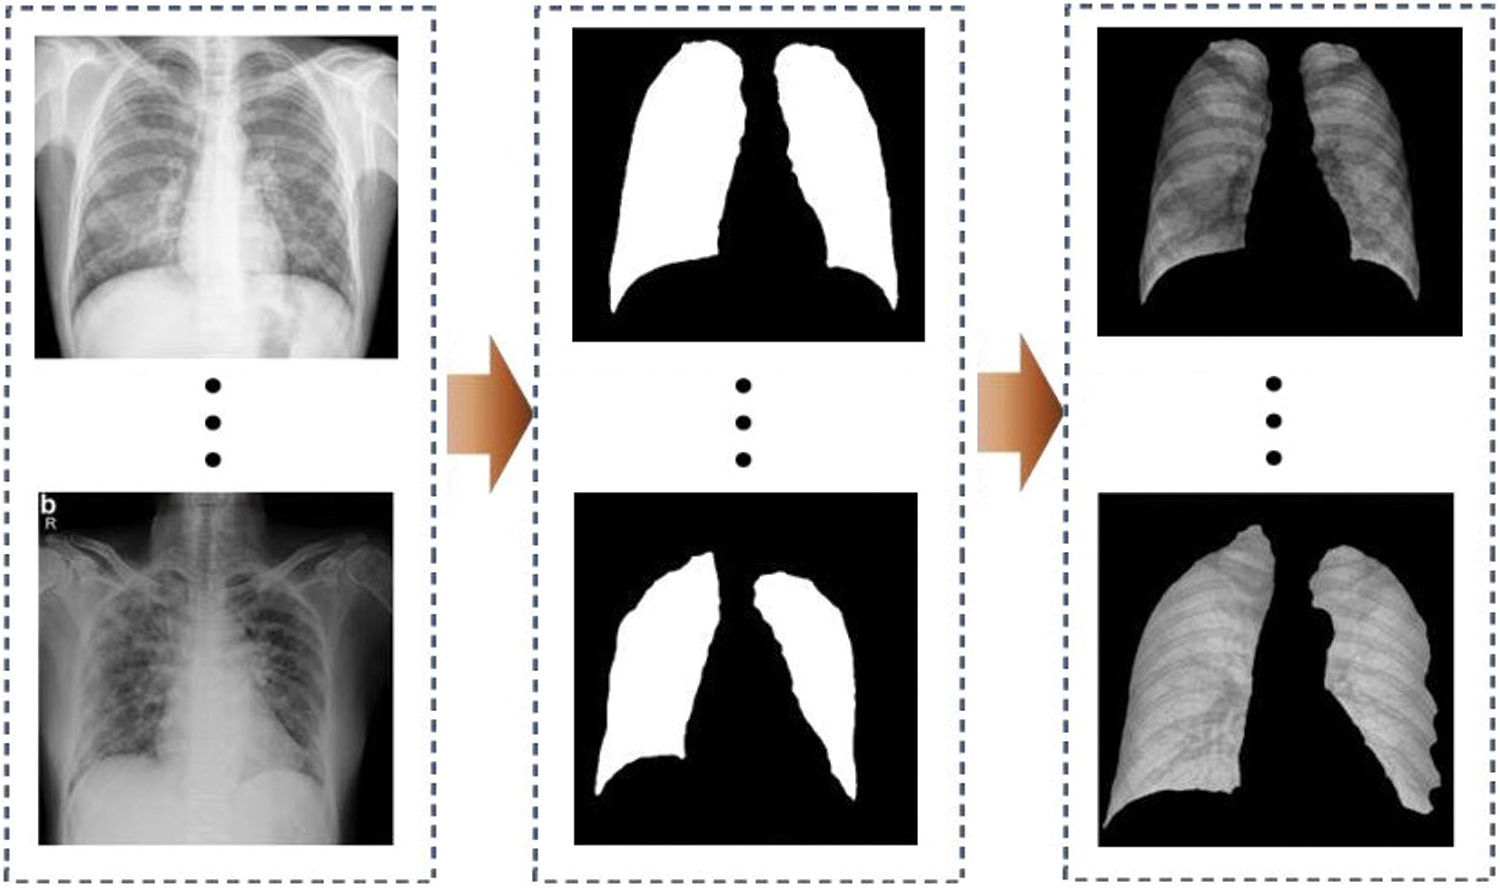
Figure 5: The result of the segmentation of CXR images
The segmented lung images are input into three types of deep networks trained and evaluated using transfer learning to generate a collection of deep characteristics. VGG16, ResNet-50, and InceptionV3 are the deep networks in question. The target features are taken from the model’s final pooling layer that produces the most significant results. The extracted feature set, on the other hand, may comprise characteristics that, owing to their strong correlation, may have a detrimental impact on classification performance. These features are unnecessary in this scenario and should be disregarded. The feature selection technique is used to maintain just the most relevant features that have a substantial impact on the classification results to eliminate these redundant features. The VGG16 deep network model performed best for the dataset set used in this study, and as a result, this model is used for feature extraction.
3.5 Dipper Throated Optimization Algorithm
The Dipper Throated bird, renowned for its bobbing or dipping motions while perched, belongs to the Cinclidsae family of birds. The ability of a bird to dive, swim, and hunt beneath the surface sets it apart from other passerines. It can fly straight and rapidly with no stops or glides because of its small flexible wings. The Dipper Throated bird has a distinct hunting style, quick bowing motions and a white breast. It rushes headlong into the water to get its prey, regardless of how turbulent or fast-flowing it is. As it descends and picks up pebbles and stones, aquatic invertebrates, aquatic insects, and tiny fish perish. The great white shark uses its hands to move on the ocean floor. By bending your body at an angle and traveling down the bottom of the water with your head lowered, you might be able to locate prey. It can also dive into the water and submerge itself, using its wings to propel itself through the water and stay submerged for an extended period. The Dipper-Throated Optimization (DTO) method assumes that a flock of birds is swimming and looking for food. The following matrices can represent the location (P) and velocities (V) of the birds. As previously indicated, the binary DTO is used to choose features. The continuous DTO, on the other hand, is used to improve the parameters of the classification neural network.
where the
where each bird’s quest for food is reflected in its fitness score, the mother bird is the superior value. Sorting is done by ascending the values.
where i is the iteration number in which
3.6 Particle Swarm Optimization
In particle swarm optimization (PSO), possible solutions, termed particles, are flown in the search space for problems, mimicking the intelligence of bird swarms in nature. The velocity of a particle is the rate at which it changes location. The particles’ positions alter throughout time. A particle’s velocity is stochastically accelerated to its prior best location throughout the flight. To update it to a neighborhood best solution, the following equations are utilized. The location vector
where
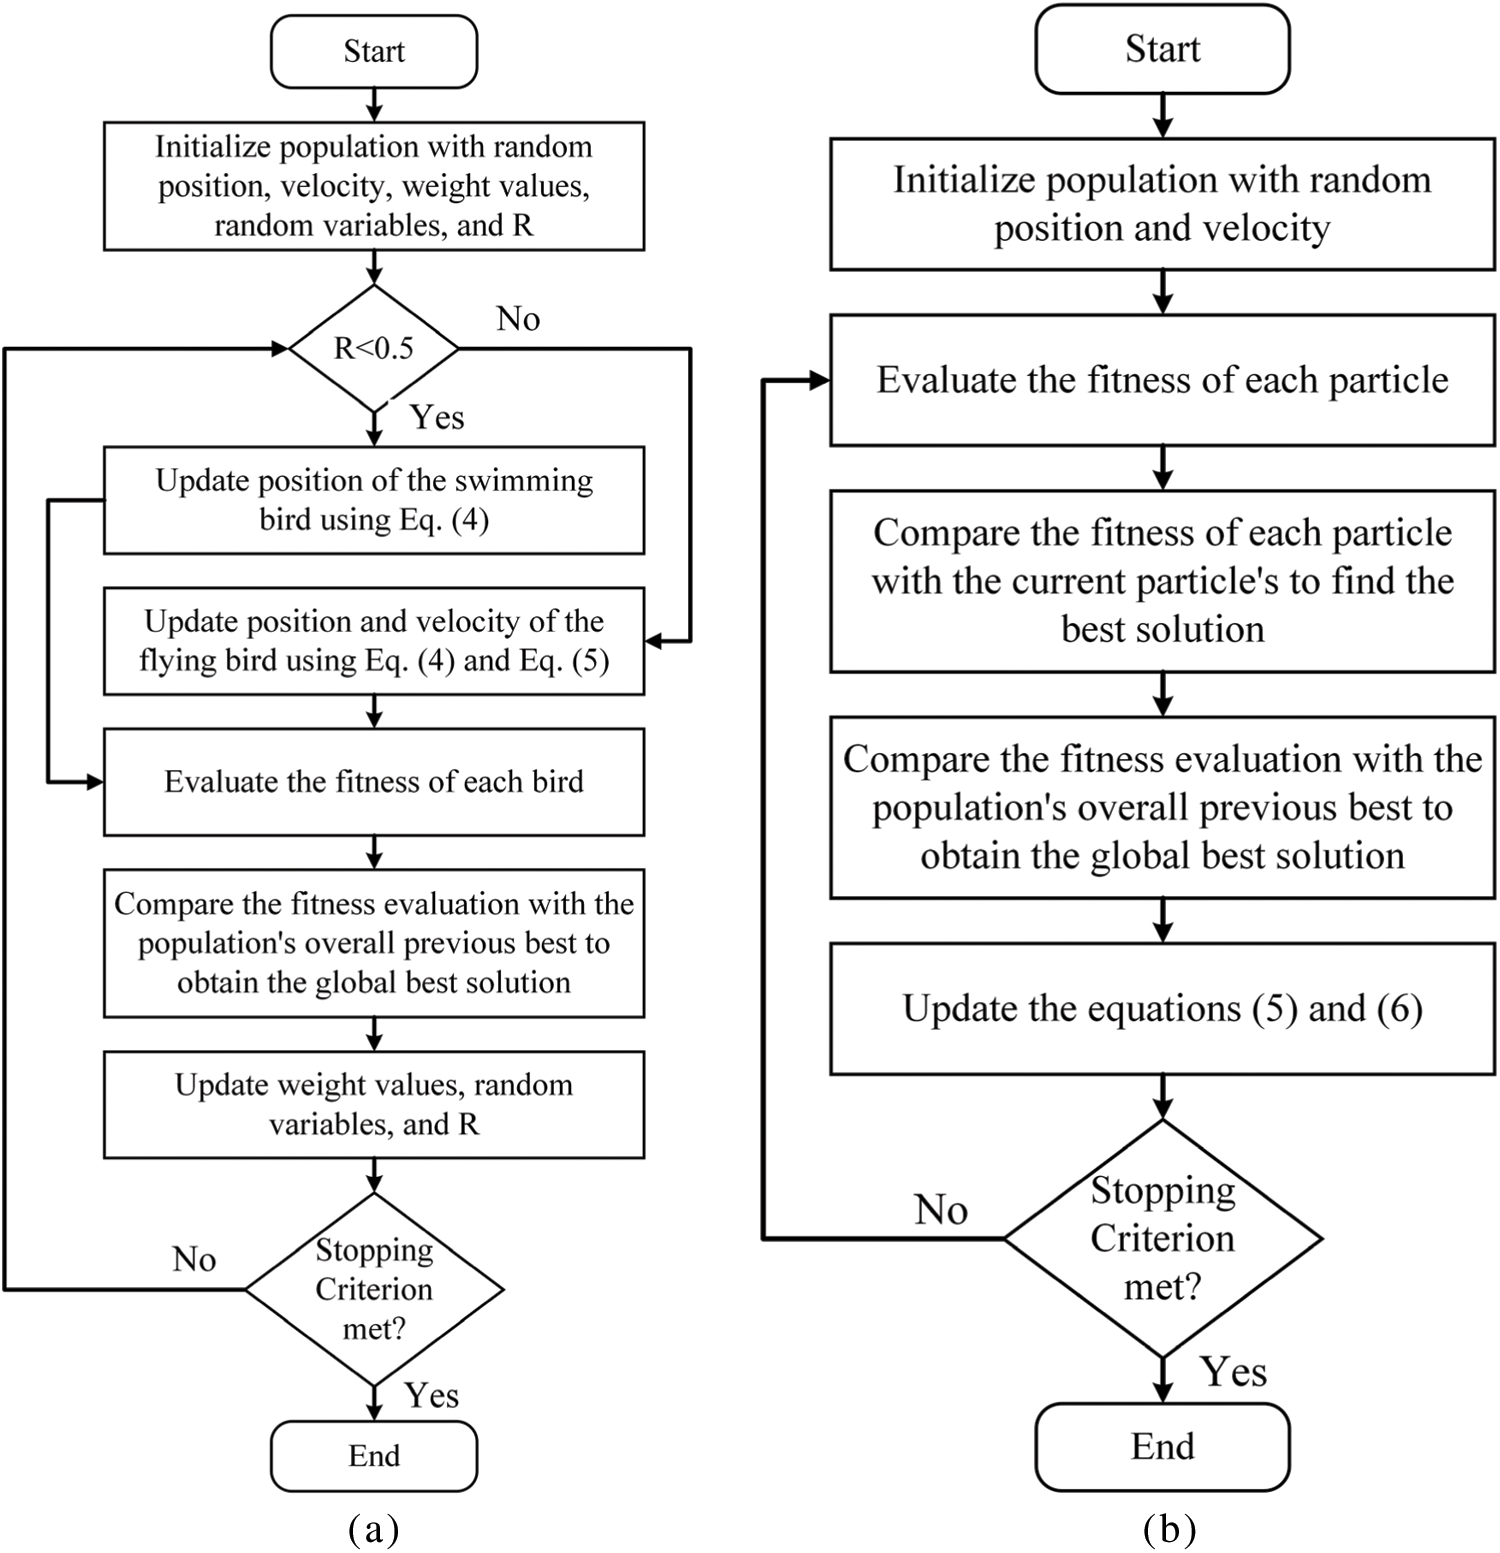
Figure 6: The process of two optimization algorithms; (a) DTO algorithm, (b) PSO algorithm
Finding global optima is a difficult target to find. For the suggested method, two efficient methods are described. The PSO is the first algorithm in which individuals are moved based on their local and global optimal placements. The position of the best global individual refers to the best position found by the whole population, whereas the local best position refers to an individual’s best position thus far. Individuals in PSO can converge on their global goals thanks to this social behavior. Nature’s flock of birds and fish school has an impact on their behavior. We chose PSO for our proposed hybrid optimizer due to its simplicity, dependability, and strength. In the proposed hybrid approach, the second optimizer is DTO, a swarm-based meta-heuristic optimizer that mimics the social hierarchy and foraging behavior of dipper throated birds. The position and velocity of the bird agents affect how individuals travel in the DTO. In the proposed hybrid optimizer, the optimization process starts with a group of random individuals. Candidate solutions to the problem being solved have been suppressed by such individuals. For the initial solution and at each iteration, the fitness function is computed for all individuals. As previously mentioned, two groups represent the population, the first of which follows the PSO method and the second of which follows the DTO process. Consequently, the search space is thoroughly examined for potential spots, then exploited utilizing the strong DTO and PSO algorithms. The steps of the proposed DTPSO algorithm pseudo-code are shown in Fig. 7.
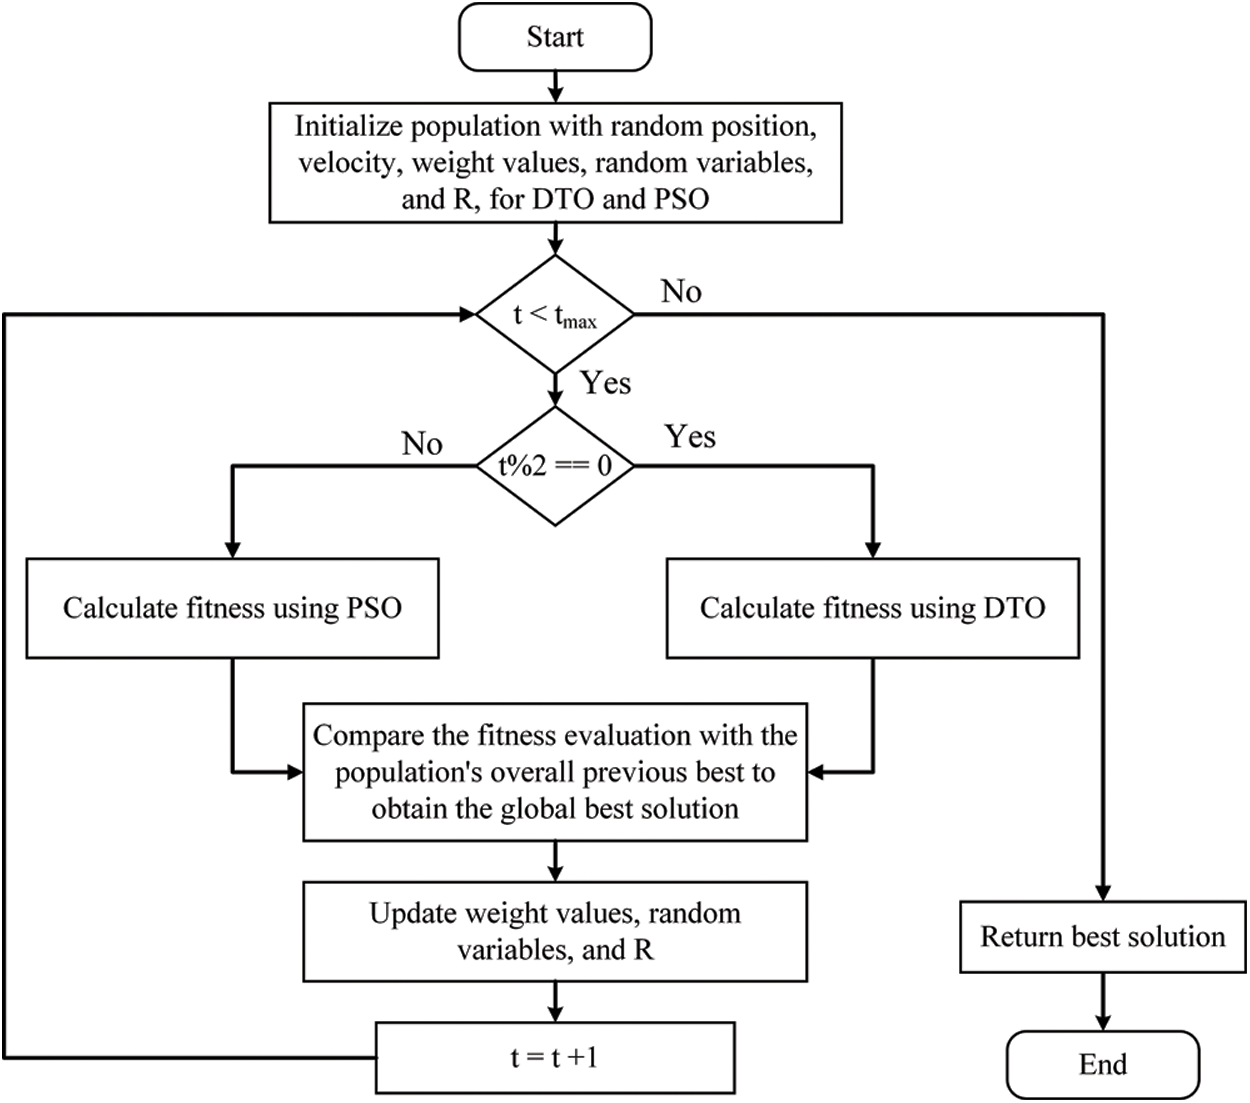
Figure 7: The proposed hybrid DTPSO algorithm
3.8 DTPSO for Feature Selection
Because the search space is confined to two binary values, 0 and 1, the difficulty with feature selection is unique. As a result, we employed sigmoid function to convert the standard optimizer’ output so that it performs effectively for this task. In this section, we show how we used the proposed hybrid DTPSO to transform traditional optimizers output. We start with an initial random vector population to select features, then calculate the fitness function. Neural network (NN) has been used for training instances, and we explain how we used the DTPSO hybrid to features that are at the pick.
The continuous output of the proposed hybrid DTPSO is converted to binary using the following equations:
where
The quality of each hybrid DTPSO solution is assessed using a fitness function. The classification error rate and the number of specified characteristics influence the fitness function. If the solution picked a subset of characteristics that resulted in a reduced classification error rate and a lower number of selected features, it is regarded excellent. The following equation is used to determine the quality of each solution:
where
The conducted experiments are presented and discussed in this section. The first step after preprocessing the dataset is to segment the regions of interest to be considered for further processing. The results are then fed to the feature extraction and feature selection to select the most significant features for further processing and classification.
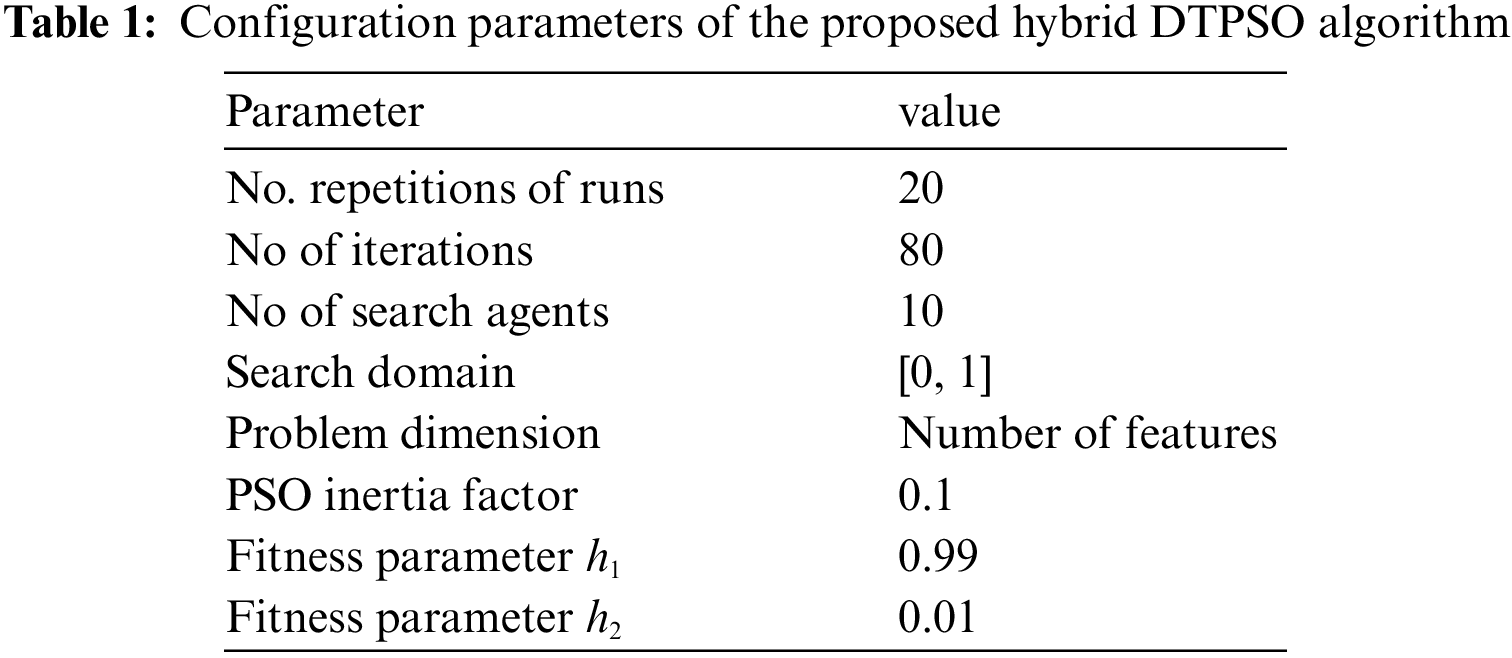
The employed dataset is split into three parts of equal sizes whose contents are selected randomly from the dataset; these parts are referred to as training, test, and validation sets. During the learning phase, the NN classifier is adopted to be trained using the proposed DTPSO algorithm for classifying the CXR images. The configuration parameters of the proposed algorithm are listed in Tab. 1.
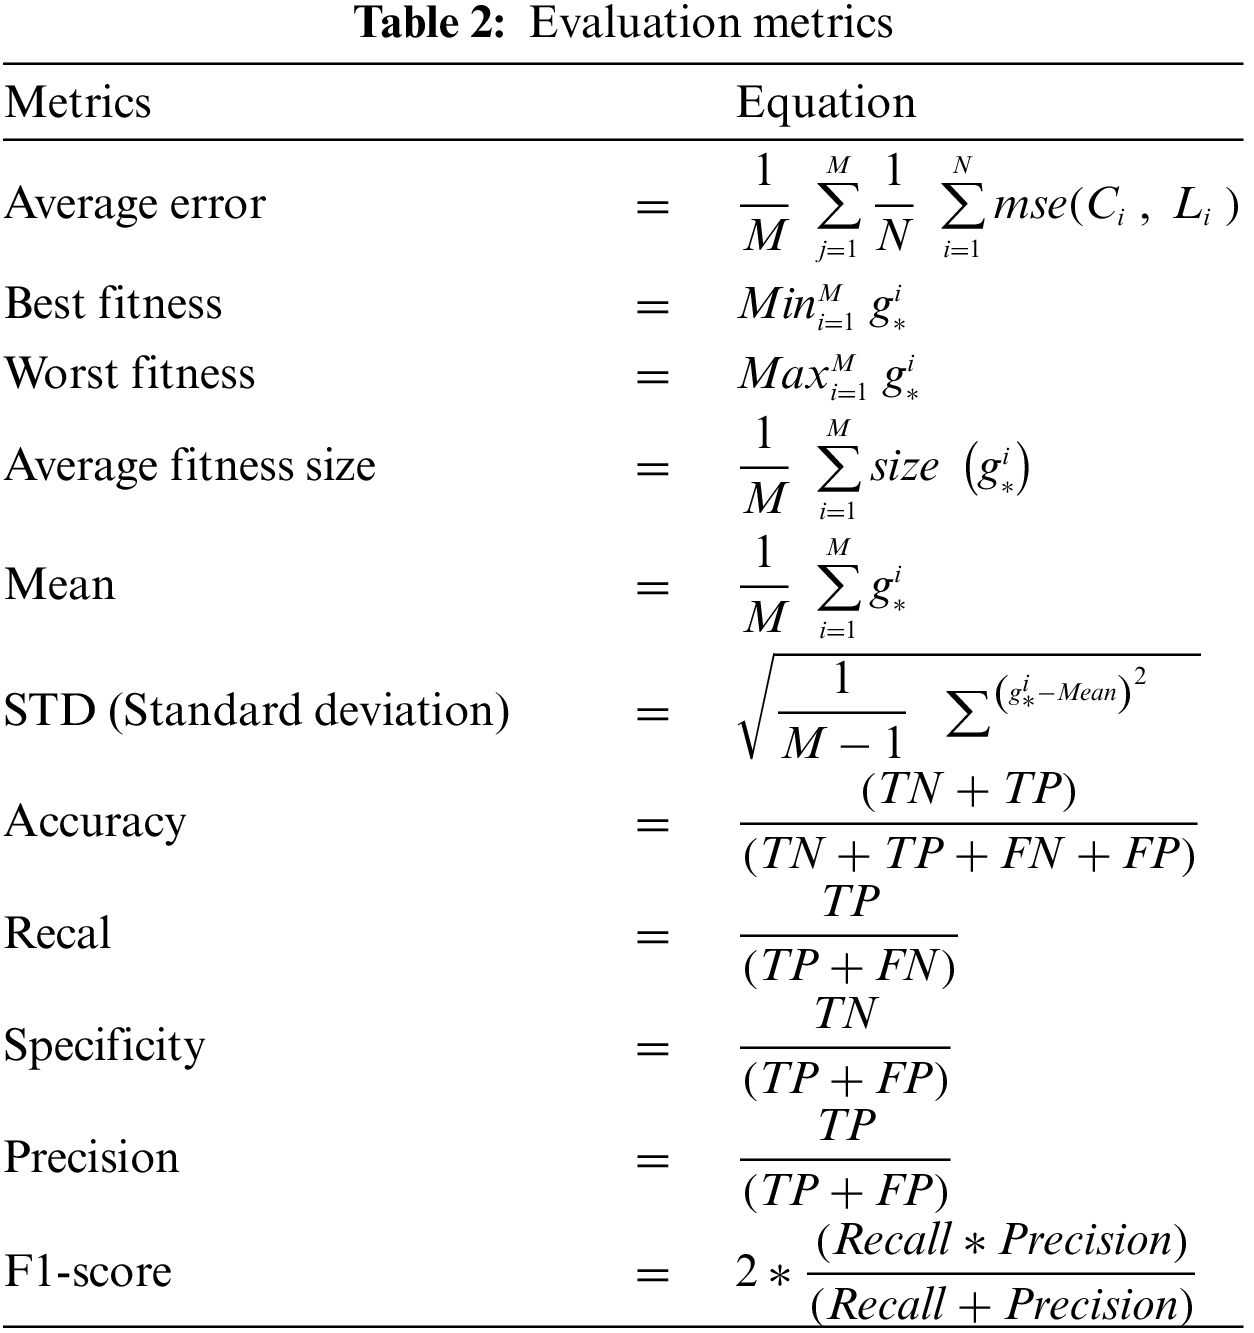
To evaluate the efficiency of the proposed algorithm, several experiments were conducted to assess its performance. The results of conducted experiments are assessed using the evaluation criteria presented in Tab. 2.
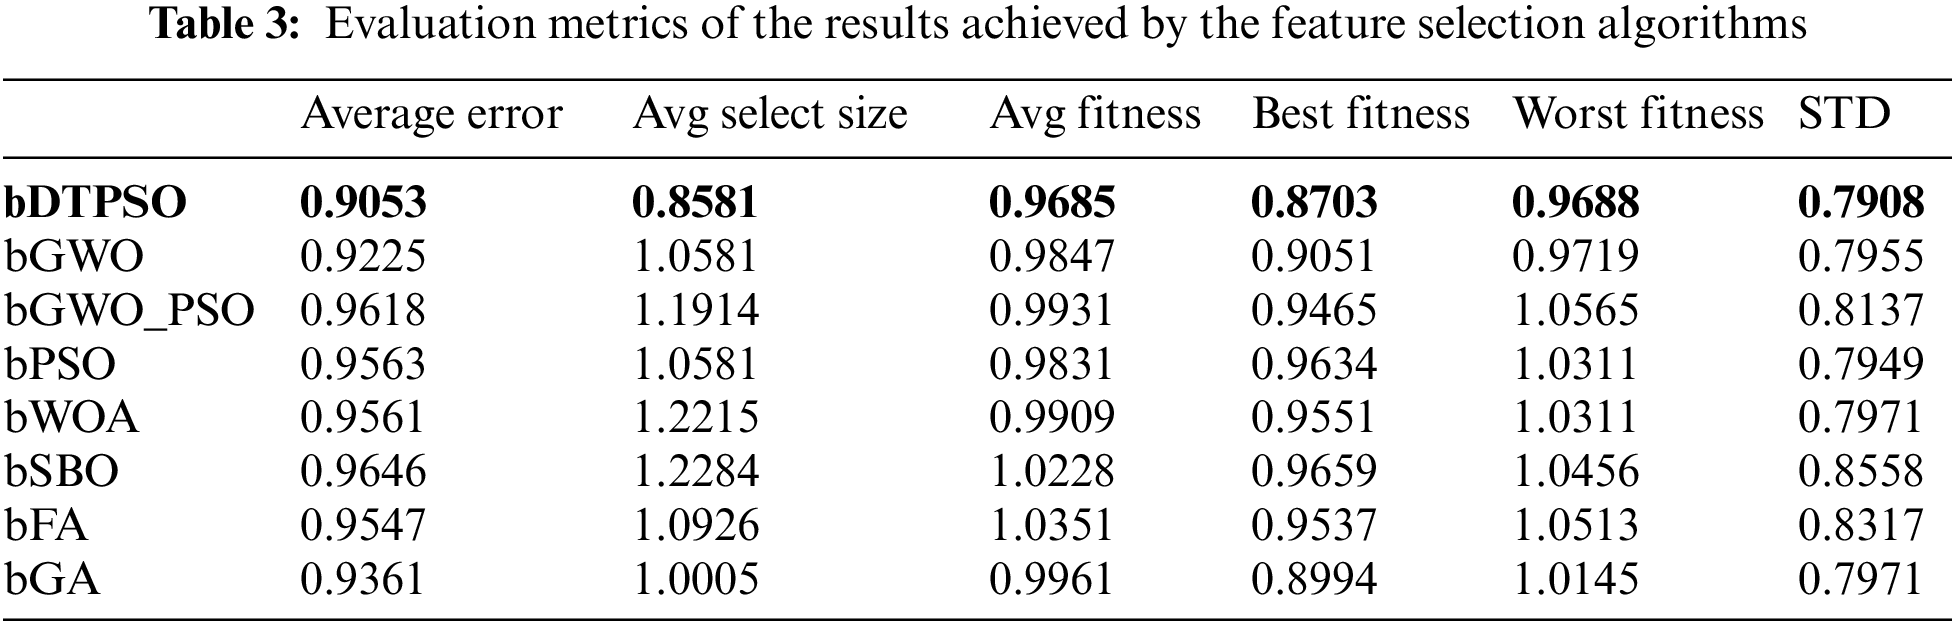
A set of seven feature selectors (namely, binary grey wolf optimizer (bGWO) [20], bGWO-PSO [21], bPSO [19], binary whale optimization algorithm (bWOA) [22], binary satin bowerbird optimizer (bSBO) [23], binary Firefly Algorithm (bFA) [24], and binary genetic algorithm (bGA) [25,26]) were applied to the same dataset to demonstrate the superiority of the suggested method, and the results were recorded. Tab. 3 shows the results of six assessment criteria based on the best features picked using the proposed algorithm (bDTPSO) and the other seven techniques, as well as the results of the different seven approaches. The suggested approach, as indicated in the table, may produce the lowest values among the reported results. Based on these findings, the proposed method determined superiority fitness for the COVID-19 problem’s feature selection task.
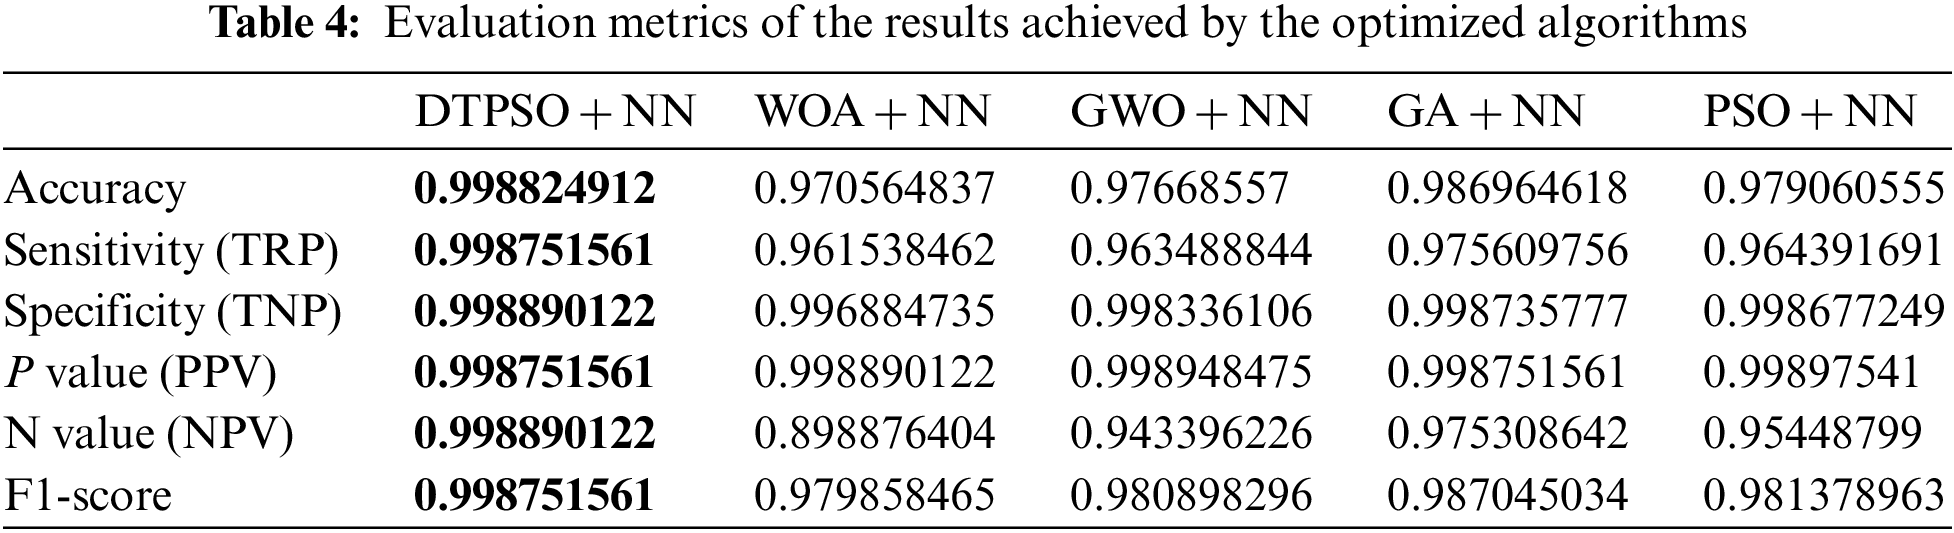
On the other hand, the proposed DTPSO algorithm is used to optimize the parameters of NN with the target of boosting the classification accuracy of COVID-19 cases. The results achieved by the proposed approach and other approaches based on optimizing NN using different optimizers are presented in Tab. 4. As shown in the table, it can be noted that the proposed approach could achieve the best accuracy (0.998824912) when compared to the other approaches. The results of the other evaluation criteria emphasize this finding.
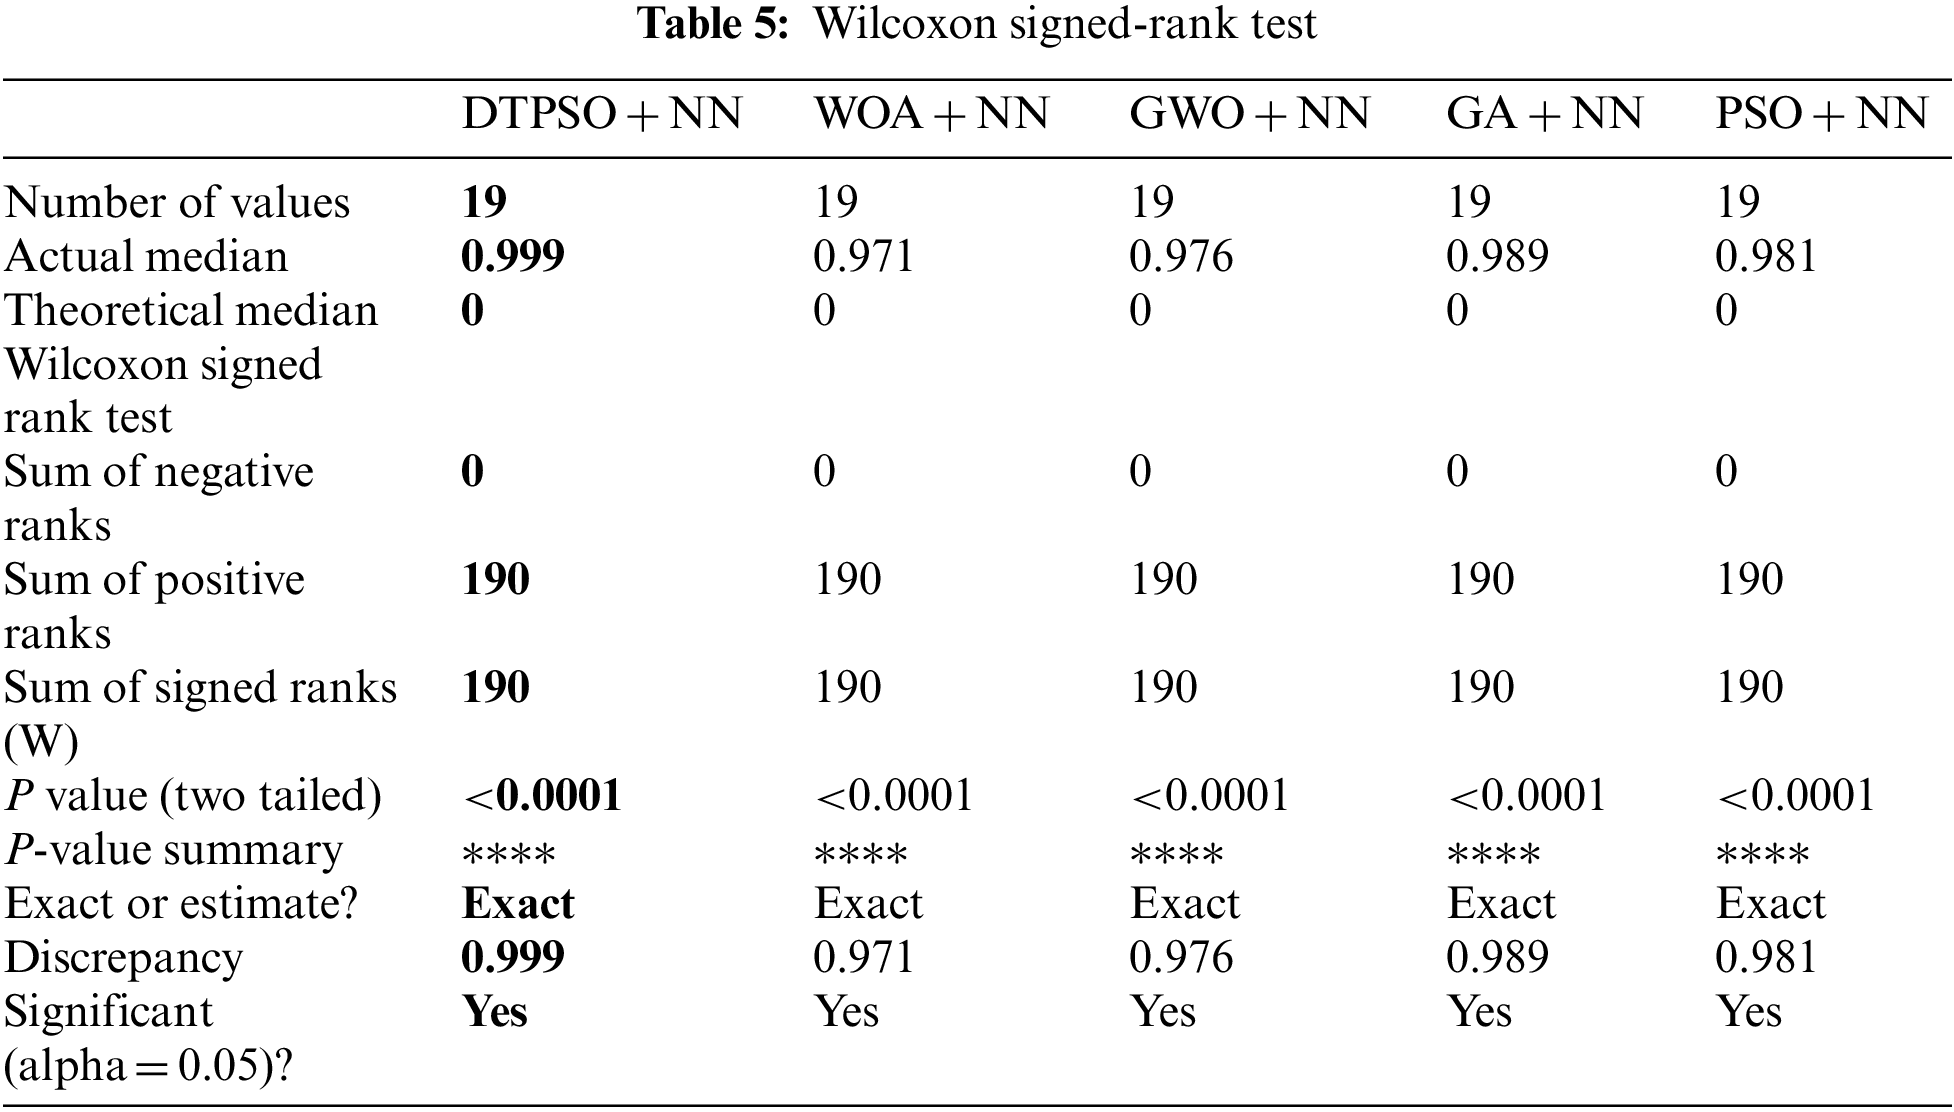
The p-values between the proposed DTPSO algorithm and the other competing algorithms are calculated using the statistical difference between every two algorithms to show that the suggested approach is significantly different. Wilcoxon’s rank-sum test is used to do this analysis. The null and alternative hypotheses are the two primary hypotheses in this test. μDTPSO + NN = μWOA + NN, μDTPSO + NN = μGWO + NN, μDTPSO + NN = μGA + NN, μDTPSO + NN = μPSO + NN for the null hypothesis represented by H0. The algorithms’ means are not comparable under the alternative hypothesis, H1. Tab. 5 shows the results of the Wilcoxon rank-sum test. The p-values between the proposed algorithm and the other algorithms are less than 0.05, as shown in the table, proving the superiority and statistical significance of the suggested DTPSO + NN technique.
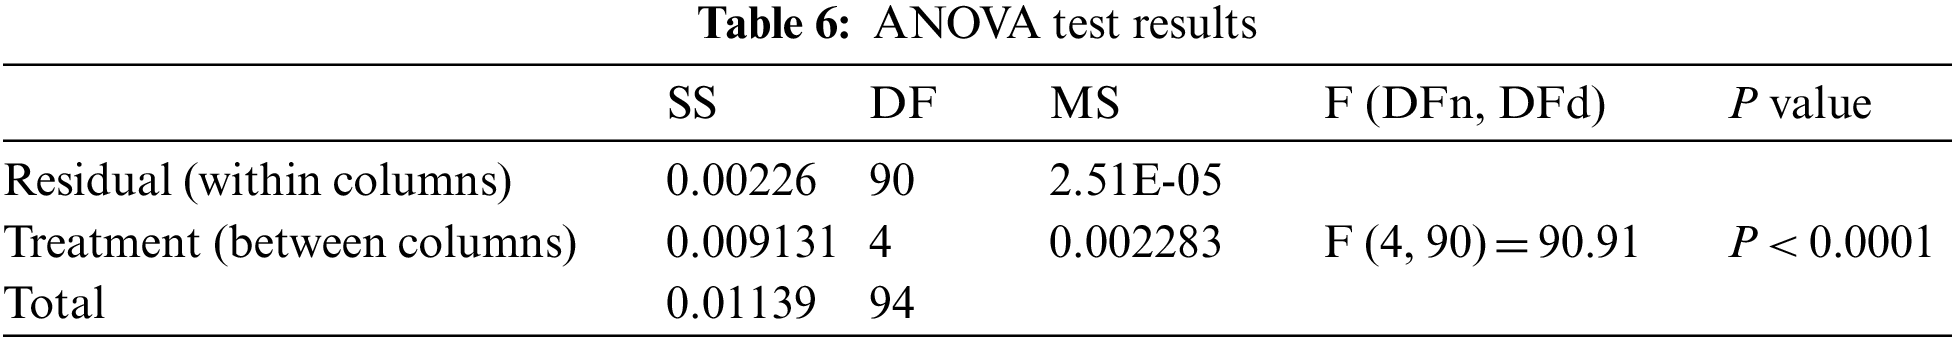
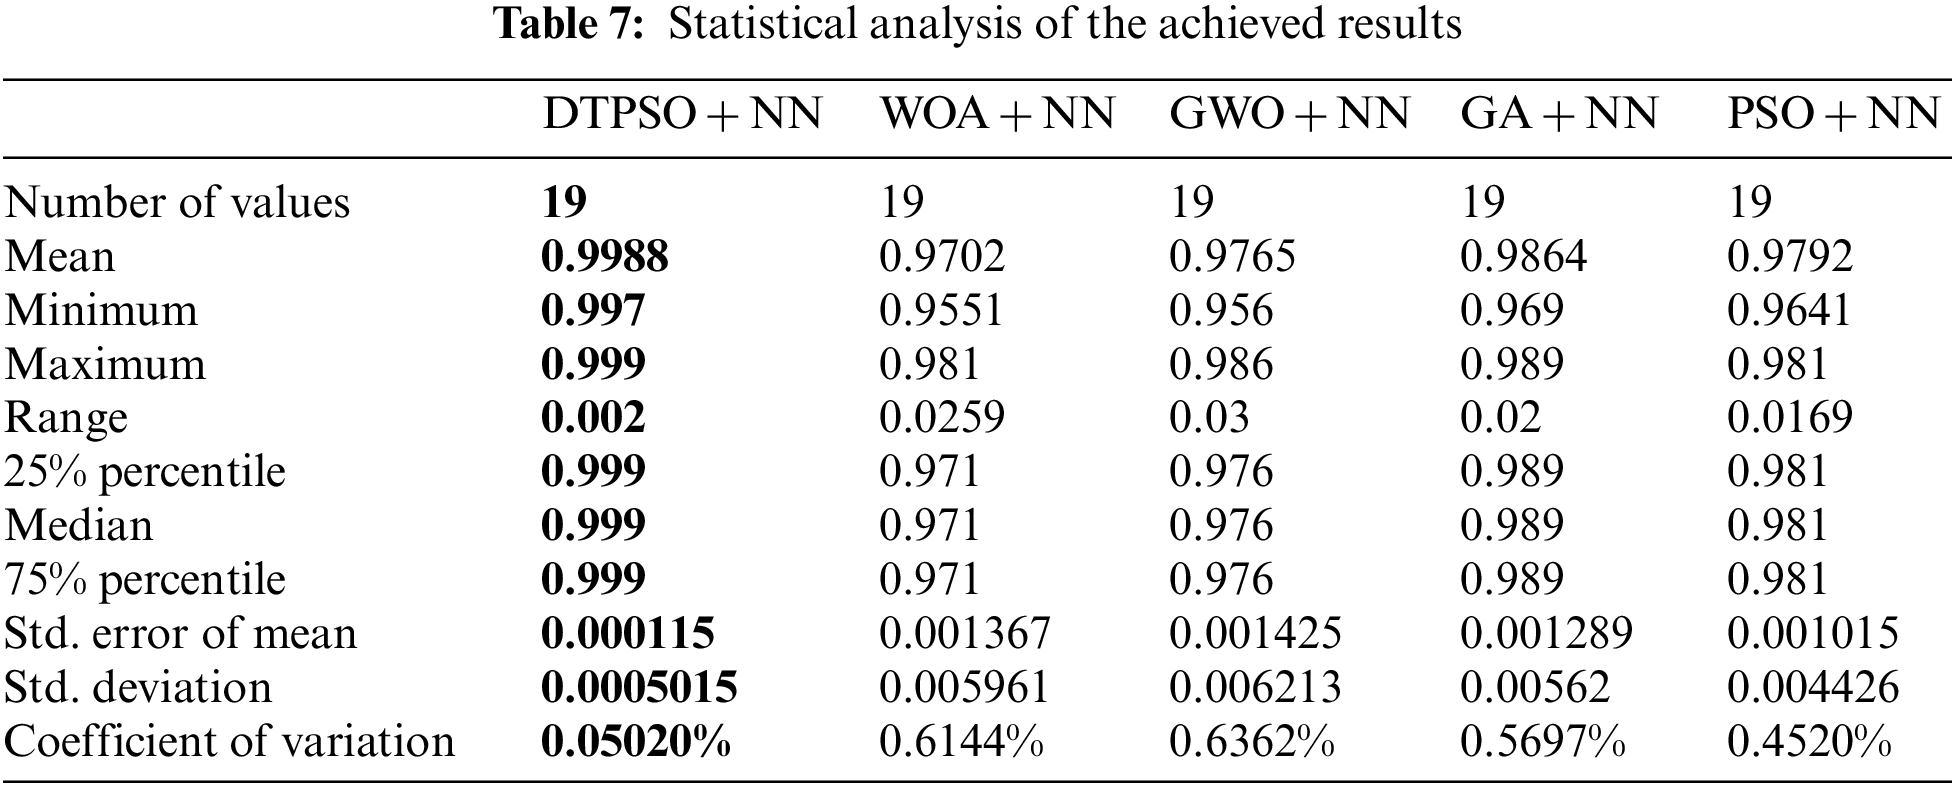
The statistical difference between the suggested DTPSO and the competing algorithm, on the other hand, is investigated. A one-way analysis of variance (ANOVA) test is used to carry out this analysis. The null and alternative hypotheses are the two primary hypotheses in this test. The mean values of the algorithm are made equal for the null hypothesis designated by H0 (i.e., DTPSO + NN = WOA + NN = GWO + NN = GA + NN = PSO + NN). The algorithms’ means are not comparable under the alternative hypothesis, H1. Tab. 6 contains the findings of the ANOVA test. When the suggested algorithm is compared to other optimization approaches, the predicted efficacy is validated, as shown in the Tab. 7 also includes a statistical analysis of the outcomes.
A visual representation of the achieved results using the proposed approach is shown in Fig. 8. The first two plots represent the residual and QQ plots. As shown in these plots, the residual error falls in the range of −0.02 and 0.01, which reflects the effectiveness of the proposed approach. In addition, the QQ plot shows that the predicted results match the actual values, which emphasizes the superiority of the proposed approach.
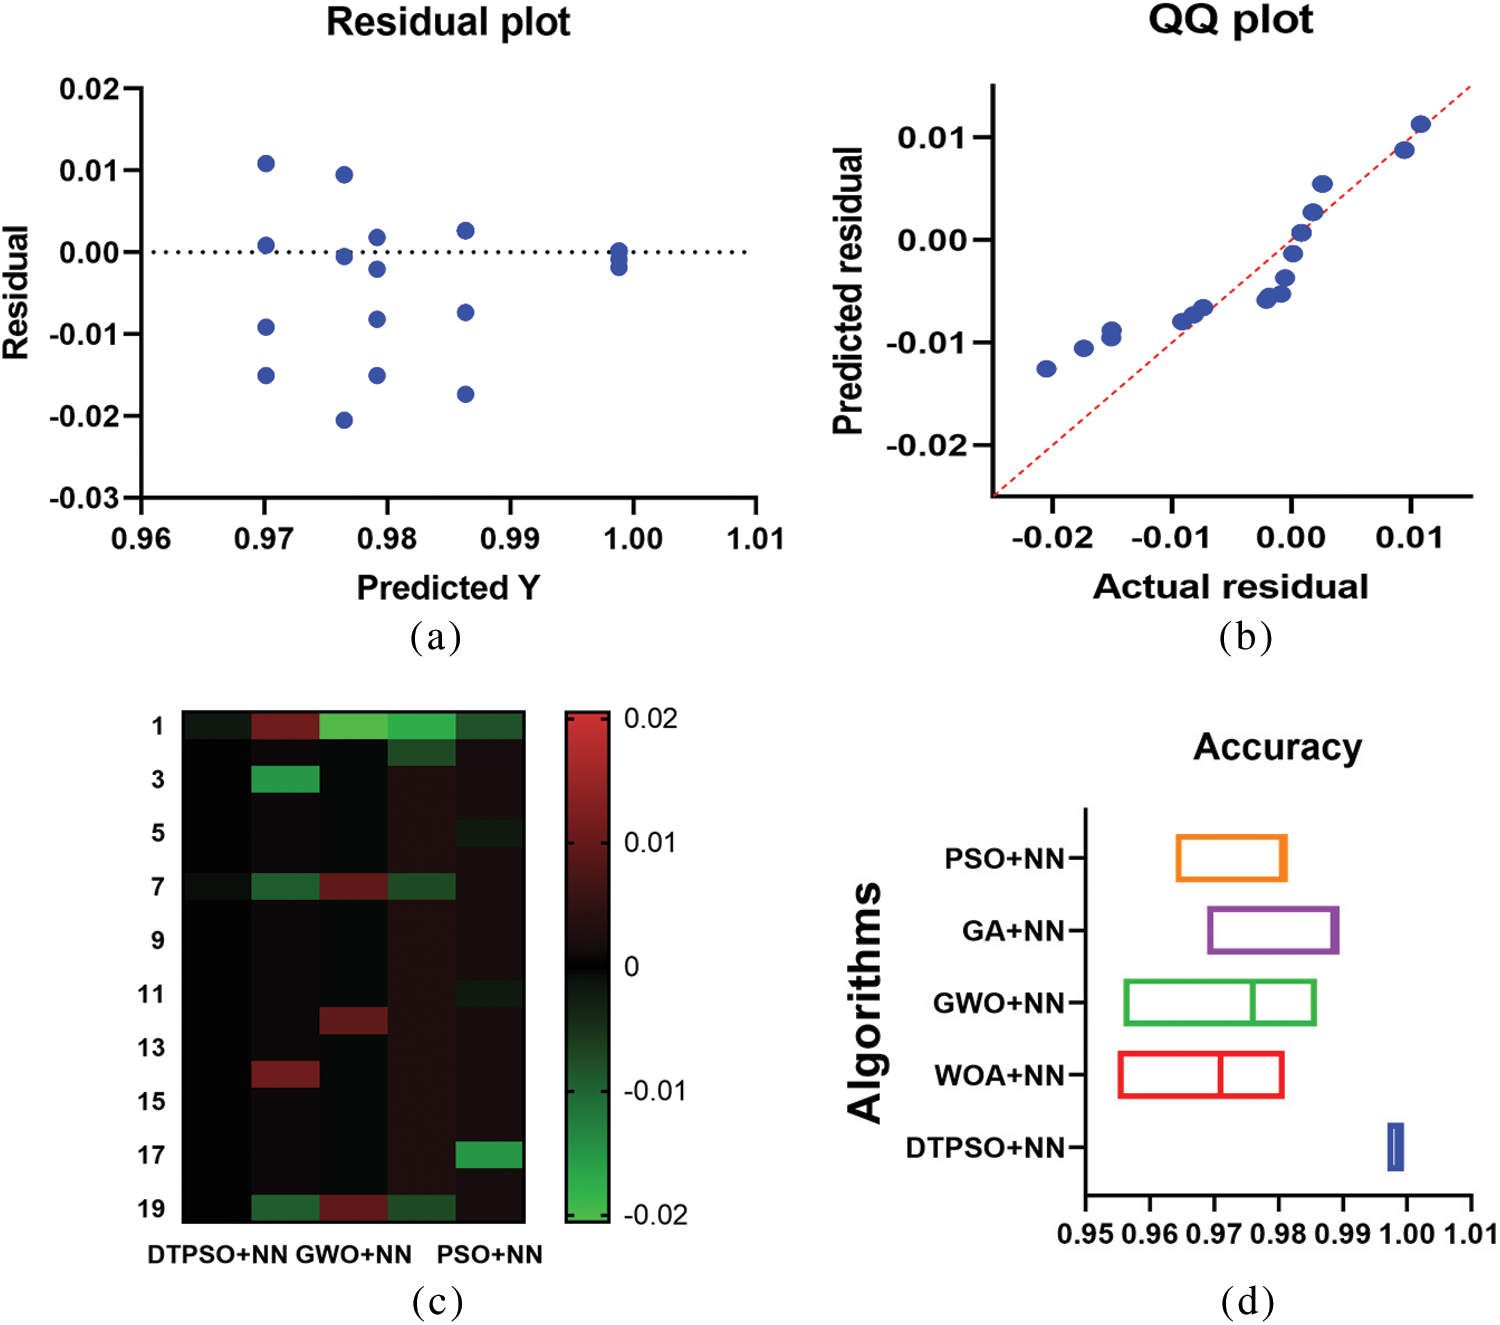
Figure 8: Visual representation of the achieved results using the proposed approach
In this paper, we proposed a hybrid DTPSO optimizer utilized in conjunction with the NN classifier to choose the best subset of features for the COVID-19 classification problem. We employed DTO in the hybrid optimizer to enhance and accomplish greater quest space exploration for longer iterations, achieving a balance between exploitation and exporting. The proposed approach is used to promote population diversity and maximize production efficiency, while the PSO method is used to explore for a more significant number of iterations. A COVID-19 dataset is used to compute the consistency of the proposed optimizer and guarantee that the suggested solution is dependable and stable, allowing the quality and efficacy of the proposed solution to be evaluated. The proposed approach could improve COVID-19 diagnosis by a substantial amount. We created a deep transfer learning system that analyzes chest X-ray images from patients with COVID-19 and patients who do not have COVID-19 to diagnose the sickness automatically. With the provided classification model, COVID-19 may be identified with higher than 99.88% accuracy. We intend to test the suggested approach on increasingly complicated datasets to see how it performs in the future. Also available will be a parallel form of the DTPSO model.
Acknowledgement: Princess Nourah bint Abdulrahman University Researchers Supporting Project Number (PNURSP2022R104), Princess Nourah bint Abdulrahman University, Riyadh, Saudi Arabia
Funding Statement: Princess Nourah bint Abdulrahman University Researchers Supporting Project Number (PNURSP2022R104), Princess Nourah bint Abdulrahman University, Riyadh, Saudi Arabia
Conflicts of Interest: The authors declare that they have no conflicts of interest to report regarding the present study.
1. A. Sittar, D. Major, C. Mello, D. Mladeniić and M. Grobelnik, “Political and economic patterns in COVID-19 news: From lockdown to vaccination,” IEEE Access, vol. 10, pp. 1–15, 2022. [Google Scholar]
2. A. Ali, Y. Zhu and M. Zakarya, “A data aggregation based approach to exploit dynamic spatio-temporal correlations for citywide crowd flows prediction in fog computing,” Multimedia Tools and Applications, vol. 80, no. 1, pp. 31401–31433, 2021. [Google Scholar]
3. E. -S. M. El-Kenawy, A. Ibrahim, S. Mirjalili, M. M. Eid and S. E. Hussein, “Novel feature selection and voting classifier algorithms for COVID-19 classification in CT images,” IEEE Access, vol. 8, no. 1, pp. 179317–179335, 2020. [Google Scholar]
4. R. Lavingia, M. Rafferty, E. Clark, E. S. Amirian and E. Y. Chiao, “The estimation of diagnostic accuracy of tests for COVID-19: A scoping review,” Journal of Infection, vol. 81, no. 5, pp. 681–697, 2020. [Google Scholar]
5. M. Bloice, P. Roth and A. Holzinger, “Biomedical image augmentation using augmentor,” Bioinformatics, vol. 35, no. 21, pp. 4522–4524, 2019. [Google Scholar]
6. E. -S. M. El-Kenawy, S. Mirjalili, A. Ibrahim, M. Alrahmawy, M. El-Said et al., “Advanced meta-heuristics, convolutional neural networks, and feature selectors for efficient COVID-19 X-ray chest image classification,” IEEE Access, vol. 9, no. 1, pp. 36019–36037, 2021. [Google Scholar]
7. E. -S. M. El-kenawy, M. Eid and A. Ibrahim, “Anemia estimation for COVID-19 patients using a machine learning model,” Journal of Computer Science and Information Systems, vol. 2, no. 1, pp. 1–7, 2021. [Google Scholar]
8. S. S. M. Ghoneim, T. A. Farrag, A. A. Rashed, E. -S. M. El-Kenawy and A. Ibrahim, “Adaptive dynamic meta-heuristics for feature selection and classification in diagnostic accuracy of transformer faults,” IEEE Access, vol. 9, no. 1, pp. 78324–78340, 2021. [Google Scholar]
9. L. Wang, Z. Q. Lin and A. Wong, “COVID-net: A tailored deep convolutional neural network design for detection of covid-19 cases from chest X-ray images,” Scientific Reports, vol. 10, no. 1, pp. 1–12, 2020. [Google Scholar]
10. M. Chowdhury, T. Rahman, A. Khandakar, R. Mazhar, M. Kadir et al., “Can AI help in screening viral and COVID-19 pneumonia?,” IEEE Access, vol. 8, pp. 132665–132676, 2020. [Google Scholar]
11. J. Arias, J. Gémez, L. Moro and J. Godino, “Artificial intelligence applied to chest X-ray images for the automatic detection of COVID-19. A thoughtful evaluation approach,” IEEE Access, vol. 8, pp. 226811–226827, 2020. [Google Scholar]
12. Q. Yan, B. Wang, D. Gong, C. Luo, W. Zhao et al., “COVID-19 chest CT image segmentation network by multi-scale fusion and enhancement operations,” IEEE Transaction of Big Data, vol. 7, no. 1, pp. 13–24, 2021. [Google Scholar]
13. A. Holzinger, G. Langs, H. Denk, K. Zatloukal and H. Müller, “Causability and explainability of artificial intelligence in medicine,” Wiley Interdisciplinary Reviews, Data Mining and Knowledge Discovery, vol. 9, no. 4, pp. e1312, 2019. [Google Scholar]
14. R. Jain, M. Gupta, S. Taneja and D. J. Hemanth, “Deep learning-based detection and analysis of COVID-19 on chest X-ray images,” Applied Intelligence, vol. 51, no. 3, pp. 1–11, 2021. [Google Scholar]
15. K. G. Kallianos, J. Mongan, S. K. Antani, T. S. Henry, A. Taylor et al., “How far have we come? Artificial intelligence for chest radiograph interpretation,” Clinical Radiology, vol. 74, no. 5, pp. 338–345, 2019. [Google Scholar]
16. E. -S. M. El-Kenawy, S. Mirjalili, S. S. M. Ghoneim, M. M. Eid, M. El-Said et al., “Advanced ensemble model for solar radiation forecasting using sine cosine algorithm and newton’s laws,” IEEE Access, vol. 9, pp. 115750–115765, 2021. [Google Scholar]
17. A. A. Salamai, E. -S. M. El-kenawy and A. Ibrahim, “Dynamic voting classifier for risk identification in supply chain 4.0,” Computers, Materials & Continua, vol. 69, no. 3, pp. 3749–3766, 2021. [Google Scholar]
18. A. Takieldeen, E., El-kenawy, E. Hadwan and M. Zaki, “Dipper throated optimization algorithm for unconstrained function and feature selection,” Computers, Materials & Continua, vol. 72, no. 1, pp. 1465–1481, 2022. [Google Scholar]
19. E. -S. M. El-kenawy and M. Eid, “Hybrid gray wolf and particle swarm optimization for feature selection,” International Journal of Innovative Computing, Information & Control, vol. 16, no. 1, pp. 831–844, 2020. [Google Scholar]
20. H. R. Hussien, E. -S. M. El-Kenawy and A. El-Desouky, “EEG channel selection using a modified grey wolf optimizer,” European Journal of Electrical Engineering and Computer Science, vol. 5, no. 1, pp. 17–24, 2021. [Google Scholar]
21. E. -S. M. El-Kenawy, M. M. Eid, M. Saber and A. Ibrahim, “MbGWO-SFS: Modified binary grey wolf optimizer based on stochastic fractal search for feature selection,” IEEE Access, vol. 8, no. 1, pp. 107635–107649, 2020. [Google Scholar]
22. M. M. Eid, E. -S. M. El-kenawy and A. Ibrahim, “A binary sine cosine-modified whale optimization algorithm for feature selection,” in National Computing Colleges Conf., Taif, Saudi Arabia, pp. 1–6, 2021. [Google Scholar]
23. M. Hassib, I. El-Desouky, M. Labib and E. S .M El-kenawy, “WOA + BRNN: An imbalanced big data classification framework using Whale optimization and deep neural network,” Soft Computing, vol. 24, no. 1, pp. 5573–5592, 2020. [Google Scholar]
24. A. Ibrahim, H. A. Ali, M. Eid and E. -S. M. El-kenawy, “Chaotic harris hawks optimization for unconstrained function optimization,” in Int. Computer Engineering Conf., Cairo, Egypt, pp. 153–158, 2020. [Google Scholar]
25. A. Ibrahim and E. -S. M. El-kenawy, “Applications and datasets for superpixel techniques: A survey,” Journal of Computer Science and Information Systems, vol. 1, no. 16, pp. 11–16, 2020. [Google Scholar]
26. E. -S. M. El-Kenawy, S. Mirjalili, F. Alassery, Y. Zhang, M. Eid et al., “Novel meta-heuristic algorithm for feature selection, unconstrained functions and engineering problems,” IEEE Access, vol. 10, pp. 40536–40555, 2022. [Google Scholar]
 | This work is licensed under a Creative Commons Attribution 4.0 International License, which permits unrestricted use, distribution, and reproduction in any medium, provided the original work is properly cited. |