| Computers, Materials & Continua DOI:10.32604/cmc.2022.023841 | |
| Article |
Sensors-Based Ambient Assistant Living via E-Monitoring Technology
1Department of Computer Science, Air University, Islamabad, 44000, Pakistan
2Department of Computer Science and Software Engineering, Al Ain University, Al Ain, 15551, UAE
3Department of Electrical Engineering, King Faisal University, Al-Ahsa, 31982, Saudi Arabia
4Department of Humanities and Social Science, Al Ain University, Al Ain, 15551, UAE
5Department of IT Convergence Engineering, Kumoh National Institute of Technology, Gumi, Korea
*Corresponding Author: Dong-Seong Kim. Email: dskim@kumoh.ac.kr
Received: 23 September 2021; Accepted: 10 January 2022
Abstract: Independent human living systems require smart, intelligent, and sustainable online monitoring so that an individual can be assisted timely. Apart from ambient assisted living, the task of monitoring human activities plays an important role in different fields including virtual reality, surveillance security, and human interaction with robots. Such systems have been developed in the past with the use of various wearable inertial sensors and depth cameras to capture the human actions. In this paper, we propose multiple methods such as random occupancy pattern, spatio temporal cloud, way-point trajectory, Hilbert transform, Walsh Hadamard transform and bone pair descriptors to extract optimal features corresponding to different human actions. These features sets are then normalized using min-max normalization and optimized using the Fuzzy optimization method. Finally, the Masi entropy classifier is applied for action recognition and classification. Experiments have been performed on three challenging datasets, namely, UTD-MHAD, 50 Salad, and CMU-MMAC. During experimental evaluation, the proposed novel approach of recognizing human actions has achieved an accuracy rate of 90.1% with UTD-MHAD dataset, 90.6% with 50 Salad dataset, and 89.5% with CMU-MMAC dataset. Hence experimental results validated the proposed system.
Keywords: Classification algorithm; human action recognition; motion sensors; machine learning; Masi entropy
For secure surveillance and monitoring of an individual’s daily life, most researchers are working with mixed-sensors techniques such as vision, markers, and wearable sensors [1] that have led to a revolution in the field of human action recognition (HAR). HAR systems have provided quality living timely assistance to residents in their own homes through the use of vision and wearable sensors-based systems [2]. HAR involves tracking human body through wearable inertial sensors [3] and recognizing the actions through computer vision. The proposed system is a reliable and a novel HAR system based on a set of unique features. Moreover, it is robust against variations in human body [4] motion.
Wearable sensors have a wide range of real-world applications in HAR including healthcare monitoring [5], surveillance systems [6] and security systems that make require object detection, spatial-temporal movement recognition, pedestrian localization, human face and age detection [7], face expression recognition, gait event recognition [8] etc. In security systems, HAR models can be used to monitor and detect uncertain and strange events. In healthcare, they can be used to monitor a patient’s health [9], their Sfitness activities, and their medicine routines. In HAR field problems include lighting variations, complex human movements, cluttered backgrounds, wired and wearable devices, and scale variations. Hence, the proposed system is designed in a way that it is not only robust against these challenges and but also powerful enough to collect and analyze large volume of healthcare data. To overcome the aforementioned issues, wearable sensors and vision cameras [10] have been used. The advances in technology have resulted in a wide range of wearable sensors but gyroscopes, accelerometers, and magnetometers are more commonly used to acquire the input in HAR systems. In vision systems, Kinect cameras [11] are employed more often to eliminate the background objects. These cameras are cost effective too.
In this research, we contribute a novel approach that enjoys the fusion of both wearable and depth camera sensors for obtaining information regarding patients. Initially, inertial (accelerometer) data is filtered to extract the wavelet transform and statistical features (mean, variance, etc.). While, from depth sensors, spatio-temporal cuboid, random occupancy pattern, and depth motion maps are considered. The feature extraction methods used for skeleton joints-based features include way-point trajectory, bone pair descriptors and displacement. In all these feature extraction techniques, high dimensions increase the computational complexity. Hence, a fuzzy optimization algorithm has been used to reduce the complexity of the features. In the final step, Masi entropy classifier has been used to measure the human activities and obtain high accuracy. The proposed method is evaluated using three datasets: University of Texas at Dallas Multimodal Human Action Dataset (UTD_MHAD), Carnegie Mellon University Multimodal Activity (CMU-MMAC), and 50 salad.
The remaining sections of the paper are organised in this way. Section 2 of this paper includes related work. Section 3 provides detailed information about the proposed methodology. Section 4 briefly explains the experimental setup with the results. In Section 5, conclusion and future directions are discussed.
In this section, some of the recently developed state-of-the-art systems have been discussed. The related work is further divided into two subsections as some of these HAR systems require input acquisition through video sensors while others have employed inertial sensors.
2.1 Action Recognition via Video Sensor
In the past few years, researchers have examined human actions by extracting skeleton information through video sensors. In [12], the input frame sequences were used for the extraction of temporal displacement skeleton poses and k-means clustering was applied to generate key poses. Further, SVM classifier was used to classify each action pose. In [13], the authors proposed spatial and temporal features of skeleton joints extracted through vector of locally aggregated descriptors (VLAD) algorithm and combined via margin nearest neighbour (LMNN) algorithm. In order to detect and recognize human actions, k-nearest neighbour (KNN) classifier was implemented. In [14], the researchers proposed dictionary learning and sparse technique to automatically learn the configuration of body joints and classify video sequences.
Similarly, the latest developments in depth devices are also contributing to HAR. In [15], the proposed system used depth maps to extract features. Then, the convolutional neural networks (ConvNets) and Polynormal fisher vector was used for classification. Another system [16] denoised depth images through Bilateral Filter (BLF) and segmented image clusters using Simple Linear Iterative Clustering (SLIC) algorithm. The actions were then classified using K-ary Tree Hashing (KTH).
2.2 Action Recognition via Inertial Sensor
On the other side, human actions can be recognized through wearable inertial sensors that are attached with different human body parts as shown in Tab. 1. Nava and Meléndez [17] proposed a novel system based on wearable inertial sensors to extract feature set of limb motion. For the classification of actions, both KNN and SVM classifiers are implemented. In [18], the authors described various sets of statistical, wavelet, and binary features for multifused modal data. Then, adaptive moment estimation and maximum entropy Markov model were used for pattern recognition. In [19], the authors developed a novel system that considered both statistical and non-statistical features of data acquired via inertial sensors. Then, further evaluation of these feature sets was performed via genetic algorithm to recognize human actions.
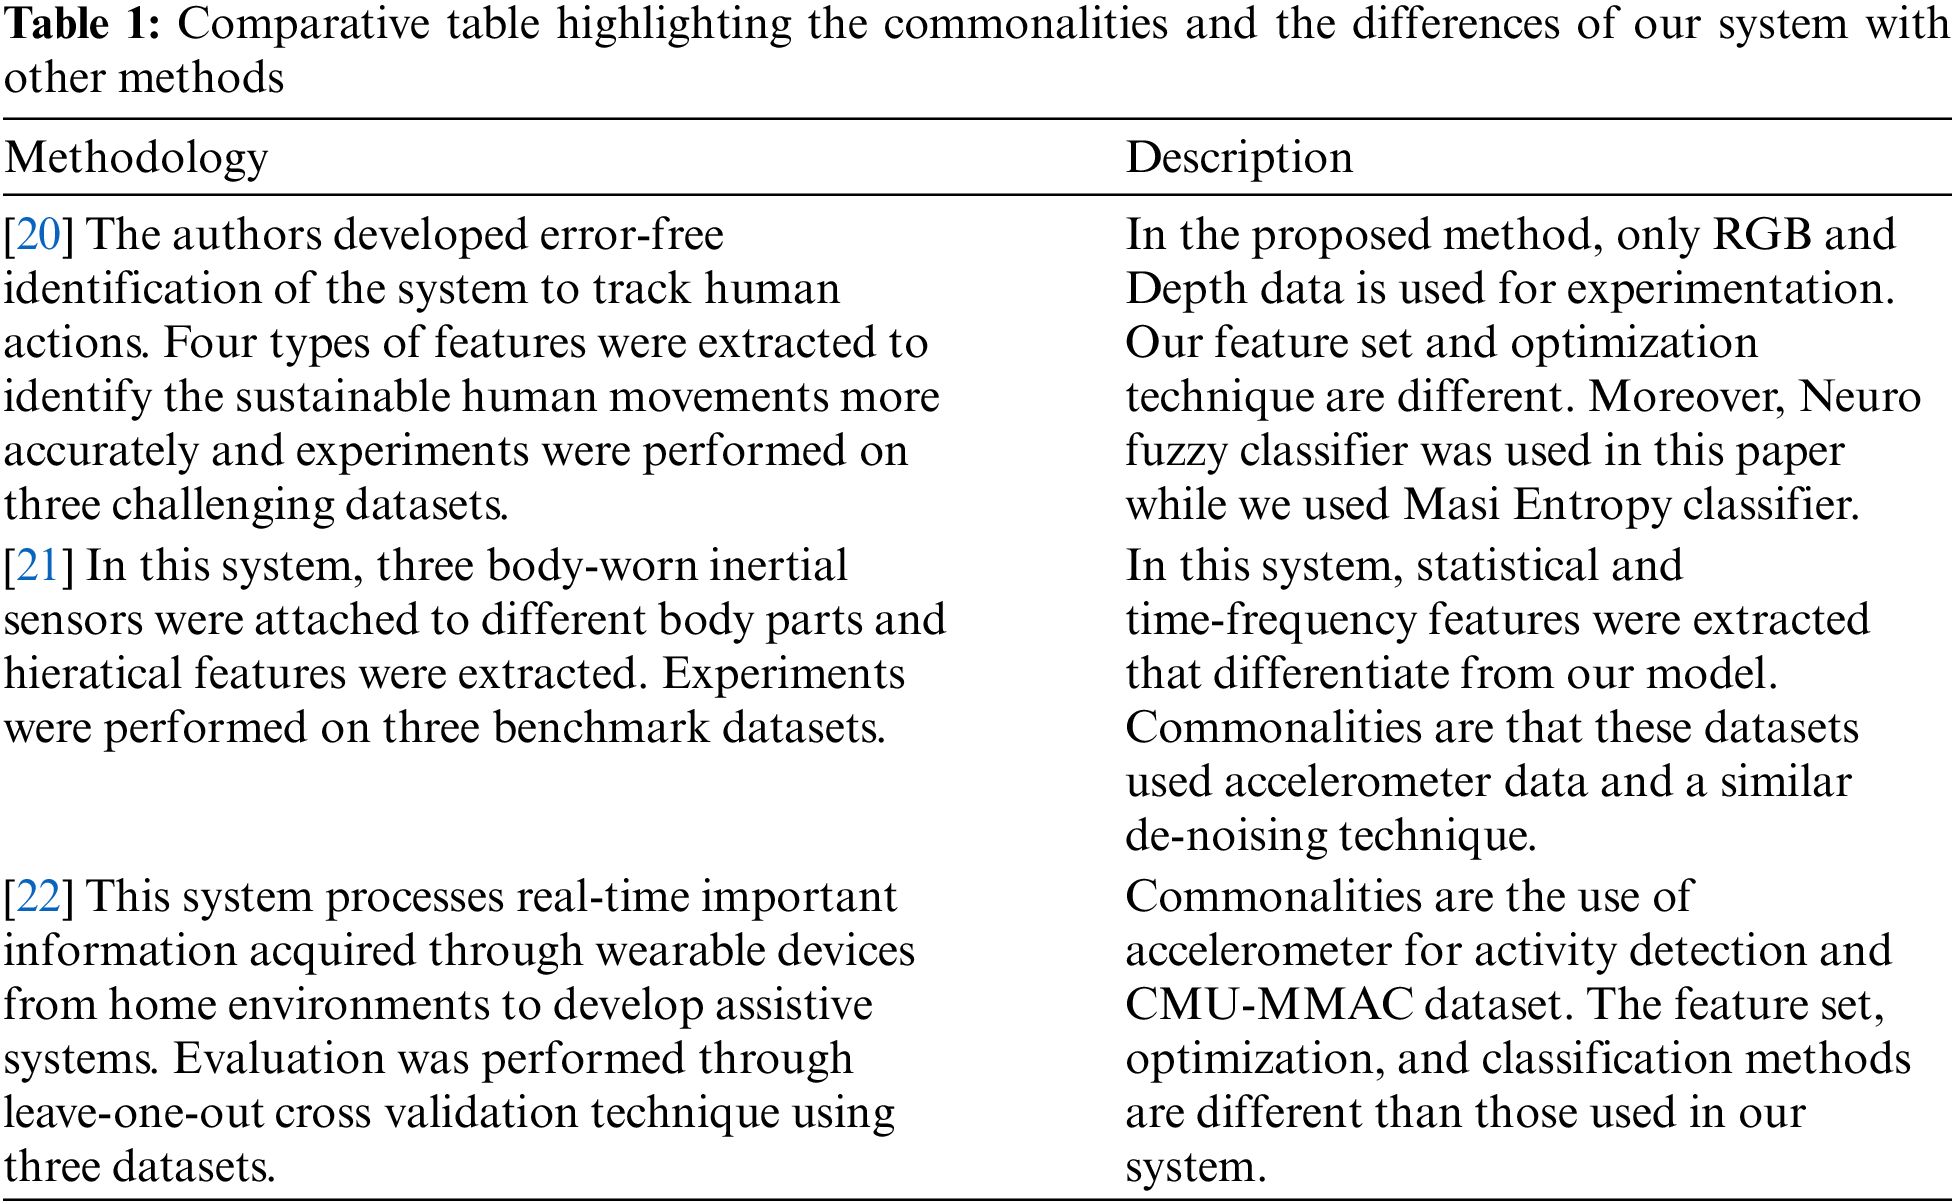
All above mentioned methodologies of different systems in related work are tested over depth, skeleton and inertial sensors for analyzing complex feature sets. However, in this paper, we proposed a novel methodology that uses fusion of various sensors to understand humans’ actions for providing ambient assisted living.
In this section, we discuss the main steps of the proposed HAR model followed by a detailed description of each phase. Fig. 1 shows the flow chart of the proposed system.
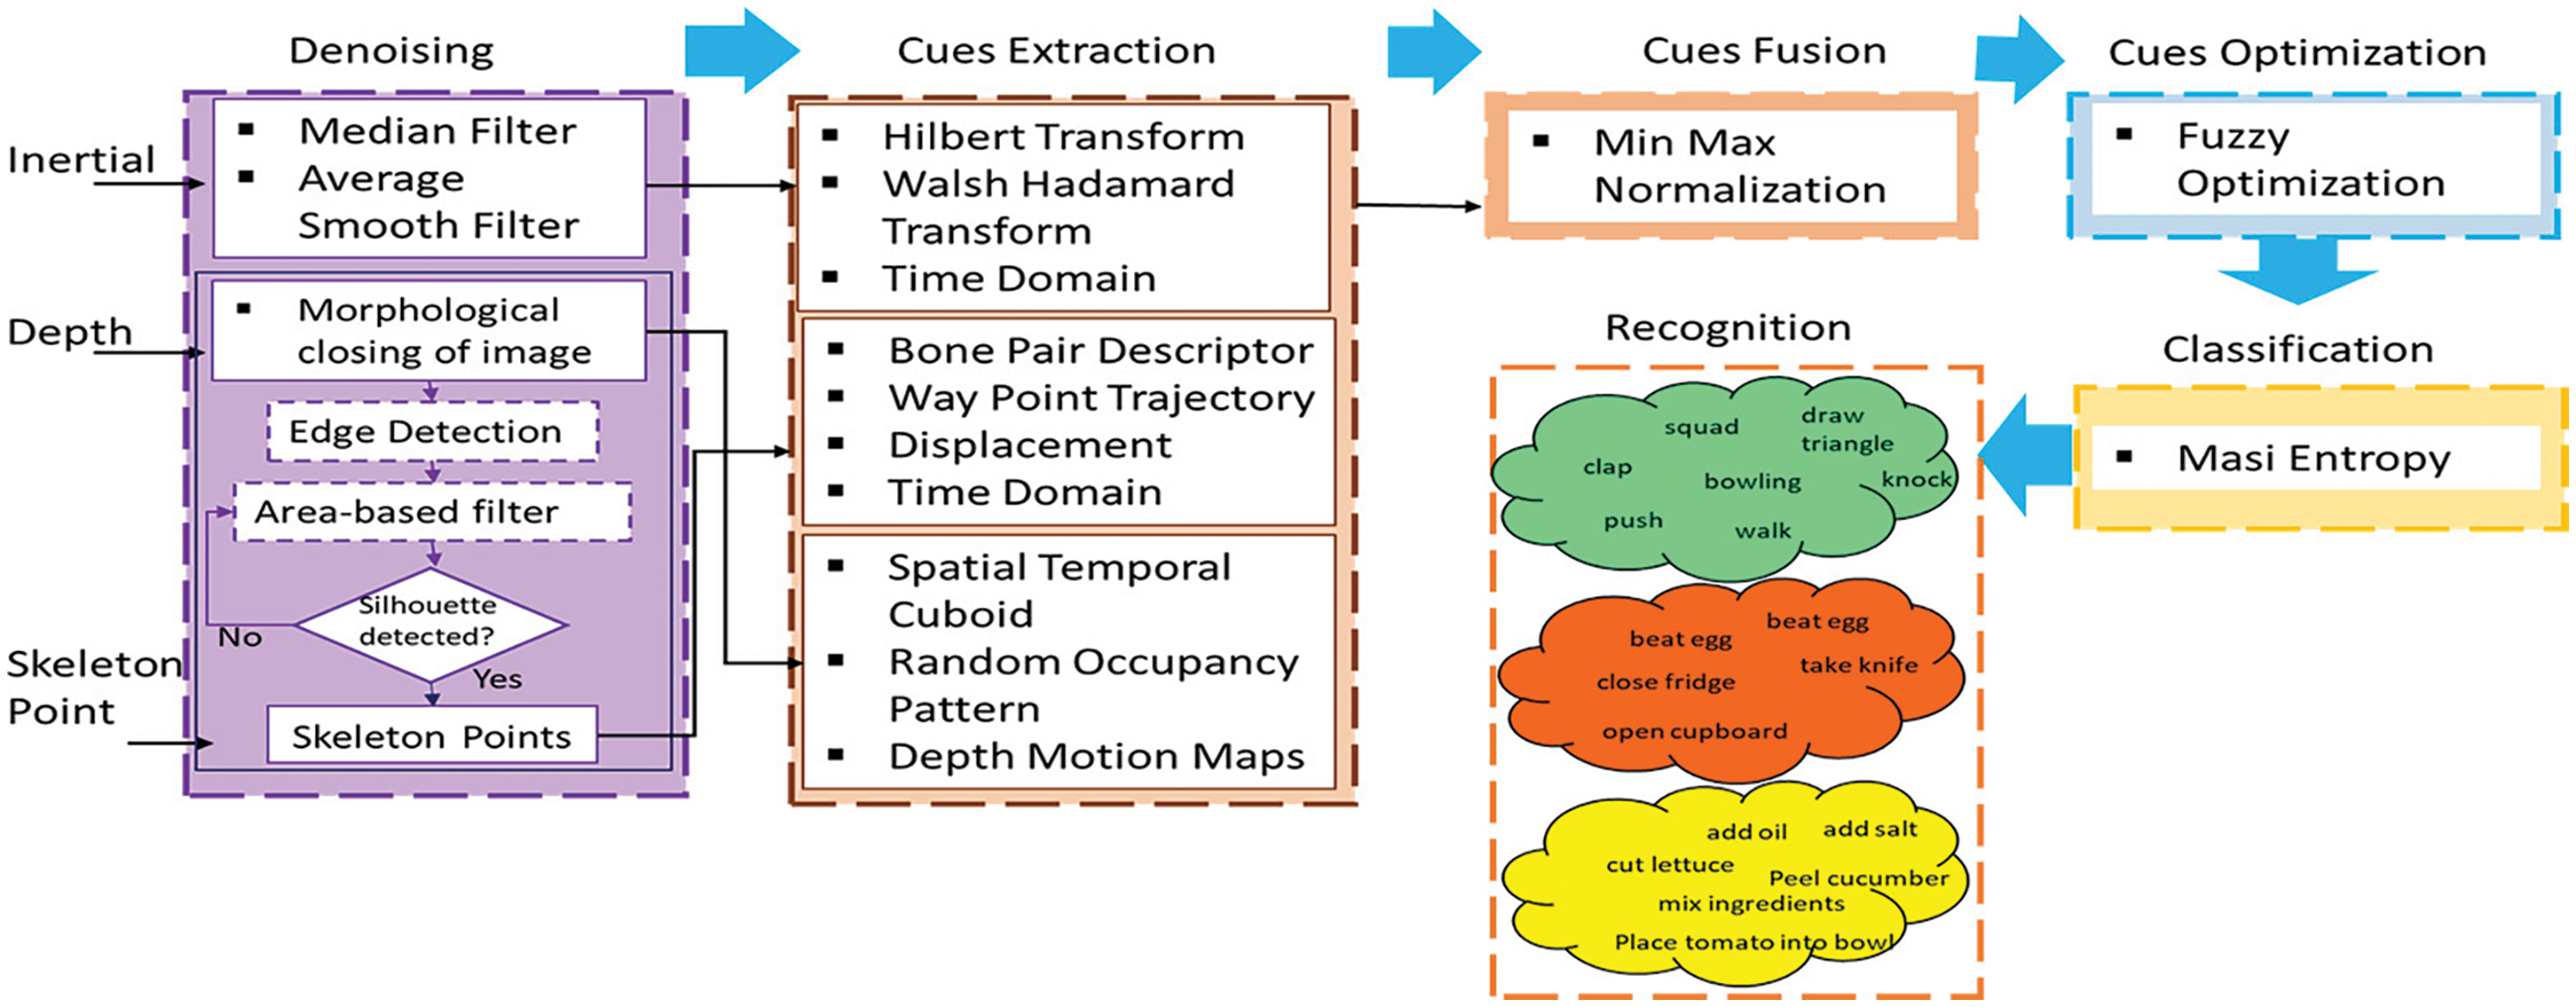
Figure 1: System architecture of the proposed system
3.1 Data Acquisition and Pre-Processing
In IMU [23] sensors, noise data affects the signal sensitivity which causes variance in feature sets, alternation in the signal shape, and creates a visible difference in the signal values. Therefore, two filtering methods have been used for the purpose of noise reduction that include median and average smooth filters. A median filter is a nonlinear method that extracts the signal noise and smoothens the signal into normal motion. An average smooth filter is used to smoothen the peak values in a signal. Median filter is represented by Eq. (1) as shown:
where m and n are the element of window w having specified neighborhoods centered around pixels [i,j] in an image.
While, in joints construction, noise contributes to the incorrect detection of positions of joint points. In some conditions, noise is produced due to room light effects or overlapping of two or more joints. During pre-processing, noise is removed and skeleton joint trajectories are projected on x, y and z planes accurately and efficiently, improving the overall action recognition process as shown in Fig. 2.
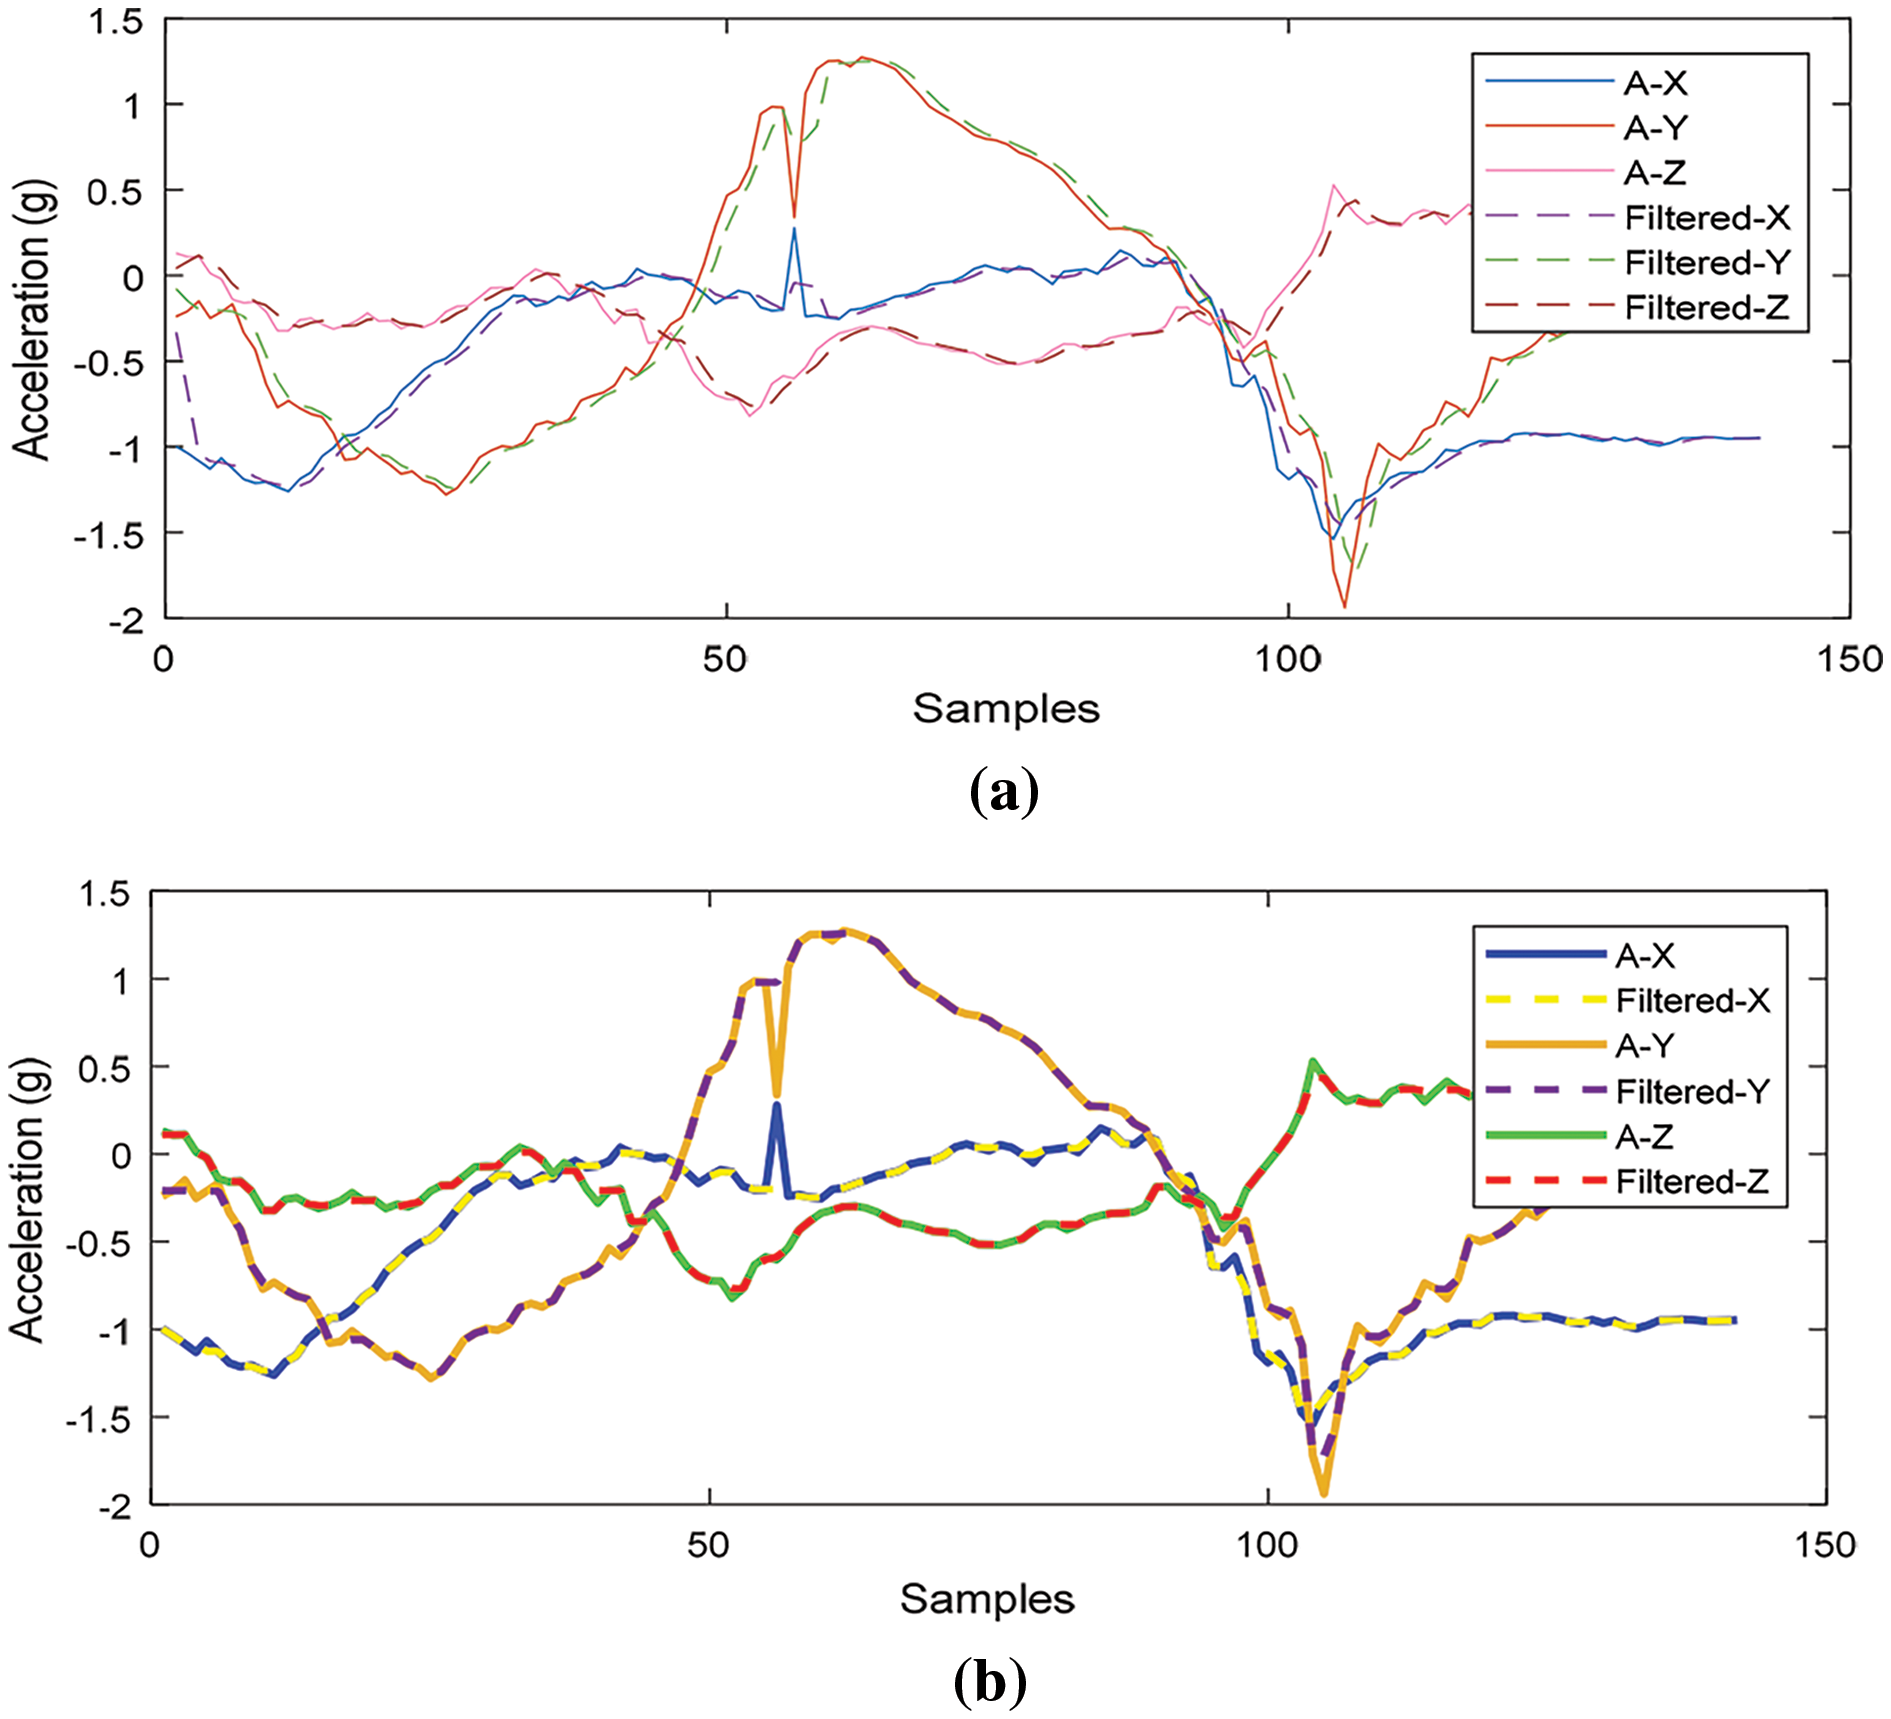
Figure 2: Triaxial accelerometer sensor representation (a) Unfiltered and filtered data with average smooth filter (b) Median filter data with unfiltered signals
During windowing selection, we observed the partitioned signals in different ways. Different techniques have been applied by researchers for window selection including activity defined, event defined, and sliding window. After preprocessing, the next step is to select the signal for 4–5 s duration of window. Fixed-sized windowing approaches may be overlapping and non-overlapping. Non-overlapping window approaches have shown better performance.
3.3 Features Extraction Methods over Multiple Sensors
In this section, we analyzed feature extracted from inertial, skeleton, and depth data which are then used for further processing. The process of feature extraction is discussed in detail below:
3.3.1 Inertial Sensor: Magnitude
For feature sets extraction, we retrieved inertial signals in the form of magnitude. Magnitude is the sum of three-dimensional x, y and z values that are calculated for all the signal values and is represented by Eq. (2):
where Ms represents the magnitude of the signal and (xs, ys, zx ) represents the three-axes. Next, time domain features (mean and absolute mean) are extracted to examine each action of humans using Eqs. (3) and (4):
where n is the mean of the signal |xm| and n
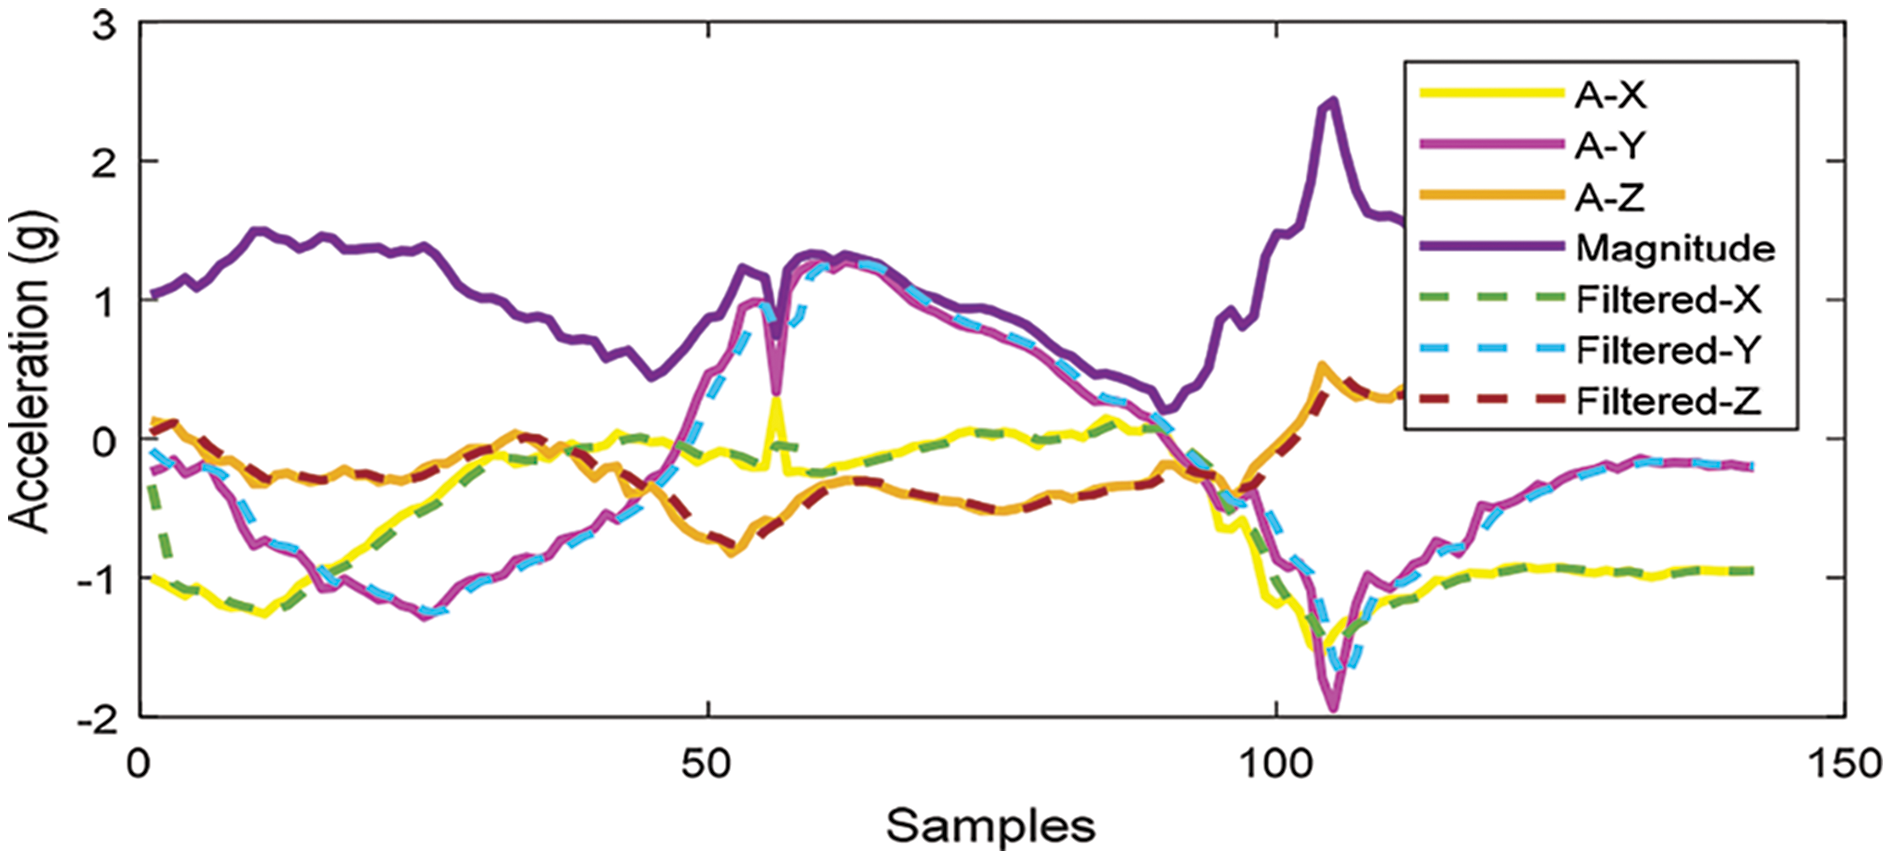
Figure 3: Sensor triaxial acceleration plot of magnitude with filtered and unfiltered signal
3.3.2 Inertial Sensor: Hilbert Transform
To get the Hilbert transform, we calculated the gain of minimum level frequency values of the signal angle that is altered from Fourier transform of the signal u(t). Hilbert transform computes the real values of the signal and outputs the complex result in the form of real and imaginary values of Hilbert transform pair. Fig. 4 shows the Hilbert output in the form of values of the real eigenstate.
where x(s) is the signal which has the same amplitude spectrum and autocorrelation function. Here x(s) is the real value of the signal data with zero padding.
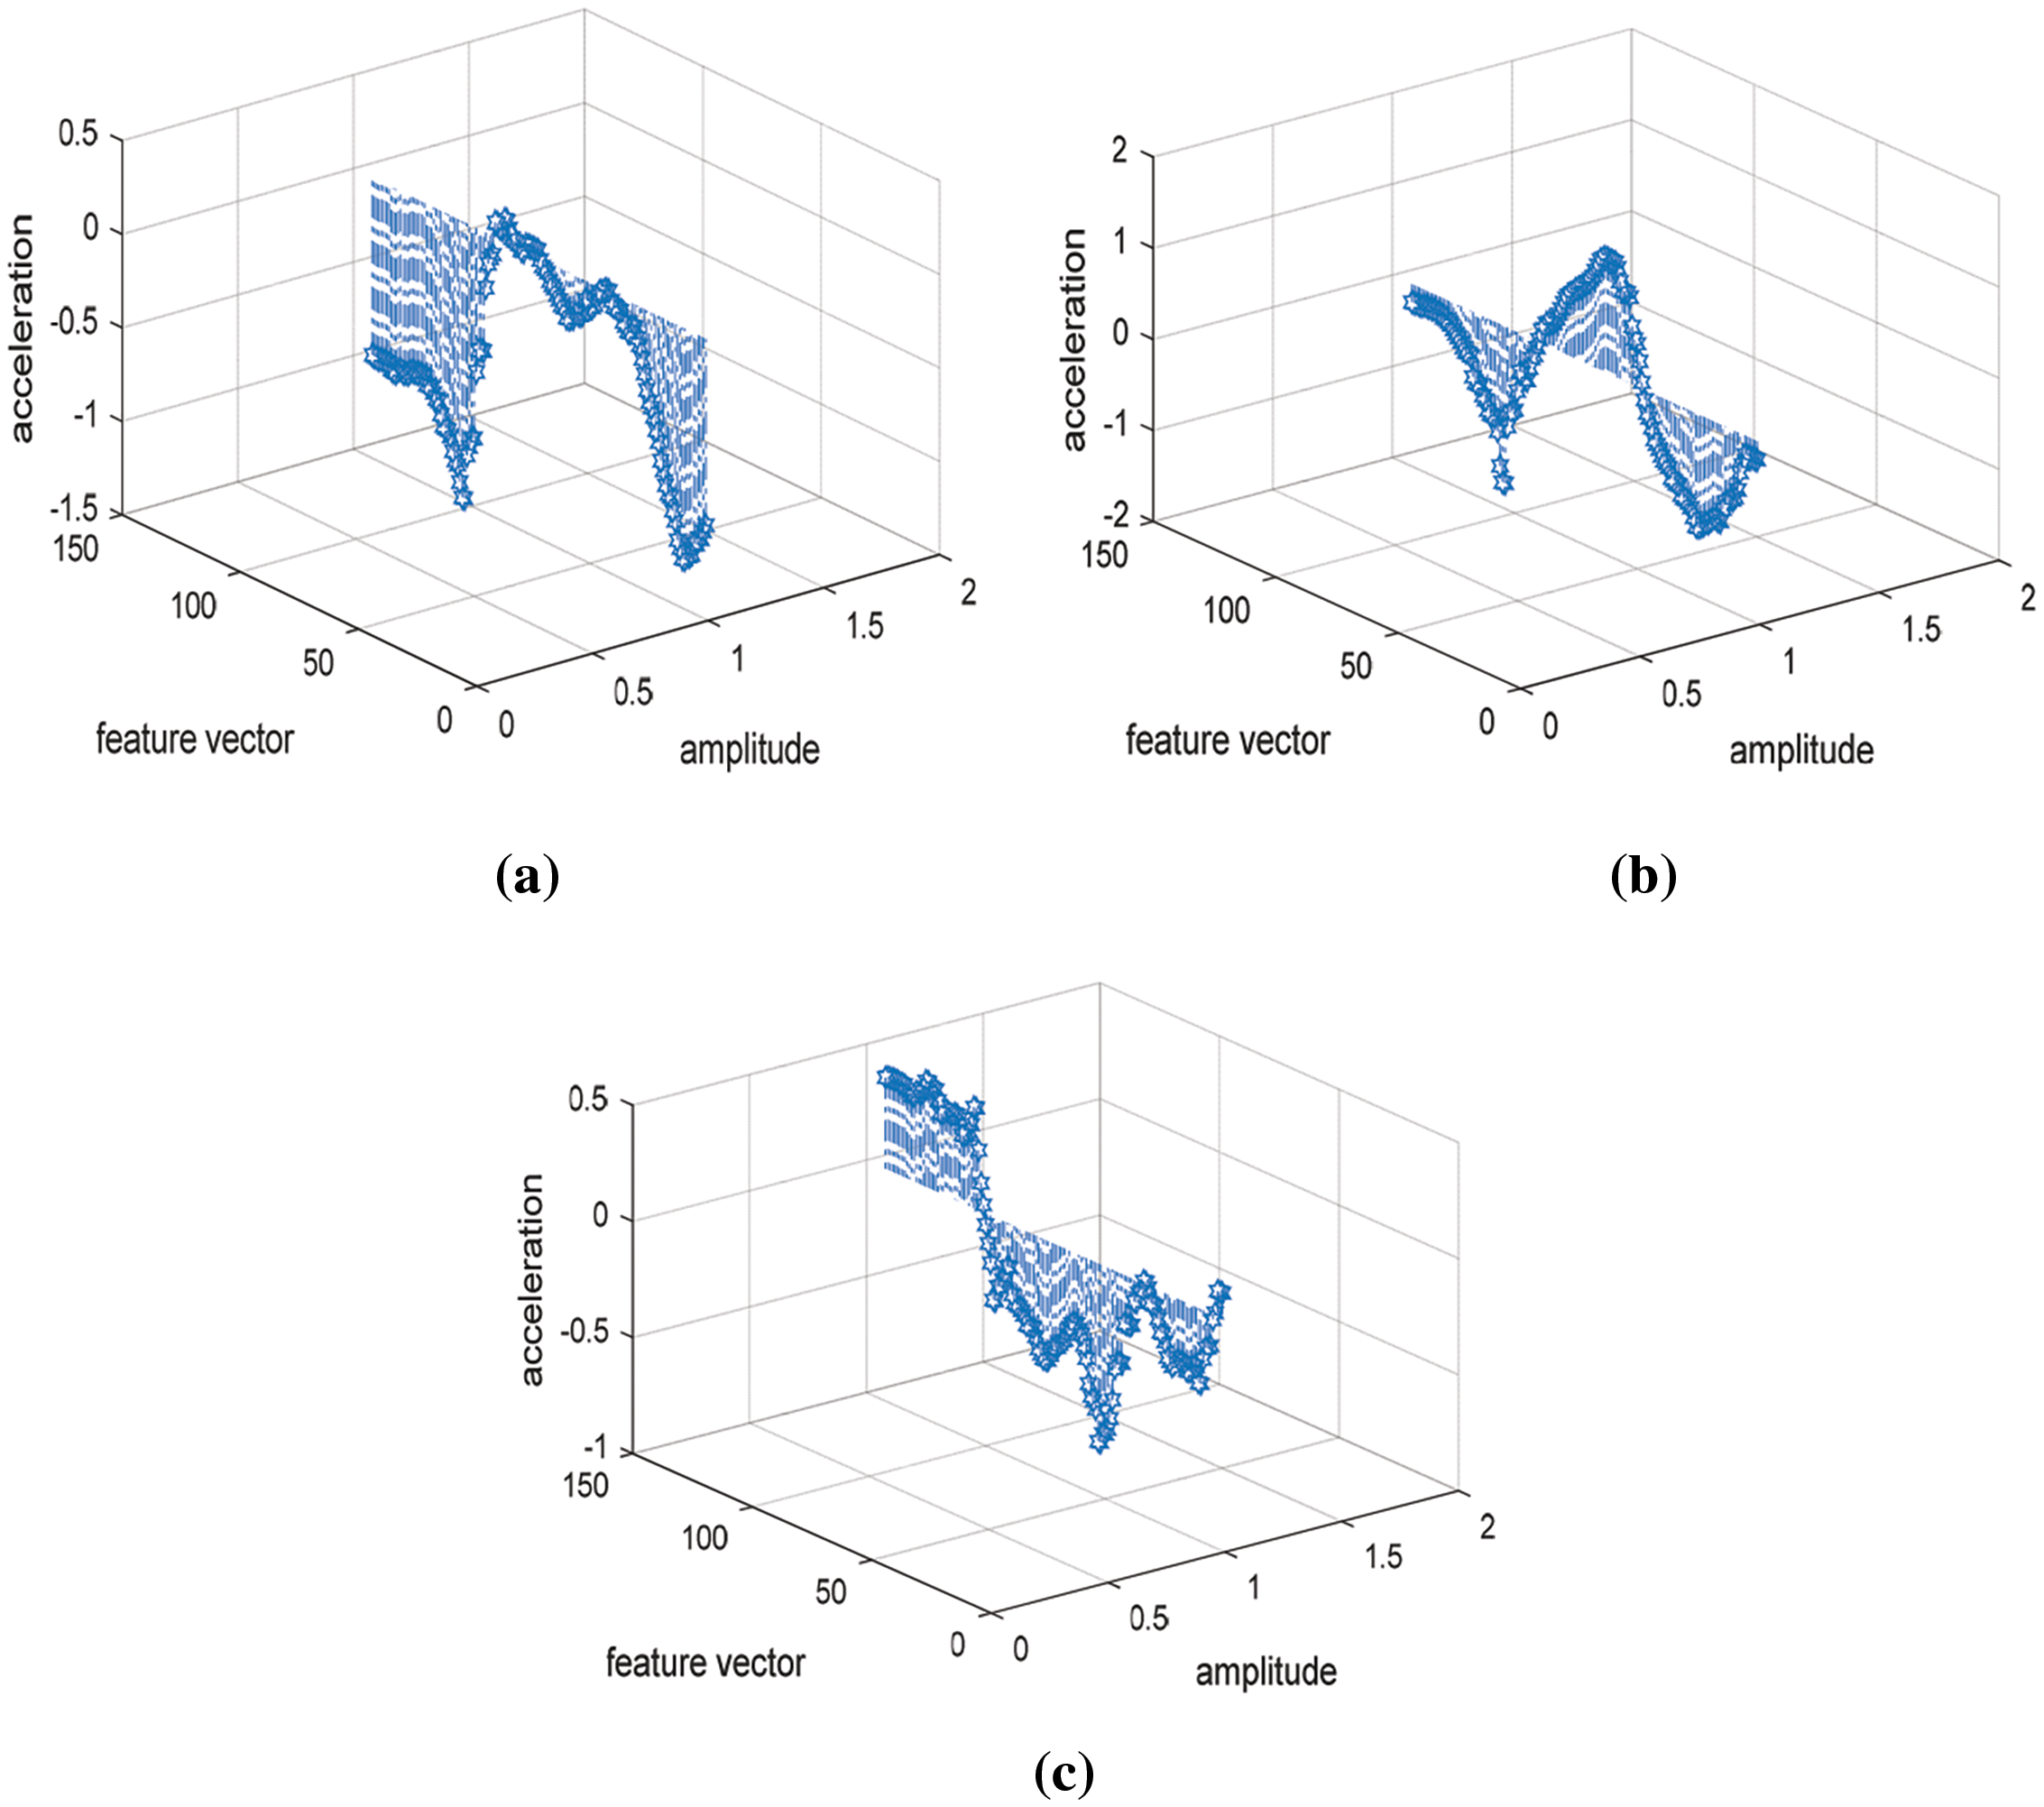
Figure 4: Signal hilbert transform feature along x, y and z-axis (a) x signal (b) y signal (c) z signal
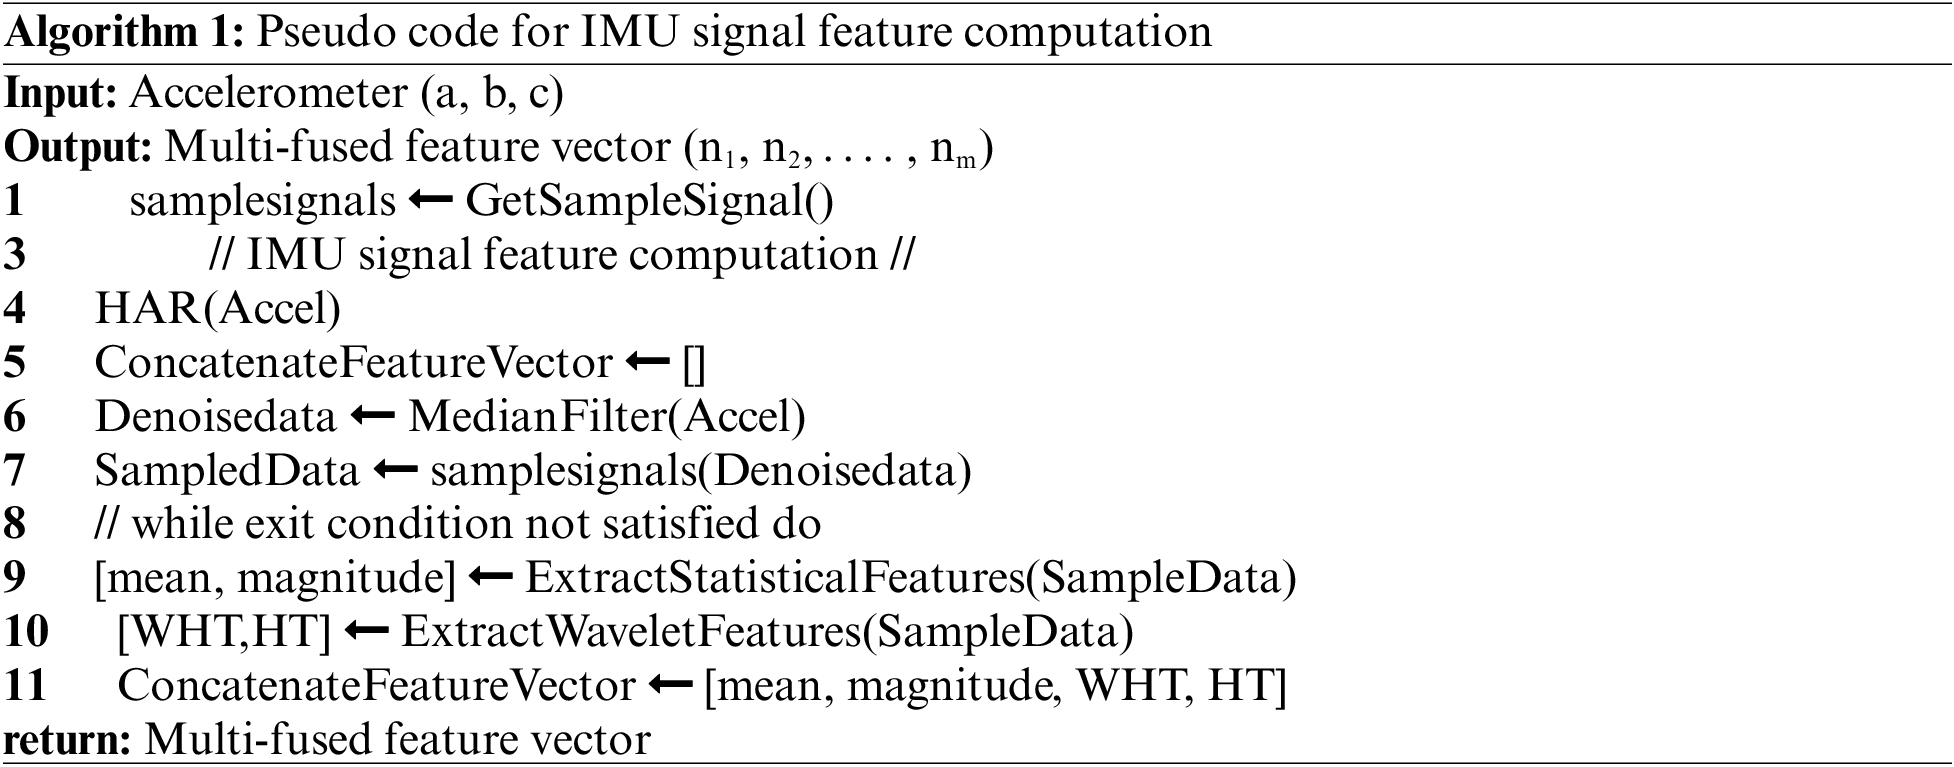
3.3.3 Inertial Sensor: Walsh Hadamard Transform
Walsh Hadamard Transform (WHT) is used to split a signal into a set of signals on the basis of orthogonal transformation. The input signal is transformed into rectangular and square waves with +1 and –1 values and returns a sequence of values to reduce the computational costs. The WHT discrete values of a vector is calculated by Eq. (6).
where N is the sample number to calculate the vector set and T = log2 N. Algorithm 1 explains the process of feature extraction from inertial signals.
3.3.4 Skeleton Joint: Displacement
Several well-known algorithms of spatial and temporal space (orientation and location of joints) for skeleton features [24] have been proposed in the past. In this paper, the spatial features have been extracted by eliminating the distance between 20 different joints of the human skeleton. Consider a skeleton consisting of R joints, torso joint coordinates (P0), neck joint coordinates (P2), and the nth joint feature (Pn), the distance dn between P2 and P0 is calculated by Eq. (7) as and for each frame, a feature vector is created as given in Eq. (8):
where d is the distance from a fixed point and s is the vector has all the distance points.
3.3.5 Skeleton Joint: Bone Pair Descriptor
The angular relation between bones can be detected by Bone Pair Descriptor (BPD) and Point Pair Descriptor (PPD) that uses 3D coordinate systems. In addition, BPD uses the skeleton data in which bones allow vectors to recognize different actions of humans instead of normal surface. The calculation of BPD [25] in which Cp is the point of center, Vc is the vector that relates with the center point Cp, Ci is the point that is not the center joint, and Vi is the vector that relates to non-center joints. Vc and Vi are vectors that correspond with the joint bone or spine (See Fig. 5). The relative calculation of the vector Vc and Vi are described by the gain values of β, φ and Φ which are calculated by Eqs. (9)–(11).
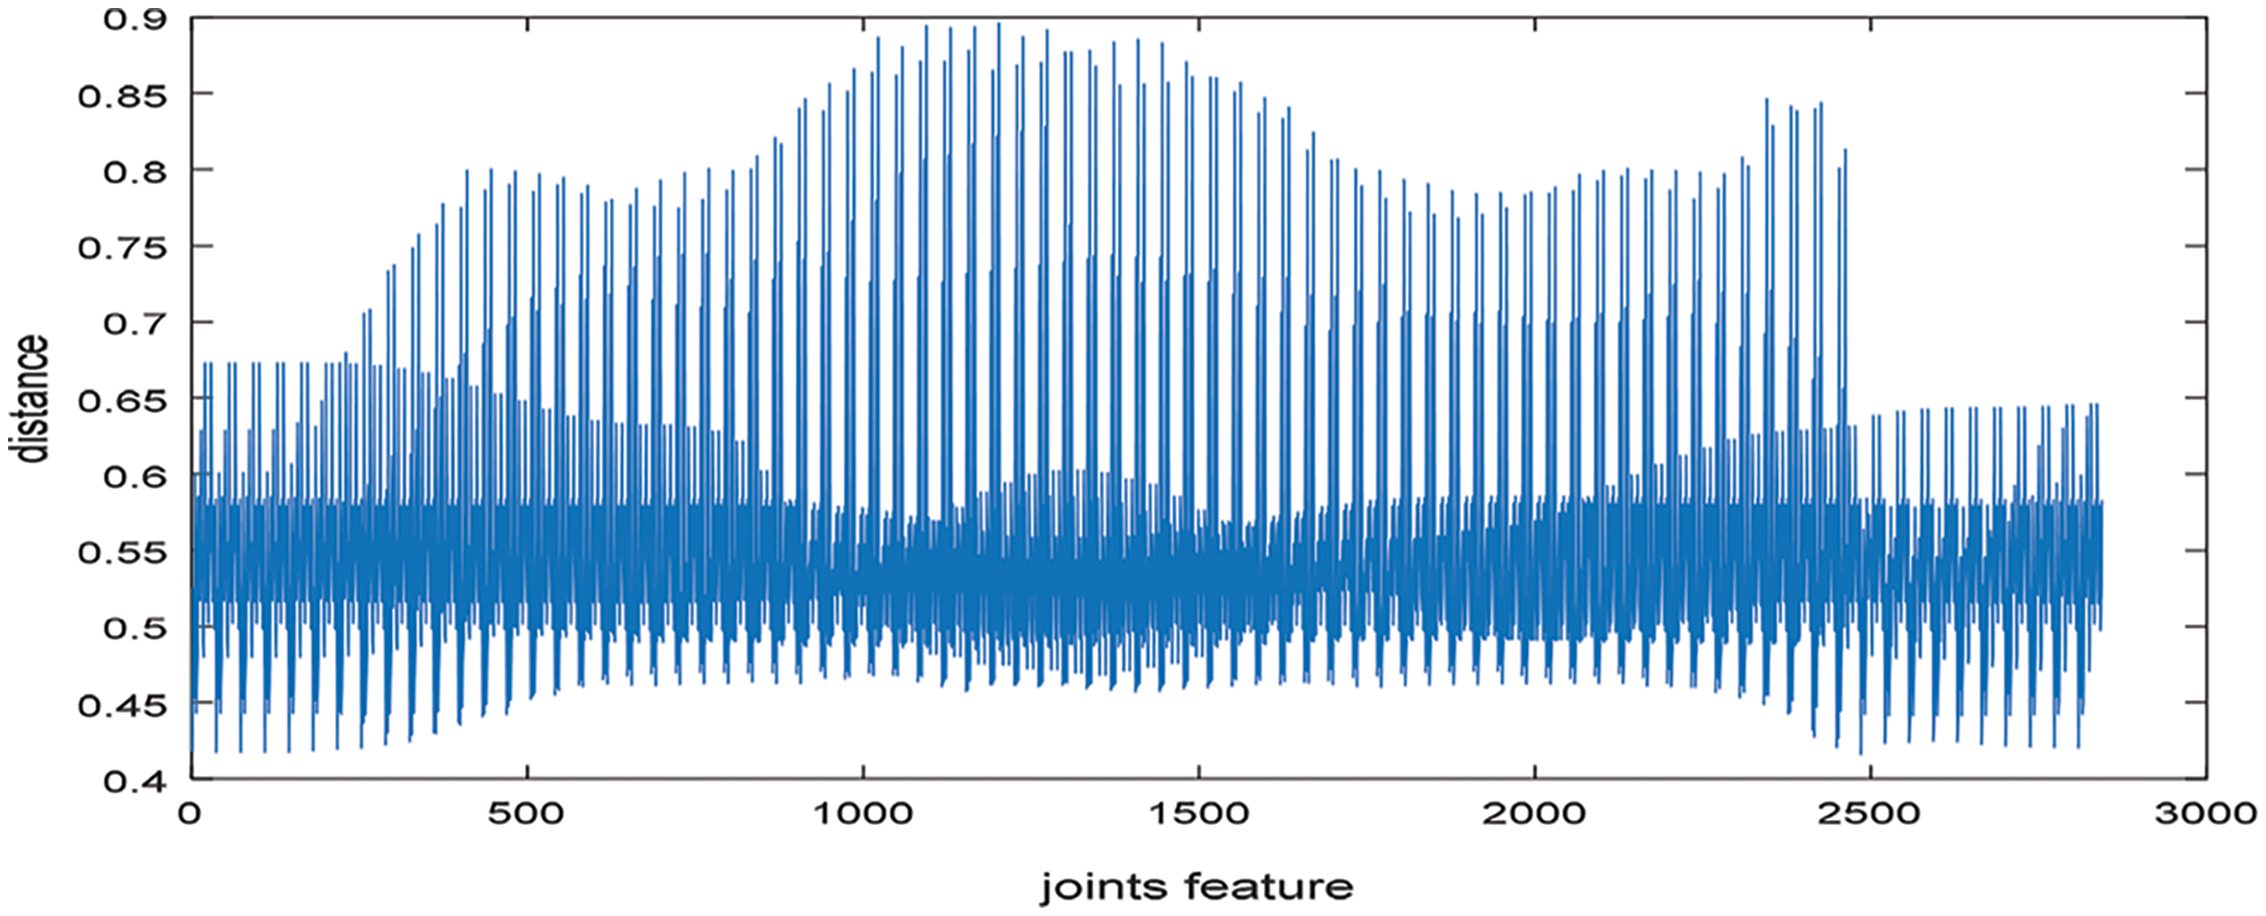
Figure 5: Bone pair descriptor calculation from center point joint
where vectors u,
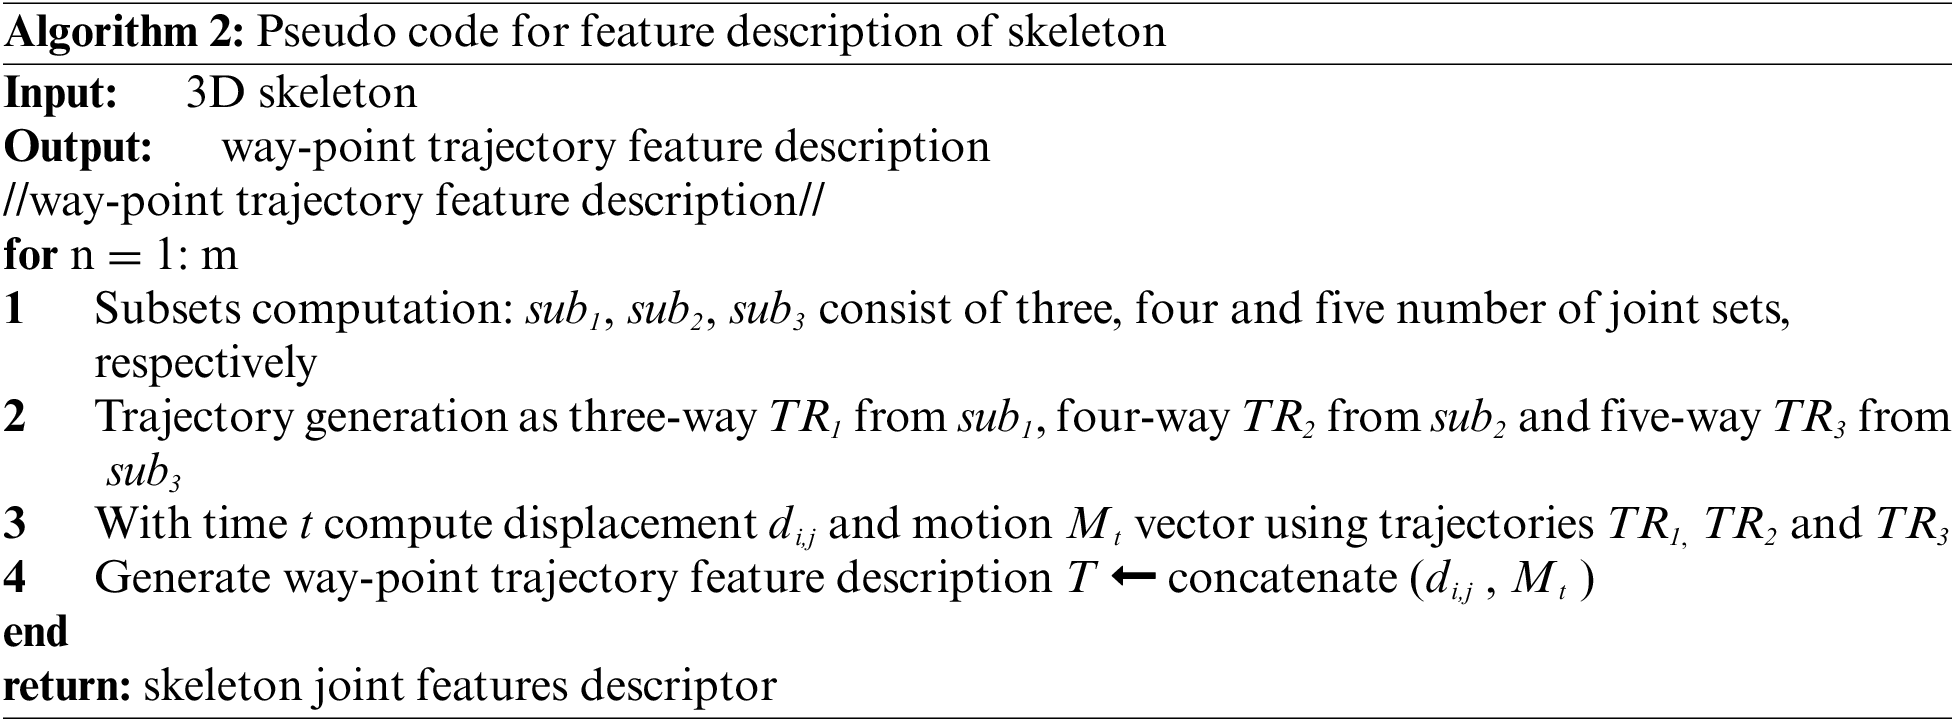
3.3.6 Skeleton Joint: Way Point Trajectory
Most of the research work performed by trajectory includes dense and local trajectory. In way point trajectory, the inter-silhouette trajectory uses a subset B which is generated from joint set J = { j1, j2, …., jn} that is constructed from n number of joints i.e., (head, shoulder_center, spine, hip_center, left_shoulder, left_elbow, left_wrist, left_hand, right_shoulder, right_hip, right_knee, right_ankle, right_foot etc.) as shown in Fig. 6. From the trajectory, two types of features are extracted. Shape features are extracted from the displacement change with respect to length L over time t and changes are measured by calculating the coordinate positions of joints x and y with respect to change occurring in each frame such as
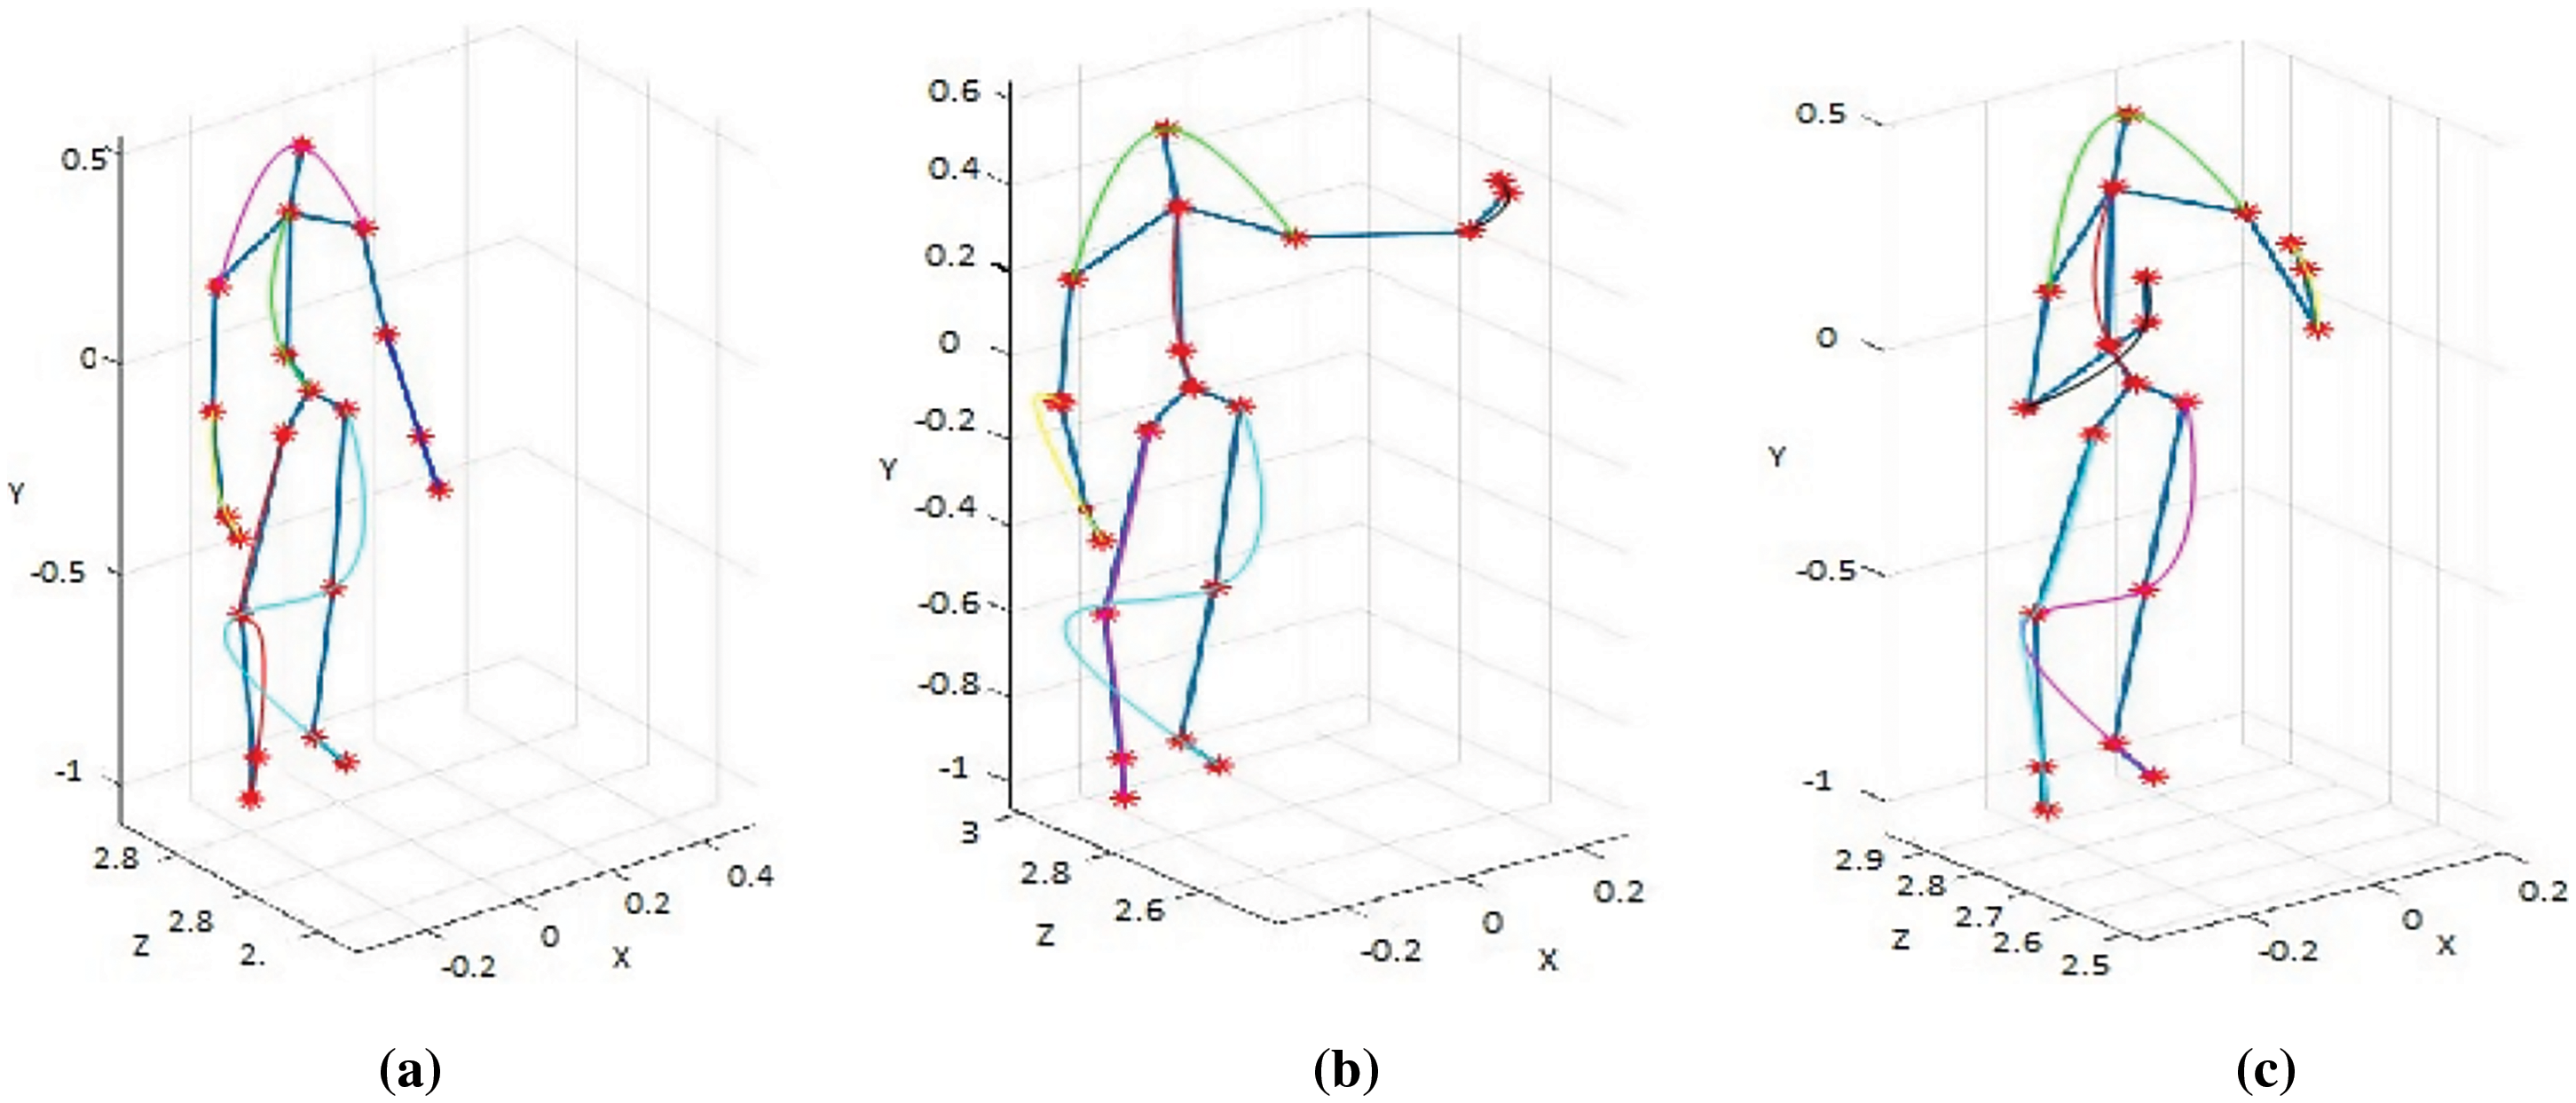
Figure 6: Way-Point Trajectory of skeleton joints (a) Inter silhouette trajectory when swipe hand left position (b) Inter silhouette trajectory position when catch position (c) Inter silhouette trajectory when arm cross position
Now, the change in the displacement position with respect to time is extracted for the velocity measurement, in which first and second derivatives of the trajectory for the final curvature of the coordinate x and y is calculated by Eq. (17). Algorithm 2 explains the pseudo code for the extraction of inter silhouette way-point trajectory from the skeleton joints.
3.3.7 Depth Sensor: Depth Motion Map
The second feature set that has been extracted from video frames is Depth Motion Map (DMM). DMM extracts the 3D information of the depth images in a proper sequence for action recognition. In the proposed method, N frames are extracted from the depth sequence by DMM [26], represented as follows:
here
3.3.8 Depth Sensor: Spatial Temporal Cuboid
In images, interest points are used to detect and recognize different human actions and then 2D data is transformed into 3D by considering Space-Time Interest Point (STIP). In depth images, a filtering technique extracting STIPs [27] from depth video called DSTIP is used to suppress the noise. The 3D cuboid is extracted and the size of the cuboid is designed to be adaptable for the depth that contains spatio-temporal pixel values. We divide the cuboid according to block of each voxel of size nxy × nxy × nt and the block size is 1 × 1 × 1. The histogram is computed for depth pixels of each block and then it is normalized so the total value is 1 for every histogram. We use Bhattacharyya distance technique to calculate the histogram of block a and b be ha and hb defined by Eq. (21) as shown below:
where N represents the number of bins in histogram. Fig. 7 shows spatial temporal cuboid features set result.
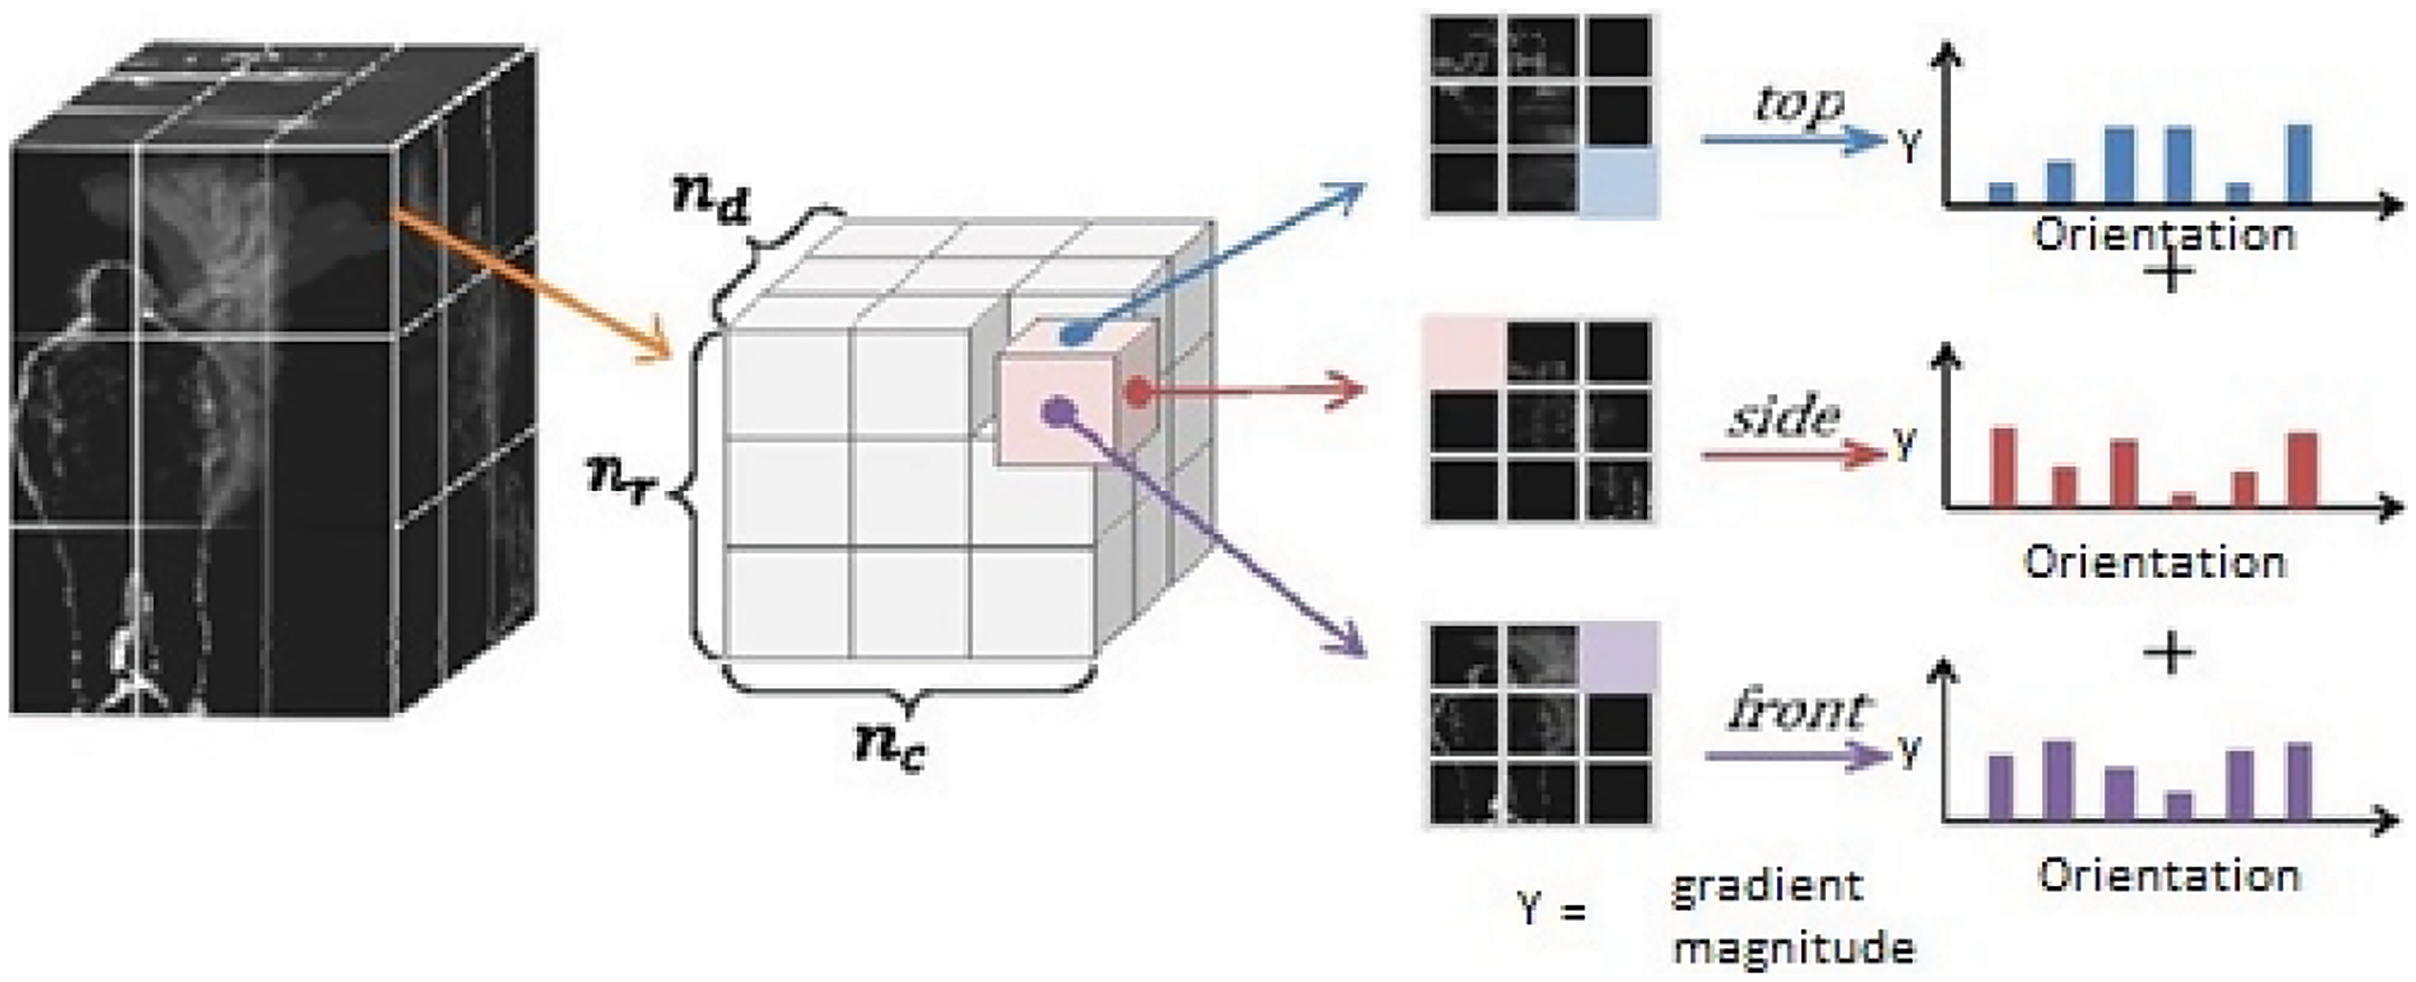
Figure 7: Extracting spatial temporal cuboid from depth video
3.3.9 Depth Sensor: Random Occupancy Pattern
Sample 4D sub-volume features that are extracted from Random Occupancy Pattern (ROP) with various sizes along with various locations are shown in Fig. 8. To handle the issues of noise and occlusion, depth-maps are represented as 4D substitutes of three-dimensional movement successions. The ROP features are robust to noise when they are extracted at a bigger scale.
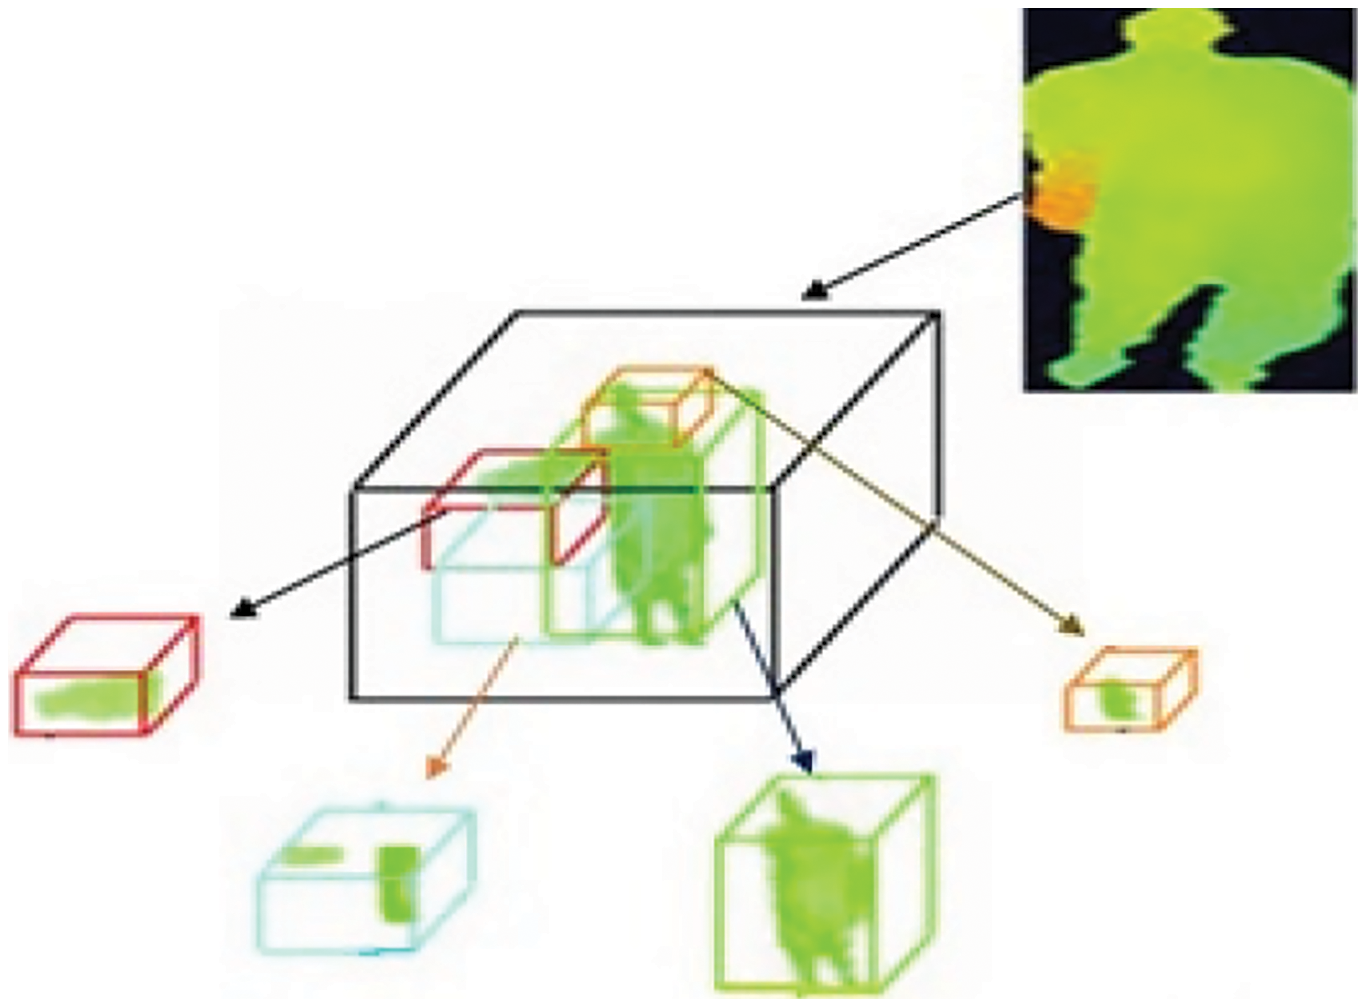
Figure 8: Extracting random occupancy pattern from depth video
Since majority of the encoded data is stated with regions that are most discriminative for an action and less conscious to occlusion, sparse coding is applied further to enhance the proposed technique.
3.4 Cues Fusion via Min Max Normalization
The extracted features from different sensors (i.e., inertial and depth sensors) are fused by applying feature fusion [28]. The resultant vector is a high dimensional vector which extracts the feature information in a better way as compared to a single sensor feature vector. To scale the values of different sensors (depth and inertial sensors) min max normalization technique is applied on the feature vector that converts the minimum and maximum values to 0 and 1 respectively as it scales all the values between an interval of (0 – 1). Min max normalization transforms the original feature vector by utilizing the normalization formula defined by Eq. (22).
where M’ is the normalized value, M is the original value,
3.5 Cues Optimization via Fuzzy Optimization
After feature fusion, the next step is the optimization in which selection of the features and reduction techniques are considered. Fuzzy Optimization (FO) is used to solve the problem of uncertainty on some constrains, so the objective function is used with some uncertainty condition to solve this fuzzy uncertainty problem. Fuzzy optimization [29] technique is beneficial and important both in theoretical practical form and it is a well-known technique in artificial intelligence. Defuzzification method used to acquire nonfuzzy values for output. The formula for defuzzification is given by Eq. (23).
where
3.6 Classification via Masi Entropy Classifier
The new generalized entropy technique is Masi Entropy (ME) [30] that works similar to bi-level and multilevel thresholding. In this classifier, the histogram distribution is considered to be a probabilistic distribution, in which the algorithm initializes the position of random particles in the search space domain.
where ub, lb, nos and Pn are the upper bound, lower bound, number of thresholds and number of particles of the thresholds, respectively. The fitness of each particle is calculated using the Masi entropy function. Each particle remembers the personal best solution it has found so far, called pbest and the swarm also keeps track of the global best solution it has found so far, called gbest. Finally, the program terminates, and the position of the global best particle gives the desired set of optimum thresholds.
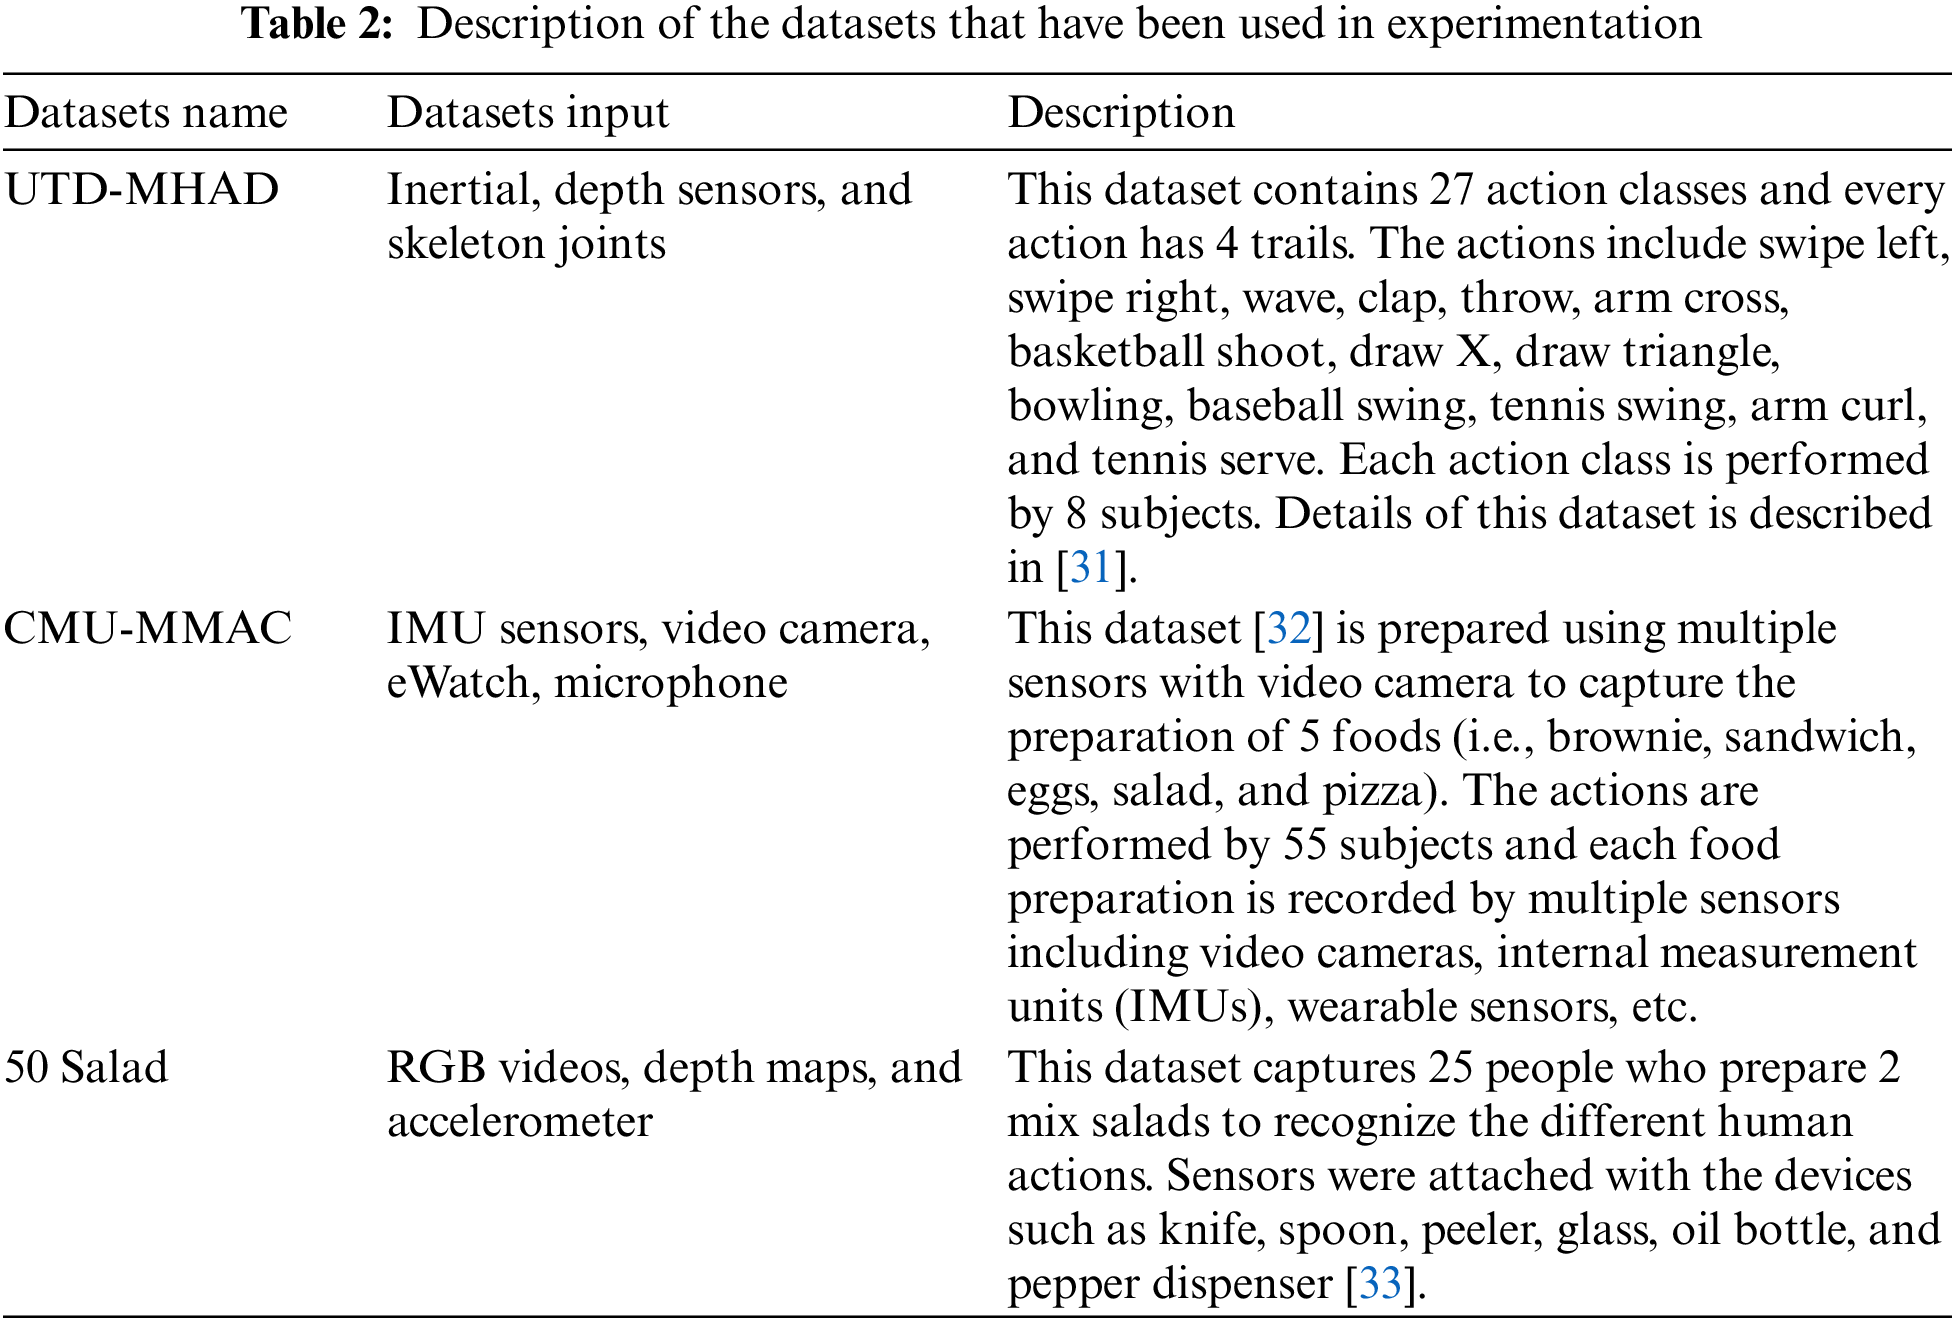
This section gives a brief description of the three datasets used for UTD-MHAD, CMU-MMAC, and 50 Salad. A series of experiments evaluates the proposed system and compares its results with other state-of-the-art systems.
The proposed model’s efficiency is evaluated on different datasets. Three benchmark datasets have been used, namely, UTD-MHAD, CMU-MMAC, and 50 Salad as shown in Tab. 2.
4.2 Experimental Settings and Results
All the processing and experimentation have been performed on MATLAB (R2017a). The hardware system used is Intel Core i5 with 64-bit Windows-10. The system has an 8 GB ram and 5 GHz CPU. To evaluate the performance of the proposed system, multiple experiments have been conducted on UTD-MHAD, CMU-MMAC, and 50 Salad datasets.
4.2.1 Experimental Results on Datasets
Experiment I: Recognition Accuracies
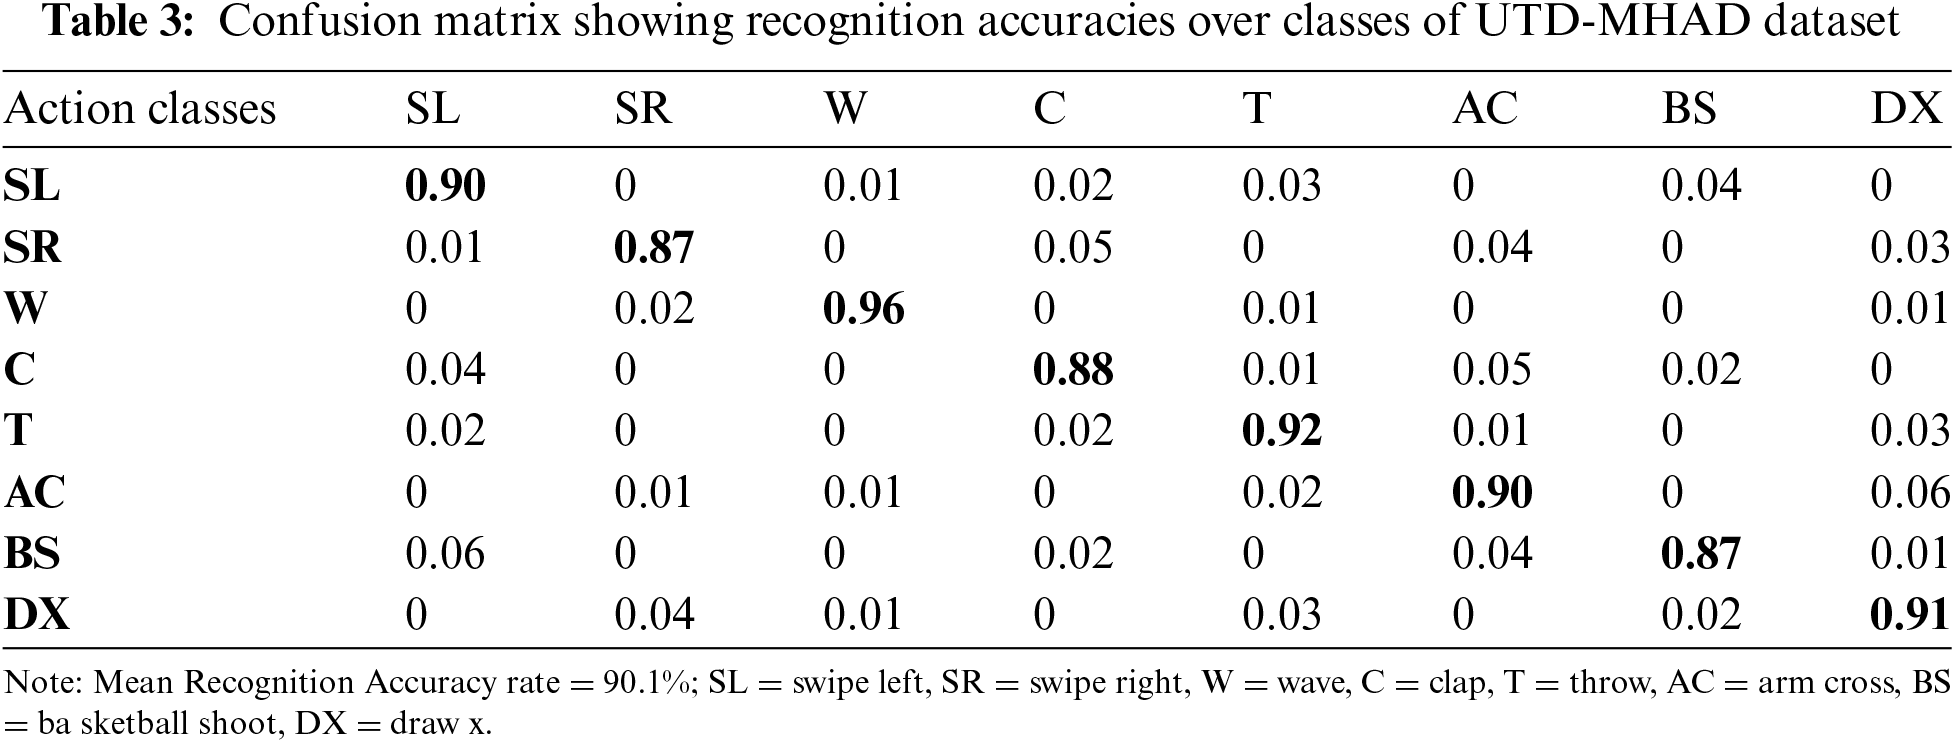
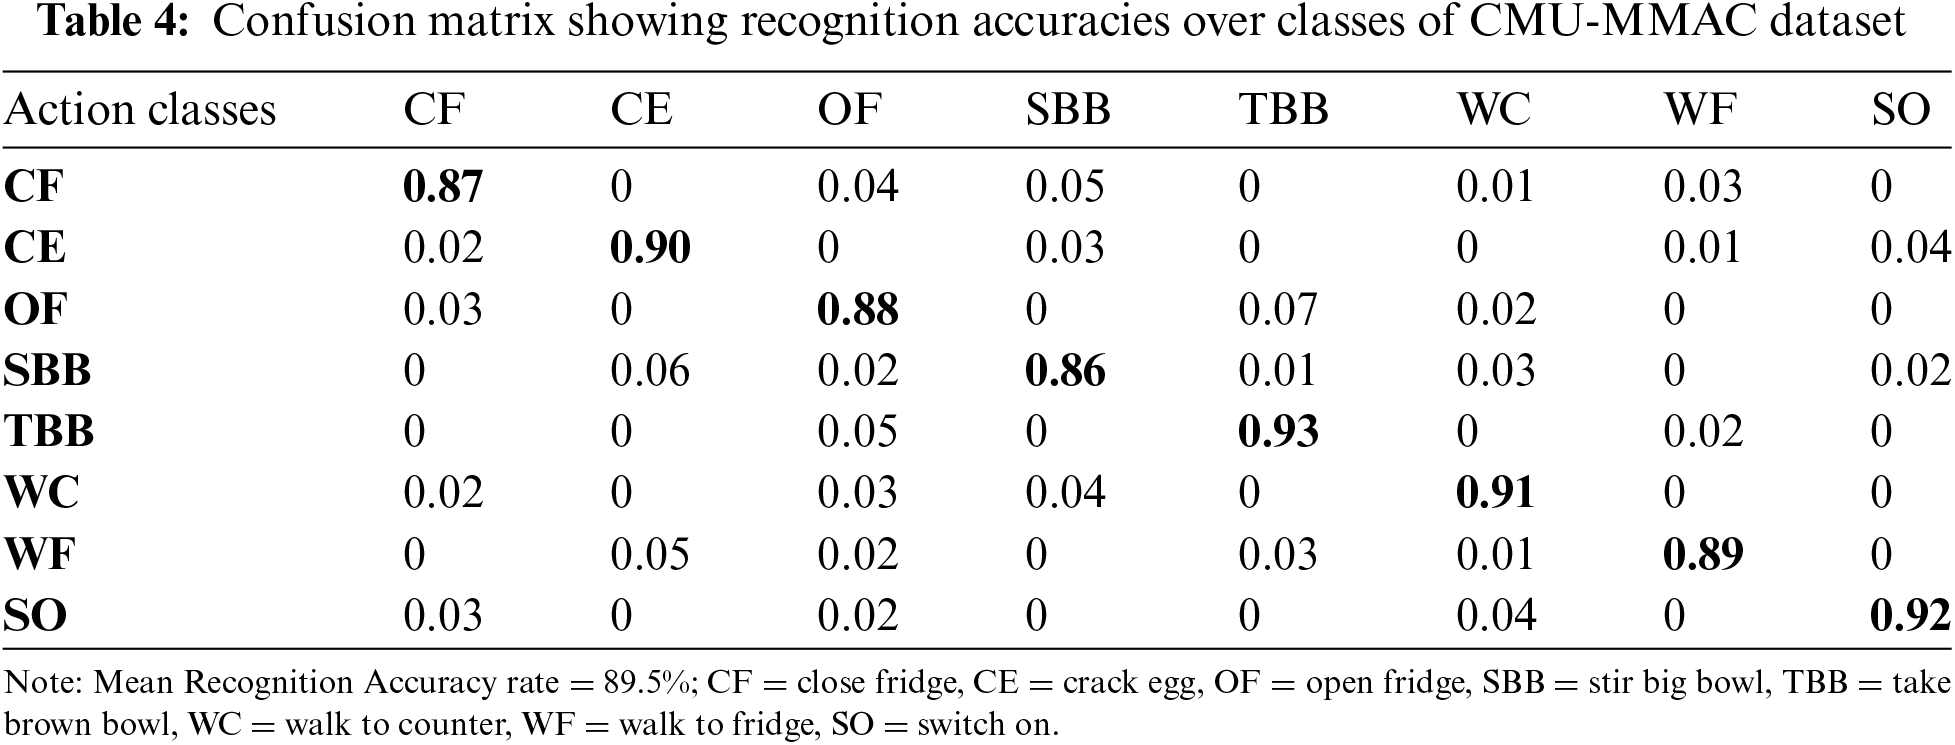
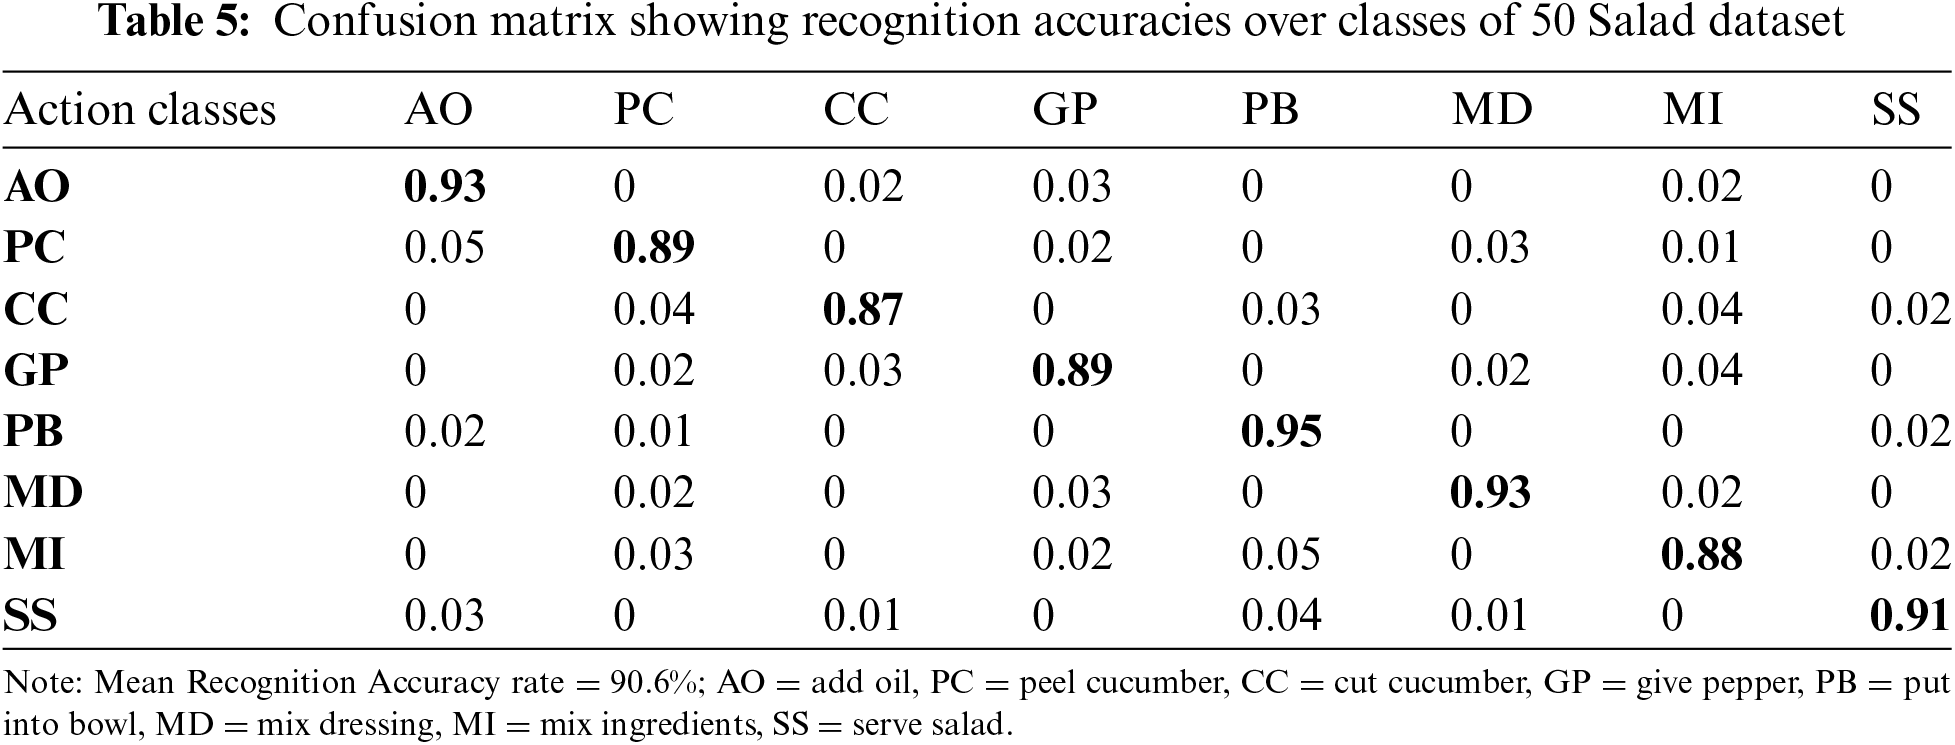
For the evaluation of the proposed system, different action classes of the three datasets have been given to the Masi Entropy (ME) classifier. It recognizes the actions and identifies the rate of recognition. For this purpose, confusion matrices have been created that include individual class accuracies in the form of percentages. The proposed method has shown good results on every dataset used in this paper. Tab. 3 represents the confusion matrix of UTD-MHAD dataset. Tab. 4 represents the confusion matrix of CMU-MMAC dataset. Tab. 5 represents the confusion matrix of 50 Salad dataset.
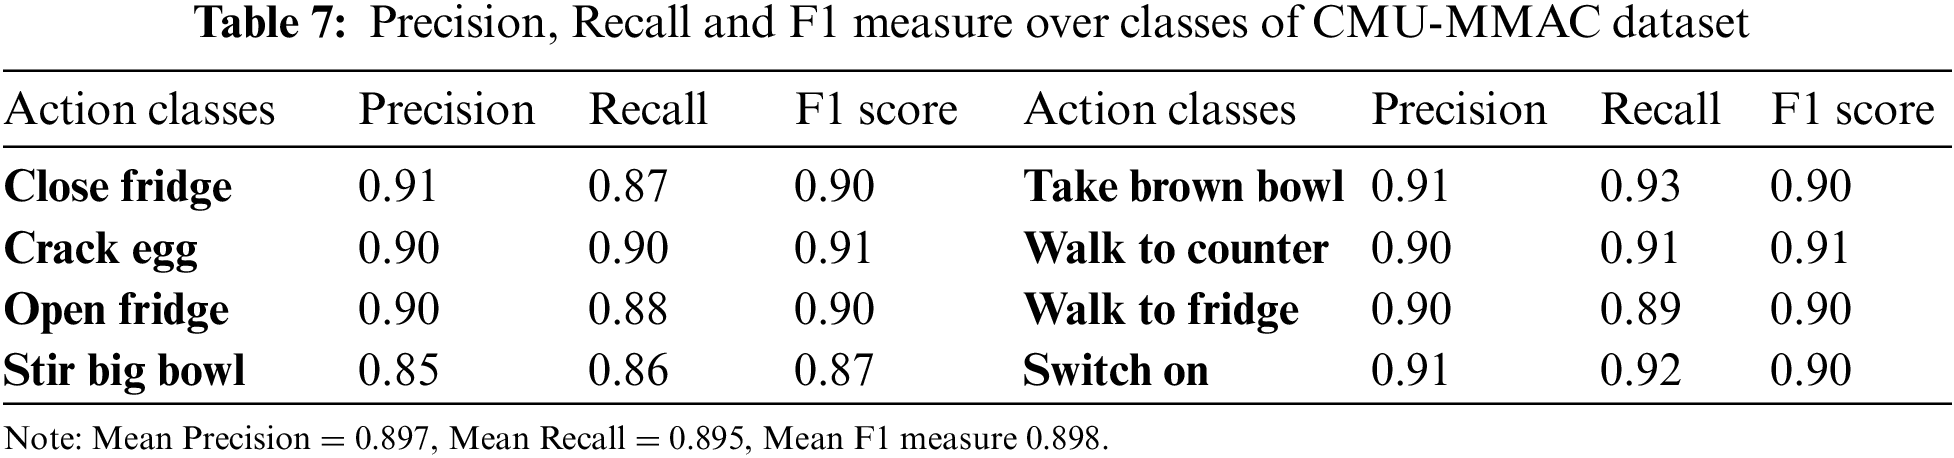
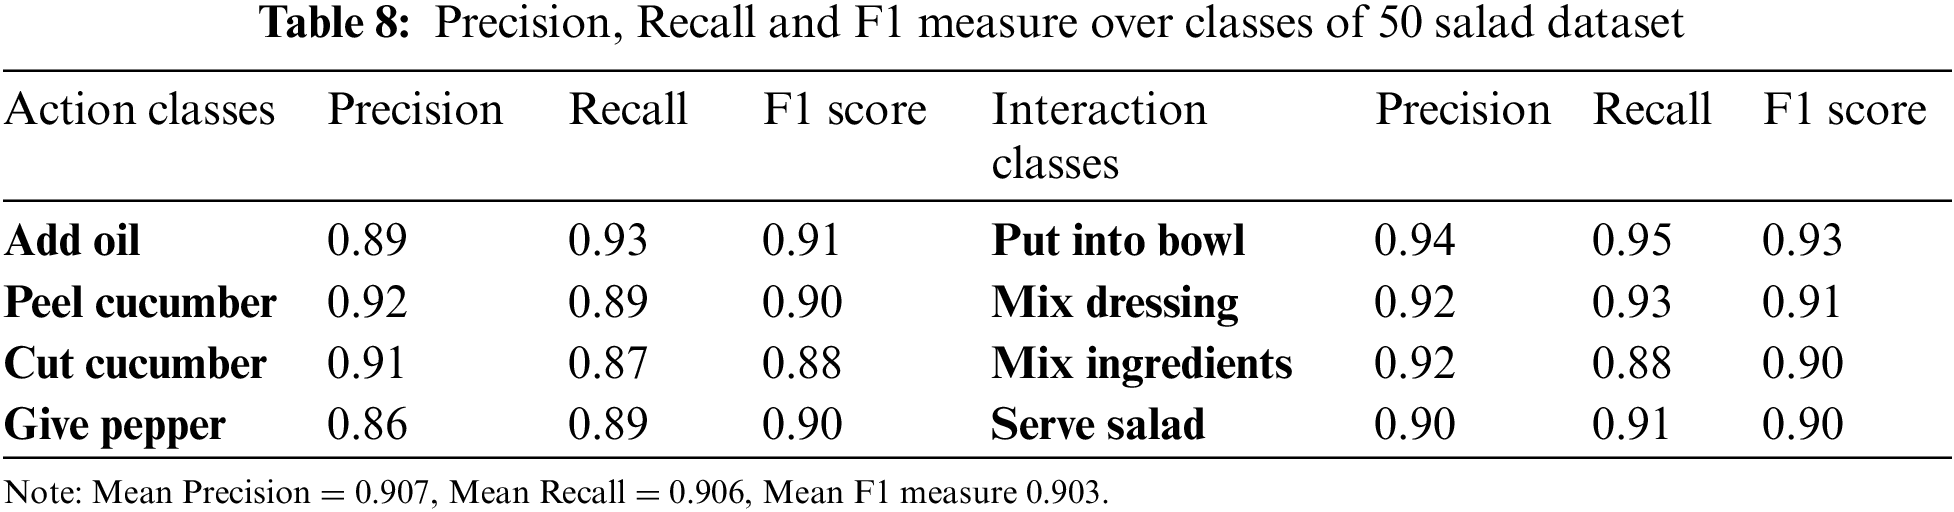
Experiment II: Precision, Recall and F1 measure
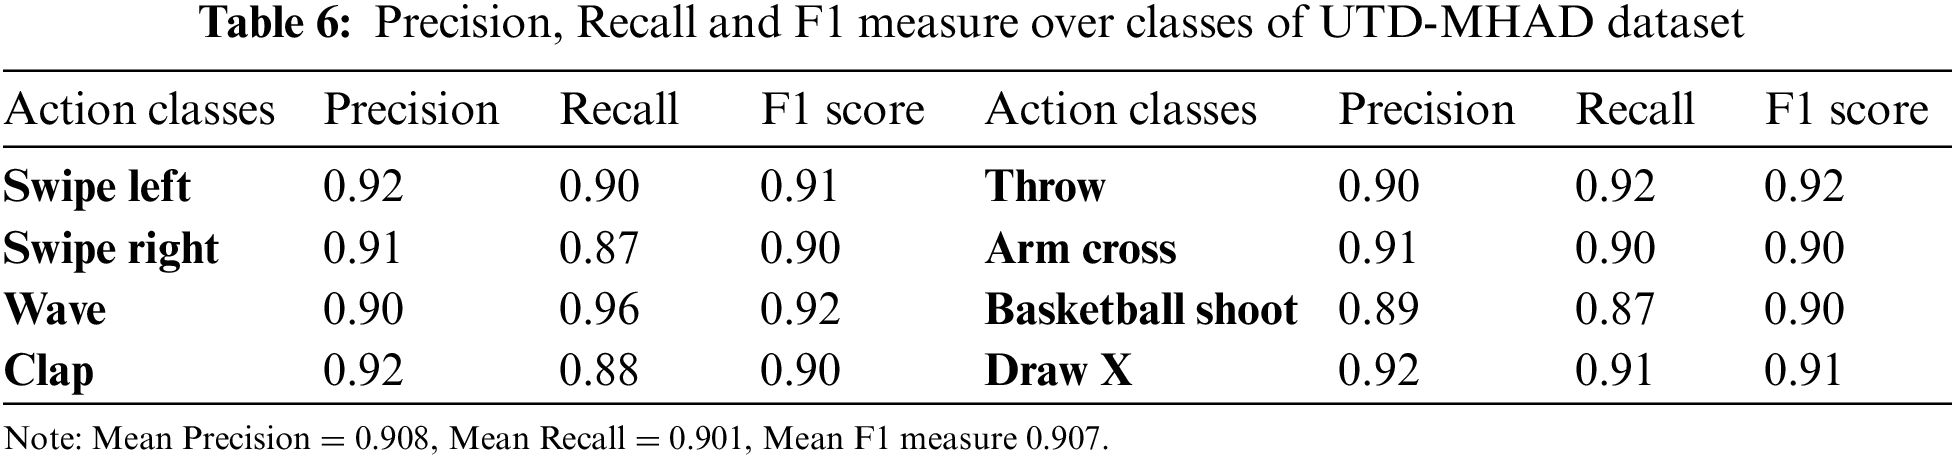
In this experiment, precision, recall, and F1 measure are calculated for different action classes of each dataset. The precision is the fraction of relevant true positive predictions from the total positives. Recall is used to identify all true positives and it is the fraction between correct positives and total positives predicted. The F1 measure combines precision and recall to evaluate the effectiveness of both performance metrics. Tabs. 6–8 show precision, recall, and F1 measures of UTD-MHAD, CMU-MMAC, and 50 Salad datasets. The mean precision, recall, and F1 measure of UTD-MHAD dataset are 90.8%, 90.1%, and 90.7% respectively. While, the mean precision, recall, and F1 measure of CMU-MMAC dataset are 89.7%, 89.5%, and 89.8% respectively. Finally, the mean precision, recall and F1 measure of 50 salad dataset are 90.7%, 90.6%, and 90.3% respectively.
4.2.2 Comparison with Other Systems
In this experiment, the comparison of the proposed methodology with some methods developed in the recent years is performed. The comparisons over the three datasets are shown in Tab. 9. It shows the results of CRC classifier [34], HOG and HOF [35], HMM-MIO [36], RecCapsNet & LSTM [37], OU, AS and VS and OU, AS and VS (sum product and RF) [38].
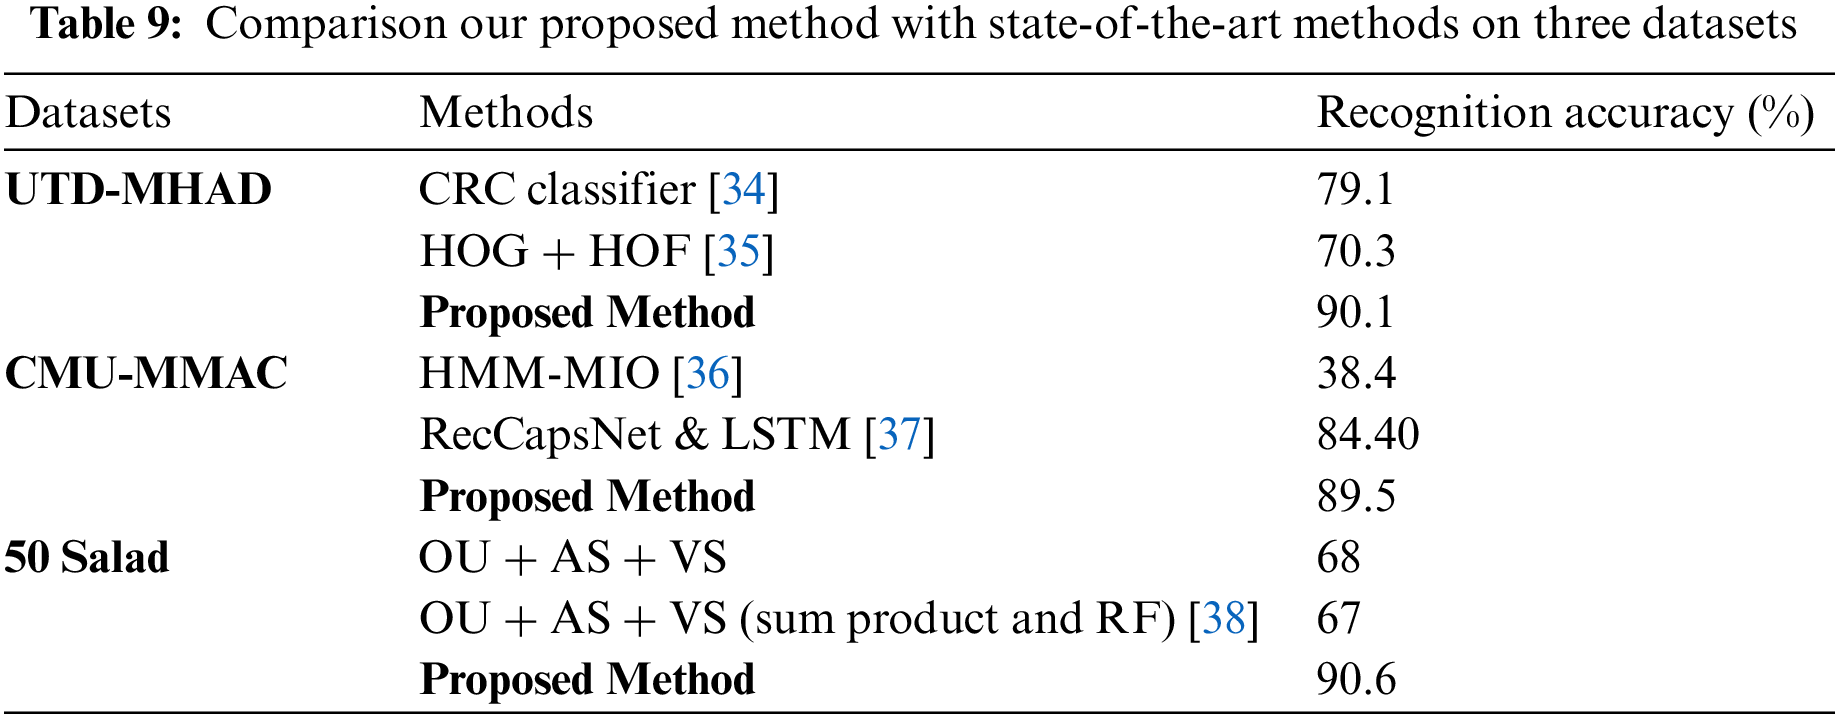
In this paper, we proposed a robust system for HAR that records human actions through multiple sensors and classifies them based on several novel features. The manipulation of hybrid features for the classification of human actions and optimization via Fuzzy Optimization (FO) result in the high accuracy of the system. Masi entropy classifier is used to achieve excellent recognition results. By calculating the mean average rate of recognition for every action class, it is shown that the proposed system shows better performance rates as compared to other state-of-the-art systems.
As future work, we aim to evaluate the proposed system on more challenging human action recognition datasets. Moreover, we plan on enhancing the proposed approach through the use of advanced deep learning models.
Acknowledgement: This research work was supported by Priority Research Centers Program through NRF funded by MEST(2018R1A6A1A03024003) and the Grand Information Technology Research Center support program (IITP-2021-2020-0-01612) supervised by the IITP by MSIT, Korea
Funding Statement: The authors received no specific funding for this study.
Conflicts of Interest: The authors declare that they have no conflicts of interest to report regarding the present study.
References
1. A. Jalal, M. Batool and K. Kim, “Stochastic recognition of physical activity and healthcare using tri-axial inertial wearable sensors,” Applied Sciences, vol. 10, no. 20, pp. 7122, 2020. [Google Scholar]
2. N. Shahar, N. F. Ghazali, M. A. Asari and T. T. Swee, “Wearable inertial sensor for human activity recognition in field hockey: Influence of sensor combination and sensor location,” Journal of Physics: Conference Series, vol. 1529, no. 2, pp. 1–9, 2020. [Google Scholar]
3. M. Javeed, A. Jalal and K. Kim, “Wearable sensors based exertion recognition using statistical features and random forest for physical healthcare monitoring,” in Proc. Int. Conf. on Int. Bhurban Conf. on Applied Sciences and Technologies, Islamabad, Pakistan, pp. 512–517, 2021. [Google Scholar]
4. A. Nadeem, A. Jalal and K. Kim, “Automatic human posture estimation for sport activity recognition with robust body parts detection and entropy Markov model,” Multimedia Tools and Applications, vol. 80, no. 14, pp. 21465–21498, 2021. [Google Scholar]
5. M. Javeed, M. Gochoo, A. Jalal and K. Kim, “HF-SPHR: Hybrid features for sustainable physical healthcare pattern recognition using deep belief networks,” Sustainability, vol. 13, no. 4, pp. 1699, 2021. [Google Scholar]
6. M. Pervaiz, A. Jalal and K. Kim, “Hybrid algorithm for multi people counting and tracking for smart surveillance,” in Proc. Int. Conf. on Int. Bhurban Conf. on Applied Sciences and Technologies, Islamabad, Pakistan, pp. 530–535, 2021. [Google Scholar]
7. S. A. Rizwan, A. Jalal, M. Gochoo and K. Kim, “Robust active shape model via hierarchical feature extraction with SFS-optimized convolution neural network for invariant human age classification,” Electronics, vol. 10, no. 4, pp. 465, 2021. [Google Scholar]
8. I. Akhter, A. Jalal and K. Kim, “Adaptive pose estimation for gait event detection using context-aware model and hierarchical optimization,” Journal of Electrical Engineering & Technology, vol. 16, no. 5, pp. 1–9, 2021. [Google Scholar]
9. A. Jalal, M. Batool and S. B. U. D. Tahir, “Markerless sensors for physical health monitoring system using ECG and GMM feature extraction,” in Proc. Int. Conf. on Int. Bhurban Conf. on Applied Sciences and Technologies, Islamabad, Pakistan, pp. 340–345, 2021. [Google Scholar]
10. I. Jegham, A. B. Khalifa, I. Alouani and M. A. Mahjoub, “Vision-based human action recognition: An overview and real world challenges,” Forensic Science International: Digital Investigation, vol. 32, pp. 1–17, 2020. [Google Scholar]
11. C. H. Chuan, Y. N. Chen and K. C. Fan, “Human action recognition based on action forests model using kinect camera,” in Proc. Int. Conf. on Advanced Information Networking and Applications Workshops, Crans-Montana, Switzerland, pp. 914–917, 2016. [Google Scholar]
12. S. Agahian, F. Negin and C. Köse, “Improving bag-of-poses with semi-temporal pose descriptors for skeleton-based action recognition,” The Visual Computer, vol. 35, no. 4, pp. 591–607, 2019. [Google Scholar]
13. D. C. Luvizon, H. Tabia and D. Picard, “Learning features combination for human action recognition from skeleton sequences,” Pattern Recognition Letters, vol. 99, no. 9, pp. 13–20, 2017. [Google Scholar]
14. J. Qi, Z. Wang, X. Lin and C. Li, “Learning complex Spatio-temporal configurations of body joints for online activity recognition,” IEEE Transactions on Human-Machine Systems, vol. 48, no. 6, pp. 637–647, 2018. [Google Scholar]
15. H. H. Ali, H. M. Moftah and A. A. Youssif, “Depth-based human activity recognition: A comparative perspective study on feature extraction,” Future Computing and Informatics Journal, vol. 3, no. 1, pp. 51–67, 2018. [Google Scholar]
16. N. Khalid, Y. Y. Ghadi, M. Gochoo, A. Jalal and K. Kim, “Semantic recognition of human-object interactions via Gaussian-based elliptical modelling and pixel-level labeling,” IEEE Access, vol. 9, pp. 111249–111266, 2021. [Google Scholar]
17. I. H. L. Nava and A. M. Meléndez, “Human action recognition based on low-and high-level data from wearable inertial sensors,” International Journal of Distributed Sensor Networks, vol. 15, no. 12, pp. 1550147719894532, 2019. [Google Scholar]
18. S. B. U. D. Tahir, A. Jalal and K. Kim, “Wearable inertial sensors for daily activity analysis based on Adam optimization and the maximum entropy Markov model,” Entropy, vol. 22, no. 5, pp. 1–19, 2020. [Google Scholar]
19. A. Jalal, M. A. K. Quaid, S. B. Tahir and K. Kim, “A study of accelerometer and gyroscope measurements in physical life-log activities detection systems,” Sensors, vol. 20, no. 22, pp. 1–22, 2020. [Google Scholar]
20. N. Khalid, M. Gochoo, A. Jalal and K. Kim, “Modeling two-person segmentation and locomotion for stereoscopic action identification: A sustainable video surveillance system,” Sustainability, vol. 13, no. 2, pp. 970, 2021. [Google Scholar]
21. M. Gochoo, S. B. U. D. Tahir, A. Jalal and K. Kim, “Monitoring real-time personal locomotion behaviors over smart indoor-outdoor environments via body-worn sensors,” IEEE Access, vol. 9, pp. 70556–70570, 2021. [Google Scholar]
22. M. Batool, A. Jalal and K. Kim, “Telemonitoring of daily activity using accelerometer and gyroscope in smart home environments,” Journal of Electrical Engineering and Technology, vol. 15, no. 6, pp. 2801–1809, 2020. [Google Scholar]
23. F. Niemann, C. Reining, F. M. Rueda, N. R. Nair, J. A. Steffens et al., “LARa: Creating a dataset for human activity recognition in logistics using semantic attributes,” Sensors, vol. 20, no. 15, pp. 1–42, 2020. [Google Scholar]
24. R. Li, Z. Liu and J. Tan, “Exploring 3D human action recognition: From offline to online,” Sensors, vol. 18, no. 2, pp. 1–24, 2018. [Google Scholar]
25. D. Warchoł and T. Kapuściński, “Human action recognition using bone pair descriptor and distance descriptor,” Symmetry, vol. 12, no. 10, pp. 1580, 2020. [Google Scholar]
26. C. Chen, M. Liu, H. Liu, B. Zhang, J. Han et al., “Multi-temporal depth motion maps-based local binary patterns for 3-D human action recognition,” IEEE Access, vol. 5, pp. 22590–22604, 2017. [Google Scholar]
27. H. A. Sial, M. H. Yousaf and F. Hussain, “Spatio-temporal RGBD cuboids feature for human activity recognition,” The Nucleus, vol. 55, no. 3, pp. 139–149, 2018. [Google Scholar]
28. C. Chen, R. Jafari and N. Kehtarnavaz, “A survey of depth and inertial sensor fusion for human action recognition,” Multimedia Tools and Applications, vol. 76, no. 3, pp. 4405–4425, 2017. [Google Scholar]
29. A. Jalal, A. Ahmed, A. Rafique and K. Kim, “Scene semantic recognition based on modified fuzzy c-mean and maximum entropy using object-to-object relations,” IEEE Access, vol. 9, pp. 27758–27772, 2021. [Google Scholar]
30. A. K. M. Khairuzzaman and S. Chaudhury, “Masi entropy based multilevel thresholding for image segmentation,” Multimedia Tools and Applications, vol. 78, no. 23, pp. 33573–33591, 2019. [Google Scholar]
31. C. Chen, R. Jafari and N. Kehtarnavaz, “UTD-MHAD: A multimodal dataset for human action recognition utilizing a depth camera and a wearable inertial sensor,” in Proc. Int. Conf. on Image Processing, Quebec City, QC, Canada, pp. 168–172, 2015. [Google Scholar]
32. S. Stein and S. J. McKenna, “Combining embedded accelerometers with computer vision for recognizing food preparation activities,” in Proc. Int. Conf. on Pervasive and Ubiquitous Computing, Zurich, Switzerland, pp. 729–738, 2013. [Google Scholar]
33. E. H. Spriggs, F. D. L. Torre and M. Hebert, “Temporal segmentation and activity classification from first-person sensing,” in Proc. Int. Conf. on Computer Vision and Pattern Recognition, Miami, USA, pp. 1–6, 2009. [Google Scholar]
34. I. Serrano, O. Deniz, G. Bueno, G. G. Hernando and T. K. Kim, “Spatio-temporal elastic cuboid trajectories for efficient fight recognition using Hough forests,” Machine Vision and Applications, vol. 29, no. 2, pp. 207–217, 2018. [Google Scholar]
35. A. B. Mahjoub and M. Atri, “Human action recognition using RGB data,” in Proc. Int. Conf. on Design & Test Sym. (IDT), Hammamet, Tunisia, pp. 83–87, 2016. [Google Scholar]
36. Z. Ren, Q. Zhang, X. Gao, P. Hao and J. Cheng, “Multi-modality learning for human action recognition,” Multimedia Tools and Applications, vol. 80, no. 11, pp. 16185–16203, 2021. [Google Scholar]
37. J. Carvajal, C. McCool, B. Lovell and C. Sanderson, “Joint recognition and segmentation of actions via probabilistic integration of spatio-temporal Fisher vectors,” in Proc. Int. Conf. on Knowledge Discovery and Data Mining, Auckland, New Zealand, pp. 115–127, 2016. [Google Scholar]
38. Y. Lu and S. Velipasalar, “Human activity classification incorporating egocentric video and inertial measurement unit data,” in Proc. Int. Conf. on Signal and Information Processing, Anaheim, CA, USA, pp. 429–433, 2018. [Google Scholar]
 | This work is licensed under a Creative Commons Attribution 4.0 International License, which permits unrestricted use, distribution, and reproduction in any medium, provided the original work is properly cited. |