| Computers, Materials & Continua DOI:10.32604/cmc.2022.023919 | |
| Article |
Intelligent Deep Learning Based Multi-Retinal Disease Diagnosis and Classification Framework
1College of Computer Engineering and Sciences, Prince Sattam bin Abdulaziz University, Al-Kharj, 16278, Saudi Arabia
2Saveetha School of Engineering, Saveetha Institute of Medical and Technical Sciences, Saveetha Nagar, Thandalam, Chennai, 602105, India
3Department of Medical Equipment Technology, College of Applied Medical Sciences, Majmaah University, Al Majmaah, 11952, Saudi Arabia
4Saveetha School of Engineering, Saveetha Institute of Medical and Technical Sciences, Chennai, 602105, India
5Department of Electronics and Communication Engineering, College of Engineering & Technology, SRM Institute of Science and Technology, Vadapalani Campus, Chennai, 600026, India
6Department of Applied Data Science, Noroff University College, Kristiansand, 4608, Norway
7Department of Computer Techniques Engineering, Al-Mustaqbal University College, Hillah, Babil, 51001, Iraq
8Department of Computer Science and Engineering, Soonchunhyang University, Asan, 31538, Korea
*Corresponding Author: Yunyoung Nam. Email: ynam@sch.ac.kr
Received: 26 September 2021; Accepted: 01 December 2021
Abstract: In past decades, retinal diseases have become more common and affect people of all age grounds over the globe. For examining retinal eye disease, an artificial intelligence (AI) based multilabel classification model is needed for automated diagnosis. To analyze the retinal malady, the system proposes a multiclass and multi-label arrangement method. Therefore, the classification frameworks based on features are explicitly described by ophthalmologists under the application of domain knowledge, which tends to be time-consuming, vulnerable generalization ability, and unfeasible in massive datasets. Therefore, the automated diagnosis of multi-retinal diseases becomes essential, which can be solved by the deep learning (DL) models. With this motivation, this paper presents an intelligent deep learning-based multi-retinal disease diagnosis (IDL-MRDD) framework using fundus images. The proposed model aims to classify the color fundus images into different classes namely AMD, DR, Glaucoma, Hypertensive Retinopathy, Normal, Others, and Pathological Myopia. Besides, the artificial flora algorithm with Shannon’s function (AFA-SF) based multi-level thresholding technique is employed for image segmentation and thereby the infected regions can be properly detected. In addition, SqueezeNet based feature extractor is employed to generate a collection of feature vectors. Finally, the stacked sparse Autoencoder (SSAE) model is applied as a classifier to distinguish the input images into distinct retinal diseases. The efficacy of the IDL-MRDD technique is carried out on a benchmark multi-retinal disease dataset, comprising data instances from different classes. The experimental values pointed out the superior outcome over the existing techniques with the maximum accuracy of 0.963.
Keywords: Multi-retinal disease; computer aided diagnosis; fundus images; deep learning; segmentation; intelligent models
Retinal diseases are appeared as a common issue for aged people that degrades the power of the eyes, because of the blurred visualization and it results even in vision loss. The retina is one of the photosensitive layers, which is placed as a thin layer inside the eye. The retinal disease affects eye vision owing to blurred visualization and occasionally a whole vision loss [1]. The retina is affected by various infections like age-based molecular degeneration (AMD), diabetic retinopathy (DR), Diabetic Macular Edema (DME), Glaucoma, etc. The conventional eye disease diagnosis models are found to be a time-consuming task and require expert knowledge.
Macular diseases are the important causes of vision loss among elderly population and adults [2]. The macula, located at the central area of the retina, is accountable for central and sharp visions that let us view objects that are directly ahead. If the macular tissues become abnormally damaged or disordered, the lesions will appear. The numbers and types of lesions often determine the category and severity of eye diseases. For example, lesions, such as epiretinal membrane (ERM), edema, drusens, or cysts, are associated with various common diseases, e.g., age related macular degeneration and DR [3]. Therefore, detection and recognition of the retinal macular lesions are crucial for the clinical diagnosis and treatment of ophthalmopathy. It is predicted that around six hundred million people would have diabetes in 2040, with one-third anticipated to have DR, the major causes of blindness in working age adults around the world [4]. Mild NPDR is the earlier phase of DR, i.e., considered as the existence of microaneurysm. PDR is one of the innovative phases of DR and could lead to serious vision loss. Regular DR screening is significant thus appropriate treatment could be performed for preventing vision loss. Earlier phase interference through blood pressure and glycemia control could slow-down the development of DR and later phase intervention via intravitreal injection/photocoagulation could decrease vision loss. In Iceland and UK, systematic national DR screening has been conducted, DR is no longer the major cause of vision loss amongst working age adults. Even though routine DR screening is suggested with each research community, comprehensive DR screening is not extensively implemented, overcoming the problems associated with the accessibility of human assessors.
As subtle retinal lesions may not be obvious on ophthalmoscopy, retinal imaging technology has been rapidly developed during the past decades. Optical coherence tomography (OCT) is a non-invasive imaging technique, which utilizes infrared-light interferometry to image through the eye, aiming to see the structures beyond their surface. Recently, the advanced OCT technique can achieve a three-dimensional (3-D) tomography imaging of the eye with micrometer resolution, providing ophthalmologists the ability to visualize different types of lesions and thus assisting macular diagnosis and treatment. In the medical diagnoses, ophthalmologist frequently needs to automatically detect the presence of various macular cancers at all cross sections of the OCT volume. Such work is tedious, repetitive, and time consuming, which causes serious problems for the early detection and timely treatment of eye diseases. Therefore, development of automatic OCT image analysis techniques is an efficient way to provide supplemental information and support medical decisions for clinicians and ophthalmologists.
In recent times, deep learning algorithm has assisted computer to learn from huge dataset in a manner which exceeds human abilities in various fields [5–7]. Many DL approaches using higher sensitivity and specificity were proposed for the detection/classification of specific disease conditions depending on medicinal images, involving retinal images. Present DL system for DR screening was mainly focused on the recognition of persons with vision threatening/DR referrable DR (worse/moderate NPDR) that implies the patient must be stated to ophthalmologist for closer follow-up/treatments [7]. But, the significance of detecting earlier phase DR should not be ignored. Evidence suggests that appropriate interference at an earlier phase to attain optimum controlling of blood pressure, lipid profiles, and glucose can considerably delay the development of DR and even reverse mild NPDR to DR free stages.
This paper presents an intelligent deep learning based multi-retinal disease diagnosis (IDL-MRDD) framework using fundus images. The proposed model aims to classify the color fundus images into different classes namely AMD, DR, Glaucoma, Hypertensive Retinopathy, Normal, Others, and Pathological_Myopia. In addition, the artificial flora algorithm with Shannon’s function (AFA-SF) based multi-level thresholding technique is employed for image segmentation. Furthermore, SqueezeNet based feature extractor is employed to generate a collection of feature vectors. Lastly, the stacked sparse Autoencoder (SSAE) model is used for the classification of multi-retinal diseases. A wide range of simulations is performed to point out the enhanced performance of the IDL-MRDD technique on a benchmark multi-retinal disease dataset, comprising data instances from different classes.
In Karthikeyan et al. [8], DCNN based ML method was employed to detect the 12 main retinal problems from the minimum set of fundus images. Further, the method has been cross-validated using real time fundus images. The method is established to be dominant in its ability, specificity, and efficacy for minimizing misclassification. Fauw et al. [9] employed a new DL framework to clinical heterogeneous sets of 3D optical coherence tomography scans from a patient refer to the main eye hospital. They determine efficiency in creating a suggestion which exceeds/reaches that of experts on a range of sight threatening retinal diseases afterward training over 14,884 scans. Mihalov et al. [10] presented a DL method based software framework for retinal disease diagnoses. The multiclass disease classifications are depending on CNN trained by an OCT B scan image. The TL and Data augmentation is utilized for overcoming few requirements and limitations of DL use in ophthalmology. The DL classifications are incorporated in a software platform i.e., usable, easily available, secure, and reliable.
Jain et al. [11] intended to manually categorize images using retinal problems from this healthier on without implementing any feature extraction/explicit segmentation. Instead, they utilize a DL method for manually classifying any retinal fundus image as diseased/healthy. The framework of the networks is fast and simple. The method was verified on 2 datasets, involving real person retinal fundus images attained from nearby hospitals. Rajagopalan et al. [12] proposed a DCNN architecture for the classification and diagnosis of Average, DME, and DMD efficiently. Firstly, despeckling of the input OCT image is executed by the Kuan filters for removing inherent speckle noise. Furthermore, the CNN networks are tuned with hyper-parameter optimization methods. Moreover, K-fold validations are performed to guarantee full use of the datasets. Arunkumar et al. [13] introduced the retina based disease diagnoses with DL method based FE approach. This method assists in emerging automatic screening systems, i.e., able to diagnose retina for the diseases like DR, age related molecular degeneration, retinoblastoma, macular bunker, retinitis pigmentosa, and retinal detachment. Few diseases share a standard feature that makes the classification complex. For overcoming the aforementioned problems, DL-FE and multiclass SVM classifiers are employed.
Li et al. [14] presented a new self-supervised feature learning approach by efficiently using multimodal data for retinal disease diagnoses. For this purpose, initially, synthesize the respective FFA modal and later create a person feature based softmax embedding objective. The objectives learn person similarity feature and modality invariant feature. Using this method, the NN captures the semantically distributed data through distinct modals and the obvious visual similarities among the persons. This approach is tested on 2 public standard data sets for retinal disease diagnoses. Yoo et al. [15] exhibit that FSL with a GAN approach could enhance the applicability of the DL method in OCT diagnoses of uncommon diseases. The 4 main groups with a huge amount of datasets and 5 uncommon diseases classes with FSL datasets are involved in this work. Beforehand training the classifiers, they created GAN model for generating pathological OCT images of all uncommon diseases from average OCT images. The Inception-v3 framework has been trained by increased training datasets, and the last method was authenticated by a separate test data set. Yan et al. [16] examined the segmentation of thin and thick vessels individually by suggesting a 3 phase DL method. The vessel segmentation tasks are separated into 3 phases, such as thin vessel segmentation, vessel fusion, and thick vessel segmentation. Since, better discriminative features can be learned to split segmentation of thin vessels and thick vessels, this method reduces the negative impact created by their high imbalanced ratio. The last vessel fusion phase improves the result by additionally detecting non-vessel pixels and improve the entire vessel thickness reliability.
In this study, a new multi-retinal disease diagnosis model using IDL-MRDD technique is presented to determine different types of retinal diseases. The IDL-MRDD technique method involves pre-processing in three stages such as image resizing, noise removal, and contrast improvement. Fig. 1 illustrates the overall block diagram of IDL-MRDD model. The detailed working of these processes is given in the succeeding sections.
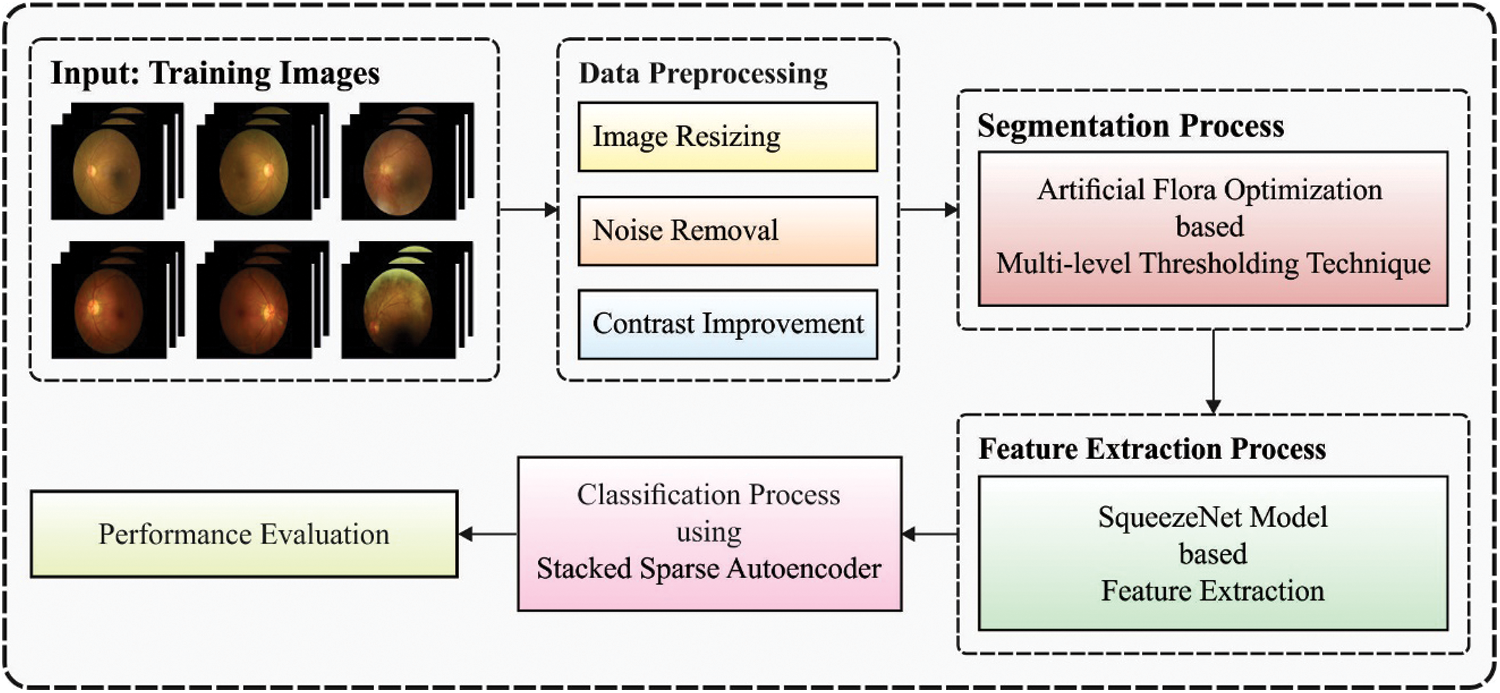
Figure 1: Block diagram of IDL-MRDD model
3.1 Design of AFA-SF Based Segmentation Technique
At this stage, the preprocessed retinal fundus images are applied as input to the AFA-SF technique. Entropy is generally adapted for computing the uncertainty of a parameter [17]. The process is given below: Select an image frame of size
The standardized histogram of the image could be denoted by
For multi-thresholding problems, the aforementioned formula could be given by;
where
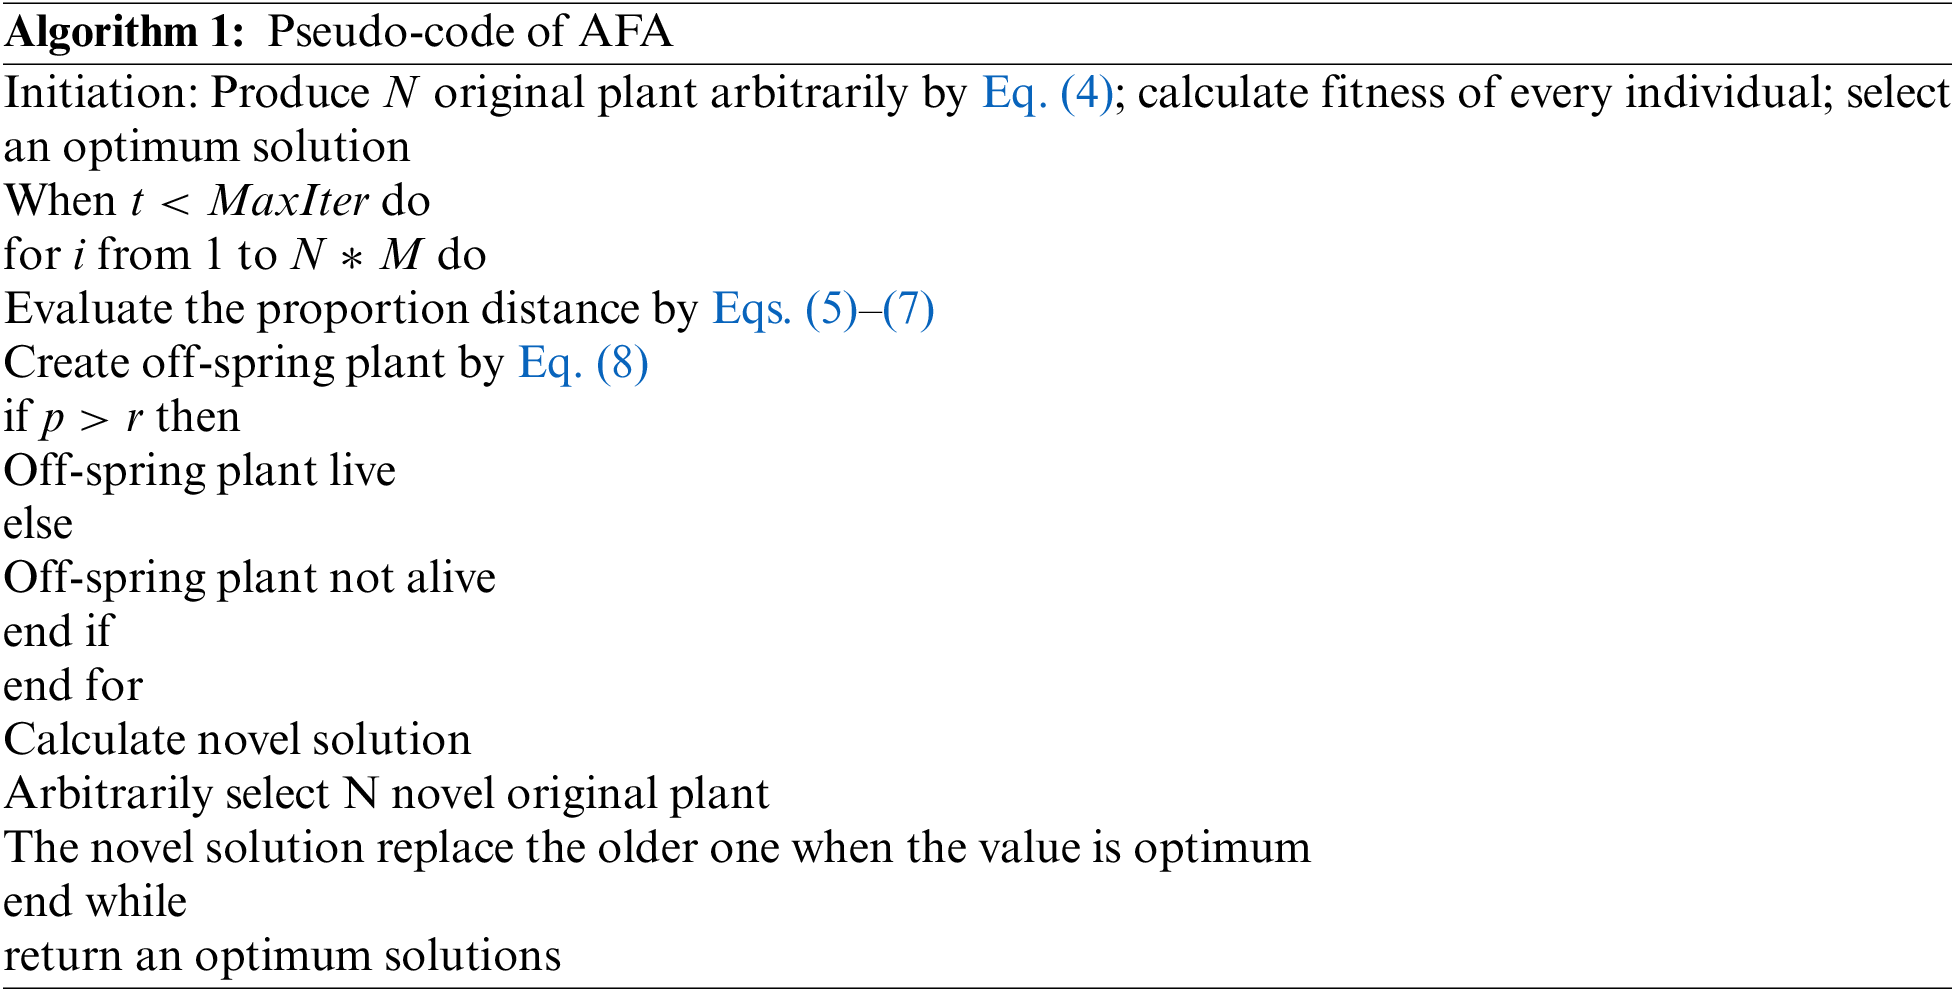
The AFA is a state-of-art SI based optimization method presented by Cheng et al. [18] and it can be depending upon flora migration and reproduction procedure. It is established on six standard operations and demonstrates powerful exploration capability with fast convergences. In this method, the original plant is generated primarily and the scattered seed, are known as off-spring plants, with a specific distance. Initially, the early population is created arbitrarily with
Whereas the original plant position is represented as
where propagation distances of grandparent and parent plants denote
The novel parent spreading distance is given as follows:
The off-spring plant locations near the original plant are estimated as:
where
where the chosen likelihood is represented as
3.2 SSAE Based Image Classification
During image classification, the feature vectors are fed into the SSAE model to allot proper class labels to it. Related to SAE, training an SSAE includes detecting an optimum parameter
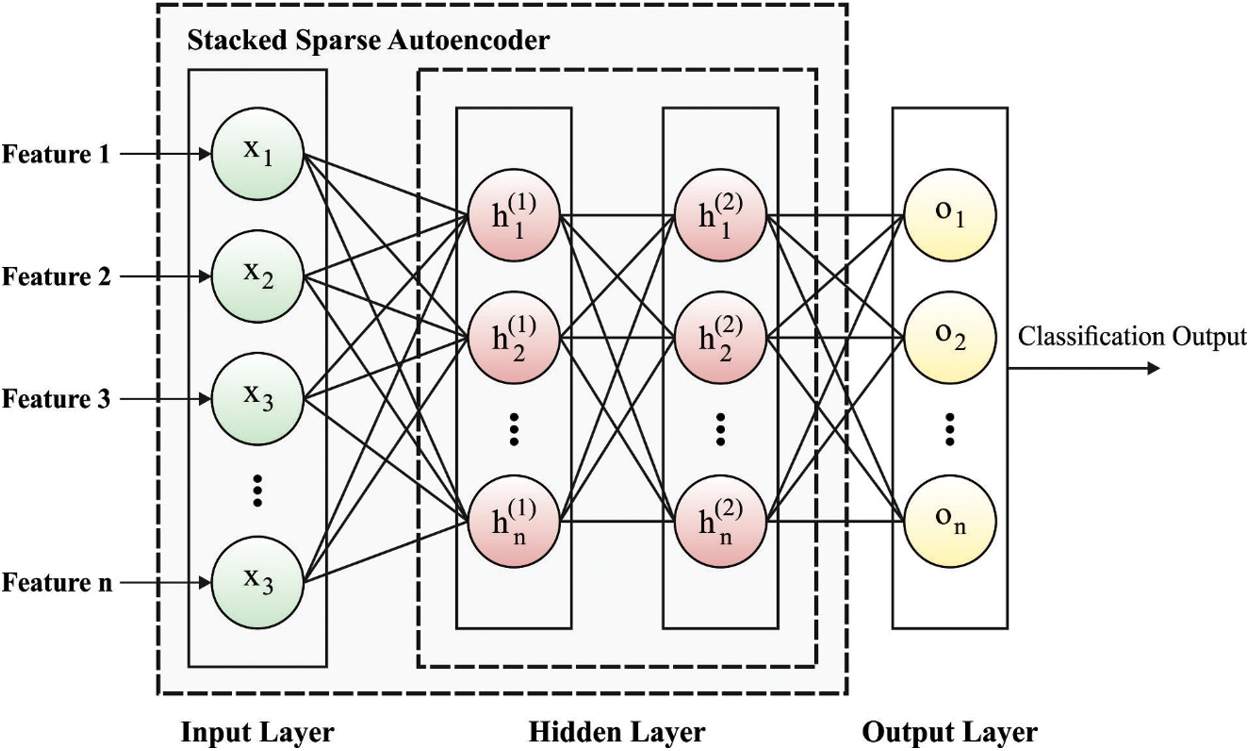
Figure 2: Framework of SSAE
In SSAE model, every training patch
whereas
This section examines the performance of the IDL-MRDD technique against a benchmark dataset [21], which consists of 200 images under AMD class, 200 images under DR class, 200 images under Glaucoma class, 92 images under Hypertensive_Retinopathy (HR), 200 images under Normal, 200 images under Others, and 200 images under Pathological Myopia. Few sample test images are provided in Fig. 3. The size of images is 1444 × 1444 and 2304 × 1728.
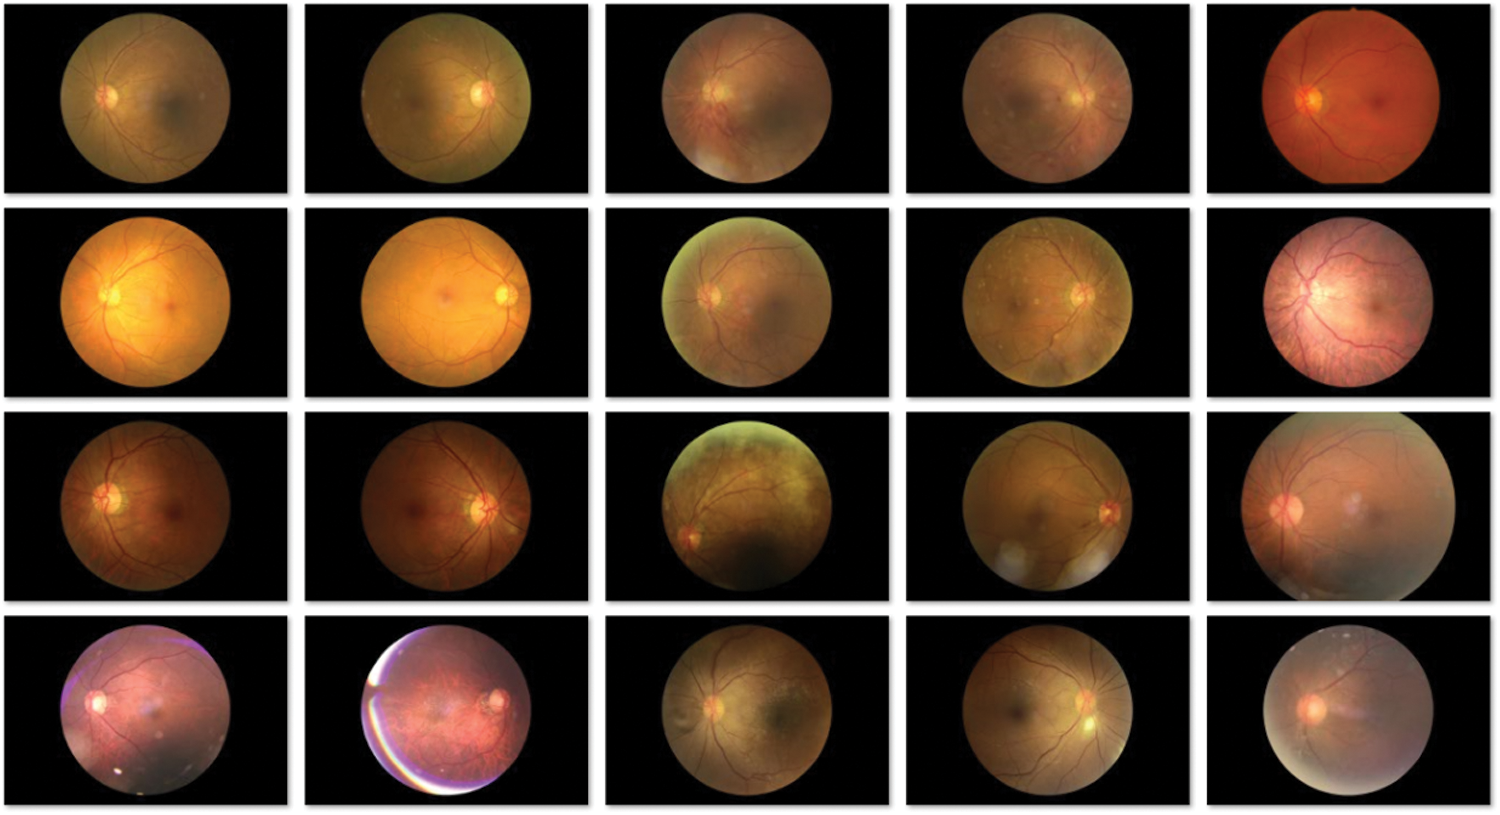
Figure 3: Sample images
Fig. 4 shows the confusion matrices generated by the IDL-MRDD technique on the classification of multi-retinal diseases with distinct training/testing sizes. On the applied training/testing sizes of 60:40, the IDL-MRDD technique has classified the AMD, DR, Glaucoma, HR, Normal, Others, and PM into 133, 194, 124, 88, 197, 200, and 155 respectively. Besides, on the applied training/testing sizes of 70:30, the IDL-MRDD approach has classified the AMD, DR, Glaucoma, HR, Normal, Others, and PM into 145, 196, 138, 92, 197, 200, and 153 correspondingly. Additionally, on the applied training/testing sizes of 80:20, the IDL-MRDD method has classified the AMD, DR, Glaucoma, HR, Normal, Others, and PM into 155, 198, 150, 92, 197, 200, and 164 correspondingly.
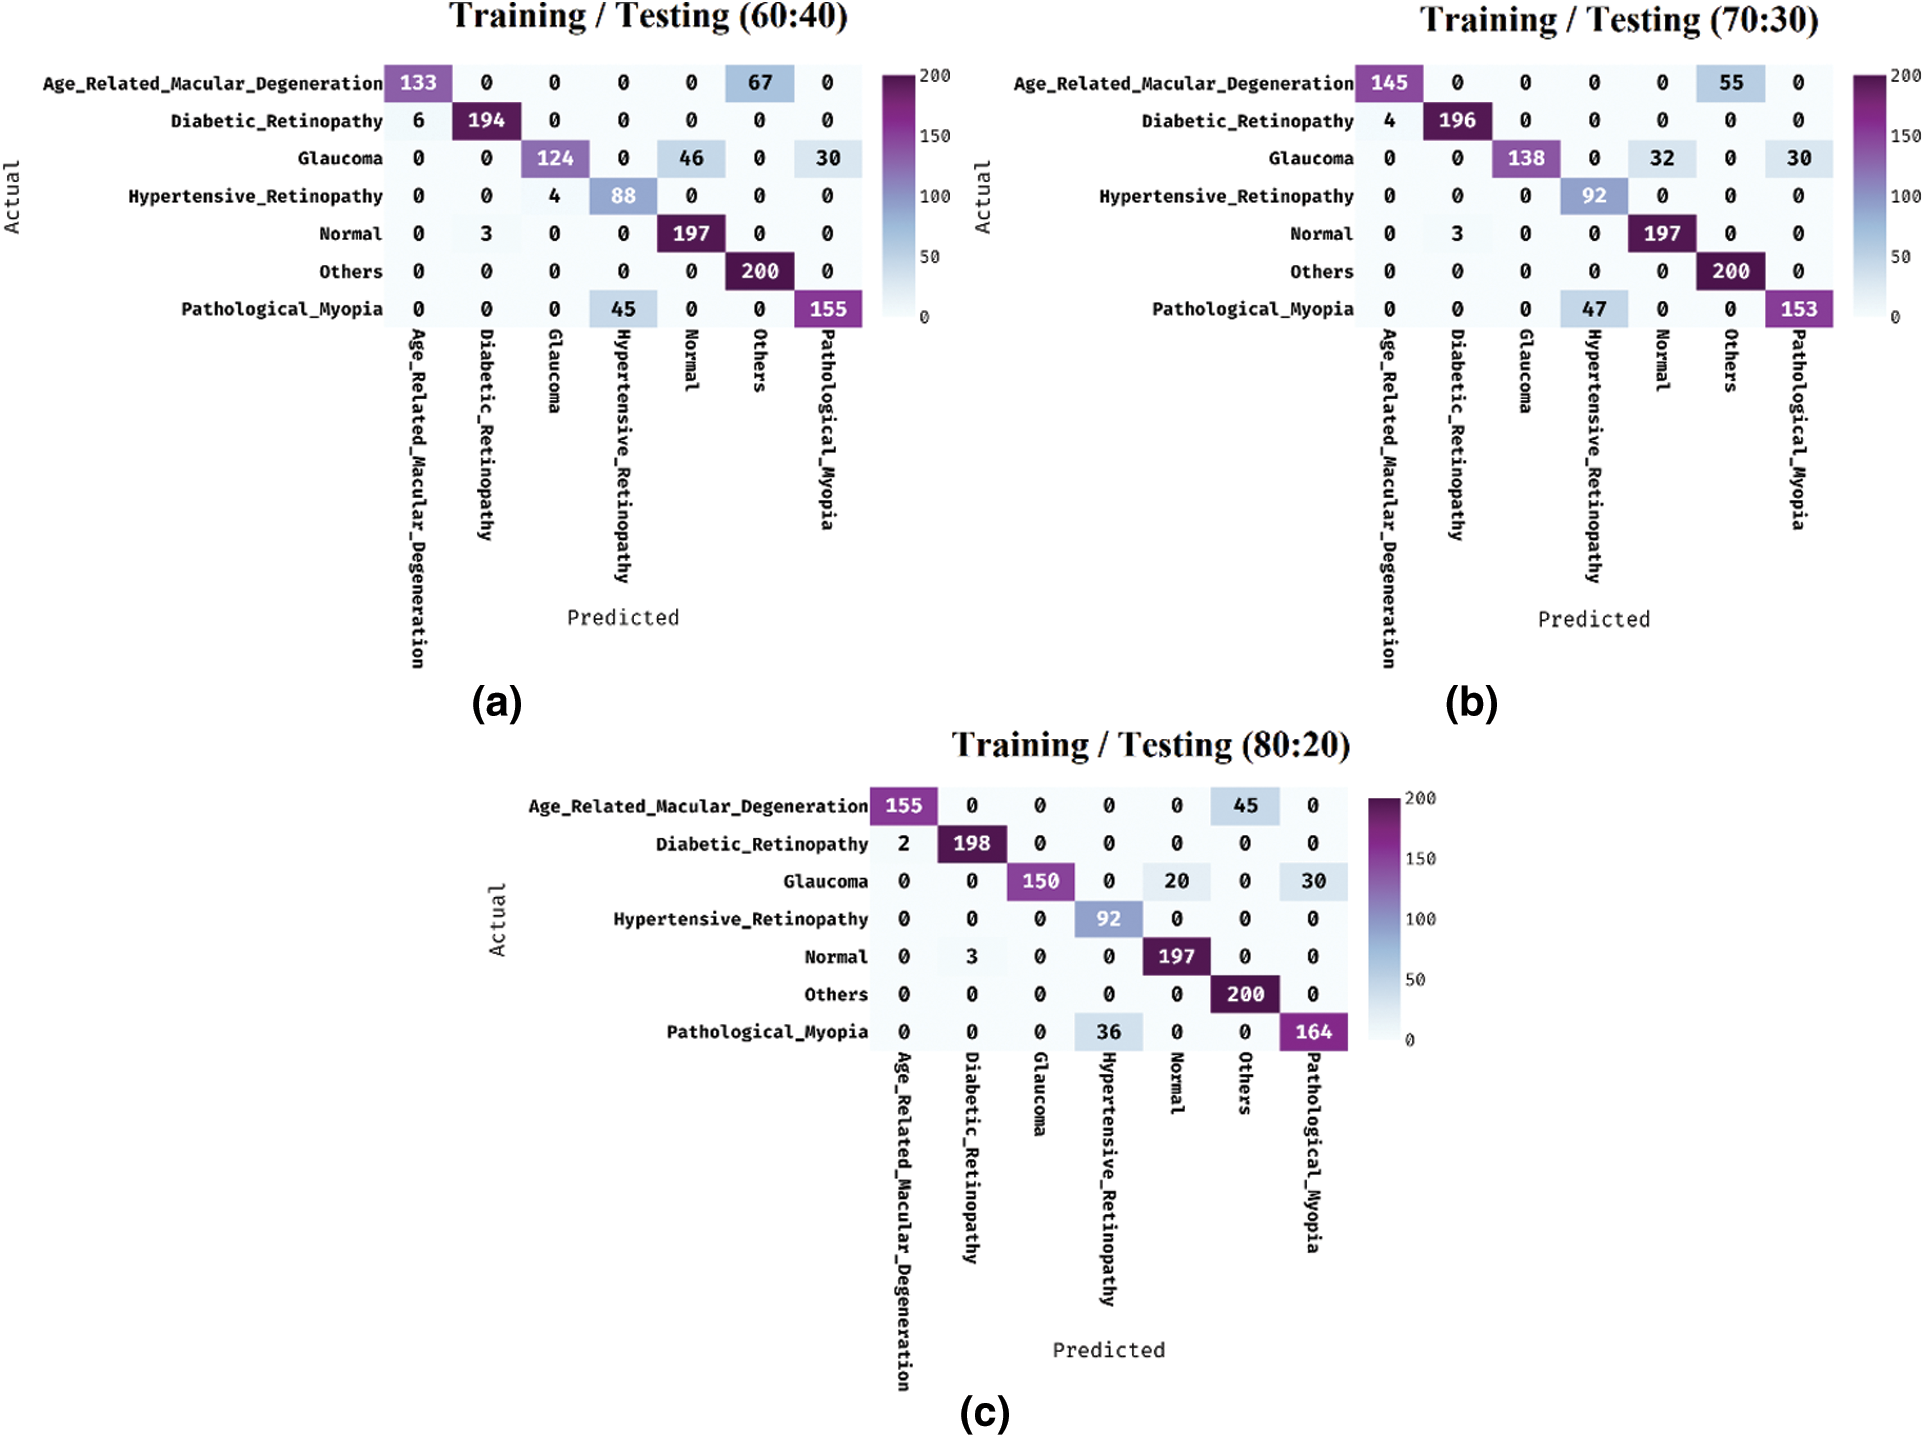
Figure 4: Confusion matrix analysis of IDL-MRDD model
Tab. 1 provides the overall classification results of the IDL-MRDD technique under distinct classes and training/testing sizes. The table values denoted that the IDL-MRDD technique has resulted in effective classification outcomes on all the applied classes. For instance, with training/testing size of 60:40, the IDL-MRDD technique has classified the AMD, DR, Glaucoma, HR, Normal, Others, and PM by obtaining an accuracy of 0.944, 0.993, 0.938, 0.962, 0.962, 0.948, and 0.942 respectively. In the meantime, with training/testing size of 70:30, the IDL-MRDD manner has classified the AMD, DR, Glaucoma, HR, Normal, Others, and PM by attaining an accuracy of 0.954, 0.995, 0.952, 0.964, 0.973, 0.957, and 0.940 correspondingly. Likewise, with training/testing size of 80:20, the IDL-MRDD methodology has classified the AMD, DR, Glaucoma, HR, Normal, Others, and PM by reaching an accuracy of 0.964, 0.996, 0.961, 0.972, 0.982, 0.965, and 0.949 correspondingly.
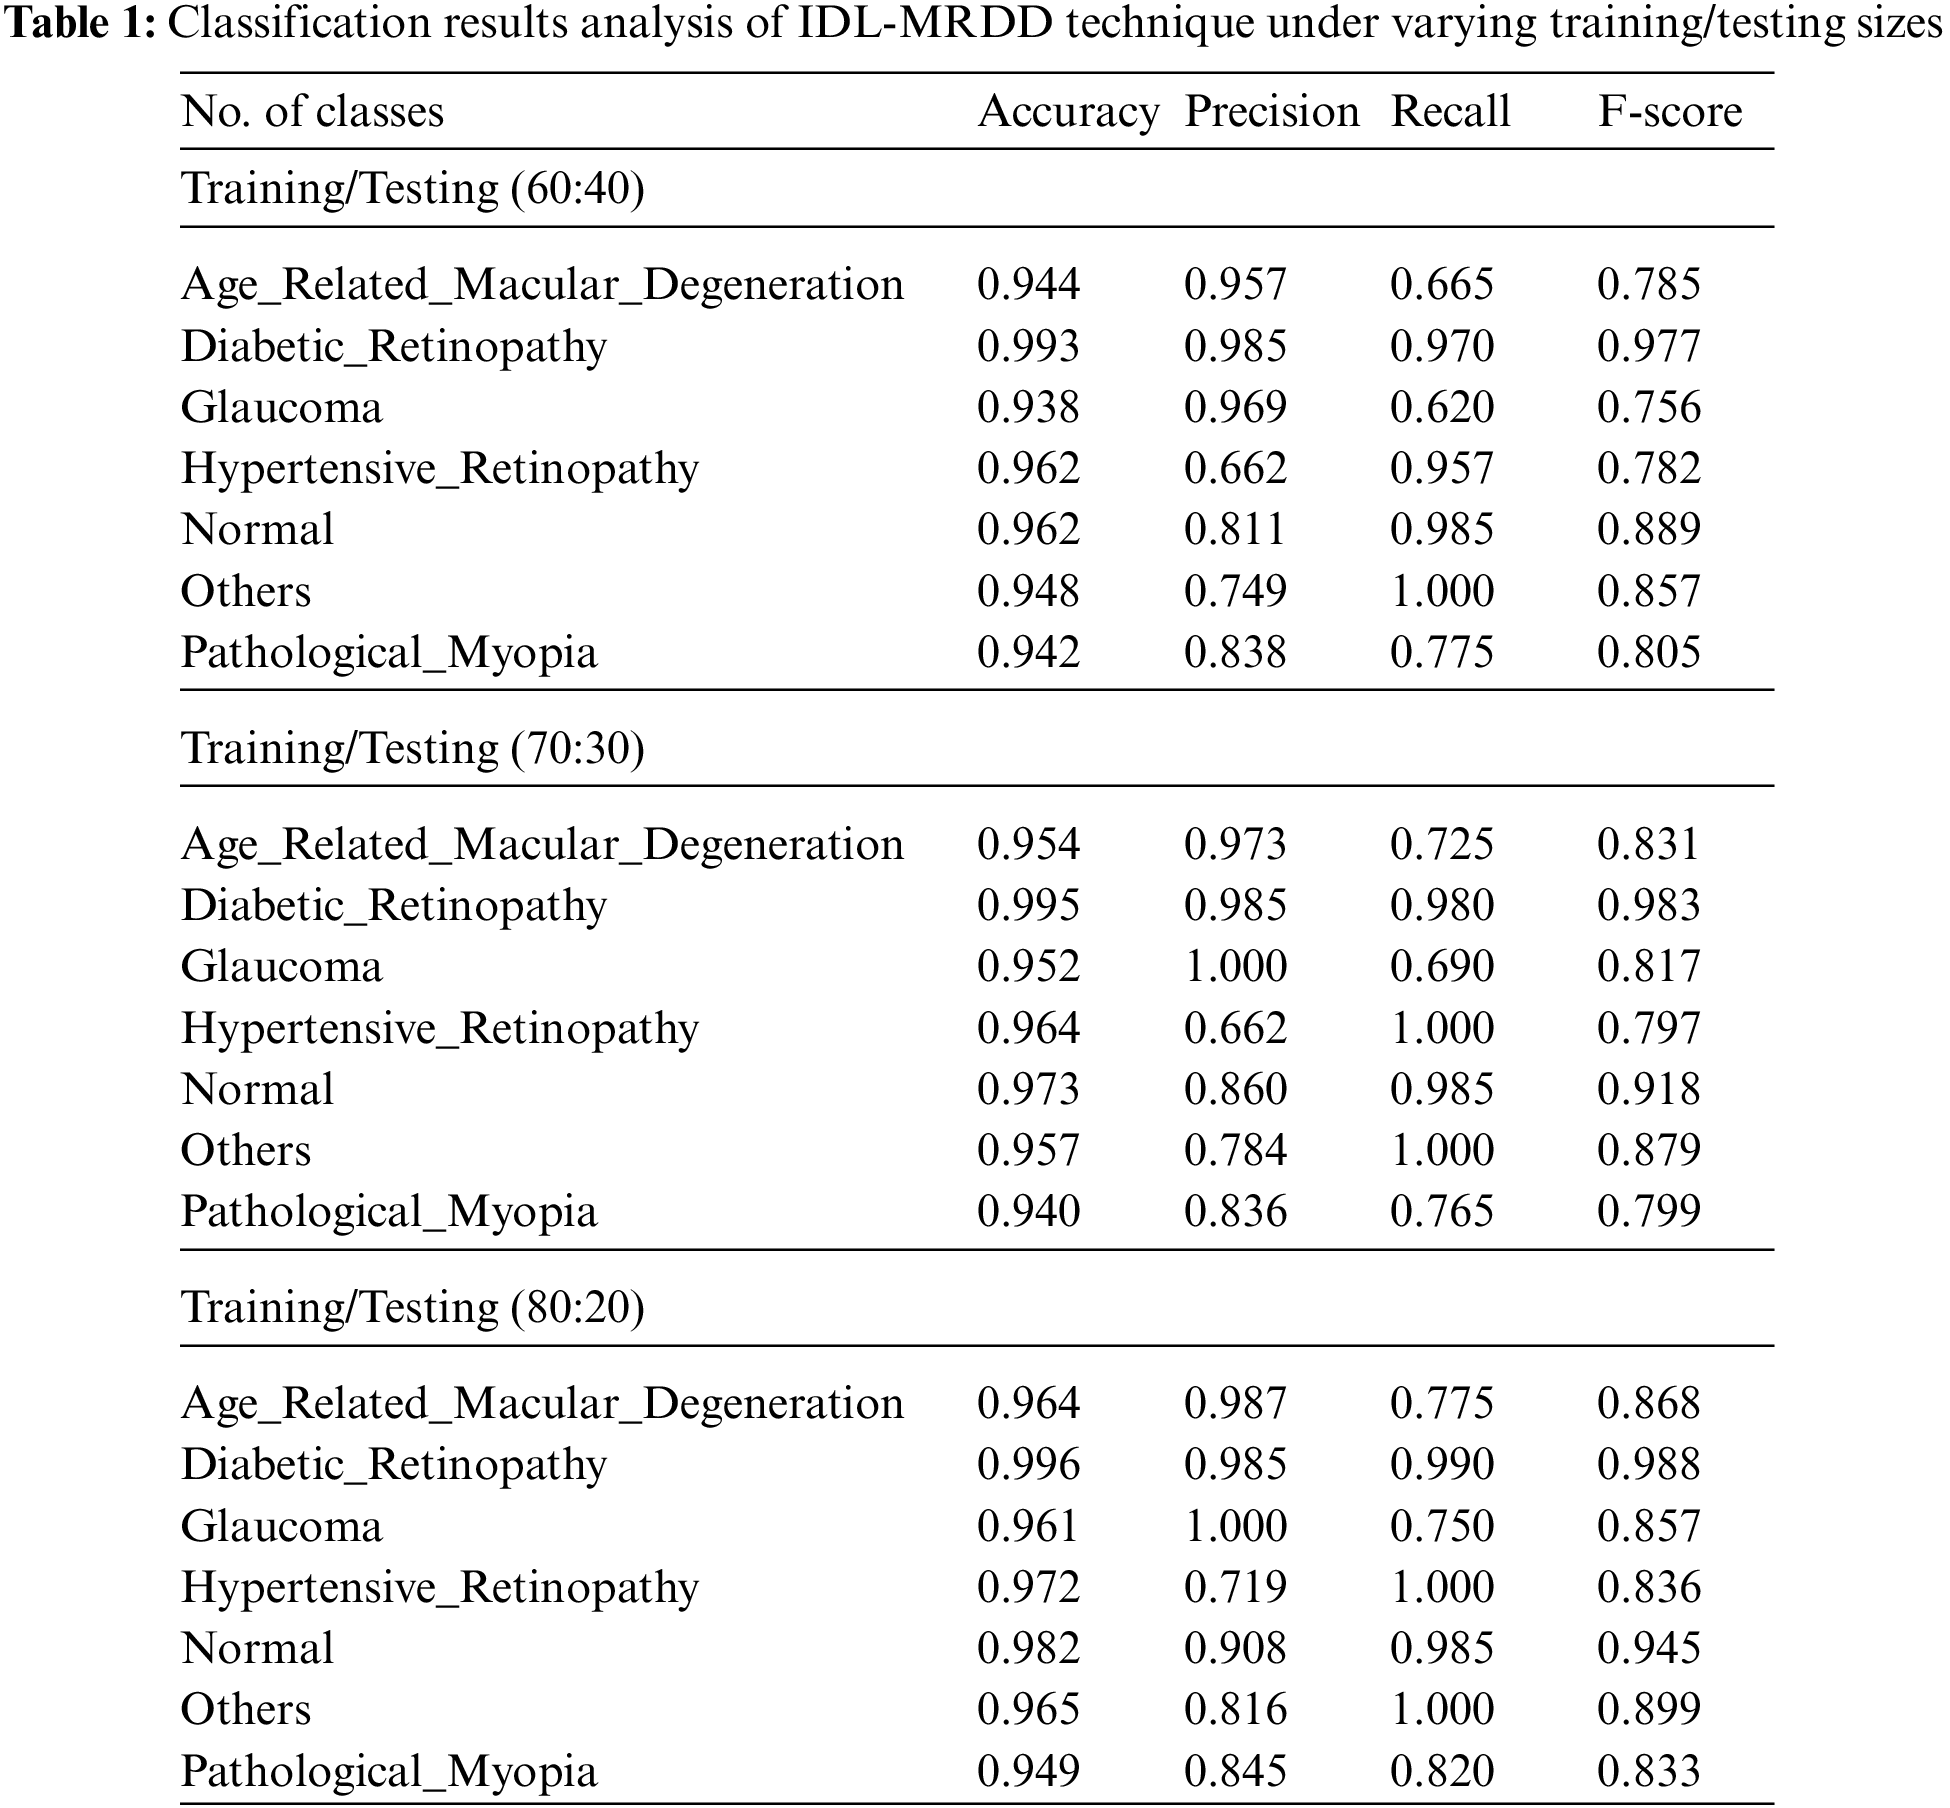
Tab. 2 depicts the average results analysis of the IDL-MRDD technique under different training/testing sizes. The table values demonstrated that the IDL-MRDD technique has gained enhanced performance under all training/testing sizes. For instance, with the training/testing size of 60:40, the IDL-MRDD technique has attained an increased accuracy of 0.956, precision of 0.853, recall of 0.853, and F-score of 0.836. Meanwhile, with the training/testing size of 70:30, the IDL-MRDD manner has reached an improved accuracy of 0.962, precision of 0.872, recall of 0.878, and F-score of 0.860. Eventually, with the training/testing size of 80:20, the IDL-MRDD algorithm has gained a maximum accuracy of 0.970, precision of 0.894, recall of 0.903, and F-score of 0.889.
Fig. 5 showcases the ROC analysis of the IDL-MRDD technique under varying training/testing sizes. The figure demonstrated that the IDL-MRDD technique has resulted in a maximum ROC of 98.1826, 99.1630, and 99.6356 under the training/testing size of 60:40, 70:30, and 80:20 respectively. An extensive comparative study of the IDL-MRDD with existing techniques takes place in Tab. 3.
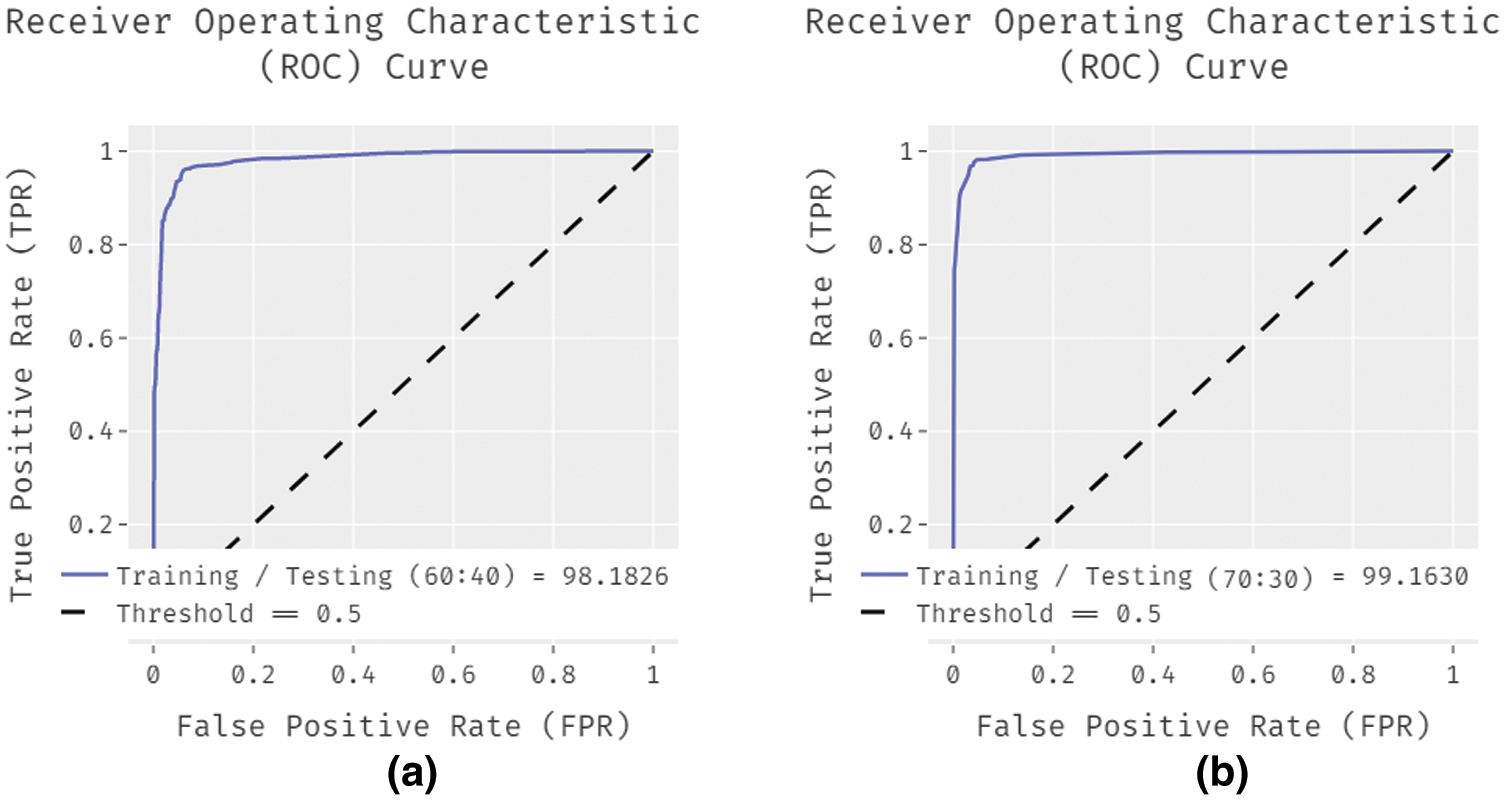
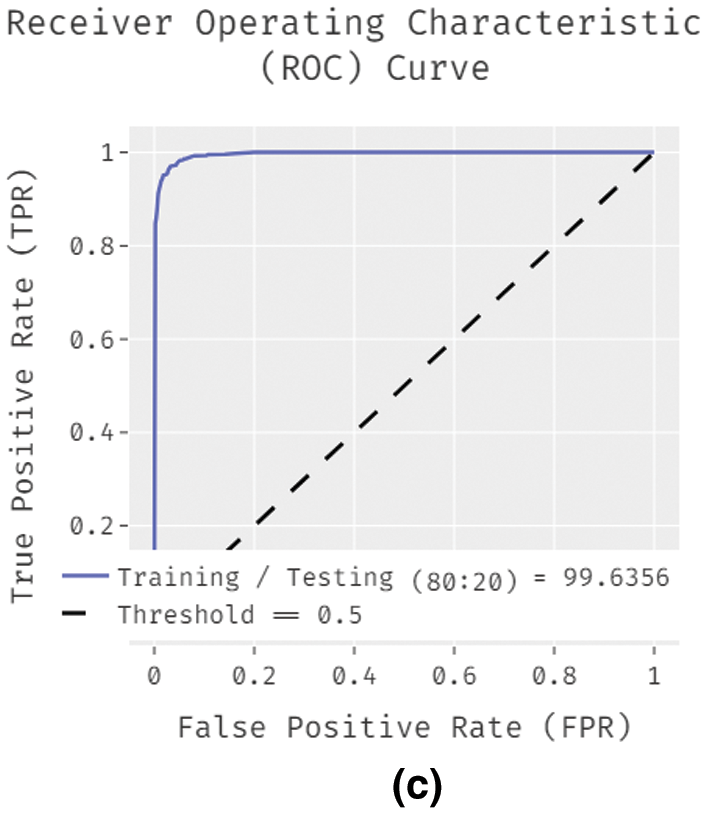
Figure 5: ROC analysis of IDL-MRDD model with different training/testing sizes
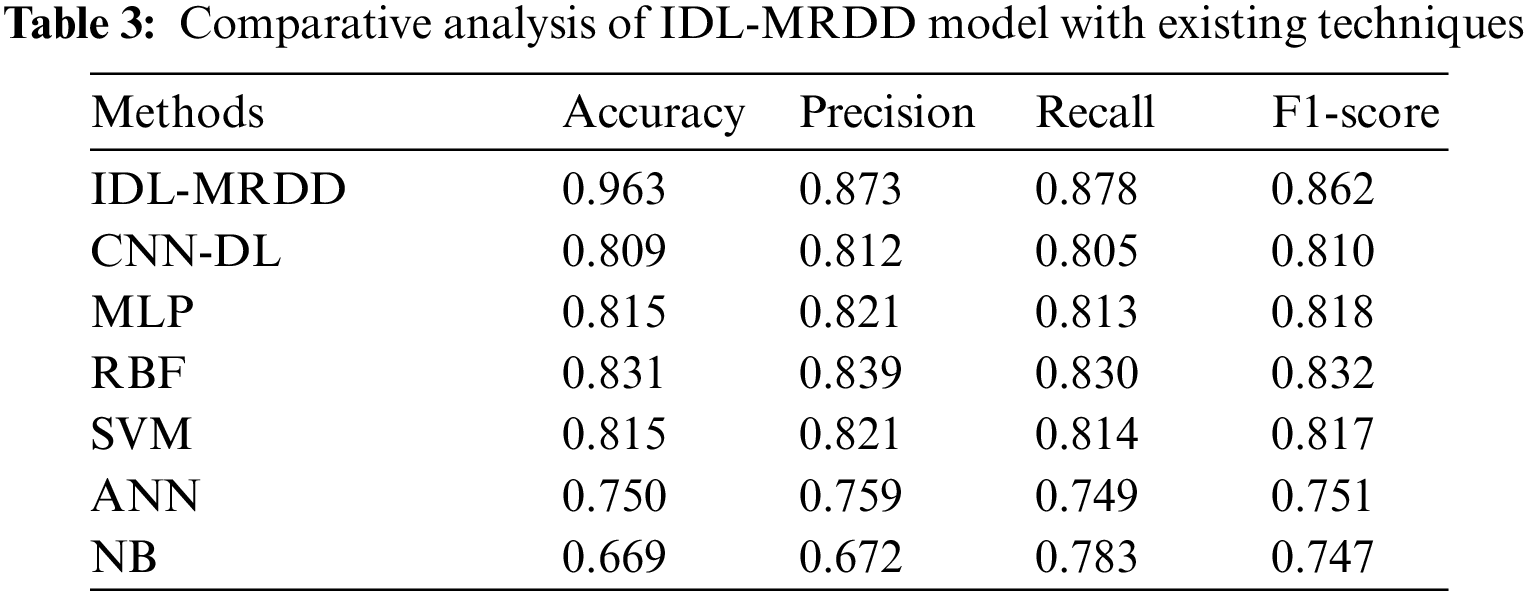
Fig. 6 investigates the performance of the IDL-MRDD technique with existing techniques interms of accuracy. The figure reported that the ANN and NB models have shown poor outcomes with the lower accuracy of 0.750 and 0.669. Additionally, the CNN-DL, MLP, and SVM techniques have showcased slightly improved accuracy values of 0.809, 0.815, and 0.815 respectively. Moreover, the RBF technique has demonstrated competitive performance with an accuracy of 0.831. However, the proposed IDL-MRDD technique has accomplished superior performance with higher accuracy of 0.963.
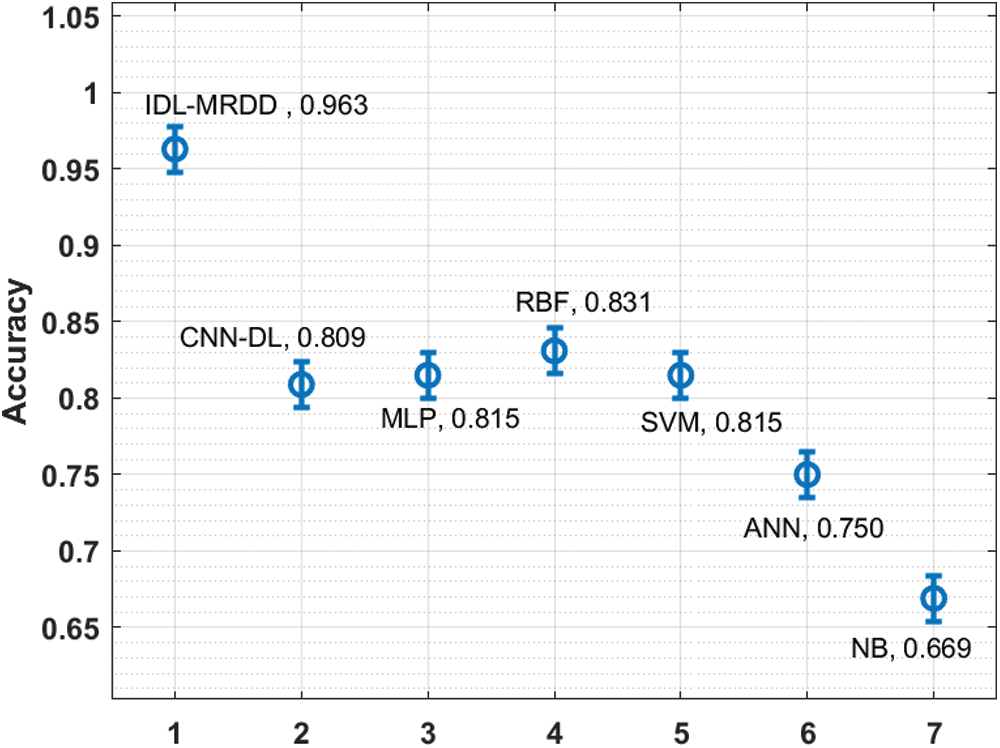
Figure 6: Comparative analysis of IDL-MRDD model in terms of accuracy
Fig. 7 examines the performance of the IDL-MRDD approach with recent methods with respect to precision. The figure stated that the NB and ANN methods have demonstrated worse results with the lesser precision of 0.672 and 0.759. Also, the CNN-DL, MLP, and SVM manners have demonstrated somewhat increased precision values of 0.812, 0.821, and 0.821 correspondingly. Furthermore, the RBF method has demonstrated competitive performance with a precision of 0.839. However, the proposed IDL-MRDD technique has accomplished superior performance with a maximum precision of 0.873.
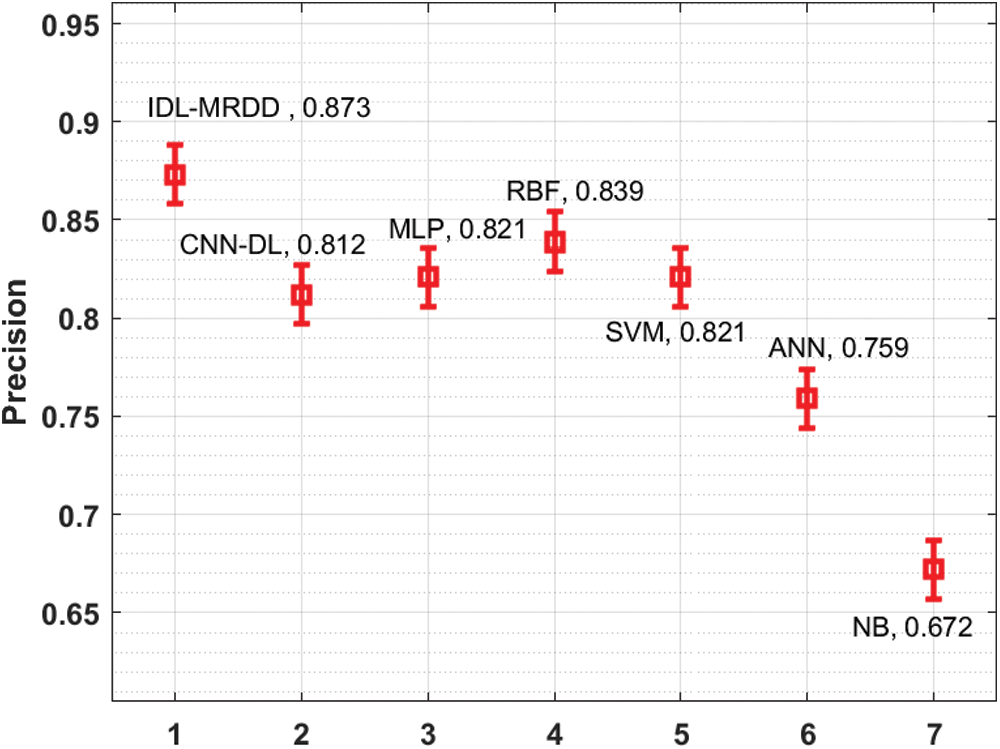
Figure 7: Comparative analysis of IDL-MRDD model in terms of precision
Fig. 8 inspects the performance of the IDL-MRDD technique with existing manners interms of recall. The figure described that the ANN and NB models have shown poor outcomes with the lower recall of 0.749 and 0.783. Likewise, the CNN-DL, MLP, and SVM manners have showcased slightly improved recall values of 0.805, 0.813, and 0.814 respectively. Besides, the RBF technique has exhibited competitive performance with the recall of 0.830. But, the presented IDL-MRDD methodology has accomplished higher performance with a maximum recall of 0.878.
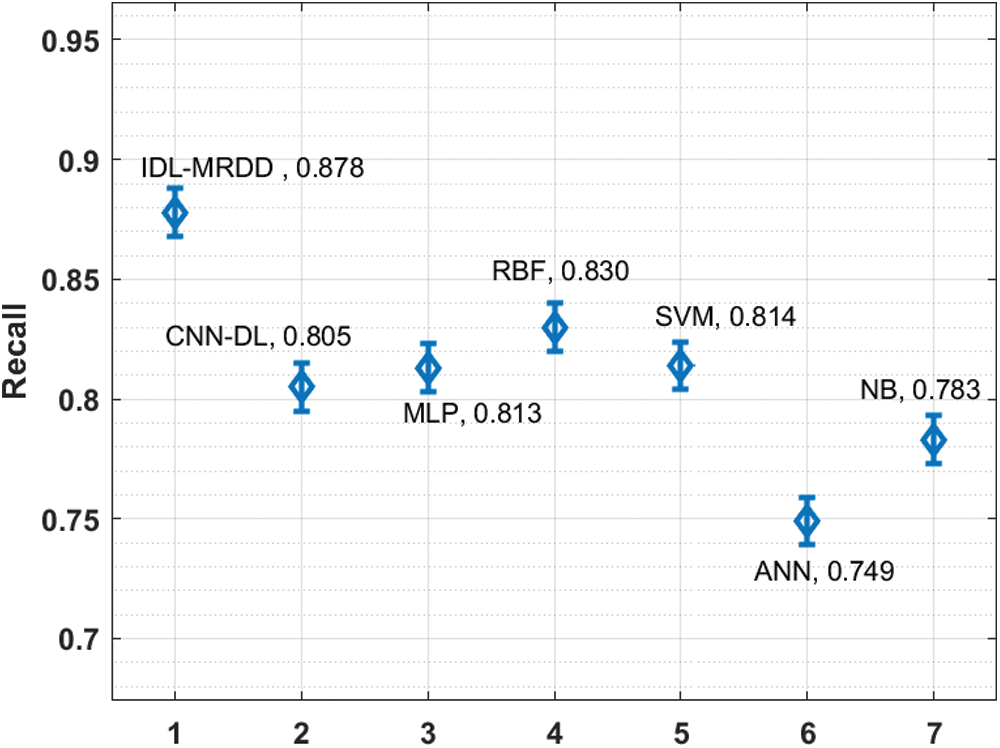
Figure 8: Comparative analysis of IDL-MRDD model in terms of recall
Fig. 9 showcases the performance of the IDL-MRDD method with existing algorithms interms of F1-score. The figure clear that the NB and ANN models have outperformed least outcome with the lower F1-score of 0.747 and 0.751. At the same time, the CNN-DL, SVM, and MLP techniques have depicted slightly enhanced F1-score values of 0.810, 0.817, and 0.818 correspondingly. Moreover, the RBF technique has demonstrated competitive performance with an F1-score of 0.832. Eventually, the projected IDL-MRDD method has accomplished maximum performance with an increased F1-score of 0.862. By looking into the above-mentioned tables and figures, it is obvious that the IDL-MRDD technique has accomplished effectual outcome over the other existing techniques and it can be used as an appropriate tool for multi-retinal disease diagnosis using retinal fundus images.
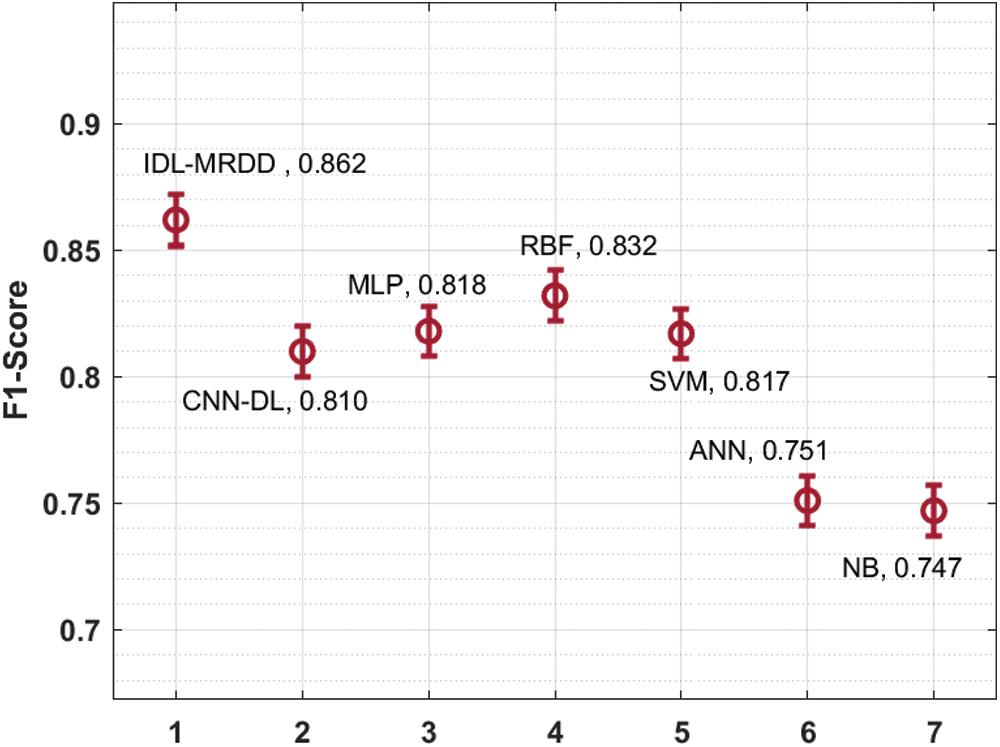
Figure 9: Comparative analysis of IDL-MRDD model in terms of F1-score
In this study, a new multi-retinal disease diagnosis model using IDL-MRDD technique is presented to determine different types of retinal diseases. The proposed IDL-MRDD model involves different stages of operation such as preprocessing, AFA-SF based segmentation, SqueezeNet based feature extraction, and SSAE based image classification. The design of AFA to optimally select the threshold values for multi-level thresholding helps to improve the overall segmentation outcomes. A wide range of simulations is performed to point out the enhanced performance of the IDL-MRDD technique on a benchmark multi-retinal disease dataset, comprising data instances from different classes. The experimental values pointed out the superior outcome over the existing techniques. As a part of future extension, advanced DL models can be employed as the segmentation techniques and thereby boost the diagnostic outcomes. Besides, hybrid metaheuristic algorithms can be designed for the hyperparameter tuning of the DL based feature extractors.
Funding Statement: This work was supported by the National Research Foundation of Korea(NRF) grant funded by the Korea government(MSIT) (No. NRF-2021R1A2C1010362) and the Soonchunhyang University Research Fund.
Conflicts of Interest: The authors declare that they have no conflicts of interest to report regarding the present study.
References
1. L. Fang, L. Yang, S. Li, H. Rabbani, Z. Liu et al., “Automatic detection and recognition of multiple macular lesions in retinal optical coherence tomography images with multi-instance multilabel learning,” Journal of Biomedical Optics, vol. 22, no. 6, pp. 066014, 2017. [Google Scholar]
2. L. S. Lim, P. Mitchell, J. M. Seddon, F. G. Holz, T. Y. Wong et al., “Age-related macular degeneration,” Lancet, vol. 379, no. 9827, pp. 1728–1738, 2012. [Google Scholar]
3. Z. Hu, Y. Shi, K. Nandanan, S. Sadda and A. Group, “Semiautomated segmentation and analysis of retinal layers in three-dimensional spectral-domain optical coherence tomography images of patients with atrophic age-related macular degeneration,” Neurophotonics, vol. 4, no. 1, pp. 011012, 2017. [Google Scholar]
4. L. Dai, L. Wu, H. Li, C. Cai, Q. Wu et al., “A deep learning system for detecting diabetic retinopathy across the disease spectrum,” Nature Communications, vol. 12, no. 1, pp. 3242, 2021. [Google Scholar]
5. S. Shastri, K. Singh, S. Kumar, P. Kour and V. Mansotra, “Time series forecasting of Covid-19 using deep learning models: India-USA comparative case study,” Chaos Solitons & Fractals, vol. 140, no. 5, pp. 110227, 2020. [Google Scholar]
6. A. Shoeibi, M. Khodatars, N. Ghassemi, M. Jafari, P. Moridian et al., “Epileptic seizures detection using deep learning techniques: A review,” International Journal of Environmental Research and Public Health, vol. 18, no. 11, pp. 5780, 2021. [Google Scholar]
7. A. Shoeibi, M. Khodatars, M. Jafari, P. Moridian, M. Rezaei et al., “Applications of deep learning techniques for automated multiple sclerosis detection using magnetic resonance imaging: A review,” Computers in Biology and Medicine, vol. 136, no. 3, pp. 104697, 2021. [Google Scholar]
8. S. Karthikeyan, P. S. Kumar, R. Madhusudan, S. Sundaramoorthy and P. Namboori, “Detection of multi-class retinal diseases using artificial intelligence: An expeditious learning using deep cnn with minimal data,” Biomedical & Pharmacology Journal, vol. 12, no. 3, pp. 1577–1586, 2019. [Google Scholar]
9. J. D. Fauw, J. R. Ledsam, B. R. Paredes, S. Nikolov, N. Tomasev et al., “Clinically applicable deep learning for diagnosis and referral in retinal disease,” Nature Medicine, vol. 24, no. 9, pp. 1342–1350, 2018. [Google Scholar]
10. V. Mihalov, D. Andreev and M. Lazarova, “Software platform for retinal disease diagnosis through deep convolutional neural networks,” in Proc. of the 21st Int. Conf. on Computer Systems and Technologies’20, Ruse Bulgaria, pp. 61–65, 2020. [Google Scholar]
11. L. Jain, H. V. S. Murthy, C. Patel and D. Bansal, “Retinal eye disease detection using deep learning,” in 2018 Fourteenth Int. Conf. on Information Processing (ICINPRO), Bangalore, India, pp. 1–6, 2018. [Google Scholar]
12. N. Rajagopalan, V. Narasimhan, S. K. Vinjimoor and J. Aiyer, “Deep CNN framework for retinal disease diagnosis using optical coherence tomography images,” Journal of Ambient Intelligence and Humanized Computing, vol. 12, no. 7, pp. 7569–7580, 2021. [Google Scholar]
13. R. Arunkumar and P. Karthigaikumar, “Multi-retinal disease classification by reduced deep learning features,” Neural Computing and Applications, vol. 28, no. 2, pp. 329–334, 2017. [Google Scholar]
14. X. Li, M. Jia, M. T. Islam, L. Yu and L. Xing, “Self-supervised feature learning via exploiting multi-modal data for retinal disease diagnosis,” IEEE Transactions on Medical Imaging, vol. 39, no. 12, pp. 4023–4033, 2020. [Google Scholar]
15. T. Yoo, J. Choi and H. Kim, “Feasibility study to improve deep learning in OCT diagnosis of rare retinal diseases with few-shot classification,” Medical & Biological Engineering & Computing, vol. 59, no. 2, pp. 401–415, 2021. [Google Scholar]
16. Z. Yan, X. Yang and K. T. Cheng, “A three-stage deep learning model for accurate retinal vessel segmentation,” IEEE Journal of Biomedical and Health Informatics, vol. 23, no. 4, pp. 1427–1436, 2019. [Google Scholar]
17. V. Rajinikanth, S. C. Satapathy, S. L. Fernandes and S. Nachiappan, “Entropy based segmentation of tumor from brain MR images–a study with teaching learning based optimization,” Pattern Recognition Letters, vol. 94, no. 1, pp. 87–95, 2017. [Google Scholar]
18. L. Cheng, X. Wu and Y. Wang, “Artificial flora (af) optimization algorithm,” Applied Sciences, vol. 8, no. 3, pp. 329, 2018. [Google Scholar]
19. H. Lee, I. Ullah, W. Wan, Y. Gao and Z. Fang, “Real-time vehicle make and model recognition with the residual squeezenet architecture,” Sensors, vol. 19, no. 5, pp. 982, 2019. [Google Scholar]
20. J. Xu, L. Xiang, Q. Liu, H. Gilmore, J. Wu et al., “Stacked sparse autoencoder (ssae) for nuclei detection on breast cancer histopathology images,” IEEE Transactions on Medical Imaging, vol. 35, no. 1, pp. 119–130, 2016. [Google Scholar]
21. S. Megala and T. S. Subashini, “An automated multi-retinal disease classification model using machine learning techniques,” International Journal of Advanced Research in Engineering and Technology (IJARET), vol. 11, no. 11, pp. 937–958, 2020. [Google Scholar]
 | This work is licensed under a Creative Commons Attribution 4.0 International License, which permits unrestricted use, distribution, and reproduction in any medium, provided the original work is properly cited. |