| Computers, Materials & Continua DOI:10.32604/cmc.2022.026880 | |
| Article |
A Lightweight Model of VGG-U-Net for Remote Sensing Image Classification
1College of Information Technology, Jilin Agricultural University, Changchun, 130118, China
2Jilin Province Agricultural Internet of Things Technology Collaborative Innovation Center, Changchun, 130118, China
3Jilin Province Intelligent Environmental Engineering Research Center, Changchun, 130118, China
4Jilin Province Information Technology and Intelligent Agriculture Engineering Research Center, Changchun, 130118, China
5College of Engineering and Technology, Jilin Agricultural University, Changchun, 130118, China
6Department of Agricultural Economics and Animal Production, University of Limpopo, Sovenga, 0727, Polokwane, South Africa
7College of Information Technology, Wuzhou University, Wuzhou, 543003, China
8Guangxi Key Laboratory of Machine Vision and Intelligent Control, Wuzhou, 543003, China
*Corresponding Author: Li Shijun. Email: lsj0883@sina.com
Received: 06 January 2022; Accepted: 24 March 2022
Abstract: Remote sensing image analysis is a basic and practical research hotspot in remote sensing science. Remote sensing images contain abundant ground object information and it can be used in urban planning, agricultural monitoring, ecological services, geological exploration and other aspects. In this paper, we propose a lightweight model combining vgg-16 and u-net network. By combining two convolutional neural networks, we classify scenes of remote sensing images. While ensuring the accuracy of the model, try to reduce the memory of the model. According to the experimental results of this paper, we have improved the accuracy of the model to 98%. The memory size of the model is 3.4 MB. At the same time, The classification and convergence speed of the model are greatly improved. We simultaneously take the remote sensing scene image of 64 × 64 as input into the designed model. As the accuracy of the model is 97%, it is proved that the model designed in this paper is also suitable for remote sensing images with few target feature points and low accuracy. Therefore, the model has a good application prospect in the classification of remote sensing images with few target feature points and low pixels.
Keywords: VGG-16; U-Net; fewer feature points; nonlinear correction layer; zero padding
Recent years have seen a significant improvement in obtaining high-resolution remote sensing images due to advances in remote sensing science and technology. More detailed features and semantic information can now be obtained from high-resolution remote sensing images. The traditional pixel-level interpretation analysis cannot meet interpretation requirements of the high-level content of images [1–4]. At present, object-oriented processing, multi-scale analysis, and scene understanding are the frontiers of high-resolution remote sensing research. Among them, object extraction and segmentation are the foundations of this research, with multi-scale analysis being the means to further the same. The understanding of scene and cognition is the main objective. Therefore, the scene classification of high-resolution remote sensing images has become indispensable for remote sensing interpretation.
Conventional methods of remote sensing image scene classification are divided into two categories. The first is scene classification based on low-level features, such as image color, texture, and shape (e.g., sift, gist, among others) [5–7]. This classification method is simple but has low accuracy. The second one is scene classification based on middle-level features, which are a kind of aggregation and integration of low-level features. Their essence is to establish the relationship with semantics through the statistical distribution analysis of low-level features. The representative methods include visual word bag BOVW8 [8] and K-means [9] clustering methods. First, the underlying feature clustering is extracted to create the visual word bag. Then, the support vector machine (SVM) is used to train classification. Although this method’s accuracy is relatively improved, it still has limitations because it only uses the local feature information and does not account for the correlation between features.
The scene classification method with middle-level features and the deep learning algorithm has emerged in the image recognition process. An increasing number of scholars are using it for remote sensing image scene classification. Meng et al. [10] used data amplification, dropout, regularization, and other strategies to increase the generalization ability of the convolutional neural network (CNN), significantly improving its classification accuracy. Han et al. [11] used the pre-trained AlexNet network. He combined the network with the spatial pyramid pooling method to improve the scene classification’s accuracy. Some studies have demonstrated the extraction of the CNN’s deep features for feature fusion in different methods and then inputting the fused features into SVM classification. The outcome is superior to CNN’s direct classification. Liu et al. [12] extracted the deep features of CNN. He rearranged, merged, and classified them following operations with convolution kernels of different sizes and steps. N. Gul et al. [13] used SVM classification after processing CNN’s full connection layer features of different scales in advance and achieved good results in UCMerced_LandUse (UCM) and WHU-RS datasets. Kwon et al. [14] proposed a butterfly optimization algorithm–based method of optimal cooperative spectrum sensing. Islam et al. [15] used data traffic reduction with compressed sensing in an Artificial Intelligence & Internet of Things (AIoT) system. Jiang et al. [16] proposed land cover classification and its impact on Peshawar’s land surface temperature using remote sensing. Sung et al. [17] proposed research on the crowdsourcing price game model in crowdsensing. Zhou et al. [18] proposed using Radio Frequency Identification (RFID) positioning and physiological signals for remote medical care.
However, contemporary research works are yet to overcome the following challenges. 1. Currently, most remote sensing images research is focused on high-precision images with numerous obvious targets; however, only a small number of studies are focused on a few targets or images whose accuracy falls short of high definition for various reasons. 2. Due to the unique characteristics of remote sensing images, most deep learning models face problems regarding massive model memory and computations. To solve the abovementioned problems, this paper proposes the improvement and optimization of the traditional deep learning model, the Visual Geometry Group Network (VGG-16) model, to achieve high accuracy in the classification of smoke remote sensing images with low accuracy and few targets. This model can create high-precision remote sensing images with high accuracy and many targets. Simultaneously, the model significantly reduces the memory and the number of computations, saving much time. Therefore, this paper proposes a VGG-16-based lightweight model to address the abovementioned issues. First, the original VGG-16 model’s network structure is optimized and then the super parameters of the model are adjusted. The data in the data set are processed using the data processing method designed in this paper. The processed data are used to train the model.
Visual Geometry Group Network (VGG) is a deep convolutional neural network jointly developed by Visual Geometry Group of Oxford University and researchers at Google DeepMind Company [19]. It explores the relationship between the depth and performance of convolutional neural network, and successfully constructs 16-layer to 19-layer convolutional neural network by repeatedly stacking 33 small convolutional kernels and 22 largest pooling kernels. Compared with the previous state-of-the art network structure, VGGNet significantly reduces the error rate relying on the use of 33 small convolution kernels and 22 largest pooling kernels, and improves the performance by constantly deepening the network structure. However, as the VGG model mainly deepens network structure to improve the model performances, in order to improve its accuracy, the number of model parameters and the quantity of computation are increased excessively.
In 2015, Olaf Ronneberger, Philipp Fischer and Thomas Brox proposed the U-Net network structure, which is based on the expansion and modification of the full convolutional network, and consists of two parts, namely a contracting path using to obtain context information and a symmetric expanding path using to accurately position [20]. U-Net adopts a completely different feature fusion method from Fully Convolutional Networks (FCN), that is, splicing. It splices features together with channel dimension to form thicker features, while FCN adds corresponding points in fusion process, without forming thicker features. Beyond that, U-net and FCN are extremely similar. Their structures both use a more classical idea, i.e., the encoder and decoder, and the main propose is to compress images and remove noise, rather than segment. To be specific, the input is an image, which is encoded by downsampling to get a series of features smaller than the original image, equivalently to compression. And then through decoding, the original image is restored ideally.
Therefore, in order to solve the problem that VGG-16 model brings more calculation and model parameters, the VGG-16 model is combined with U-Net model to ensure the accuracy as much as possible while reducing the number of model parameters and the quantity of calculation, as as to be conductive to transplanting the model to mobile devices in the future.
For the design of VGG-16 model, the improved VGG-16 model in the paper “A Lightweight Model of VGG-16 for Remote Sensing Image Classification” published by our team is adopted [21]. Specifically, the original 64 × 64 to 512 × 512 convolutional layers of VGG-16 model were changed to 32 × 32 to 512 × 512, the 512 × 512 convolutional layer was changed from one-time convolution to two-time convolution, and the size of the convolution kernel was 3 × 3. Besides, the three wholly connected layers of the model were changed to one-time convolution, before each ergodic convolution, a zero-padding layer with a size of 1 × 1 was added, and after each convolution layer, a BN layer was added. Again, the Sigmoid was selected as the activation function, and Adam was selected as the optimizer. After the improved VGG-16 model is reorganized according to the structure of U-Net model, the encoding part of the U-Net model was changed to the convolution layers from 32 × 32 to 512 × 512 of the improved VGG-16 model, and the decoding part was changed to the convolution layers from 512 × 512 to 32 × 32 of the improved VGG-16 model.
After each ergodic convolution, a maximum pooling layer is adopted to maximize the extraction of objects in remote sensing images, and to avoid gradient explosion and other related problems in the process of reverse calculation. After optimization and combination, the improved model makes full use of the advantages of U-Net model to carry out further compression of smaller object feature points, so as to obtain features that are smaller than the original image. Since the original image needs to be compressed in u-shaped structure, a zero-padding layer is added to the improved VGG-16 model, which is more beneficial to the classification of remote sensing images with multiple and small objects, and ensures that the gradient will not disappear during multiple compression and iteration of the model. The model image after optimization and improvement is shown in the Fig. 1 below:

Figure 1: Model structure
For purposes of this experiment, first of all, EuroSAT [22,23] was selected as the data set, which contains 27,000 images with a size of 64 × 64, and are divided into 10 categories, namely Annual Crop, Forest, HerbaceousVegetation, Highway, Industrial, Pasture, PermanentCrop, Residential, River, and SeaLake. Then, the images in EuroSAT were conducted grayscale processing to make the objects in the images more obvious, and the RGB of images were converted into HSV contrast (Hue, Saturation, Value) as RGB channels cannot well reflect the specific color information of objects, and compared with RGB space, HSV space can intuitively express the value, hue, and saturation of colors, so as to benefit the contrast among colors. On the other hand, the other purpose of this processing is to further highlight the objects in the model and improve the accuracy of image scene classification since in the selected data set, some images have few object buildings. After image processing, the processed images were divided into training set and test set in the ratio of 8:2. The following Fig. 2 shows the data image processing results:

Figure 2: Data set processing operation
In model training, the batch size was set as 64, momentum was set as 0.9, and learning rate was set as 0.001. With Keras as the development framework, all the model were trained averagely for 50 iterations, and 25 h. The following Fig. 3 shows the function diagram of the loss rate of training set and validation set of the model:

Figure 3: Loss function diagram
The test set was inputted into the model. Fig. 4 shows the function diagram of the accuracy of the test and verification sets.

Figure 4: Accuracy function
It can be seen from the above loss-rate function diagram that the loss rates of training set and validation set appeared a small degree of overlap and volatility, which is mainly because some remote sensing images in selected data set have few objects that can be extracted, and are classified mainly through the color contrast. In this regard, some abnormalities occurred in several function diagrams, for instance, Forset and sandpipers, SeaLake and River, etc. The picture is shown in Fig. 5 Whereas, if high-precision remote sensing images are replaced with more and clearer objects, this situation will be improved.

Figure 5: Images of similar data sets
3 Experimental Results and Analysis
Since this experiment is aimed at remote sensing images with few object feature points and low pixels, the selected EuroSAT(64 × 64) data set was input into the improved model to run for 10 times. g-1nally, the average value of the 10 operation results was selected, and the accuracy of the final model reached 97%.
According to Tab. 1, it can be seen that the data set has a high accuracy rate in the model, among which the accuracy rates of Residential and Industrial are very high, indicating that the classification of remote sensing images mainly relies on the more obvious objects in remote sensing images. Moreover, it is also obvious from Tab. 1 that in the operation of the model, feature points in images can be better extracted, showing that the experiment is also suitable for high-precision remote sensing images, and for remote sensing images with few objects and low pixels, the accuracy of the model reaches 90%, which proves the universality of this model. Compared with the previously published paper “A Lightweight Model of VGG-16 for Remote Sensing Image Classification”, the accuracy of the improved model has increased by three percentage points. Fig. 6 shows the accuracy and loss rate function image of “A Lightweight Model of VGG-16 for Remote Sensing Image Classification”. Meanwhile, the accuracy of images like Forest, Residential and SeaLake has also been greatly improved, which is due to although the pixel points of remote sensing images in the three data sets is extremely low, the feature points are still obvious, and most of these are single-color images or images with obvious feature points, such as with clear lines, with iconic and recognizable objects, etc. In this regard, from RGB of images, they are easily extracted for recognition, leading to higher accuracy. Whereas, it can be seen from the table that the accuracy rates of PermanentCrop and AnnualCrop are low, which is mainly due to the fact that these two kind of images not only have almost no obvious objects, but also are almost similar in color, leading to classification errors in the model and lower accuracy than other scenes.
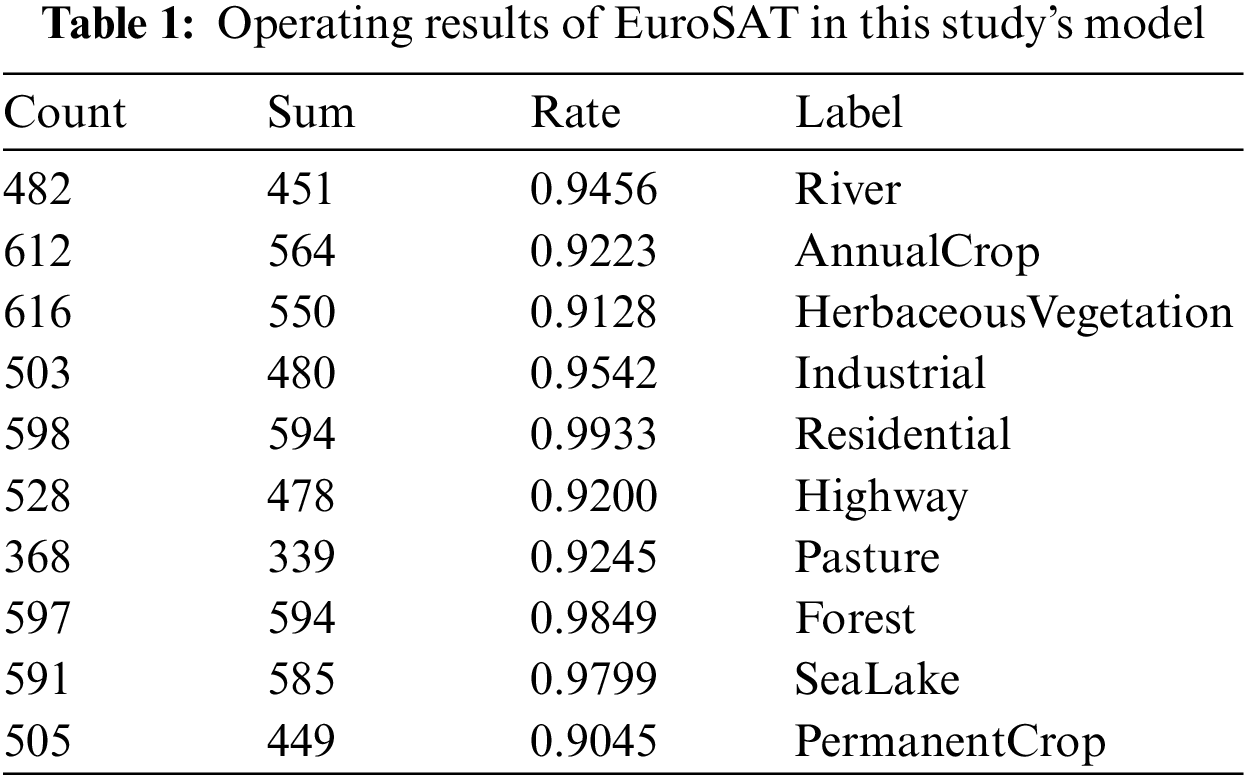

Figure 6: A Lightweight Model of VGG-16 for Remote Sensing Image Classification
3.2 Analysis of Experimental Results
In order to prove the superiority of the model designed by us in the classification of remote sensing images with few objects and low pixels, the data sets used in this experiment were inputted into other models to run for three times. Finally, the average accuracy of the three-time operation results was obtained as shown in following table:
As can be seen from Tab. 2, for the traditional convolutional neural network, aiming at the classification of remote sensing images with few objects and low pixels, the accuracy of the model is low, proving the superiority of the model designed by us in the classification for this kind images. Meanwhile, it can be seen from the table that under the same model parameters, our model has the least number of training times and the shortest single round training time, indicating that the convergence speed of our model has been greatly improved. The accuracy function image of each model is shown in Fig. 7. According to the accuracy in Tab. 2, it can be seen that remote sensing images differ greatly from ordinary images, where remote sensing images have complex background, and more semantic information. As a result, common scene classification methods are not suitable for scene classification of remote sensing images, and simply adjusting the number of convolutional layers and model parameters of common models cannot effectively improve the accuracy of remote sensing image classification. Instead, it may introduce too much redundant information or noise.
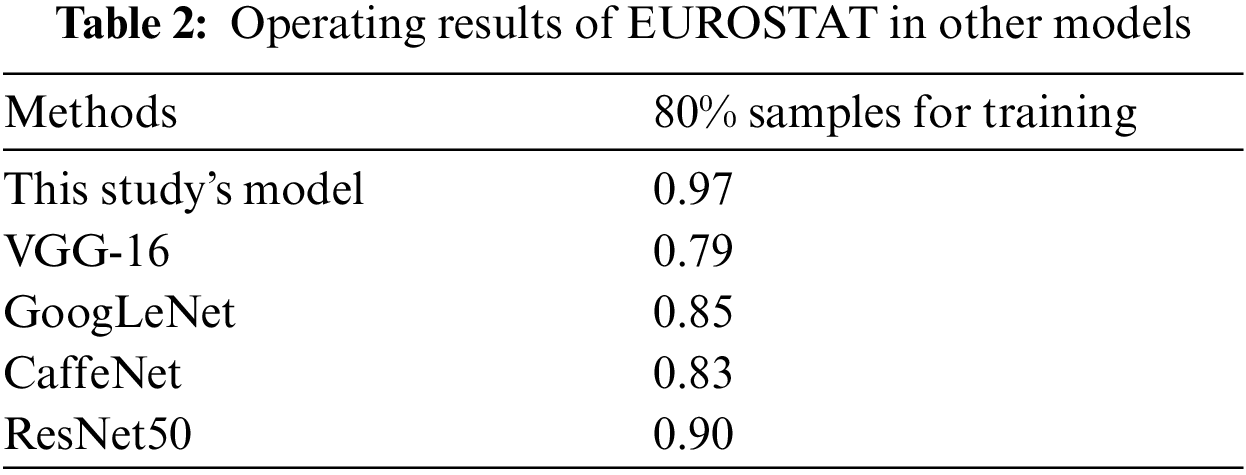

Figure 7: Accuracy images of different models
Furthermore, in order to verify the universality of our model research and the particularity of remote sensing images with few objects and low pixels, the data sets selected by our model were input into the newly published paper “Scene Classification of Multi-kernel SVM High-precision Remote Sensing Images Based on LDCNN Feature Extraction” [24]. As the model and algorithm in “Scene Classification of Multi-kernel SVM High-precision Remote Sensing Images Based on LDCNN Feature Extraction” mainly classify high-precision images, as well as the data sets we selected are not high in pixels and have few feature points, and some images in the data sets are too similar, overfitting phenomenon occurred when the model ran the EuroDAT data set, indicating that after the improved VGG-16 model is combined with U-Net model, the symmetrical u-shaped structure in U-Net model is used to carry out precise compression for remote sensing images without obvious objects, and color features in the images are fully adopted to segment the small objects more accurately, so as to improve the accuracy of the model.
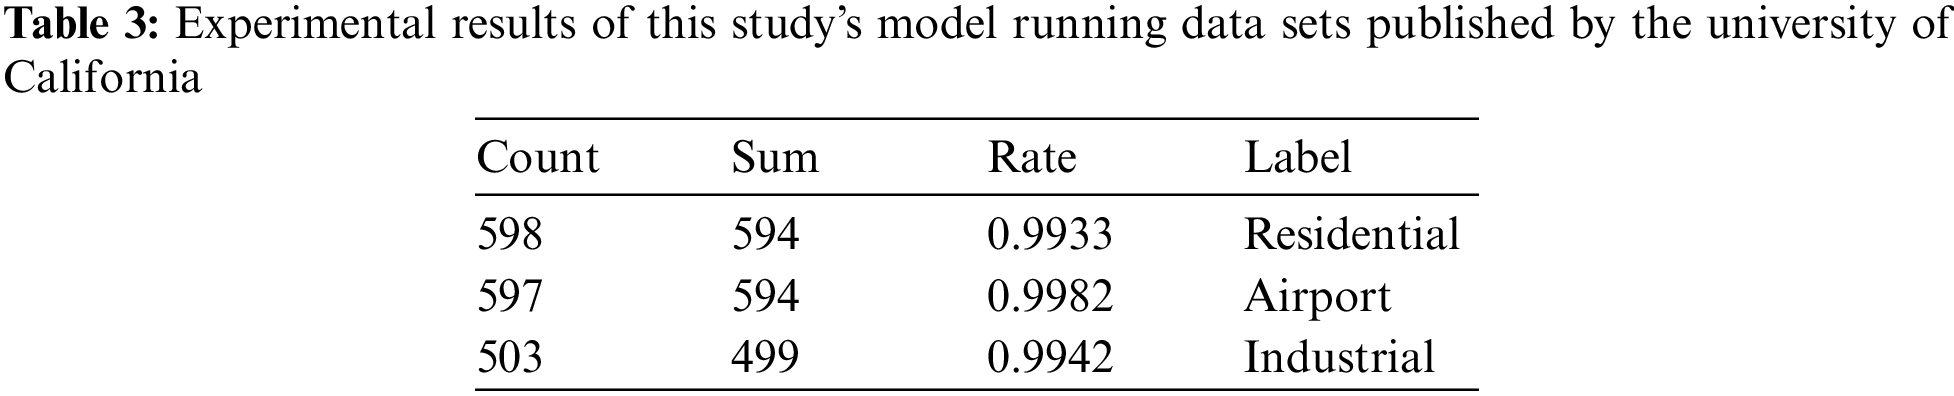
In order to further verify that the model designed by us is also applicable to high-precision remote sensing images and remote sensing images with few objects and low pixels, first of all, SIRI-WHO Data(200 × 200) [25,26], OPTIMAL-31(256 × 256) [27], and WHO-RS19(600 × 600) [28,29] were respectively selected to test the model, in which the images have clear and large number of objects, so that the feature points in the image are extracted smoothly for scene classification of remote sensing images. Then, after the high-precision remote sensing image was amplified by traditional data amplification method, and the amplified data set was processed according to the data processing method mentioned in this paper, the processed images were input into the model designed by us to run for three times. Finally, the average value of the three experimental results was taken as the accuracy of the final experiment, as shown in the table:
As shown in Tab. 3, the accuracy of scene classification experiment of high-precision remote sensing images reaches 99%, showing that the accuracy of high-precision remote sensing images is still high, and the model also applies to high-precision remote sensing images. Moreover, it also proves that introducing U-Net into the model is effective for scene classification of high-precision remote sensing images, and although the number of parameters in the model is reduced, the accuracy is still guaranteed, and the memory of the accuracy model designed by us is small, only 3.4 MB. After many experiments, it is proved that except for a higher classification accuracy of remote sensing images with fewer objects and low pixels, the model can also be used for scene classification of high-precision remote sensing images, and occupies a great memory advantage in the classification of remote sensing images, indicating that the scheme that we have designed is effective.
In this paper, on the basis of the modification and improvement of VGG-16 network model, the improved VGG-16 is combined with the traditional U-Net model to replace the encoding and decoding part of the U-NET model. Through experiments, it is proved that the model designed by us can achieve 98% accuracy in scene classification of remote sensing images with few objects and low pixels, 99% accuracy in scene classification of high-precision remote sensing images, and 3.4MB memory size. Therefore, except for good applicability in the fine classification of high-precision and low-precision remote sensing data, the model design by us can also classify fuzzy images, recognize and classify local features of images, and reduce the requirement of image pixel of recognition and classification for remote sensing images, so as to further improve the working efficiency of the recognition and classification of remote sensing images.
Funding Statement: This research was supported by National Key Research and Development Program sub-topics [2018YFF0213606–03 (Mu Y., Hu T. L., Gong H., Li S. J. and Sun Y. H.) http://www.most.gov.cn], Jilin Province Science and Technology Development Plan (focuses on research and development projects) [20200402006NC (Mu Y., Hu T. L., Gong H. and Li S.J.) http://kjt.jl.gov.cn], Science and Technology Support Project for Key Industries in Southern Xinjiang [2018DB001 (Gong H., and Li S.J.) http://kjj.xjbt.gov.cn], and Key technology R & D project of Changchun Science and Technology Bureau of Jilin Province [21ZGN29 (Mu Y., Bao H. P., Wang X. B.) http://kjj.changchun.gov.cn].
Conflicts of Interest: The authors declare that they have no conflicts of interest to report regarding this study.
References
1. C. Qiu, L. Mou and M. Schmitt, “Local climate zone-based urban land cover classification from multi-Seasonal sentinel-2 images with a recurrent residualnetwork,” ISPRS J Photogramm Remote Sens, vol. 154, no. 1, pp. 151–162, 2019. [Google Scholar]
2. J. Long, E. Shelhamer and T. Darrell, “Fully convolutional networks for semantic segmentation,” in Proc. of the 2015 IEEE Conf. on Computer Vision and Pattern Recognition, Piscataway NJ, USA, pp. 3431–3440, 2015. [Google Scholar]
3. Q. Wang, S. Liu and J. Chanussot, “Scene classification with recurrent attention of VHR,” Remote Sensing Images IEEE Trans Geosci Remote Sens, vol. 57, no. 1, pp. 1155–1167, 2019. [Google Scholar]
4. K. J. Xu, H. Huang and Y. Li, “Multilayer feature fusion network for scene classification in remote sensing,” IEEE Geoscience and Remote Sensing Letters, vol. 17, no. 11, pp. 1894–1898, 2020. [Google Scholar]
5. G. Cheng, J. Han and X. Lu, “Remote sensing image scene classification: Benchmark and state of the art,” Proc. IEEE, vol. 105, no. 10, pp. 1865–1883, 2017. [Google Scholar]
6. L. Fang, N. He, S. Li and P. Ghamisi, “Extinction profiles fusion for hyperspectral images classification,” IEEE Transactions on Geoscience and Remote Sensing, vol. 56, no. 3, pp. 1803–1815, 2018. [Google Scholar]
7. G. Cheng, J. Han, L. Guo and J. Ren, “Effective and efficient midlevel visual elements-oriented land-use classification using VHR remote sensing images,” IEEE Transactions on Geoscience and Remote Sensing, vol. 53, no. 8, pp. 4238–4249, 2015. [Google Scholar]
8. B. Zhao, Y. Zhong, G. S. Xia and L. Zhang, “Dirichlet-derived multiple topic scene classification model for high spatial resolution remote sensing imagery,” IEEE Transactions on Geoscience and Remote Sensing, vol. 54, no. 4, pp. 2108–2123, 2016. [Google Scholar]
9. X. Lu, X. Zheng and Y. Yuan, “Remote sensing scene classification by unsupervised representation learning,” IEEE Transactions on Geoscience and Remote Sensing, vol. 55, no. 9, pp. 5148–5157, 2017. [Google Scholar]
10. X. Q. Meng and X. Wu, “Scene classification of high-resolution remote sensing image based on deep convolutior neural network,” Bulletin of Surveying and Mapping, vol. 7, no. 1, pp. 17–22, 2019. [Google Scholar]
11. X. Han, Y. Zhong and L. Cao, “Pre-trained AlexNet architecture with pyramid pooling and supervision for high spatial resolution remote sensing image scene classification,” Remote Sensing, vol. 9, no. 8, pp. 848, 2017. [Google Scholar]
12. N. Liu, X. K. Lu, L. H. Wan, H. Huo and T. Fang, “Improving the separ- ability of deep features with discriminative convolution filters for RSI classification,” ISPRS International Journal of Geo-Information, vol. 7, no. 3, pp. 95, 2018. [Google Scholar]
13. N. Gul, S. Ahmed, A. Elahi, S. M. Kim and J. Kim, “Optimal cooperative spectrum sensing based on butterfly optimization algorithm,” Computers, Materials & Continua, vol. 71, no. 1, pp. 369–387, 2022. [Google Scholar]
14. H. Kwon, S. Hong, M. Kang and J. Seo, “Data traffic reduction with compressed sensing in an aiot system,” Computers, Materials & Continua, vol. 70, no. 1, pp. 1769–1780, 2022. [Google Scholar]
15. S. U. Islam, S. Jan, A. Waheed, G. Mehmood, M. Zareei et al., “Land-cover classification and its impact on peshawar’s land surface temperature using remote sensing,” Computers, Materials & Continua, vol. 70, no. 2, pp. 4123–4145, 2022. [Google Scholar]
16. W. Jiang, X. Liu, D. Shi, J. Chen, Y. Sun et al., “Research on crowdsourcing price game model in crowd sensing,” Computers, Materials & Continua, vol. 68, no. 2, pp. 1769–1784, 2021. [Google Scholar]
17. W. Sung and S. Hsiao, “Rfid positioning and physiological signals for remote medical care,” Computer Systems Science and Engineering, vol. 41, no. 1, pp. 289–304, 2022. [Google Scholar]
18. W. X. Zhou, S. NEWSAM and C. Li, “Learning low dimensional convolutional neural networks for high- resolution remote sensing image retrieval,” Remote Sensing, vol. 9, no, no. 5, pp. 489, 2017. [Google Scholar]
19. K. Simonyan and A. Zisserman, “Very deep convolutional networks for large-scale image recognition,” in Lnternational Conf. on Learning Representations, San Diego: IEEE, Washington, W, USA, pp. 1–14, 2015. [Google Scholar]
20. O. Ronneberger, P. Fischer and T. Brox, U -Net: Convolutional networks for biomedical image segmentation, In: International Conference on Medical image computing and computer-assisted intervention, Cham, C, Switzerland, pp. 234--241, 2015. [Google Scholar]
21. Y. Mu, R. W. Ni, C. Zhang and H. Gong, “A lightweight model of VGG-16 for remote sensing image classification,” IEEE Journal of Selected Topics in Applied Earth Observations and Remote Sensing, vol. 14, no. 1, pp. 6916–6922, 2021. [Google Scholar]
22. P. Helber, B. Bischke, A. Dengel and D. Borth, “A novel dataset and deep learning benchmark for land use and land cover classification,” IEEE Journal of Selected Topics in Applied Earth Observations and Remote Sensing, vol. 12, no. 7, pp. 2217–2226, 2019. [Google Scholar]
23. P. Helber, B. Bischke, A. Dengel and D. Borth, “A novel dataset and deep learning benchmark for land use and land cover classification,” in IGARSS 2018–2018 IEEE Int. Geoscience and Remote Sensing Symp., Valencia, V, Spain, pp. 201–207, 2018. [Google Scholar]
24. W. X. Gao, W. X. Zhang and J. Shuanggen, “Scene classification of high-resolution remote sensing image based on multi-kernel SVM,” Bulletin of Surveying and Mapping, vol. 8, no. 1, pp. 14–21, 2021. [Google Scholar]
25. B. Zhao, Y. Zhong, G. -S. Xia and L. Zhang, “Dirichlet-derived multiple topic scene classification model fusing heterogeneous features for high spatial resolution remote sensing imagery,” IEEE Transactions on Geoscience and Remote Sensing, vol. 54, no. 4, pp. 2108–2123, 2016. [Google Scholar]
26. B. Zhao, Y. Zhong, L. Zhang and B. Huang, “The fisher kernel coding framework for high spatial resolution scene classification,” Remote Sensing, vol. 8, no. 2, pp. 157, 2016. [Google Scholar]
27. Q. Zhu, Y. Zhong, B. Zhao and L. Zhang, “Bag-of-visual words scene classifier with local and global features for high spatial resolution remote sensing imagery,” IEEE Geoscience and Remote Sensing Letters, vol. 13, no. 6, pp. 747–751, 2017. [Google Scholar]
28. Q. Wang, M. Chen, F. Nie and X. Li, “Detecting coherent groups in crowd scenes by multiview clustering,” IEEE Transactions on Pattern Analysis and Machine Intelligence (T-PAMI), vol. 42, no. 1, pp. 46–58, 2020. [Google Scholar]
29. B. Pan, Z. Shi and X. Xu, “Hierarchical guidance filtering based ensemble classification for hyperspectral image,” IEEE Transactions on Geoscience and Remote Sensing, vol. 55, no. 7, pp. 4177–4189, 2017. [Google Scholar]
 | This work is licensed under a Creative Commons Attribution 4.0 International License, which permits unrestricted use, distribution, and reproduction in any medium, provided the original work is properly cited. |