| Computers, Materials & Continua DOI:10.32604/cmc.2022.027077 | |
| Article |
A Deep Learning Approach for Crowd Counting in Highly Congested Scene
1Electrical Section, Universiti Kuala Lumpur British Malaysian Institute, Selangor, 53100, Malaysia
2Department of Electrical Engineering, International Islamic University, Islamabad, 44000, Pakistan
3Department of Information Technology, College of Computer, Qassim University, Buraydah, 51452, Saudi Arabia
4Department of Electrical Engineering, National University of Computer and Emerging Sciences, Islamabad, 44000, Pakistan
5Computer Engineering Technology Section, Universiti Kuala Lumpur Malaysian Institute of Information Technology, Kuala Lumpur, 50250, Malaysia
*Corresponding Author: Kushsairy Abdul Kadir. Email: kushsairy@unikl.edu.my
Received: 10 January 2022; Accepted: 04 March 2022
Abstract: With the rapid progress of deep convolutional neural networks, several applications of crowd counting have been proposed and explored in the literature. In congested scene monitoring, a variety of crowd density estimating approaches has been developed. The understanding of highly congested scenes for crowd counting during Muslim gatherings of Hajj and Umrah is a challenging task, as a large number of individuals stand nearby and, it is hard for detection techniques to recognize them, as the crowd can vary from low density to high density. To deal with such highly congested scenes, we have proposed the Congested Scene Crowd Counting Network (CSCC-Net) using VGG-16 as a core network with its first ten layers due to its strong and robust transfer learning rate. A hole dilated convolutional neural network is used at the back end to widen the relevant field to extract a large range of information from the image without losing its original resolution. The dilated convolution neural network is mainly chosen to expand the kernel size without changing other parameters. Moreover, several loss functions have been applied to strengthen the evaluation accuracy of the model. Finally, the entire experiments have been evaluated using prominent data sets namely, ShanghaiTech parts A, B, UCF_CC_50, and UCF_QNRF. Our model has achieved remarkable results i.e., 68.0 and 9.0 MAE on ShanghaiTech parts A, B, 199.1 MAE on UCF_CC_50, and 99.8 on UCF_QNRF data sets respectively.
Keywords: Deep learning; congested scene; crowd counting; fully convolutional neural network; dilated convolution
Owing to its various applications, crowd analysis in general and counting in the congested scene in particular, has emerged as an effective research area in computer vision. Counting the exact number of people and their density maps estimation in highly congested scenes is a daunting task. Mostly, crowded scenes occur due to panic situations, hazards, and lack of management and control as shown in Fig. 2. It is necessary to understand the risk analysis and safety aspects of crowd dynamics at various important occasions related to sports, cultural and religious activities (specifically Hajj and Umrah) to avoid or minimize the impact of any mishaps. The complexity of monitoring, tracking, and counting increases with the size of the crowd. Usage of drones for crowd detection and counting has achieved popularity due to their ability to travel freely as compared to fixed cameras. In most cases, one drone is enough to provide a fair idea of crowd density and is also effective in capturing and monitoring highly congested scenes with multiple people standing close to each other causing occlusion [1]. Many networks have been proposed to deliver a solution for crowd monitoring during a highly congested scene like assembly controlling, Hajj and umrah, and other such gatherings [2–5]. In recent years, interest in the visual analysis of crowd scenes has grown due to the widespread deployment of security cameras for crowd surveillance, traffic, and planning management, and even counting cells [6]. The current methodologies for analyzing extremely crowded scenes range from basic crowd counts to density map estimates [7]. Crowd disasters are highly likely to occur in highly congested scenes like religious gatherings (Hajj and Umrah) and rallies which make it important to analyze crowd strength [8]. Deep Neural Network (DNN-based) and Convolutional Neural Network (CNN) approaches have recently been used in congested scene analysis because of the classification, regression, and high accuracy these schemes achieved in semantic segmentation [9–11]. Three approaches of scene analysis were proposed by the researchers: namely detection-based counting, regression-based counting, and density map-based counting [12]. The first approach specifies the entire body to locate individuals in the scene which results in occlusions of the body or a small number of pixels per person. This approach is not effective for the highly congested scene. The second approach is to generate the density maps of the heads present in the image and further counting is performed on these features [1,8]. The majority of earlier crowded scene analysis research used multi-scale structures and generated excellent results. However, there are many significant flaws in the design they used: a) the appearance of small objects in images, b) the scene has a lot of clutter and occlusion, so much of the human body is hidden, c) non-uniform crowd distribution and scale variation (appearance of heads), d) as the network grows deeper and deeper, it may take a long time to train, and the branch structure may become ineffective [4,13–18].
Recently, most researchers are focusing on crowd counting and localization, benefited from crowd monitoring (counting) there are some models which are based on crowd head and face detection. The counting and detection of small heads and occluded faces in crowded images is a challenging task, and the traditional model can not perform well in this scenario. To solve the scale variation and occlusion in the congested scene it is important to design and explore a scientific model which can count the crowd in the congested scene.
In our paper, we have designed a Congested Scene Crowd Counting Network having the ability to count in highly congested scenes and to produce a high-quality density map. The main contribution of this work include:
• Generation of high-quality density maps and employment of VGG-16 as a front-end with its 10 layers due to its strong transfer learning rate
• Adaption of Dilated Convolution Neural Network (DCNN) as the back end to get a large range of information from its respective fields
• Application of different loss functions to minimize the error between predicted and real values
The rest of the paper is divided into sections. Section 2 represents the previous works, Section 3 shows CNN and DCNN frameworks for congested scenes, Section 4 elaborates limitations, while Section 5 explains the architecture of Congested Scene Crowd Counting, Sections 6 and 7 describe the training methods, discussions, and conclusion respectively.
2 Related Works and Understanding the Different Computer Vision Techniques for Crowd Counting
The researchers in the field of crowd monitoring and counting aim to understand the domain and apply various machine learning techniques and methodologies to count the number of individuals in a congested environment. Some of the related works presented here are: Inspired by the idea proposed in [19] for crowd counting, there are three most often used approaches in computer vision namely detection-based method, regression-based method, and density-based estimation method. The taxonomy levels of the computer vision techniques are shown in Fig. 1:
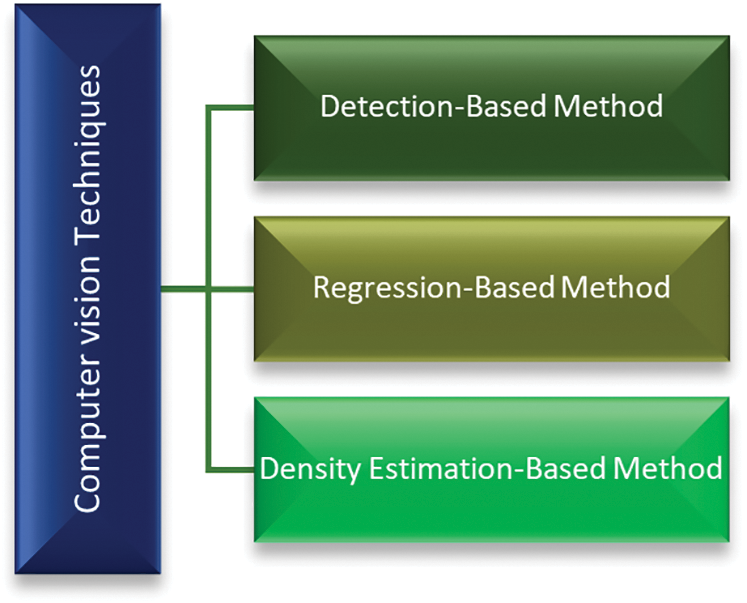
Figure 1: Computer vision techniques
Most preliminary investigations have focused on the detection framework, in which a sliding window is used as a detector to detect [20] and to count the number of people in the scene [21]. Object detectors have been trained to determine the position of each person in a crowd to count them in detection-based approaches. In both monolithic and parts-based detection, detection-based methods are frequently used. Monolithic detection approaches such as [22–25] are often conventional people detection methods that use features (such as Haar wavelets [26], Histogram Oriented Gradients (HOG) [22], edgelet [27], and shapelet [28]) extracted from an entire body of the object to train the classifier. To get low-level information from the entire human body, these methods require well-trained classifiers. The Support Vector Machines (SVM), boosting [29], and random forest [30] are among the different successful learning classifiers used. However, such classifiers are negatively affected by high congested scenes. They have failed to identify the objects in highly congested scenes as the objects are very close to each other and cannot be detected through a moving window. They are also incapable of detecting and counting the number of people [31]. To deal with this challenge, researchers have recommended detecting a specific point in the object rather than the whole object to carry out crowd scene analysis [32]. Correspondingly, a part-based detection approach [33–35] has been endorsed. In part-based detection approaches, a specific part of the object (such as the head) is detected for people counting in a specific window [21].
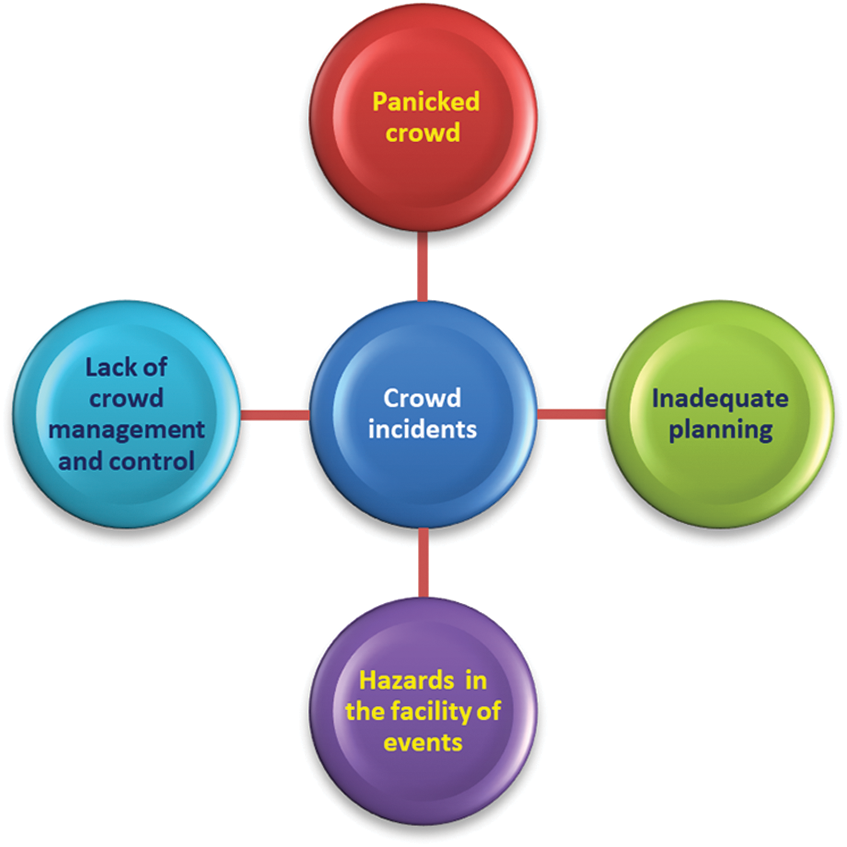
Figure 2: Crowd incidents
While parts-based algorithms are used to lessen the difficulty of detecting objects in high-density crowd situations, they are less effective in the face of very high-density crowds or noisy background images. To deal with this challenge, researchers have proposed counting objects by performing regression-based methods [36–38]. The regression-based method estimates the number of features after performing regression between image features and crowd size. Low-level information has been generated using additional elements such as foreground and texture [39]. Because they acquire generalized density information from crowd images, regression-based methods perform well in the high-density situation. On the other hand, the method has two significant drawbacks: poor performance owing to overestimation and crowd misdistribution [40].
2.3 Density Estimation-based Methods
Both of the preceding techniques were successful in addressing occlusion and clutter concerns. Because they were regressing on a global count, they frequently failed to cope with critical spatial information [41]. The authors of [42] sought to find a linear mapping between local patch features and corresponding object density maps. By that means they incorporate spatial information in the learning process. The tough process of identifying and localizing objects has been avoided as a consequence of adopting this technique of image density estimation that is integral over any region in the density map and offers the count of objects inside that region. The density estimation-based method uses a density map for crowd counting. It initially generates a density map for the objects. Following that, the algorithm learns a linear mapping between the extracted features and their objects’ density maps. When adopting the regression-based method, one key component known as saliency is ignored, resulting in incorrect endings in the local region. This problem was handled in [42] by utilizing linear mapping between local area features and density maps. It adds saliency information throughout the learning phase, since achieving an optimum linear mapping is quite a challenging task. To learn a nonlinear mapping, the author of [43] used random forest regression rather than linear regression.
3 CNN and Deep CNN Frameworks for Highly Congested Scene
Deep Convolutional Neural Networks (DCNN) is an Artificial Neural Network (ANN) that generates hierarchical representations from spatial data in digital images. It was designed to operate with multidimensional (2D and 3D) arrays of high-resolution input data sets such as images and videos [11,44]. Alex Net [11], with seven hidden layers and millions of parameters, was the first DCNN architecture. Image classification [44], crowd counting in congested scenes [45], region-based crowd counting [46], crowd counting [47], and people localization [48] have all demonstrated incredible performance using DCNN. Because of the popularity of CNN and DCNN in a variety of computer vision applications, researchers are being urged to apply their skills to turn crowd images into density maps by learning nonlinear functions [49,50].
4 Limitations of State-of-the-Art Methods
The authors recently presented the Supervised Spatial Divide-and-Conquer Network (SS-DCNet) and the Spatial Divide-and-Conquer Network (S-DCNet), both of which employ spatial divide and conquer networks to count crowds [51,52]. Similarly, in [4] switched CNN is developed, which selects various regressors for input patches using a density level classifier. A contextual pyramid CNN was presented in [13], which employs CNN networks to predict context at multiple levels to get a lower-level error and high-quality density maps. Both techniques employed a Multi-Column Convolutional Neural Network (MCNN)-based architecture and produced good results. However, the main drawbacks of these architectures are taking a large amount of training time, compulsion to use density level classifier rather than of sending images in the MCNN, and implementation of more columns which makes the model more complicated, and it is hard to train properly as described in [15]. Considering all these drawbacks, we propose a unique method of focusing on the deeper features of a crowded scene and producing high-quality density maps. We will focus on crowd counts in congested areas. This model aims to design a deeper convolutional neural network using VGG-16 with its first ten layers as a front end. Further, we increased the dilation rates of the hole convolutional network to get a large level of information from the images which can capture the high-level feature i.e., heads with larger respective fields, as well as the generation of high-quality density maps. Finally, counting the number of individuals in highly congested scenes is done.
5 Understanding the Architecture of Congested Scene Crowd Counting Network (CSCC-NET)
In this model, we first used VGG-16 with its first 10 layers as a front-end with different dilation rates as shown in Fig. 3. VGG-16 has been used in this model because of its robust transfer learning and adaptable architecture. The main idea of dilated convolution is to extend the kernel without increasing the parameters. So, if the dilation rate is “3”, we take the kernel and convolve it on the entire image. Similarly, if we further increase the dilation rate to “4”, once again we can convolve the kernel on the entire image. VGG-16 has been used in different models like in [16] they shaped the first 13-layers of VGG-16 directly and added a 1 × 1 convolutional layer. But the performance was not quite good. Similarly, before sending input images to MCNN, VGG-16 was used as a density level classifier in [4]. CP-CNN has combined the classification results with density map-generating features in [13]. In such cases, VGG-16 works as a supplement to the final accuracy rather than enhancing it. We eliminated the classification component of VGG-16, i.e., fully connected layers, from the model and developed the intended CSCC-Net with the first 10 layers of VGG-16 as a front-end network. Inspired by [53–55], a dilated convolutional neural network with different dilation rates has been used as a back end for the extraction of deeper features. If we keep stacking more convolutional and pooling layers (basic components in VGG-16), the output size will shrink even further, making it difficult to create high-quality density maps. It's a good substitute for a pooling layer. Although pooling layers (e.g., max and average pooling) are often used to maintain invariance and minimize overfitting, they substantially reduce spatial resolution, meaning that spatial information from feature maps is lost. As seen in Fig. 3, dilated convolution with sparse kernels is a better choice for now. The sparse kernel is used to increase the size of the corresponding fields while keeping the parameters and computation time the same. The output picture of the front-end network is one-ninth the size of the input image. Because the output result should match the input image, the width and height are reduced by one-ninth. The inter cubic transformation method is applied, and the result is multiplied by “81” to keep the total number of image pixels the same.
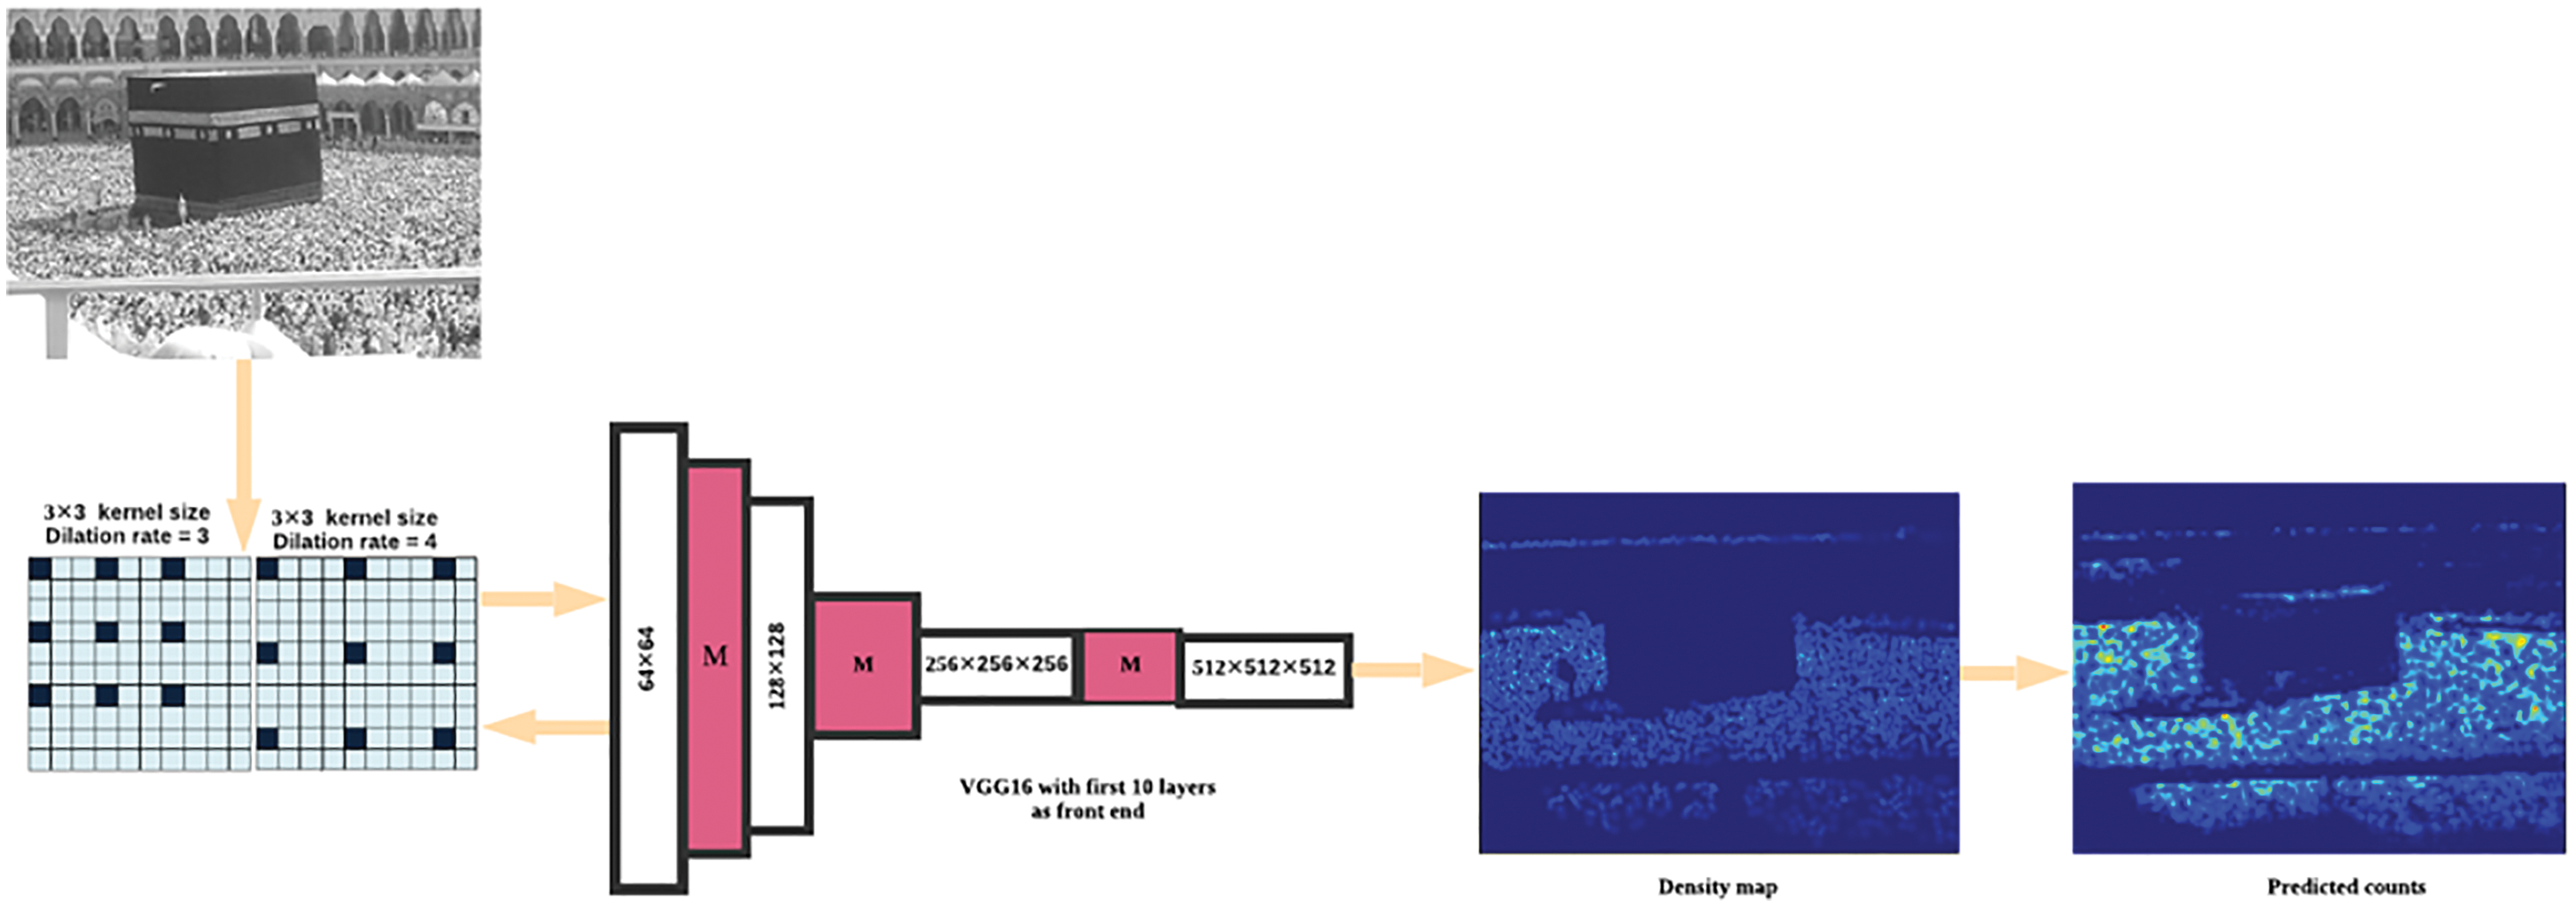
Figure 3: The architecture of CSCC-net
The convolution kernel is a small matrix that is used in the convolution process. The pixel matrix of each layer is continuously tested in steps. The number of tests is multiplied by the number of convolution kernel's corresponding location, and then the sum is calculated. Each test gets a value and generates a new matrix after testing all pixels. The main idea of dilated convolution is to enlarge the kernel while keeping the parameters the same. So, if the dilation rate is 1, we convolve the kernel over the entire image. When the dilation rate is increased to 2, the kernel expands. It is an alternative to pooling layers. Dilated convolution offers the benefit of extending the corresponding field while keeping the parameters and computation time the same. It also maintains the resolution of the feature map more accurately and effectively than other networks.
The Gaussian convolution is used to produce the GT map. For each target point x, the nearest k neighbors are found. The average distance is obtained by the correlation calculation
where xi represents each head marking point, and label with N heads can be expressed as H(x). Here x represents a two-dimensional coordinate, so H (x) is the matrix with only 0 and 1.
It has been seen that the value of variance σ is geometrically adaptive. We utilized
5.3 Generation of Density Maps
In crowd analysis, counting occlusion is the main challenge among crowds. To deal with this issue density maps were proposed in [56]. Density maps are regressing targets per pixel. To regress the density maps is the prediction of dense crowds [9,57,58]. The annotations are most likely provided as the coordinates of human heads in the image in all data sets. These coordinates can then be used to generate a density function [59]. The technique of producing density maps from an annotated file is briefly described here. Create a matrix the same size as the original image and set it to zero, then modify each marked head's position to one. As a result, one may obtain a matrix of 0 and 1, which is then convolved by the Gaussian kernel function to provide a continuous density map. To summarize, the density map is generated via Gaussian convolution on a matrix with only 0 and 1 values [15]. The density map generation can be formulated as:
where
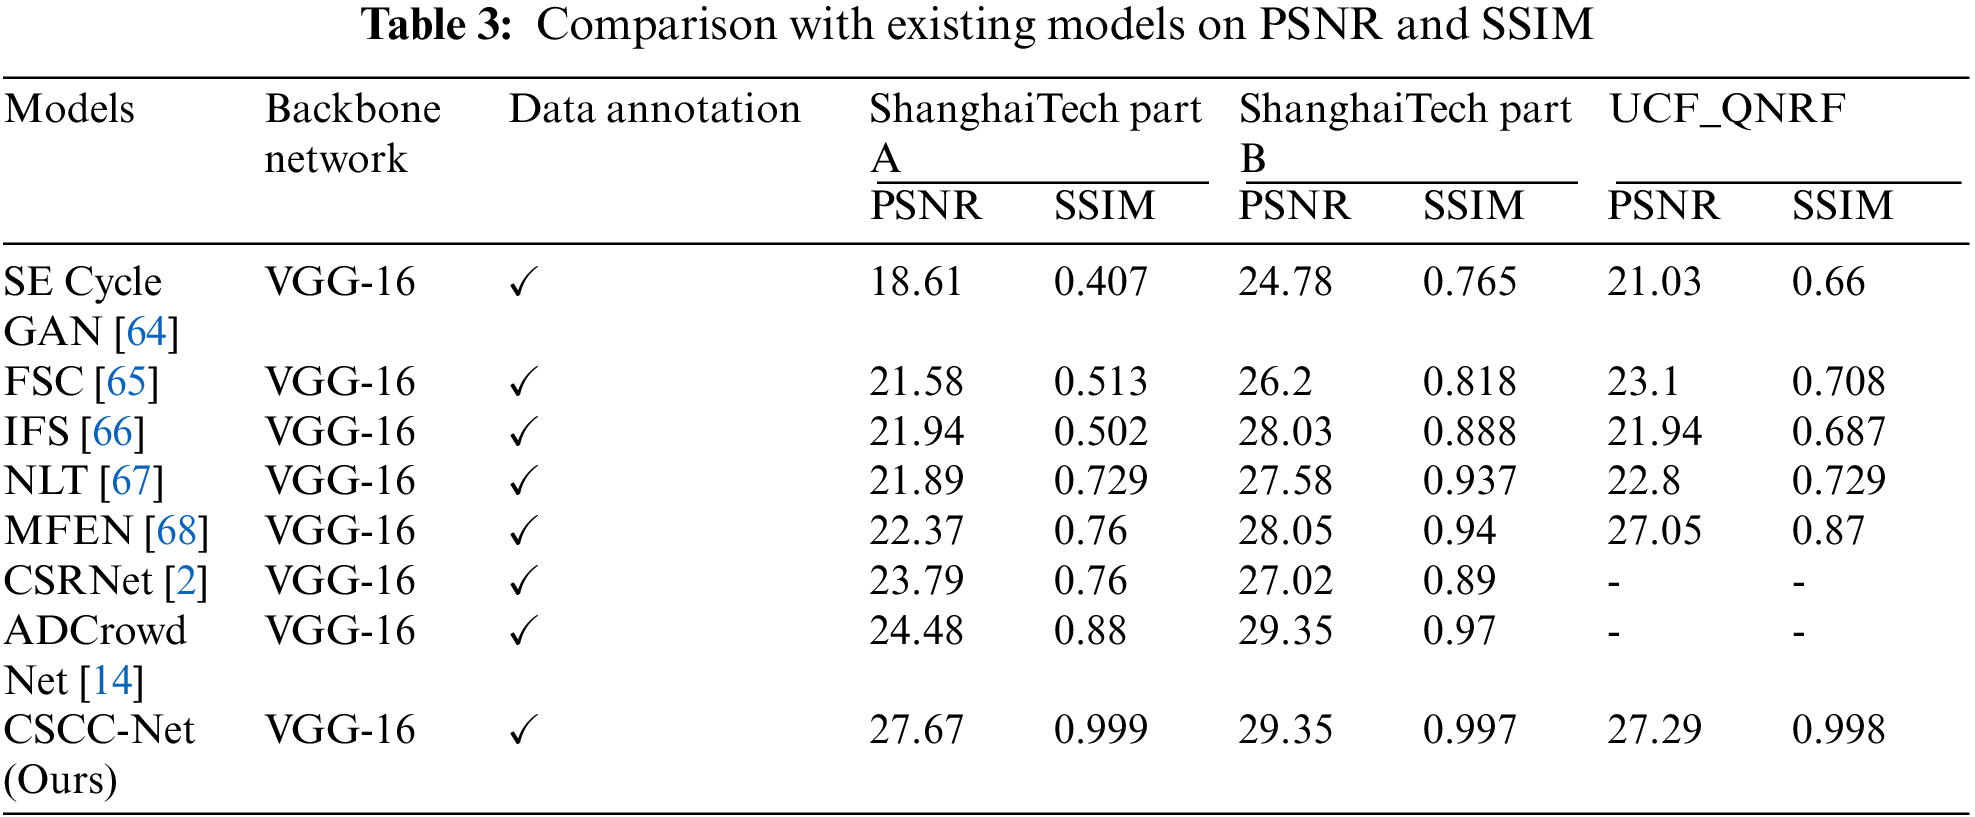
To further assess the quality of density maps, we use the Peak Signal to Noise Ratio (PSNR) and the Structural Similarity Index (SSIM) [60] the results are shown in Tab. 3.
where
6 Training Methods and its Detail
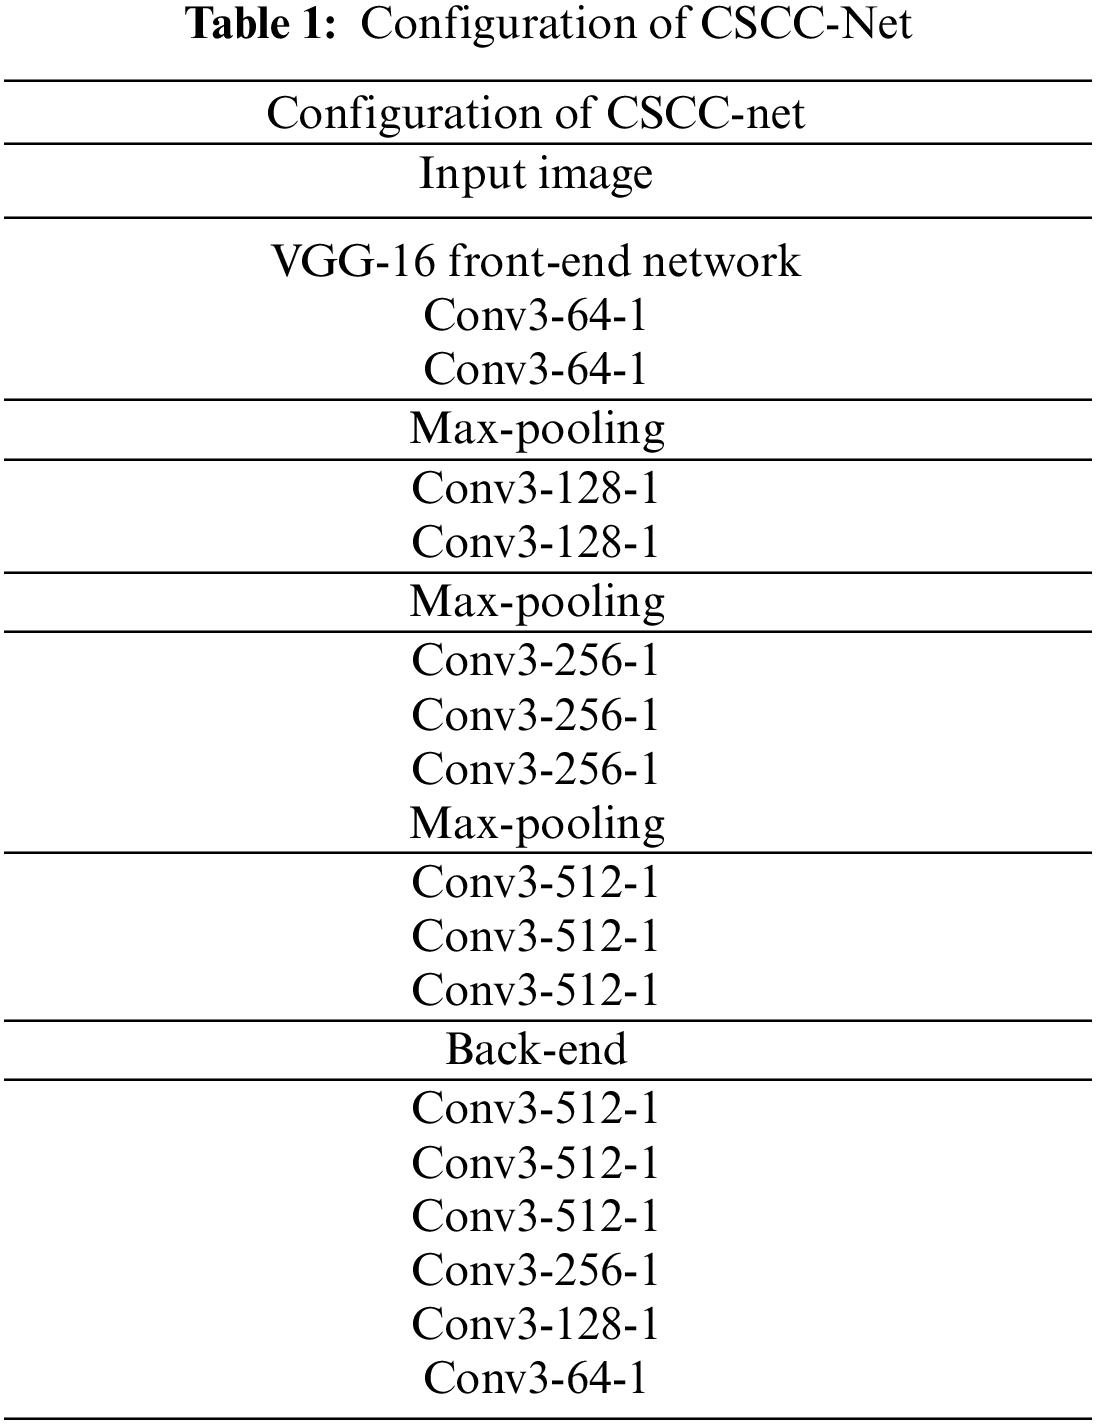
In the training phase, we use VGG-16 [44] with its first 10 layers for 2D feature extraction as a front-end and hole dilated convolutional neural network has been employed as a back end to switch the pooling layers in the CSCC-Net model. The dilated kernels are used to deliver a large reception field. A well-trained VGG-16 is used to fine-tune the first 10 layers [44]. In the first ten layers of VGG-16, the ReLU has been employed as an activation function. The last three layers in VGG-16 have been removed due to the absence of features they possess. A unified convolutional kernel, size 3 × 3, in each layer is used to reduce the complication of the network. Only three of the five maximum pooling layers of VGG-16 have been used. The basic role of these pooling layers is to suppress the over-fitting. If we use all the five max-pooling layers, then it would affect the output accuracy of the entire model and the image resolution as well, therefore we have minimized the number of max-pooling layers. To maintain the resolution of the image, the hole dilated convolution has been more effective than other networks. The first convolutional layer, such as conv3-64-1, means the size of the convolution kernel is 3 × 3, the number of filters 64 and the dilation rate is 1 as shown in Tab. 1. To quantify the distance between the generated density map and the ground truth map, a fixed learning rate, such as le-7, and Euclidean distance are employed. We have used different loss functions as shown in Tab. 2 during the training phase and found the L1 Loss function quite good as compared to other loss functions. To reduce the possibility of an error, the L1 Loss function is used.
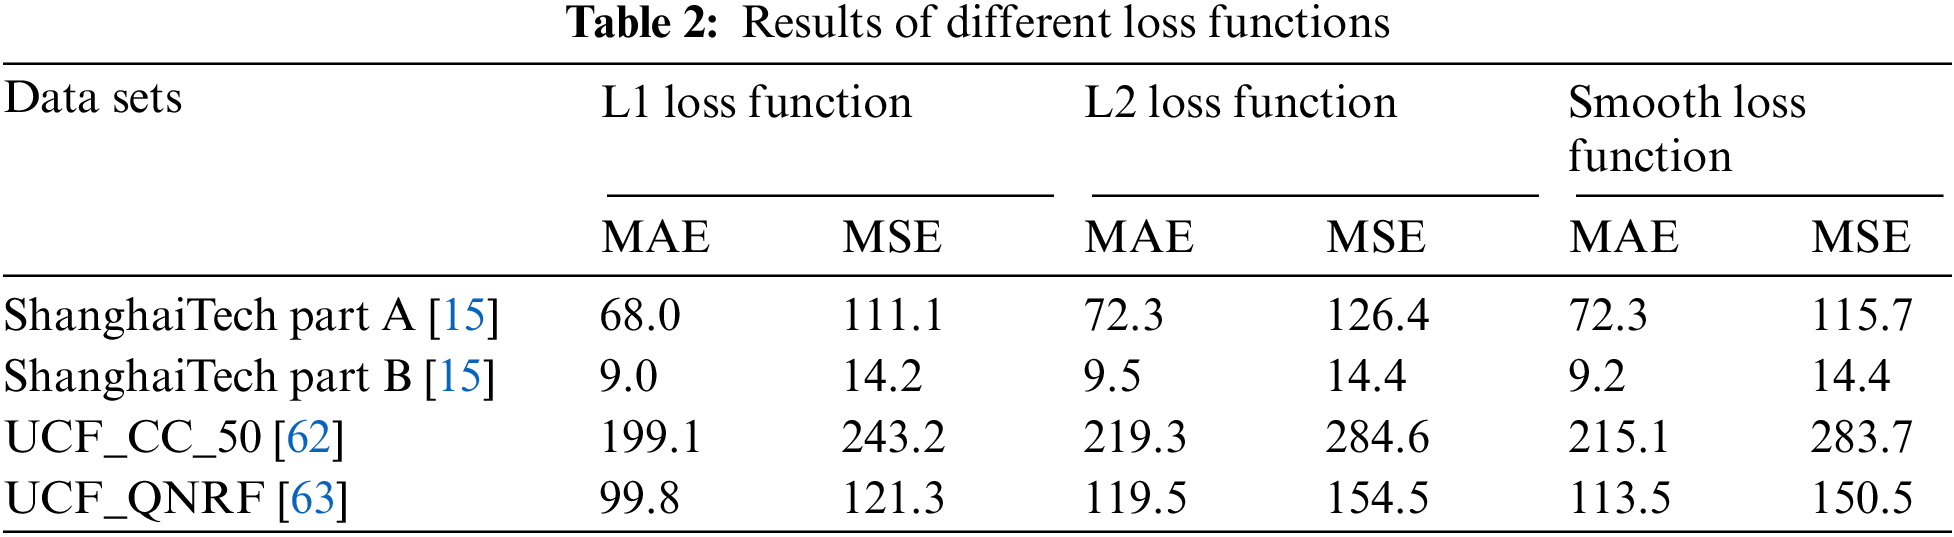
The loss function is one of the most significant research topics in machine learning since it is used to build machine learning algorithms and enhance their performance. The loss functions have been concerned and explored by different researchers and it has still a big gap to summarize, analyze, and compare the classical regression loss functions [61]. Some classical loss functions are widely used for regression problems.
The L1 Loss Function is defined as the sum of all absolute differences between the true and predicted values. It is mathematically defined as:
where
The L2 Loss function is used to measure the mean squared error between actual and predicted values respectively. It is also called mean squared error which can be mathematically represented as:
where x shows the actual value and y predicted value.
The Smooth L1 Loss function is used in the regression problems when the features have high values. It is also called Huber loss and mathematically expressed as:
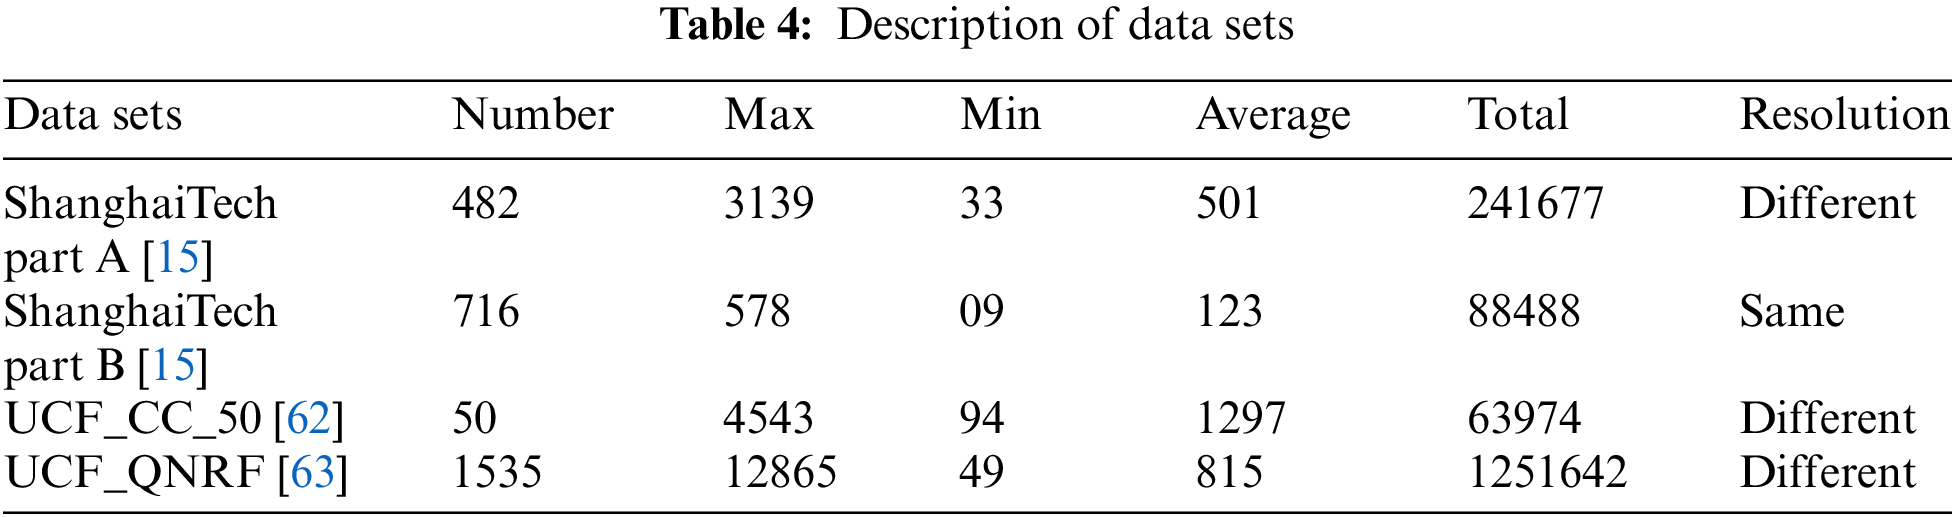
Several publicly accessible crowd data sets are used to validate the experimental outcomes. Tab. 4 lists some of the publicly accessible data sets as well as their description.
6.3 Experimental Results and Discussion
The proposed model was tested on three of the most popular highly congested scene data sets i.e., ShanghaiTech Part A, B [15], UCF_CC_50 [62], and UCF_QNRF [63]. We used these data sets to train the model in phases, the training and validation errors are shown in Fig. 5, Fig. 6, Fig. 7, and Fig. 8 then compared the results to previous state-of-the-art models. Our model has improved in the competition because of its reduced Mean Absolute Error (MAE) and Mean Squared Error (MSE) rates and the counting results are shown in Fig. 4. The learning rate for the entire model has been adjusted at le7 with the inclusion of batch sizes 1 and 2, respectively. The L1 Loss function with Stochastic Gradient Descent (SGD) was utilized as a loss function and an optimizer, respectively. The parameter of the gaussian kernel function varies depending on the data set. For ShanghaiTech part A, UCF_QNRF, and UCF_CC_50, we utilized a geometry adaptive kernel, but for ShanghaiTech part B, we used a fixed kernel size σ = 11. The parameters needed to produce the density map are k, which is the average distance between k adjacent heads, and β, which is a coefficient. When doing congested crowd counting, the kernel can be modified based on the data set. To calculate the errors between estimated values and predicted values we adhere to the existing works [41,56] to employ the MAE and MSE as evaluation metrics. The MAE metric reflects the accuracy of crowd estimation algorithms, whereas the MSE metric reflects the robustness of estimation. They are mathematically defined as:
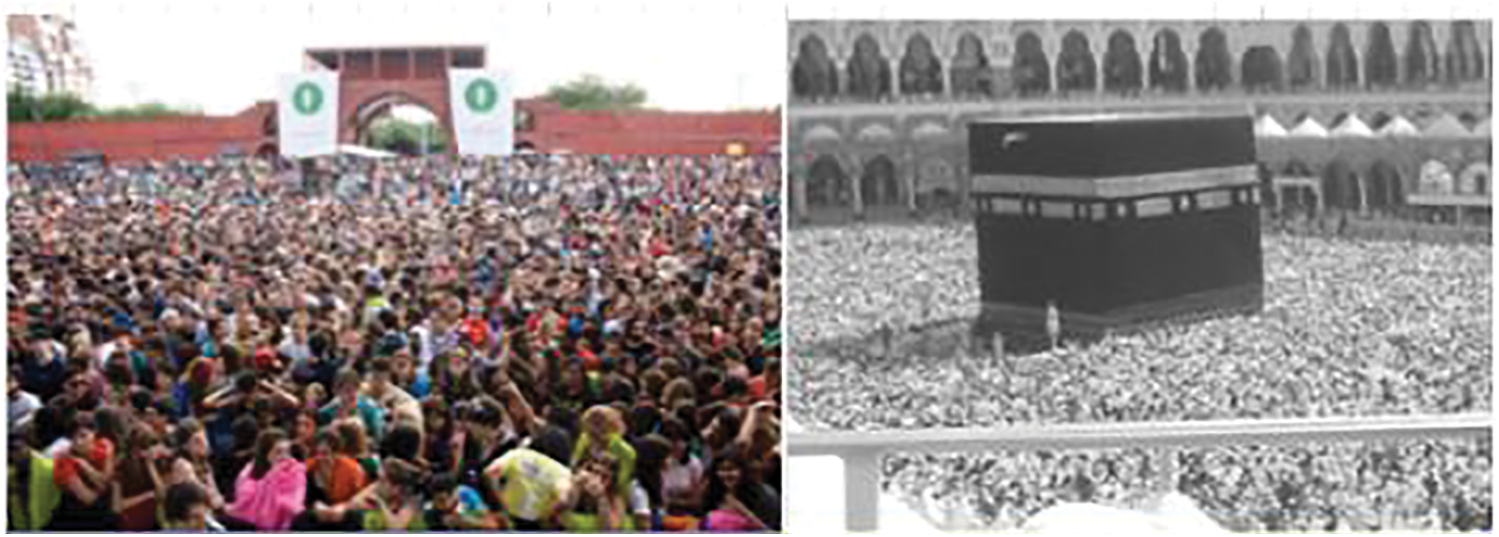
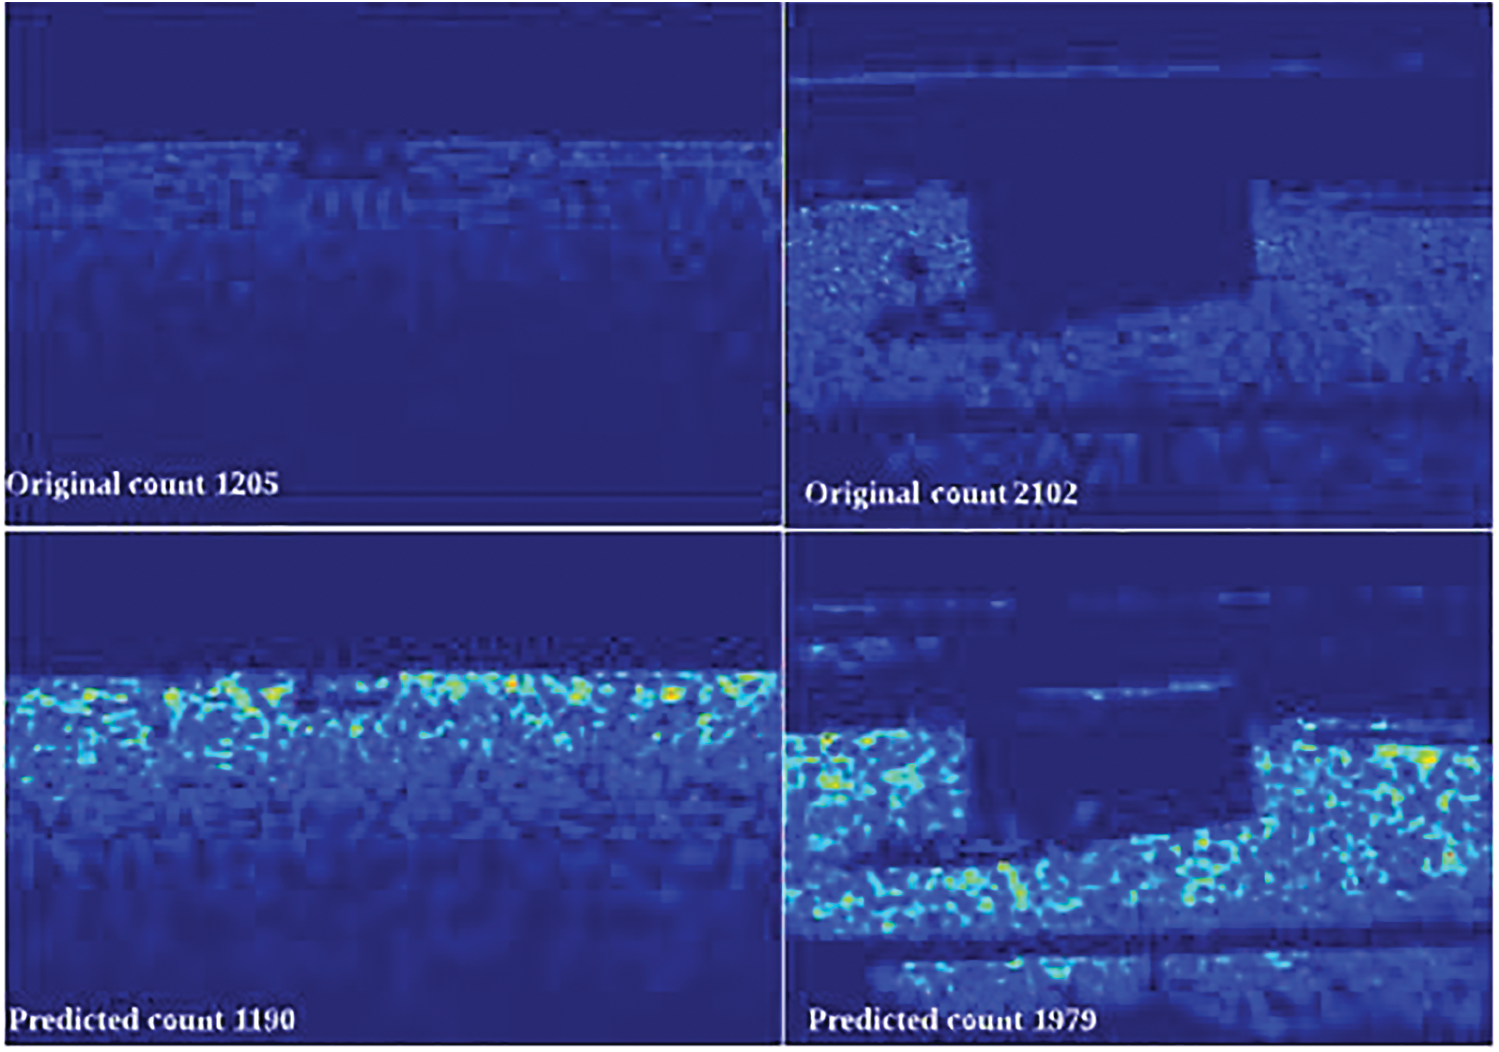
Figure 4: Counting results
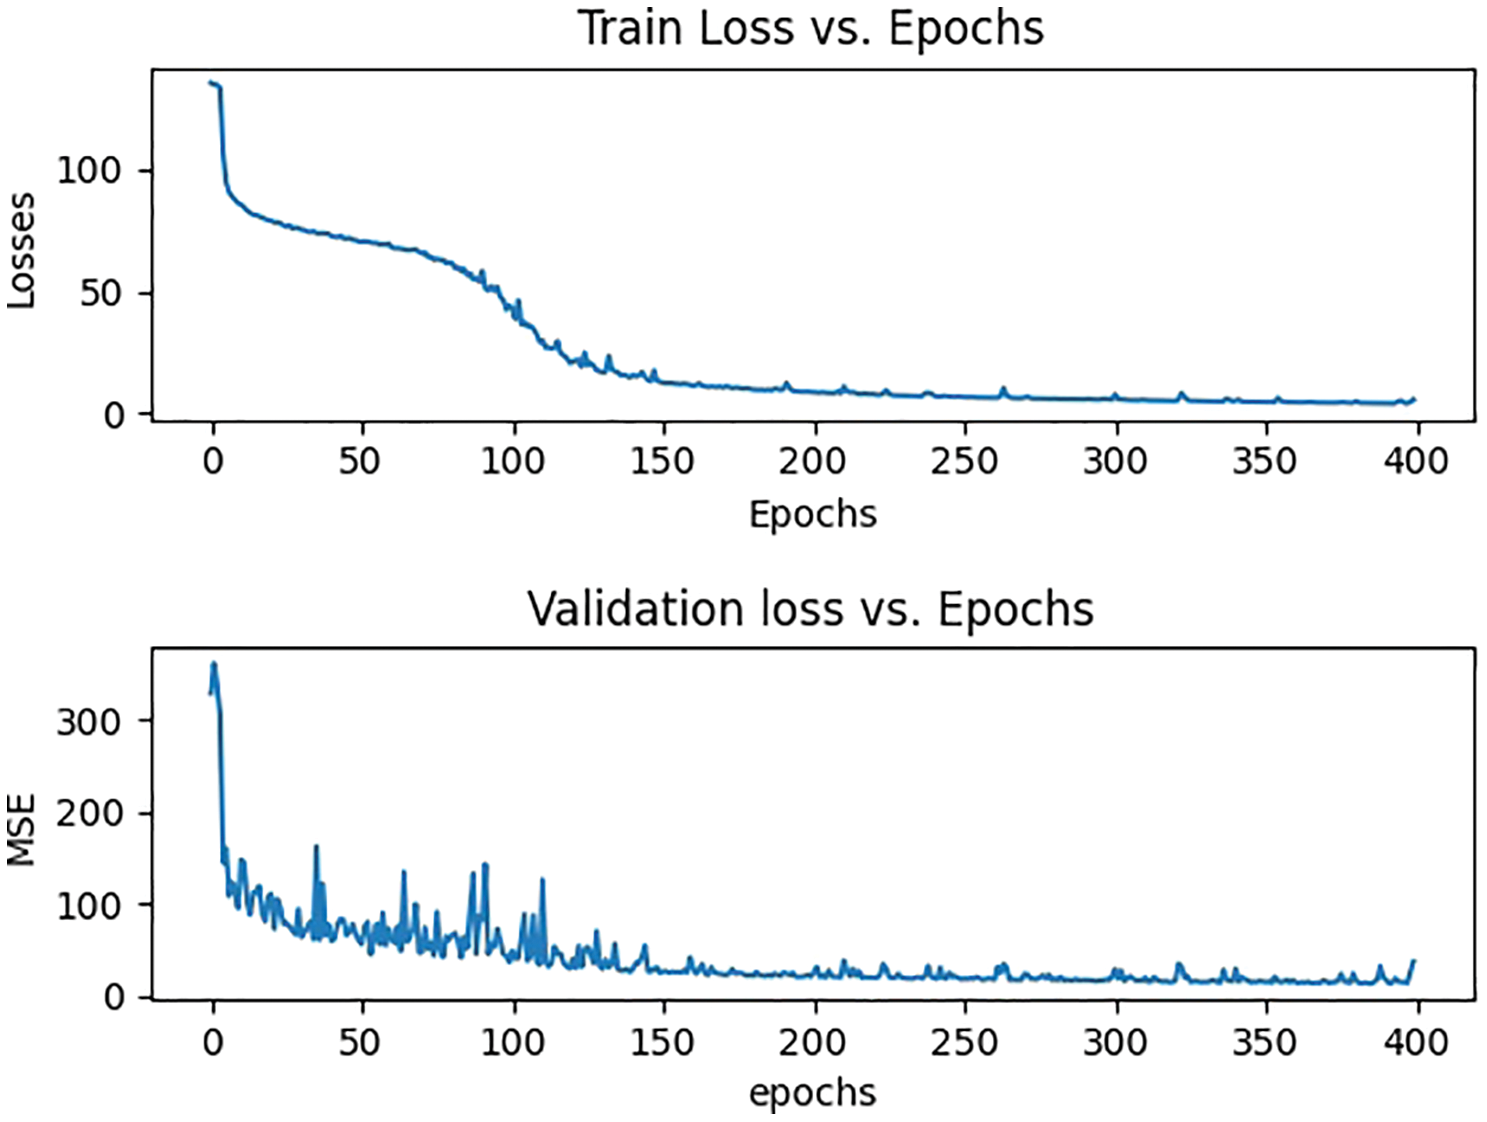
Figure 5: Training and validation losses of part A
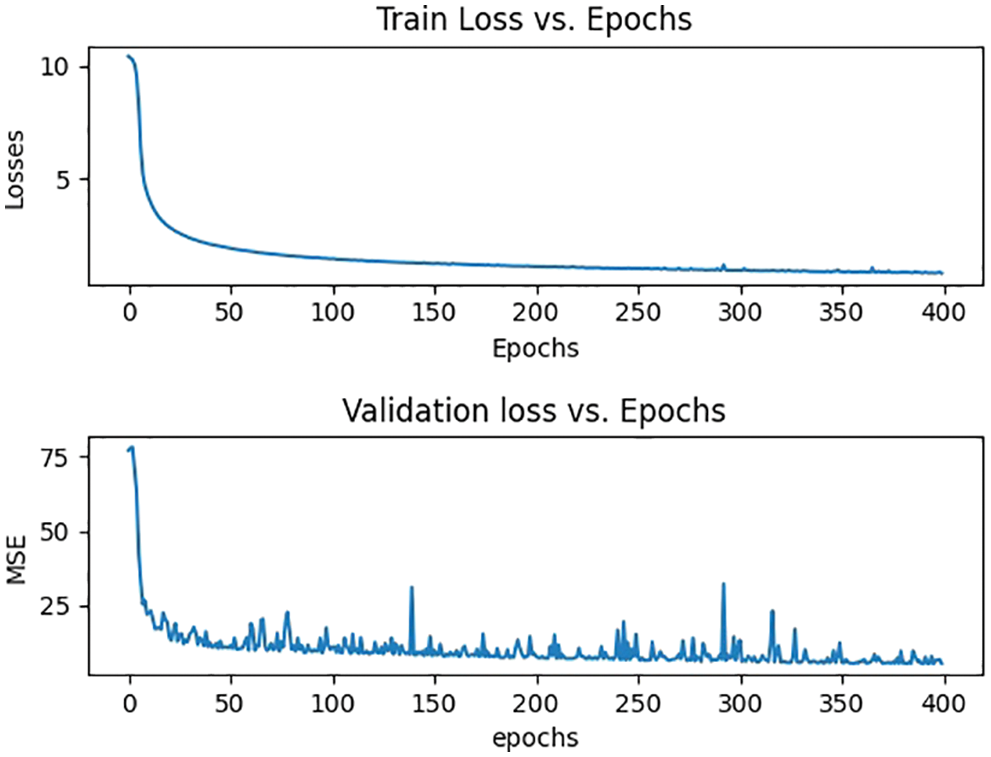
Figure 6: Training and validation losses of part B
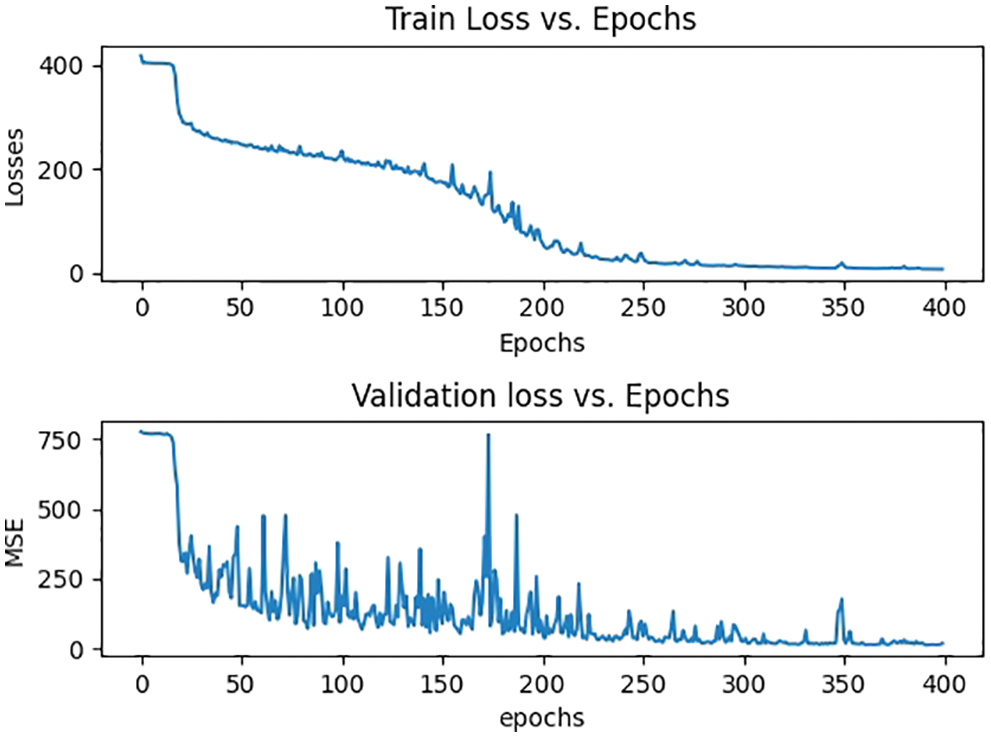
Figure 7: Training and validation losses of UCF_CC_50
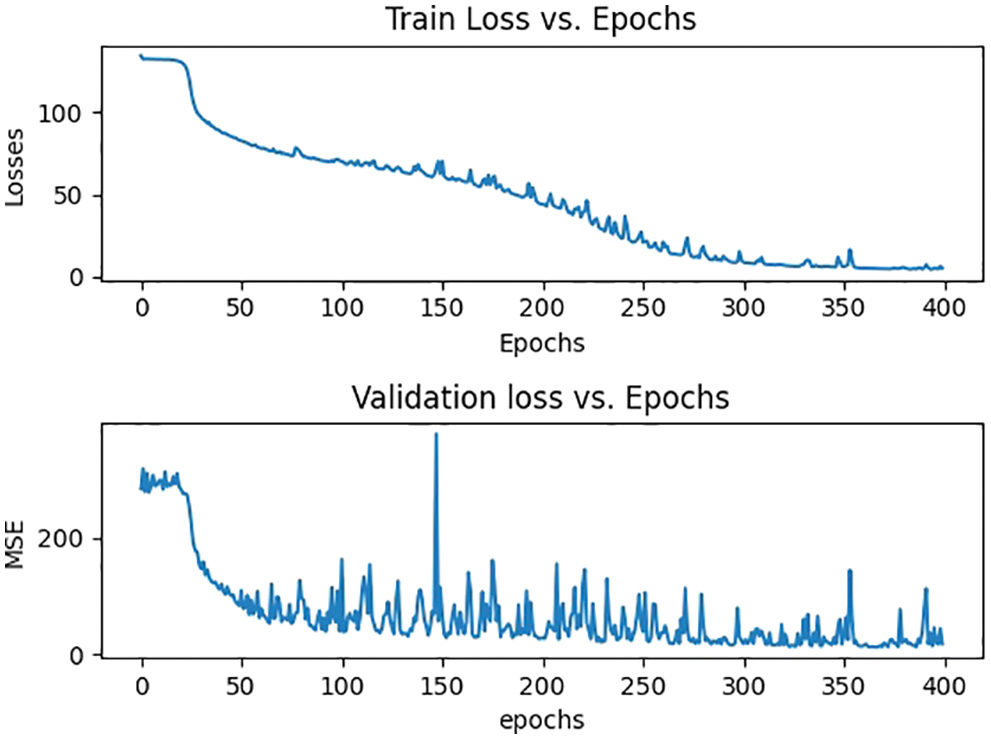
Figure 8: Training and validation losses of UCF_QNRF
6.4 ShanghaiTech Part A, B Data Sets
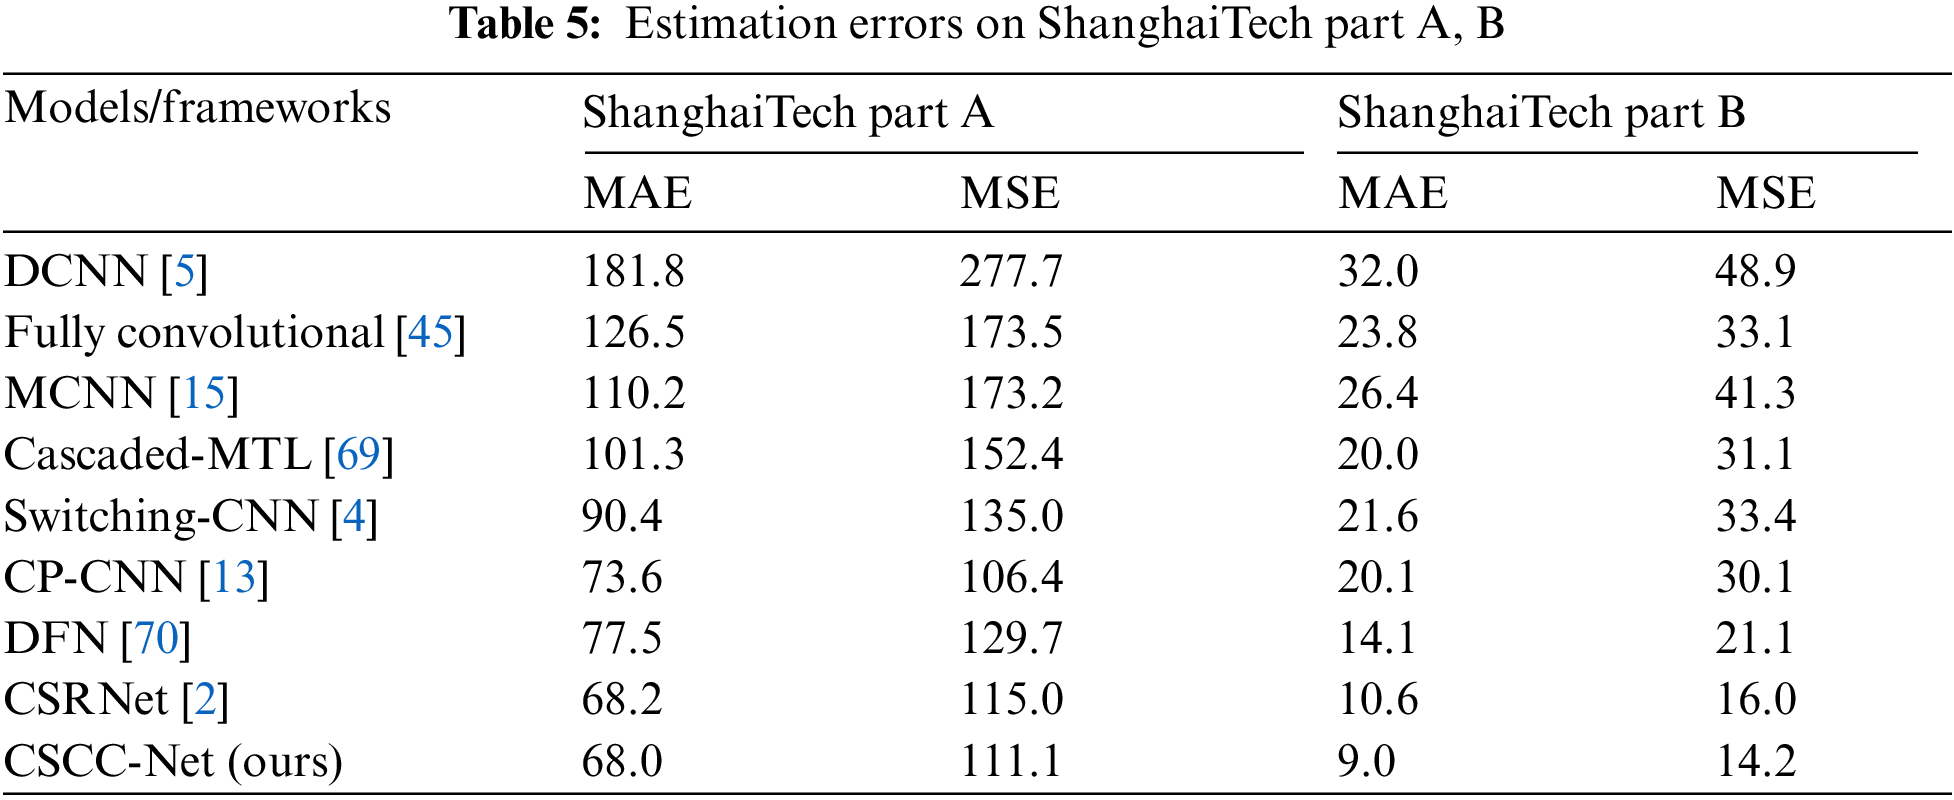
The ShanghaiTech data set, a typical big data set, contains the most labeled population and is divided into two sections, A and B. In [15] the ShanghaiTech data set for large-scale crowd counting was published. Comprising 1198 images with a total number of 330,165 annotated heads. In terms of head annotation, it is the largest data set. In part A, Images are chosen from the Internet, with a total of 482 annotated images of various resolutions. Each image has a total of 501 people, with 33 being the minimum and 3139 the maximum number of persons. The population density is very high and congested with a total number of people equaling 241,677. This data set has been further split up into two parts i.e., test data and train data. The train data set includes 300 images whereas test data includes 182 images in total. Part A images are highly congested scenes data set in which a lot number of people are standing very close to each other. Part B, on the other hand, has 716 images taken from Shanghai metropolitan street. Part B has relatively sparse images as compared to part A. The resolution of each image is 768 × 1024. Each image has an average of 123 people, with 9 being the minimum and 578 being the maximum. The overall number of people in part B is 88,488 having a low crowd density. It is also split into training and testing, whereas in training the total number of images is 400 while in testing it has 316 images. We compared the model's performance to that of other models. In [5] the authors have designed a single-column structure that can count and generate density maps simultaneously from an image. In [45], a single-column CNN architecture was presented for scaling the image and determining the total number of individuals and then changing the image into different proportions. MCNN, a three-column CNN structure approach, figured out the mapping relationship between image and density maps [15]. Similarly, in [69] a novel CNN end-to-end cascaded network was used to simultaneously learn crowd count classification and density map estimation. The switching convolutional network has been suggested in [4] that influences variation of crowd density within an image enhances the accuracy. These models have used ShanghaiTech part A and part B data set for their experimental evaluation. The Tab. 5 shows the mathematical evaluation of Shanghai Tech part A, B.
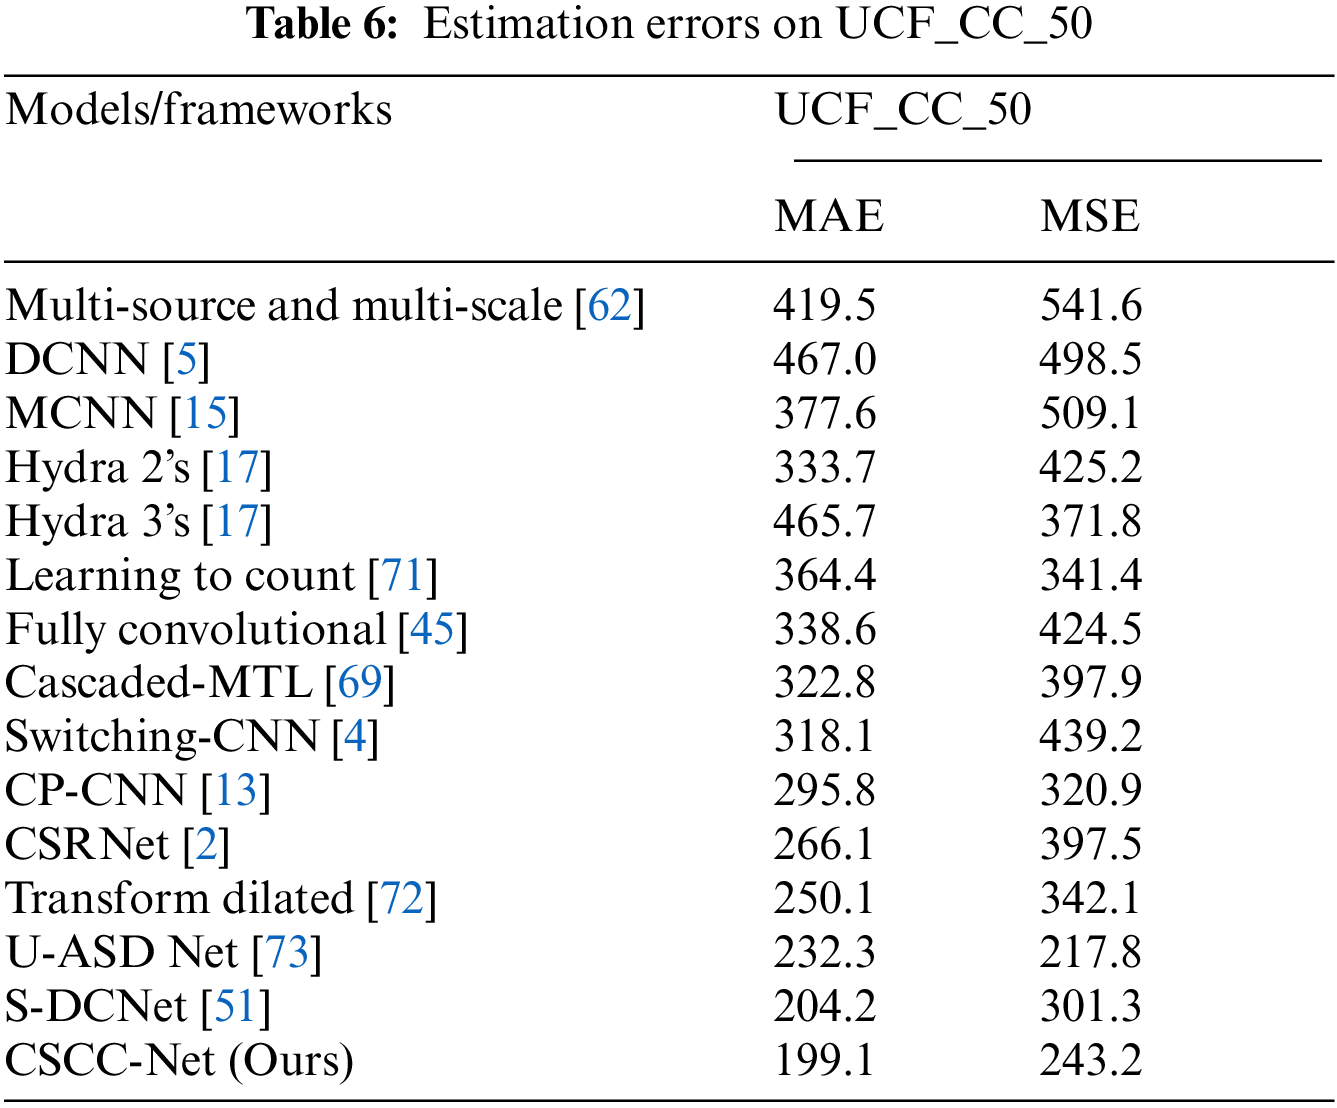
The UCF_CC_50 data set [62] is quite challenging to work with since it has a broad range of densities as well as a variety of scenarios. This data was gathered in a variety of places, including concerts, political rallies, stadiums, and the hajj and umrah. There are a total of 50 annotated pictures, with 1279 people per image. This data set's resolution fluctuates, and the number of people ranges from 94 to 4543, suggesting a considerable variation in the image. 5-fold cross-validation was carried out, with the normal setting of [62]. Tab. 6 compares the results of MAE with MSE.
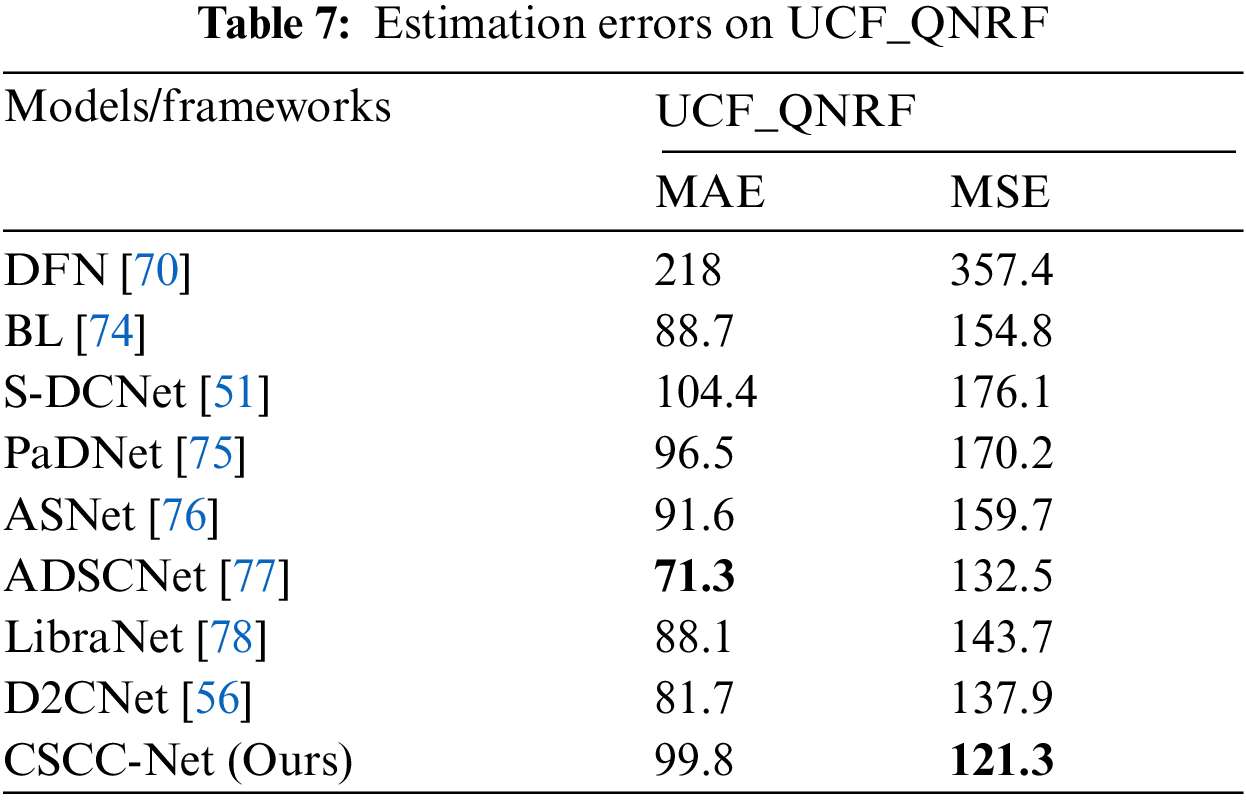
The UCF_QNRF data set includes 1,535 high-resolution crowded images obtained from the internet with counts ranging from 49 to 12865. Because this data set is extremely crowded, it is difficult to deal with it. It has the greatest number of crowd images and annotations, as well as a broader range of scenarios with the most diverse collection of perspectives, densities, and illumination changes. In comparison to ShanghaiTech, the resolution is high. The average density, or the number of people per pixel, is also the lowest among all images, suggesting high-quality large images. The existence of background areas, which include both high-density and zero-density regions, leads to reduced per-pixel density. Part A of the Shanghai collection also includes high-count crowd images, although these are heavily cropped to include just crowds. In contrast, the UCF_QNRF data set includes buildings, plants, roads, and the sky as they appear in actual situations. This increases the data set's realism while also making it more difficult [56,63]. The experimental results have been shown in Tab. 7.
In this paper, a new framework has been presented, called the Congested Scene Crowd Counting Network (CSCC-Net). This new framework is capable of not only counting the number of people in a highly congested scene but can also generate high-quality density maps. Ground truth values were first created in the context of CSCC-Net to build a high-quality density map for crowd counting in congested scenes. We investigated the concept of congested scene recognition by including a robust VGG-16 network with its first 10 layers as front-end and a hole dilated convolution neural network as the back end. The main benefit of a hole dilated convolution neural network is that it expands the respective fields without losing the resolution of images. We conducted comprehensive experiments on four highly congested data sets to validate our model's performance and value. When the proposed framework's findings were compared to state-of-the-art methodologies, the results of the proposed framework were found to be superior. The CSCC-Net produced impressive results in terms of two significant statistical measurements, namely MAE and MSE. In the future, we intend to explore and modify the network and use it on other computer vision tasks such as crowd localization.
Acknowledgement: The authors are grateful to the Saudi Arabia Ministry of Education's Deputyship for Research and Innovation for financing this study under Project Number QURDO001. The title of the project is Intelligent Real-Time Crowd Monitoring System Using Unmanned Aerial Vehicle (UAV) Video and GPS Data.
Funding Statement: This research is supported by the Ministry of Education Saudi Arabia under Project Number QURDO001.
Conflicts of Interest: The authors declare that they have no conflicts of interest to report regarding the present study.
References
1. J. Gonzalez-Trejo and D. Mercado-Ravell, “Dense crowds detection and surveillance with drones using density maps,” in 2020 Int. Conf. on Unmanned Aircraft Systems (ICUAS), Athens, Greece, IEEE, pp. 1460–1467, 2020. [Google Scholar]
2. Y. Li, X. Zhang and D. Chen, “Csrnet: Dilated convolutional neural networks for understanding the highly congested scenes,” in Proc. of the IEEE Conf. on Computer Vision and Pattern Recognition, Salt Lake City Utah, pp. 1091–1100, 2018. [Google Scholar]
3. T. Li, H. Chang, M. Wang, B. Ni, R. Hong et al., “Crowded scene analysis: A survey,” IEEE Transactions on Circuits and Systems for Video Technology, vol. 25, no. 3, pp. 367–386, 2014. [Google Scholar]
4. D. Babu Sam, S. Surya and R. Venkatesh Babu, “Switching convolutional neural network for crowd counting,” in Proc. of the IEEE Conf. on Computer Vision and Pattern Recognition, Honolulu Hawaii, pp. 5744–5752, 2017. [Google Scholar]
5. C. Zhang, H. Li, X. Wang and X. Yang, “Cross-scene crowd counting via deep convolutional neural networks,” in Proc. of the IEEE Conf. on Computer Vision and Pattern Recognition, Boston Massachusetts, pp. 833–841, 2015. [Google Scholar]
6. Y. Xue, Y. Li, S. Liu, X. Zhang and X. Qian, “Crowd scene analysis encounters high density and scale variation,” IEEE Transactions on Image Processing, vol. 30, pp. 2745–2757, 2021. [Google Scholar]
7. C. Zhang, K. Kang, H. Li, X. Wang, R. Xie et al., “Data-driven crowd understanding: A baseline for a large-scale crowd dataset,” IEEE Transactions on Multimedia, vol. 18, no. 6, pp. 1048–1061, 2016. [Google Scholar]
8. I. Bakour, H. N. Bouchali, S. Allali and H. Lacheheb, “Soft-csrnet: Real-time dilated convolutional neural networks for crowd counting with drones,” in 2020 2nd Int. Workshop on Human-Centric Smart Environments for Health and Well-Being (IHSH), Boumerdes, Algeria, IEEE, pp. 28–33, 2021. [Google Scholar]
9. J. Long, E. Shelhamer and T. Darrell, “Fully convolutional networks for semantic segmentation,” in Proc. of the IEEE Conf. on Computer Vision and Pattern Recognition, Boston Massachusetts, pp. 3431–3440, 2015. [Google Scholar]
10. F. Chollet, “Xception: Deep learning with depth wise separable convolutions,” in Proc. of the IEEE Conf. on Computer Vision and Pattern Recognition, Hawaii Convention Center, USA, pp. 1251–1258, 2017. [Google Scholar]
11. A. Krizhevsky, I. Sutskever and G. E. Hinton, “Imagenet classification with deep convolutional neural networks,” Advances in Neural Information Processing Systems, vol. 25, pp. 1097–1105, 2012. [Google Scholar]
12. A. Khan, J. Ali Shah, K. Kadir, W. Albattah and F. Khan, “Crowd monitoring and localization using deep convolutional neural network: A review,” Applied Sciences, vol. 10, no. 14, pp. 4781, 2020. [Google Scholar]
13. V. A. Sindagi and V. M. Patel, “Generating high-quality crowd density maps using contextual pyramid cnns,” in Proc. of the IEEE Int. Conf. on Computer Vision, Venice, Italy, pp. 1861–1870, 2017. [Google Scholar]
14. N. Liu, Y. Long, C. Zou, Q. Niu, L. Pan et al., “Adcrowdnet: An attention-injective deformable convolutional network for crowd understanding,” in Proc. of the IEEE/CVF Conf. on Computer Vision and Pattern Recognition, Long Beach, California, pp. 3225–3234, 2019. [Google Scholar]
15. Y. Zhang, D. Zhou, S. Chen, S. Gao and Y. Ma, “Single-image crowd counting via multi-column convolutional neural network,” in Proc. of the IEEE Conf. on Computer Vision and Pattern Recognition, Las Vegas, Nevada, pp. 589–597, 2016. [Google Scholar]
16. L. Boominathan, S. S. Kruthiventi and R. V. Babu, “Crowdnet: A deep convolutional network for dense crowd counting,” in Proc. of the 24th ACM Int. Conf. on Multimedia, Amsterdam, Netherlands, pp. 640–644, 2016. [Google Scholar]
17. D. Onoro-Rubio and R. J. López-Sastre, “Towards perspective-free object counting with deep learning,” in European Conf. on Computer Vision, Amsterdam, Netherlands, Springer, pp. 615–629, 2016. [Google Scholar]
18. S. Basalamah, S. D. Khan and H. Ullah, “Scale driven convolutional neural network model for people counting and localization in crowd scenes,” IEEE Access, vol. 7, pp. 71576–71584, 2019. [Google Scholar]
19. C. C. Loy, K. Chen, S. Gong and T. Xiang, “Crowd counting and profiling: Methodology and evaluation,” in Modeling, Simulation, and Visual Analysis of Crowds, Springer, New York, NY, USA, pp. 347–382, 2013. [Google Scholar]
20. P. Dollar, C. Wojek, B. Schiele and P. Perona, “Pedestrian detection: An evaluation of the state of the art,” IEEE Transactions on Pattern Analysis and Machine Intelligence, vol. 34, no. 4, pp. 743–761, 2011. [Google Scholar]
21. M. Li, Z. Zhang, K. Huang and T. Tan, “Estimating the number of people in crowded scenes by mid based foreground segmentation and head-shoulder detection,” in 2008 19th Int. Conf. on Pattern Recognition, Tampa, Florida, IEEE, pp. 1–4, 2008. [Google Scholar]
22. C. Tomasi, “Histograms of oriented gradients,” in Computer Vision Sampler, pp. 1–6, 2012. [Google Scholar]
23. B. Leibe, E. Seemann and B. Schiele, “Pedestrian detection in crowded scenes,” in 2005 IEEE Computer Society Conf. on Computer Vision and Pattern Recognition (CVPR’05), San Diego, California, IEEE, vol. 1, pp. 878–885, 2005. [Google Scholar]
24. O. Tuzel, F. Porikli and P. Meer, “Pedestrian detection via classification on riemannian manifolds,” IEEE Transactions on Pattern Analysis and Machine Intelligence, vol. 30, no. 10, pp. 1713–1727, 2008. [Google Scholar]
25. M. Enzweiler and D. M. Gavrila, “Monocular pedestrian detection: Survey and experiments,” IEEE Transactions on Pattern Analysis and Machine Intelligence, vol. 31, no. 12, pp. 2179–2195, 2008. [Google Scholar]
26. P. Viola and M. J. Jones, “Robust real-time face detection,” International Journal of Computer Vision, vol. 57, no. 2, pp. 137–154, 2004. [Google Scholar]
27. B. Wu and R. Nevatia, “Detection of multiple, partially occluded humans in a single image by Bayesian combination of edgelet part detectors,” in Tenth IEEE Int. Conf. on Computer Vision (ICCV’05), Beijing, China, IEEE, vol. 1, pp. 90–97, 2005. [Google Scholar]
28. P. Sabzmeydani and G. Mori, “Detecting pedestrians by learning shapelet features,” in 2007 IEEE Conf. on Computer Vision and Pattern Recognition, Minneapolis, MN, IEEE, pp. 1–8, 2007. [Google Scholar]
29. P. Viola, M. J. Jones and D. Snow, “Detecting pedestrians using patterns of motion and appearance,” International Journal of Computer Vision, vol. 63, no. 2, pp. 153–161, 2005. [Google Scholar]
30. J. Gall, A. Yao, N. Razavi, L. Van Gool and V. Lempitsky, “Hough forests for object detection, tracking, and action recognition,” IEEE Transactions on Pattern Analysis and Machine Intelligence, vol. 33, no. 11, pp. 2188–2202, 2011. [Google Scholar]
31. X. Wang, T. Xiao, Y. Jiang, S. Shao, J. Sun et al., “Repulsion loss: Detecting pedestrians in a crowd,” in Proc. of the IEEE Conf. on Computer Vision and Pattern Recognition, Salt Lake City, Utah, pp. 7774–7783, 2018. [Google Scholar]
32. D. Forsyth, “Object detection with discriminatively trained part-based models,” Computer, vol. 47, no. 2, pp. 6–7, 2014. [Google Scholar]
33. P. F. Felzenszwalb, R. B. Girshick, D. McAllester and D. Ramanan, “Object detection with discriminatively trained part-based models,” IEEE Transactions on Pattern Analysis and Machine Intelligence, vol. 32, no. 9, pp. 1627–1645, 2009. [Google Scholar]
34. S. -F. Lin, J. -Y. Chen and H. -X. Chao, “Estimation of number of people in crowded scenes using perspective transformation,” IEEE Transactions on Systems, Man, and Cybernetics-Part A: Systems and Humans, vol. 31, no. 6, pp. 645–654, 2001. [Google Scholar]
35. B. Wu and R. Nevatia, “Detection and tracking of multiple, partially occluded humans by Bayesian combination of edgelet based part detectors,” International Journal of Computer Vision, vol. 75, no. 2, pp. 247–266, 2007. [Google Scholar]
36. A. B. Chan and N. Vasconcelos, “Bayesian poisson regression for crowd counting,” in 2009 IEEE 12th Int. Conf. on Computer Vision, Kyoto, Japan, IEEE, pp. 545–551, 2009. [Google Scholar]
37. D. Ryan, S. Denman, C. Fookes and S. Sridharan, “Crowd counting using multiple local features,” in 2009 Digital Image Computing: Techniques and Applications, Melbourne, Australia, IEEE, pp. 81–88, 2009. [Google Scholar]
38. K. Chen, C. C. Loy, S. Gong and T. Xiang, “Feature mining for localised crowd counting.” Bmvc, vol. 1, no. 2, pp. 3, 2012. [Google Scholar]
39. J. Liu, C. Gao, D. Meng and A. G. Hauptmann, “Decidenet: Counting varying density crowds through attention guided detection and density estimation,” in Proc. of the IEEE Conf. on Computer Vision and Pattern Recognition, Salt Lake City, Utah, pp. 5197–5206, 2018. [Google Scholar]
40. L. Zhu, C. Li, Z. Yang, K. Yuan and S. Wang, “Crowd density estimation based on classification activation map and patch density level,” Neural Computing and Applications, vol. 32, no. 9, pp. 5105–5116, 2020. [Google Scholar]
41. V. A. Sindagi and V. M. Patel, “A survey of recent advances in cnn-based single image crowd counting and density estimation,” Pattern Recognition Letters, vol. 107, pp. 3–16, 2018. [Google Scholar]
42. H. Li and M. Zahr, “Learning to recognize objects in images,” Trends Cogn. Sci., vol. 3, no. 3, pp. 1–5, 2012. [Google Scholar]
43. V. -Q. Pham, T. Kozakaya, O. Yamaguchi and R. Okada, “Count forest: Co-voting uncertain number of targets using random forest for crowd density estimation,” in Proc. of the IEEE Int. Conf. on Computer Vision, Santiago, Chile, pp. 3253–3261, 2015. [Google Scholar]
44. K. Simonyan and A. Zisserman, “Very deep convolutional networks for large-scale image recognition,” arXiv preprint arXiv:1409.1556, 2014. [Google Scholar]
45. M. Marsden, K. McGuinness, S. Little and N. E. O'Connor, “Fully convolutional crowd counting on highly congested scenes,” arXiv preprint arXiv:1612.00220, 2016. [Google Scholar]
46. X. Chen, Y. Bin, C. Gao, N. Sang and H. Tang, “Relevant region prediction for crowd counting,” Neurocomputing, vol. 407, pp. 399–408, 2020. [Google Scholar]
47. M. Saqib, S. D. Khan, N. Sharma and M. Blumenstein, “Crowd counting in low-resolution crowded scenes using region-based deep convolutional neural networks,” IEEE Access, vol. 7, pp. 35317–35329, 2019. [Google Scholar]
48. D. B. Sam, S. V. Peri, M. N. Sundararaman, A. Kamath and V. B. Radhakrishnan, “Locate, size and count: Accurately resolving people in dense crowds via detection,” IEEE Transactions on Pattern Analysis and Machine Intelligence, vol. 43, no. 8, pp. 2739–2751, 2020. [Google Scholar]
49. S. Lamba and N. Nain, “A texture based mani-fold approach for crowd density estimation using Gaussian markov random field,” Multimedia Tools and Applications, vol. 78, no. 5, pp. 5645–5664, 2019. [Google Scholar]
50. S. Albelwi and A. Mahmood, “A framework for designing the architectures of deep convolutional neural networks,” Entropy, vol. 19, no. 6, pp. 242, 2017. [Google Scholar]
51. H. Xiong, H. Lu, C. Liu, L. Liu, Z. Cao et al., “From open set to closed set: Counting objects by spatial divide-and-conquer,” in Proc. of the IEEE/CVF Int. Conf. on Computer Vision, Seoul, Korea, pp. 8362–8371, 2019. [Google Scholar]
52. H. Xiong, H. Lu, C. Liu, L. Liu, C. Shen et al., “From open set to closed set: Supervised spatial divide-and-conquer for object counting,” arXiv preprint arXiv:2001.01886, 2020. [Google Scholar]
53. F. Yu and V. Koltun, “Multi-scale context aggregation by dilated convolutions,” arXiv preprint arXiv:1511.07122, 2016. [Google Scholar]
54. L. -C. Chen, G. Papandreou, I. Kokkinos, K. Murphy and A. L. Yuille, “Semantic image segmentation with deep convolutional nets and fully connected crfs,” arXiv preprint arXiv:1412.7062, 2014. [Google Scholar]
55. L. -C. Chen, G. Papandreou, F. Schroff and H. Adam, “Rethinking atrous convolution for semantic image segmentation,” arXiv preprint arXiv:1706.05587, 2017. [Google Scholar]
56. J. Cheng, H. Xiong, Z. Cao and H. Lu, “Decoupled two-stage crowd counting and beyond,” IEEE Transactions on Image Processing, vol. 30, pp. 2862–2875, 2021. [Google Scholar]
57. H. Lu, Y. Dai, C. Shen and S. Xu, “Indices matter: Learning to index for deep image matting,” in Proc. of the IEEE/CVF Int. Conf. on Computer Vision, Seoul, Korea, pp. 3266–3275, 2019. [Google Scholar]
58. X. Lu, W. Wang, J. Shen, D. Crandall and J. Luo, “Zero-shot video object segmentation with co-attention siamese networks,” IEEE Transactions on Pattern Analysis and Machine Intelligence, vol. 44, pp. 2228–2242, 2020. [Google Scholar]
59. R. Perko, M. Klopschitz, A. Almer and P. M. Roth, “Critical aspects of person counting and density estimation,” Journal of Imaging, vol. 7, no. 2, pp. 21, 2021. [Google Scholar]
60. S. Sarangi, N. P. Rath and H. K. Sahoo, “A comparative study of filters for denoising mammograms,” in 2021 Int. Conf. on Intelligent Technologies (CONIT), Hubli, India, IEEE, pp. 1–5, 2021. [Google Scholar]
61. Q. Wang, Y. Ma, K. Zhao and Y. Tian, “A comprehensive survey of loss functions in machine learning,” Annals of Data Science, vol. 9, no. 2, pp. 1–26, 2020. [Google Scholar]
62. H. Idrees, I. Saleemi, C. Seibert and M. Shah, “Multi-source multi-scale counting in extremely dense crowd images,” in Proc. of the IEEE Conf. on Computer Vision and Pattern Recognition, Portland, Oregon, USA, pp. 2547–2554, 2013. [Google Scholar]
63. H. Idrees, M. Tayyab, K. Athrey, D. Zhang, S. Al-Maadeed et al., “Composition loss for counting, density map estimation and localization in dense crowds,” in Proc. of the European Conf. on Computer Vision (ECCV), Munich, Germany, pp. 532–546, 2018. [Google Scholar]
64. Q. Wang, J. Gao, W. Lin and Y. Yuan, “Learning from synthetic data for crowd counting in the wild,” in Proc. of the IEEE/CVF Conf. on Computer Vision and Pattern Recognition, Long Beach, California, pp. 8198–8207, 2019. [Google Scholar]
65. T. Han, J. Gao, Y. Yuan and Q. Wang, “Focus on semantic consistency for cross-domain crowd understanding,” in ICASSP 2020-2020 IEEE Int. Conf. on Acoustics, Speech and Signal Processing (ICASSP), Barcelona, Spain, IEEE, pp. 1848–1852, 2020. [Google Scholar]
66. J. Gao, T. Han, Q. Wang and Y. Yuan, “Domain-adaptive crowd counting via inter-domain features segregation and Gaussian-prior reconstruction,” arXiv preprint arXiv:1912.03677, 2019. [Google Scholar]
67. Q. Wang, T. Han, J. Gao and Y. Yuan, “Neuron linear transformation: Modeling the domain shift for crowd counting,” IEEE Transactions on Neural Networks and Learning Systems, 2021. [Google Scholar]
68. X. Zeng, Q. Guo, H. Duan and Y. Wu, “Multi-level features extraction network with gating mechanism for crowd counting,” IET Image Processing, vol. 15, no. 14, pp. 3534–3542, 2021. [Google Scholar]
69. V. A. Sindagi, M. Vishal and Patel, “Cnn-based cascaded multi-task learning of high-level prior and density estimation for crowd counting,” in 2017 14th IEEE Int. Conf. on Advanced Video and Signal Based Surveillance (AVSS), Lecce, Italy, IEEE, pp. 1–6, 2017. [Google Scholar]
70. S. D. Khan, Y. Salih, B. Zafar and A. Noorwali. “A deep-fusion network for crowd counting in high-density crowded scenes.” International Journal of Computational Intelligence Systems, vol. 14, no. 1, pp. 1–12, 2021. [Google Scholar]
71. E. Walach and L. Wolf, “Learning to count with cnn boosting,” in European Conf. on Computer Vision, Amsterdam, Netherlands, Springer, pp. 660–676, 2016. [Google Scholar]
72. Y. Yang, G. Li, D. Du, Q. Huang and N. Sebe, “Embedding perspective analysis into multi-column convolutional neural network for crowd counting,” IEEE Transactions on Image Processing, vol. 30, pp. 1395–1407, 2020. [Google Scholar]
73. A. Hafeezallah, A. Al-Dhamari, and S. A. R. Abu-Bakar, “U-ASD net: Supervised crowd counting based on semantic segmentation and adaptive scenario discovery,” IEEE Access, vol. 09, pp. 127444–127459, 2021. [Google Scholar]
74. Z. Ma, X. Wei, X. Hong and Y. Gong, “Bayesian loss for crowd count estimation with point supervision,” in Proc. of the IEEE/CVF Int. Conf. on Computer Vision, Seoul, Korea, pp. 6142–6151, 2019. [Google Scholar]
75. Y. Tian, Y. Lei, J. Zhang and J. Z. Wang, “Padnet: Pan-density crowd counting,” IEEE Transactions on Image Processing, vol. 29, pp. 2714–2727, 2019. [Google Scholar]
76. X. Jiang, L. Zhang, M. Xu, T. Zhang, P. Lv et al., “Attention scaling for crowd counting,” in Proc. of the IEEE/CVF Conf. on Computer Vision and Pattern Recognition, Virtual, pp. 4706–4715, 2020. [Google Scholar]
77. S. Bai, Z. He, Y. Qiao, H. Hu, W. Wu et al., “Adaptive dilated network with self-correction supervision for counting,” in Proc. of the IEEE/CVF Conf. on Computer Vision and Pattern Recognition, Virtual, pp. 4594–4603, 2020. [Google Scholar]
78. L. Liu, H. Lu, H. Zou, H. Xiong, Z. Cao et al., “Weighing counts: Sequential crowd counting by reinforcement learning,” in European Conf. on Computer Vision, Springer, pp. 164–181, 2020. [Google Scholar]
 | This work is licensed under a Creative Commons Attribution 4.0 International License, which permits unrestricted use, distribution, and reproduction in any medium, provided the original work is properly cited. |