| Computers, Materials & Continua DOI:10.32604/cmc.2022.027457 | |
| Article |
Sika Deer Behavior Recognition Based on Machine Vision
1Jilin Agricultural University, Changchun, 130118, China
2Wuzhou University, Wuzhou, 543000, China
3Jilin Province Agricultural Internet of Things Technology Collaborative Innovation Center, Changchun, 130118, China
4Jilin Province Intelligent Environmental Engineering Research Center, Changchun, 130118, China
5Department of Agricultural Economics and Animal Production, University of Limpopo, Sovenga, 0727, Polokwane, South Africa
6Guangxi Key Laboratory of Machine Vision and Intelligent Control, Wuzhou, 543000, China
*Corresponding Author: Shijun Li. Email: lishijun@jlau.edu.cn
Received: 19 January 2022; Accepted: 09 May 2022
Abstract: With the increasing intensive and large-scale development of the sika deer breeding industry, it is crucial to assess the health status of the sika deer by monitoring their behaviours. A machine vision–based method for the behaviour recognition of sika deer is proposed in this paper. Google Inception Net (GoogLeNet) is used to optimise the model in this paper. First, the number of layers and size of the model were reduced. Then, the 5 × 5 convolution was changed to two 3 × 3 convolutions, which reduced the parameters and increased the nonlinearity of the model. A 5 × 5 convolution kernel was used to replace the original convolution for extracting coarse-grained features and improving the model’s extraction ability. A multi-scale module was added to the model to enhance the multi-faceted feature extraction capability of the model. Simultaneously, the Squeeze-and-Excitation Networks (SE-Net) module was included to increase the channel’s attention and improve the model’s accuracy. The dataset’s images were rotated to reduce overfitting. For image rotation, the angle was multiplied by 30° to obtain the dataset enhanced by rotation operations of 30°, 60°, 90°, 120° and 150°. The experimental results showed that the recognition rate of this model in the behaviour of sika deer was 98.92%. Therefore, the model presented in this paper can be applied to the behaviour recognition of sika deer. The results will play an essential role in promoting animal behaviour recognition technology and animal health monitoring management.
Keywords: Behaviour recognition; SE-Net module; multi-scale module; improved Inception module
Our society has witnessed rapid development in recent years; therefore, the ability to monitor the input and output of animal breeding has become increasingly crucial [1]. Now, each pasture has a vital demand of monitoring and identifying animal behaviour in pastures. The economic value of sika deer is extremely high because they are used as an official, edible and in the leather industry [2]. Deer products play a critical role in people’s daily health and diet, and the health of sika deer considerably affects the quality of deer products. Sika deers are semi-domesticated animals indulging in high activities; hence, their behaviour directly reflects their physical state. The continuous monitoring of sika deer can help us better understand the health of sika deer. Livestock such as pigs and cattle are more docile and less prone to stressful behaviours. They are less mobile and have a smaller swing range, making it easier to monitor them. Monitoring the behaviour of sika deer to determine its health status can significantly reduce staff workload, increase staff productivity and reduce breeding costs.
Because of the development of sensors and rapid data processing technology, a large number of studies on the monitoring of animal behaviour [3], mainly using wearable devices [4], have been conducted in recent years. Maselyne et al. installed radio frequency identification (RFID) readers at the location of food troughs and drinking water [5]. Adrion et al. installed RFID devices on pigs’ ears and necks to monitor their timely drinking [6]. Shane et al. installed a real-time location system tracking device in cattle’s ears to identify and locate cattle according to the tag sequence [7]. Giovanett et al. installed a three-axis accelerometer on sheep to determine their mobility status by adjusting the voltage output [8]. Pegorini et al. used the data collected by the Fiber Bragg grating sensor (FBG) to measure the biomechanical strain during mandibular movement. These data were used for classifying relevant chewing patterns through decision trees [9]. It is beneficial to install equipment on animals to monitor their behaviours. However, when the device is placed on the animal, it will collide and vibrate because of the animal’s movement. Moreover, the transmitted data will generate noise, and the animal will be subjected to a certain amount of pressure while wearing the device. Importantly, the sika deer engage in behaviours such as licking and colliding with each other, which will damage the device.
Machine vision has gradually permeated people’s daily lives with the advances in technology, and it has also begun to be used to monitor animal behaviour. Instead of monitoring animal activity by installing devices, machine vision technology can better monitor animal behaviour without contacting them [10]. Lao et al. used a deep image analysis algorithm to identify sows’ behaviours (lying, sitting, standing, kneeling, feeding, drinking and moving) in the litter box [11]. Zhang et al. used video image frames and light flow as input objects to fully extract the temporal and spatial features of the video and recognise the feeding, lying down, walking, scratching and sitting activities of pigs [12]. Chen et al. used connection area and adhesion index to locate the attacking pigs and extract keyframe sequences. The acceleration features were extracted by analysing the displacement changes of the four sides of the rectangle between adjacent frames. In addition, the hierarchical clustering method was used to calculate its threshold to identify the aggressive behaviour of pigs [13]. Li et al. created a video dataset of five types of pig behaviours, namely feeding, lying down, moving, riding and scratching. A spatio-temporal convolutional network was also used for the pig’s multi-behaviour recognition (PMB-SCN) [14]. Yang et al. used faster region-based convolutional neural network (Faster R-CNN) to locate and identify individual pigs from communal pigpens and designed an algorithm to associate pig heads with pig bodies. Experiment results demonstrated that the algorithm can recognise the feeding behaviour of pigs [15]. Yang et al. used image analysis techniques in still images and motion analysis techniques in spatio-temporal videos to identify drinking, feeding, lactation, moving, moderately active and inactive behaviours of sows. Moreover, they used image analysis techniques based on full convolutional networks to extract and evaluate the temporal characteristics of animal time motion. It is used for five kinds of behaviour recognition in pigs [16]. Jiang et al. proposed an automatic behaviour recognition method for group goats based on You Only Look Once V4 (YOLOV4) for the videos obtained from the upper side. The behaviour recognition of goats was performed based on the spatio-temporal location information of goats in the video sequence; hence, the four behaviours of feeding, drinking, activity and non-activity were recognised [17]. However, in most of the studies, the effects of light and shadow and the sharpness of images posed significant challenges to monitoring animal behaviour by machine vision technology.
To overcome the above shortcomings, a behaviour recognition method for sika deer, which is a deep learning method, is proposed in this paper. The legs and torso of sika deer are the main recognition feature parts. Importantly, the lying, walking and standing activities of sika deer were recognised. Specifically, this paper uses GoogLeNet model as the basic model, improves this model, and adds the attention module Squeeze-and-Excitation Networks (SE-Net) module to the model. Hence, the channel attention was increased, the model’s accuracy was improved, the internal network structure of the incident module was changed. In addition, 3 × 3 convolution was changed into 5 × 5 convolution, and the model’s receptive field was increased to obtain more image features and improve the model’s accuracy. Simultaneously, the multi-scale module was used to extract multi-scale features of the image; hence, this model is superior to other models. The rest of this paper is arranged as follows. Section 2 introduces the dataset. Section 3 proposes the network structure of this model. Section 4 describes the experimental results. Section 5 describes the implementation of the model. Finally, this paper is summarised in Section 6.
All the data in this paper were collected from the sika deer breeding base in the Dongao Deer Industry, Shuangyang District, Changchun City, Jilin Province. In spring and autumn, the sika deer images were collected from the deer farm. There are two ways to collect data: one is to shoot with mobile equipment and the other is to set up camera equipment in a sika deer farm to capture the behaviour image of sika deer via video recording. Fig. 1 shows the acquisition environment of the dataset. The left side of Fig.1 shows the environment and camera equipment of the sika deer breeding base, and the right side shows the video image acquisition of sika deer.
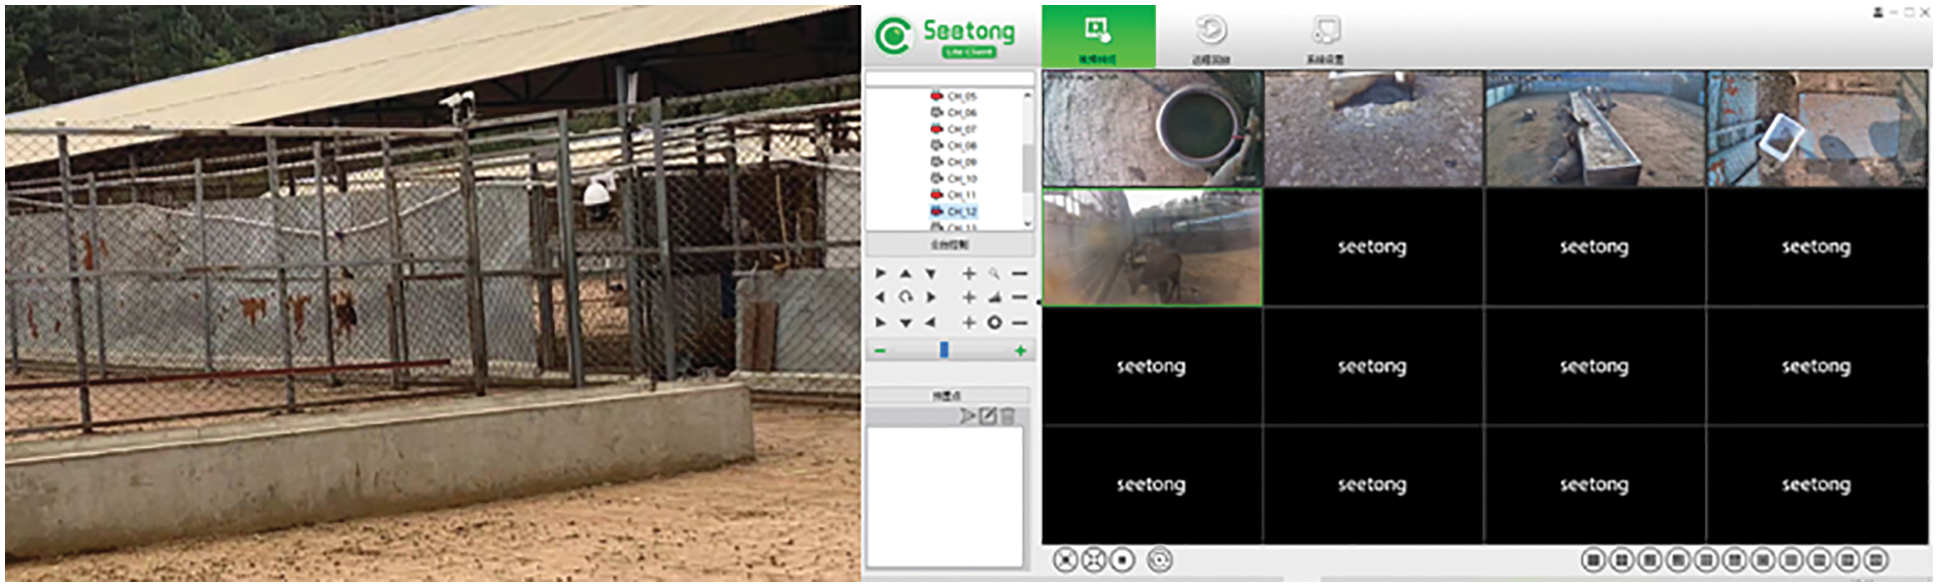
Figure 1: Environment and video of Sika deer breeding base
The mobile device used a smartphone to capture the behaviour of the sika deer. It obtained a Joint Photographic Experts Group (JPEG) format image with a size of 4000 × 1864 pixels. The video was captured in a Hikvision iDS-2DF8425IX (T5) dome camera placed 165–170 cm from the ground. The video was recorded in the MPEG-4 Part 14 (MP4) format, and the behavioural images of sika deer were extracted frame by frame with film and television (TV) software. To reduce the effects of complex background and light intensity on the dataset, screenshots of the dataset were taken in this paper. In the image, the body of the sika deer was used as the main body of the image as much as possible to reduce the influence of other factors on the image. Fig. 2 shows these results and the behaviours of the sika deer.
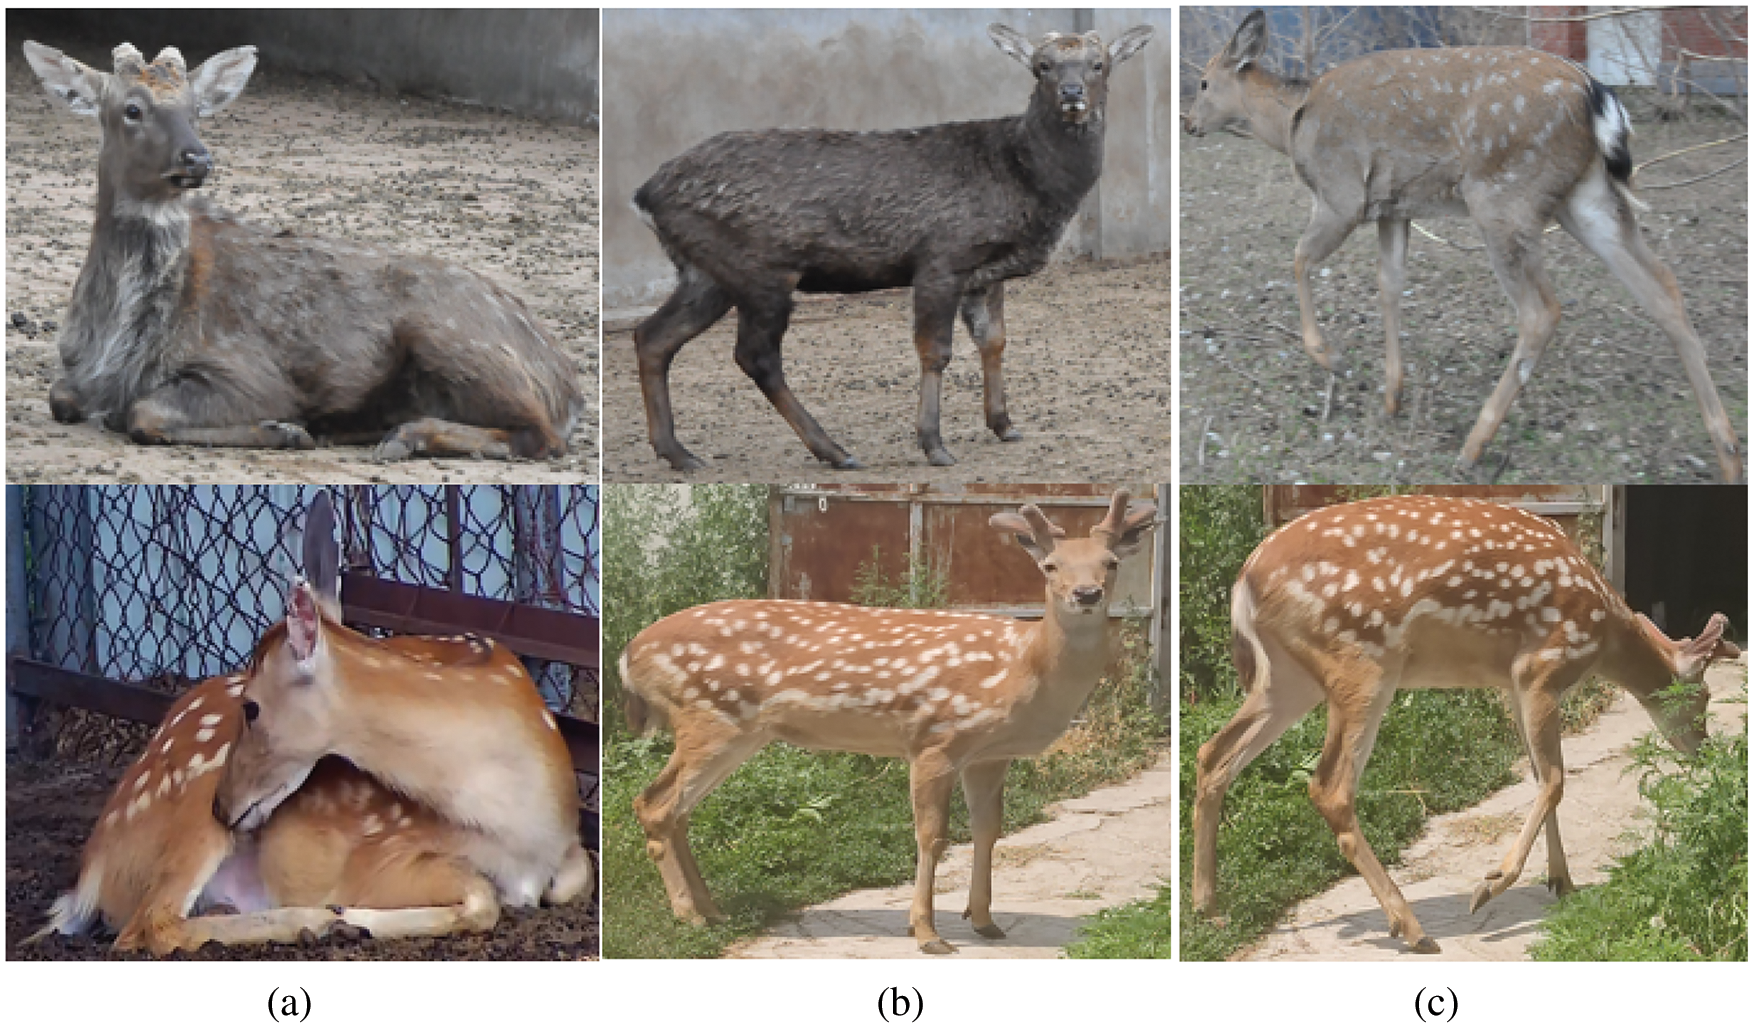
Figure 2: Behaviour of sika deer
The breeding of sika deer is mainly done in captivity, and the range of activities of sika deer in the deer house is limited. Its activities mainly include lying down, walking and standing. Fig. 2 shows the dataset. Figs. 2a–2c show the lying down, standing, and walking behaviours of sika deer, respectively. The upper part of the figure shows the autumn image, and the lower part shows the spring image.
Data enhancement was performed on the dataset to prevent overfitting of the model and improve its generalisation ability. The dataset enhancement method selected in this paper aimed to rotate the image. For image rotation, the angle was multiplied by 30° to obtain the dataset enhanced by rotation operations at 30°, 60°, 90°, 120° and 150°, which are enhanced by five times. The number of training sets and verification sets were 3088 and 1322, respectively, with a random allocation of 7:3.
The model in this paper was based on the GoogLeNet model. The attention module SE-Net module was added to modify the internal network structure of the Inception module. The 3 × 3 convolution was changed to the 5 × 5 convolution. Simultaneously, the multi-scale features were extracted by multi-scale modules.
Because of the different characteristic points of different behaviours of sika deer, a multi-scale [18] module was selected in this paper to extract the behavioural characteristics of sika deer. The multi-scale module can simultaneously extract multiple features. Low-order convolution can retain the image’s original information and is mainly used to extract the local features of the legs and torso of sika deer. In contrast, high-order convolution is mainly used to extract global features.
The first layer of the original GoogLeNet model uses a 7 × 7 large convolution kernel. Fig. 3 shows that the general large convolution kernel mainly extracts coarse-grained features, such as contours and edges. In this paper, the feature visualisation of the sika deer behaviour recognition of the GoogLeNet model was conducted, and the heat map of the model’s sika deer torso image was considered as output. Fig. 3 shows that the dark colour is present on the legs and torso of the sika deer, indicating that the features extracted for the behaviour recognition of sika deer are reflected in the outer contour and are evident in the legs.
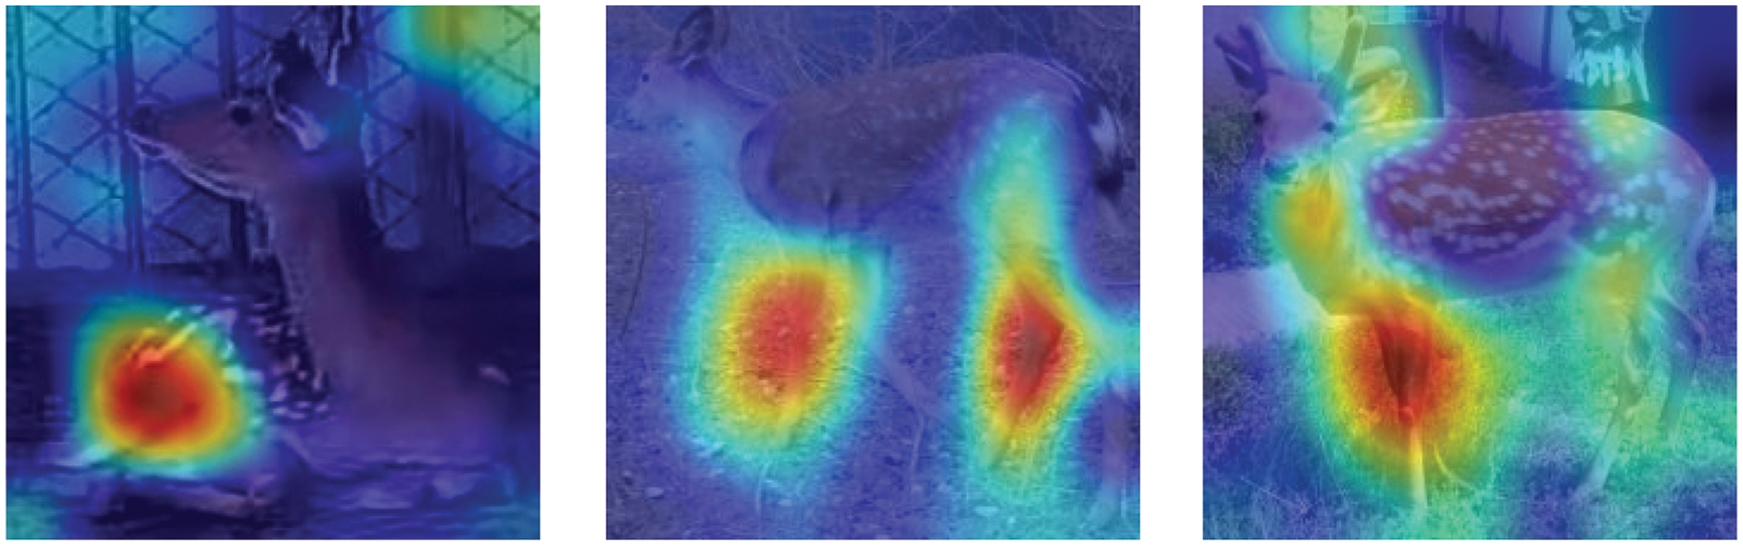
Figure 3: Visualized heat map
To summarise, the coarse-grained features (the outline of the body) and the fine-grained features (the local features of the legs) must be considered in the feature extraction of the sika deer behaviour recognition process. Comprehensive feature extraction for the sika deer is necessary to determine their behaviour. Therefore, convolution kernels of different sizes were selected and placed in the model’s first layer to improve the model’s response to features of varying granularities. The multi-scale extraction of image features was conducted using 1 × 1, 3 × 3, 5 × 5 and 7 × 7 convolutions. The small convolution kernel (1 × 1 and 3 × 3) and the large convolution kernel (5 × 5 and 7 × 7) were 32 and 16, respectively. The eigenmaps obtained after the convolution operation were combined into a tensor and passed down. Fig. 4 shows the specific structure of the model.
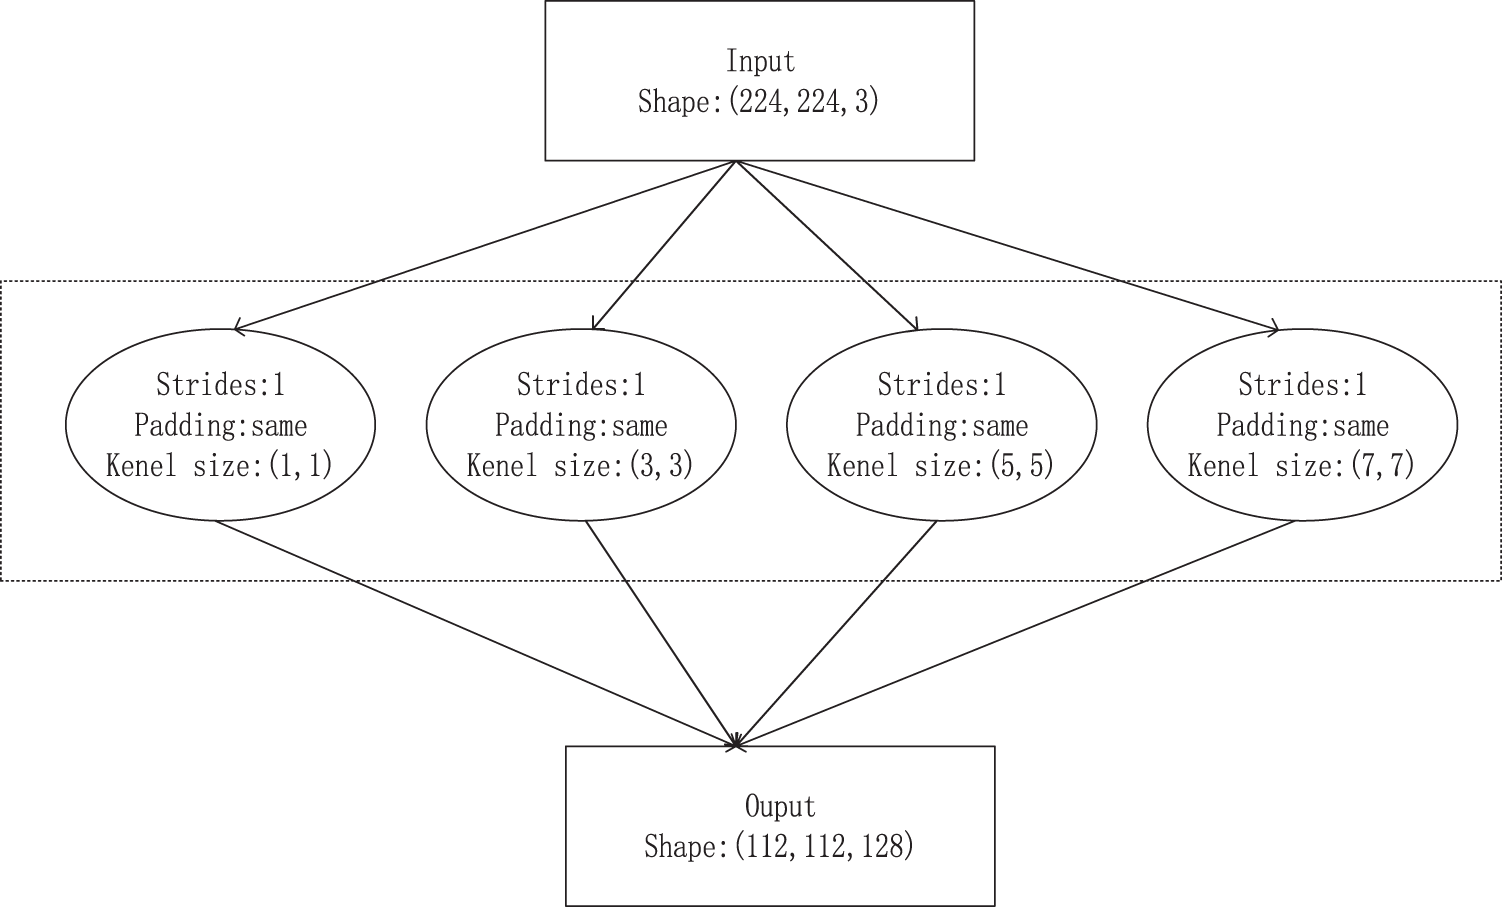
Figure 4: Multi-scale feature module
Inception V2 was selected as the basic model in this paper [19]. The structure of Inception V2 allows the model’s size to be reduced by reducing the number of parameters. Based on GoogLeNet, the Inception V2 module comprises 1 × 1, 3 × 3 and 5 × 5 convolution kernels of InceptionV1, whereas the Incision V2 module splits the 5 × 5 convolution kernel into two 3 × 3 convolution kernels, which can save a large number of parameters, manage richer spatial features and increase the diversity of features. Fig. 5 shows Inception V2 and the Inception structure in this paper.
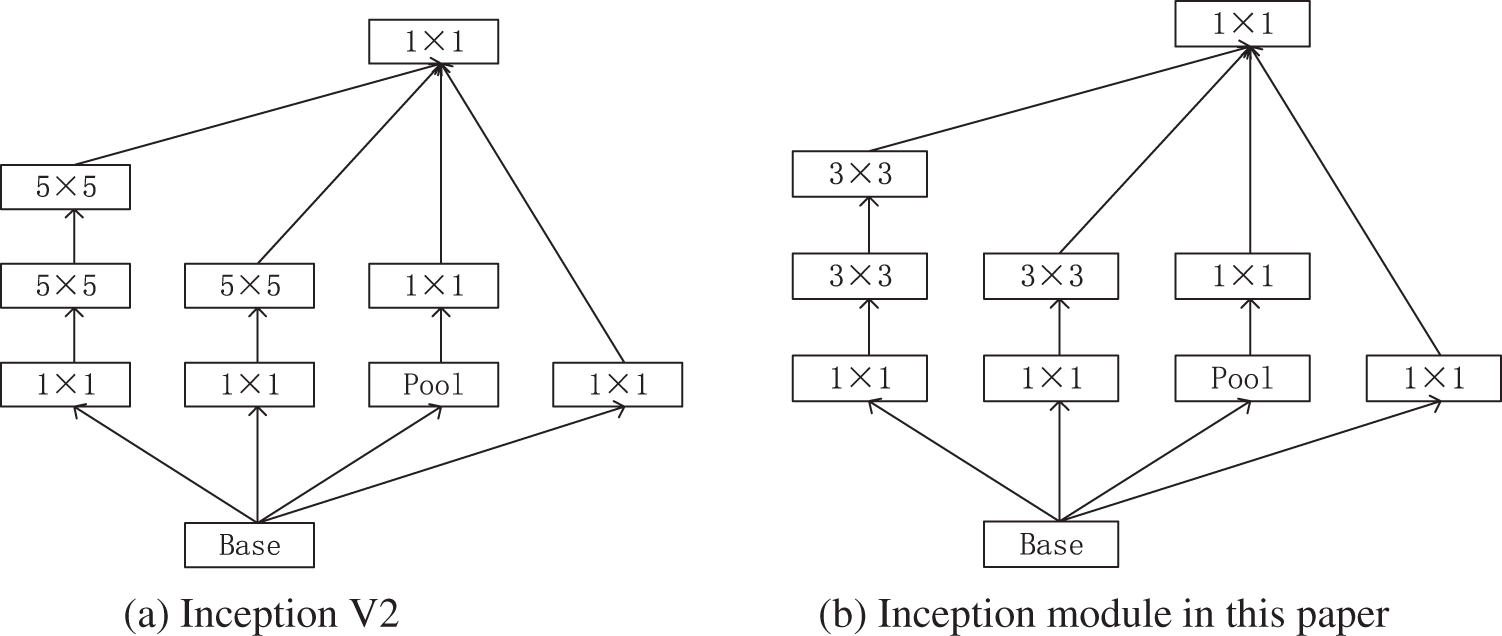
Figure 5: InceptionV2 and Inception structure diagram of this article
To fully extract the coarse-grained characteristics of sika deer behaviour, this paper changed the 3 × 3 convolution kernel to a 5 × 5 convolution kernel. Simultaneously, 1 × 1 convolution was used before 5 × 5 convolution to increase the number of network layers, reduce the dimensionality and improve the expression ability of the model. To expedite the convergence of the model and prevent the model from overfitting, this paper also added a batch normalisation (BN) layer after each convolution layer in the model.
SE-Net was the champion model for classification tasks in the latest ImageNet large-scale visual recognition challenge [20]. This module focusses on the connection between various channels and learns the importance of different channel characteristics through the network. There are only two core ideas of SE-Net: compression and motivation. The SE-Net block is not a complete network structure but also a plug-and-play lightweight module. By embedding this module into the network, the computing resources of the neural network can be allocated more reasonably at the cost of slightly increasing the parameter quantity and greatly improving the network performance. Fig. 6 shows the structural representation of SE-Net module.
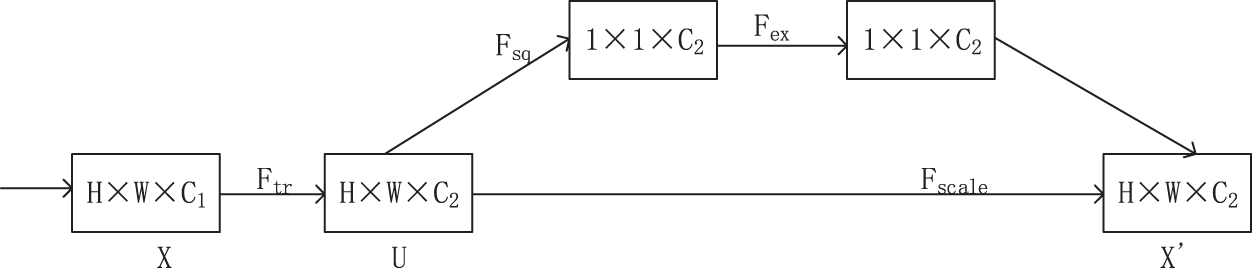
Figure 6: Structure diagram of SE-Net module
Ftr represents the convolution process from the X feature mapping to U feature mapping. The compression operation of Fsqls module encodes the whole spatial information on the channel as a global feature.
The global average pooling operation in the SE-Net block identified the attributes of each figure by extruding and compressing each figure as a real number (see Eq. (1)). The global information of the real number depicts the graph characteristics. Each characteristic figure of extrusion results was combined into a vector as the weight of each group’s characteristic figure, with H and W representing figure characteristics of the high and wide regions, respectively. U represents the convolution result, and z represents the corresponding figure of global attention information. The vector was connected through the whole layer and activation function (see Eq. (2)). The training result is crucial for recognising the characteristic figure that is used to amplify the weight. The narrow figure weight is not an important characteristic. The σ represents the Rectified Linear Unit (Relu) activation function, which is the δ function on behalf of the sigmoid activation function. W1 and W2 represent two different fully connected operations. The resulting vector S represents the importance of each feature image. Vector S excites the original feature graph through Eq. (3) and guides the feature graph to update in a direction conducive to the recognition task.
Adding the residual attention mechanism to the classification network can collect the local features of the target in the image and improve the accuracy of model recognition. Fig. 7 shows the combination of Inception and SE-Net in this paper.
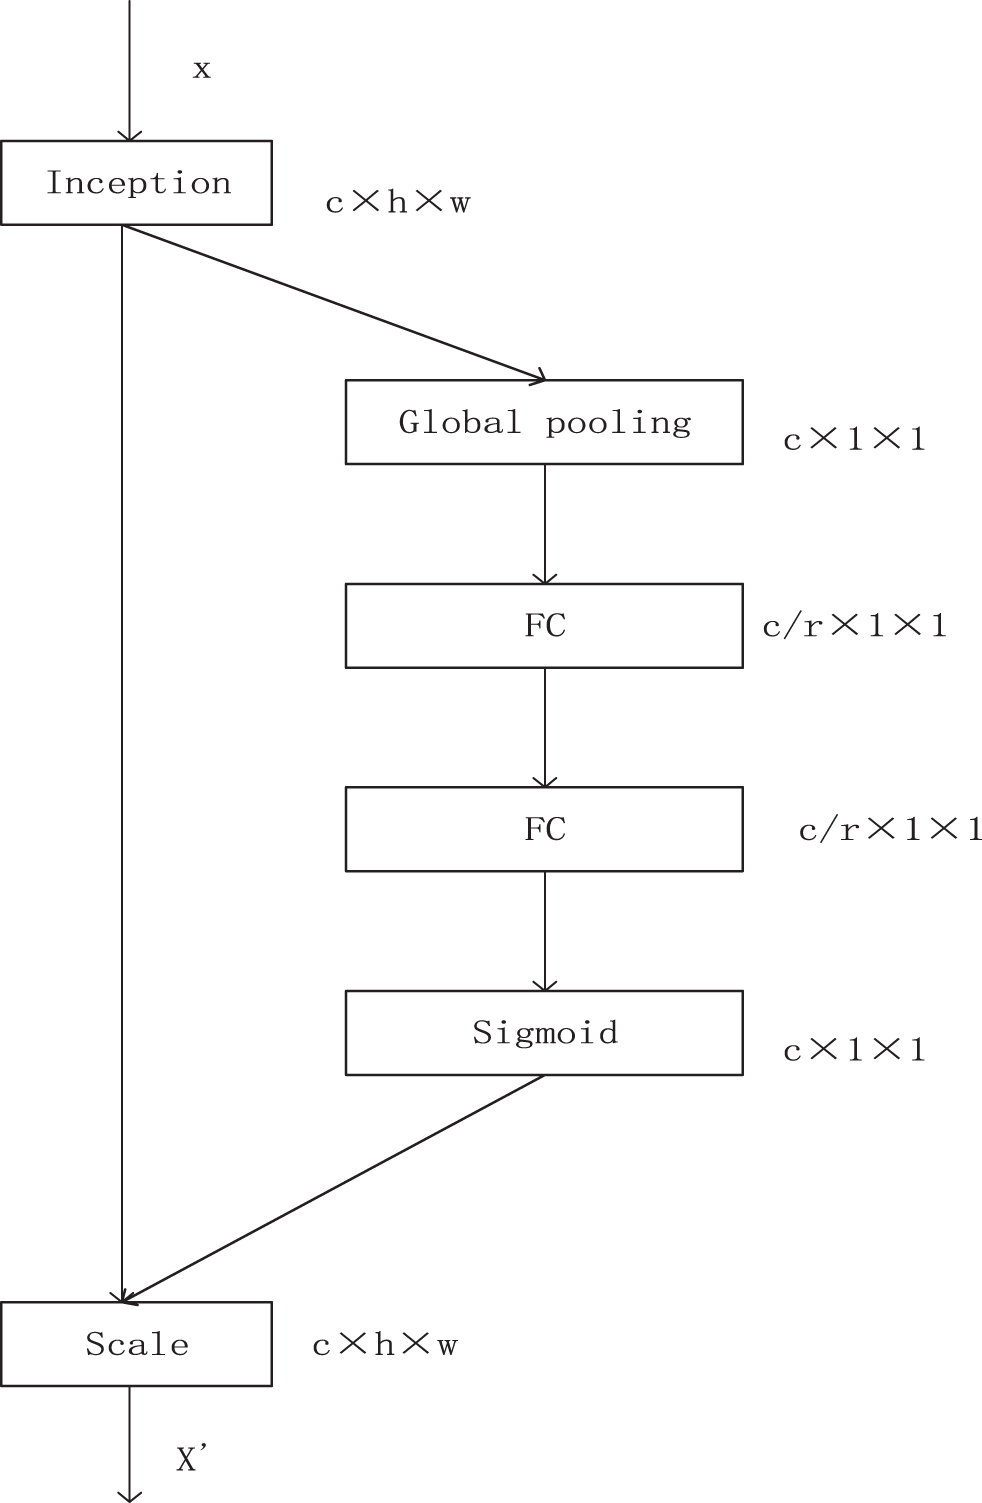
Figure 7: SE-Inception structure diagram
This model comprises one multi-scale module, four Inceptions, one SE-Net module, one average pool layer, one fully connected layer, five max-pooling layers and several BN layers. Fig. 8 shows the specific structure of this model.
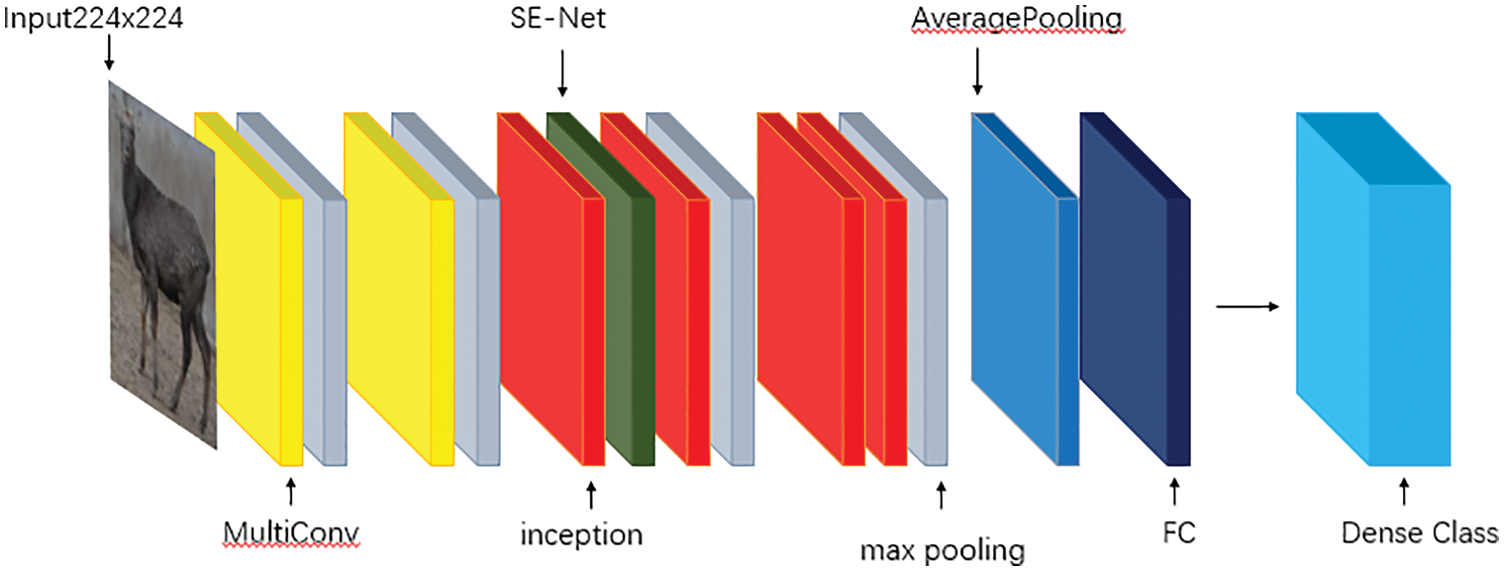
Figure 8: Model structure diagram
4 Experimental Results and Analysis
The experimental platform environment comprised a Windows 10 system using Intel(R) Core (TM) i5-4590 Central Processing Unit (CPU) and Nvidia GeForce GT 705. Python language programming and deep learning frameworks tensorflow1.14.0 and keras2.3.1 were used to train the model.
Considering hardware equipment performance and training effect, the model in this paper uses the batch training method to divide the training and verification process into multiple batches. The batch size was set at 32, epochs at 60 and CrossEntropy Loss was used as the loss function. keras was used for weights’ initialisation. Initialisers. Constant (value = 0), the tensor of the initial value was set to a constant initialiser, classification layer uses the softmax function. The stochastic gradient descent (SGD) was used to optimise the model. The initial learning rate was set to 0.0001, the momentum to 0.9, and the dropout was set to prevent overfitting. If the loss of validation set does not change in three iterations, the model training was considered to have been completed. During the model’s training, the picture’s size was uniformly normalised to 224 × 224 as the model input.
To study the effects of multi-scale module, the SE-Net module and improved Inception module on model building, experiments were conducted on the dataset constructed in this paper. In this paper, the model of GoogLeNet was first reduced. Without affecting the original model’s accuracy, only the Inception modules in the four positions of 3a, 3b, 4a, and 4b were retained. They were changed to a in Fig. 5. The shown structure reduces the model’s size and improves the computational efficiency of the model, resulting in the basic model studied in this paper. Tab. 1 shows the basic model structure. It comprises two convolution layers, four maximum pooling layers, four basic InceptionV2 modules and one fully connected layer. The model was trained according to the training parameters shown in Section 4.2. Fig. 9 shows the accuracy curve of the training set, and Fig. 10 shows the loss curve. Fig. 11 shows the accuracy curve of the verification set, and Fig. 12 shows the loss curve.
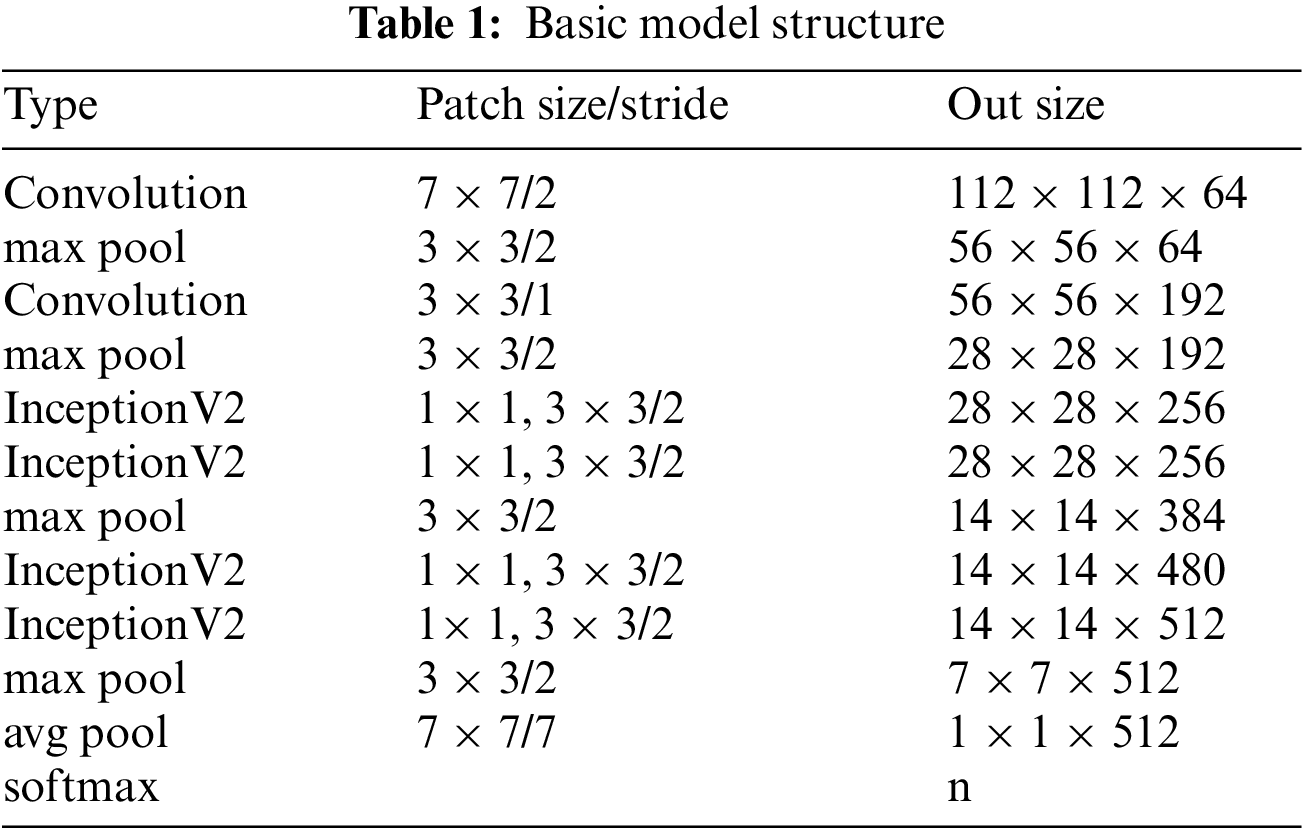
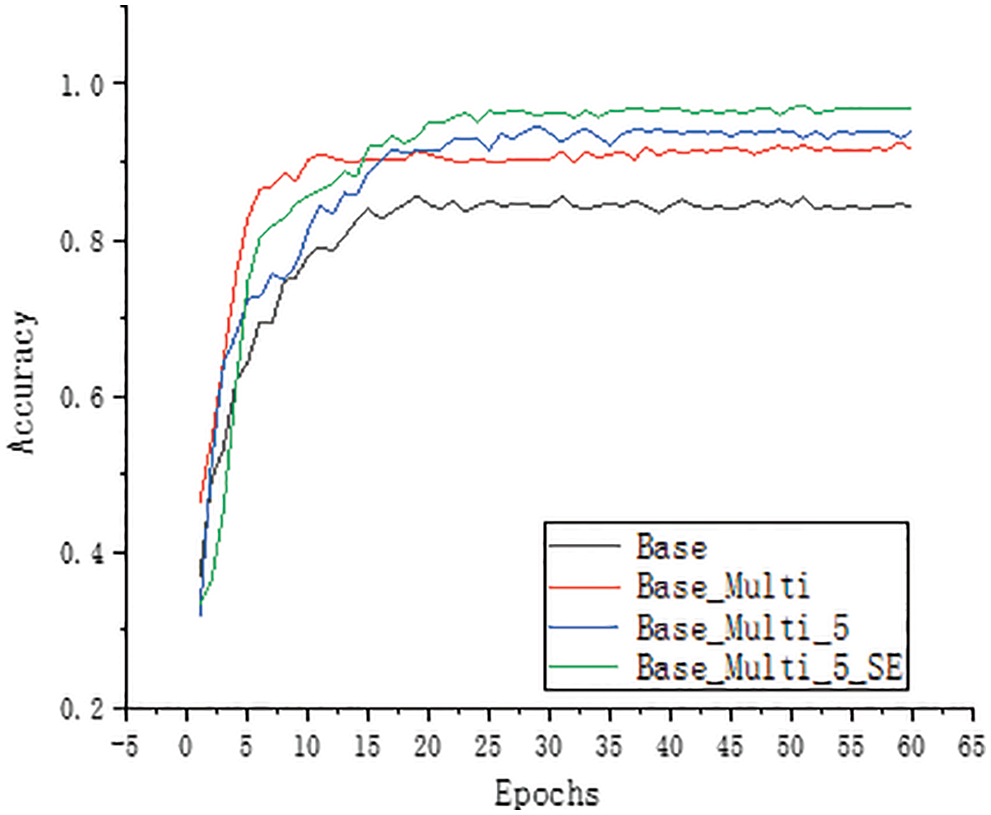
Figure 9: Accuracy curve of training set
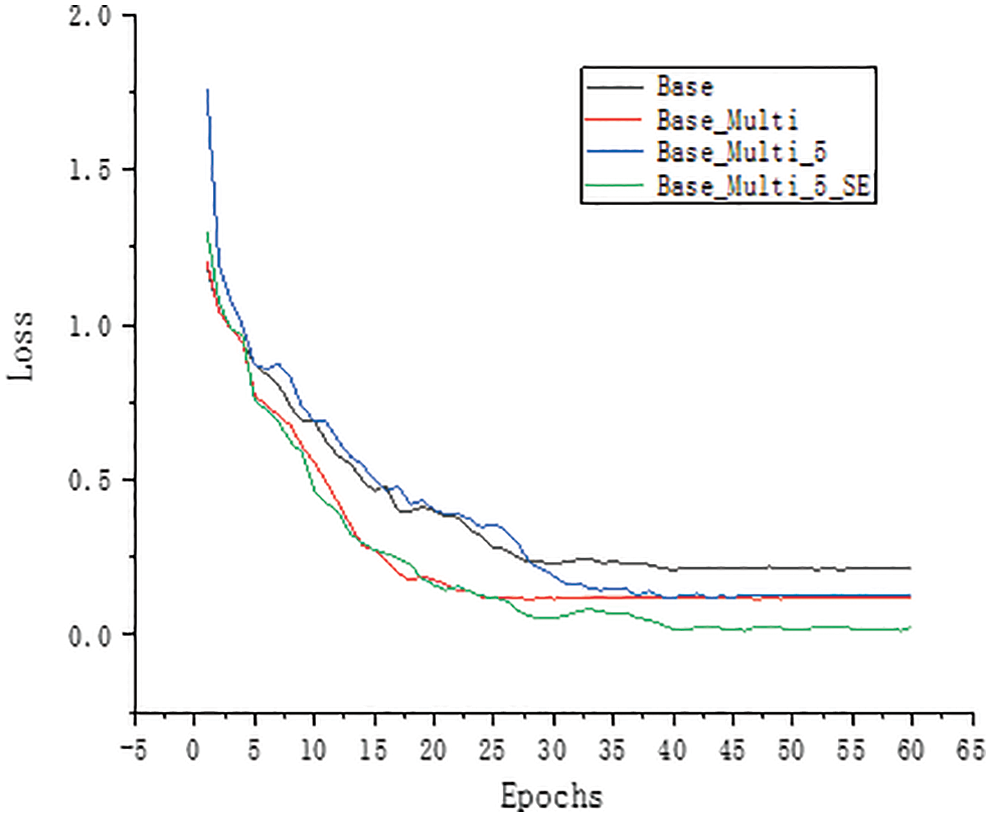
Figure 10: Training set loss curve
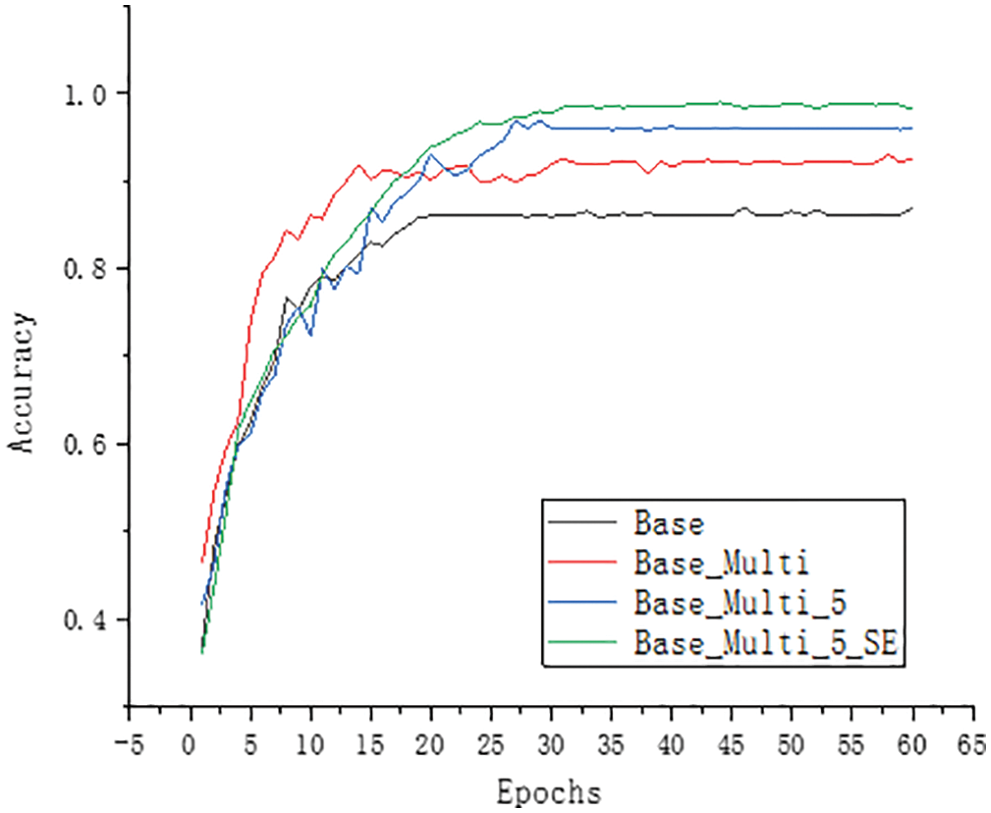
Figure 11: Validation set accuracy rate curve
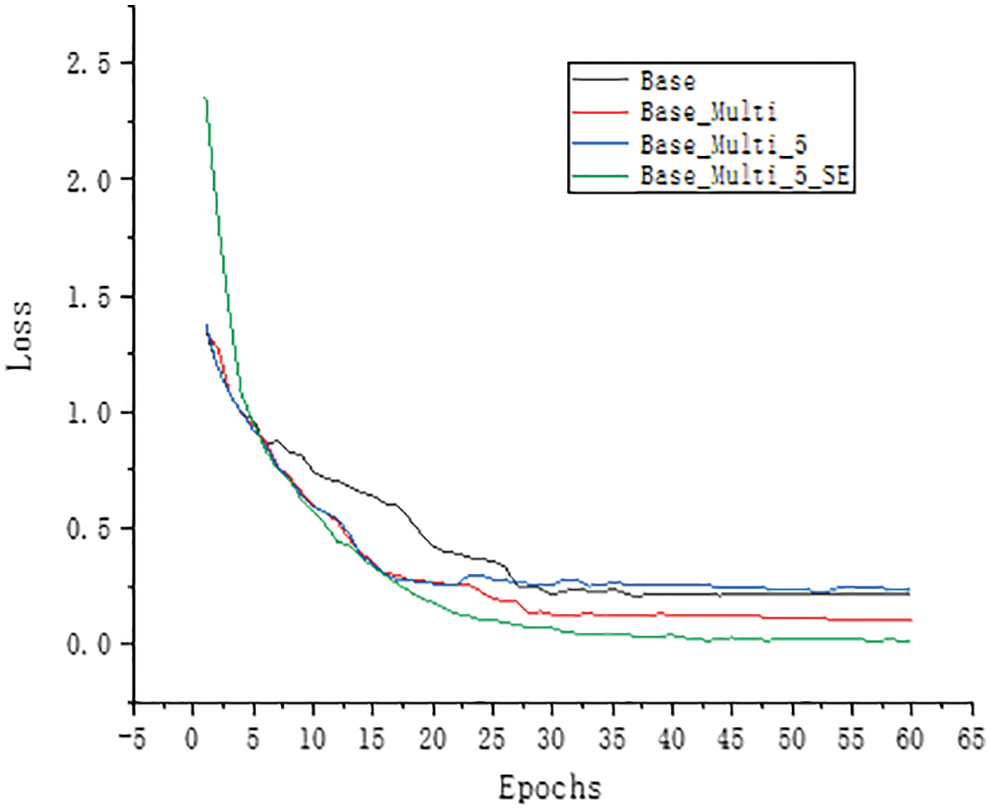
Figure 12: Validation set loss curve
4.3.1 Evaluation of Multi-Scale Modules
To enhance the extraction of multi-scale features from the model, the original 7 × 7 convolution model was replaced by the multi-scale convolution module in this paper. The multi-scale convolution module comprises 1 × 1, 3 × 3, 5 × 5, and 7 × 7 parallel convolution. The base in Figs. 9 and 11 represents the accuracy without adding multi-scale modules, whereas Base_ Multi represents the accuracy with the addition of multi-scale modules. The comparison of the curves reveals that the multi-scale module helps extract the behavioural characteristics of sika deer at different scales, thus improving the model’s accuracy. Figs. 10 and 12 show that the loss of the model is reduced with the addition of this module. The model’s accuracy was 92.37%, 6.13% higher than 86.24% of the basic model.
4.3.2 Evaluate the Improved Inception Module
The 3 × 3 convolution kernel was changed to the 5 × 5 convolution kernel to fully extract coarse-grained characteristics of sika deer’s behaviour. The 5 × 5 large convolution check was used to extract coarse-grained characteristics of sika deer’s behaviour. Base_ Multi_5 in Figs. 9 and 11 depicts the accuracy curve of the Inception module replacement. The curve shows that the model’s accuracy has been improved from 92.37% to 96.15% after modifying the Inception module. The selection of the 5 × 5 convolution kernel effectively improves the model’s accuracy.
4.3.3 Evaluation of SE-Net Module
The SE-Net module was selected in this paper to enhance the channel attention and further improve the recognition effect of the model. Figs. 9 and 10 show that the SE-Net module’s curve was added to the model. These figures show that after adding the SE-Net module, the model’s accuracy was improved to a certain extent, which can be clearly seen from the curve comparison of Base_ Multi_5 and Base_ Multi_5_SE to 98.92%.
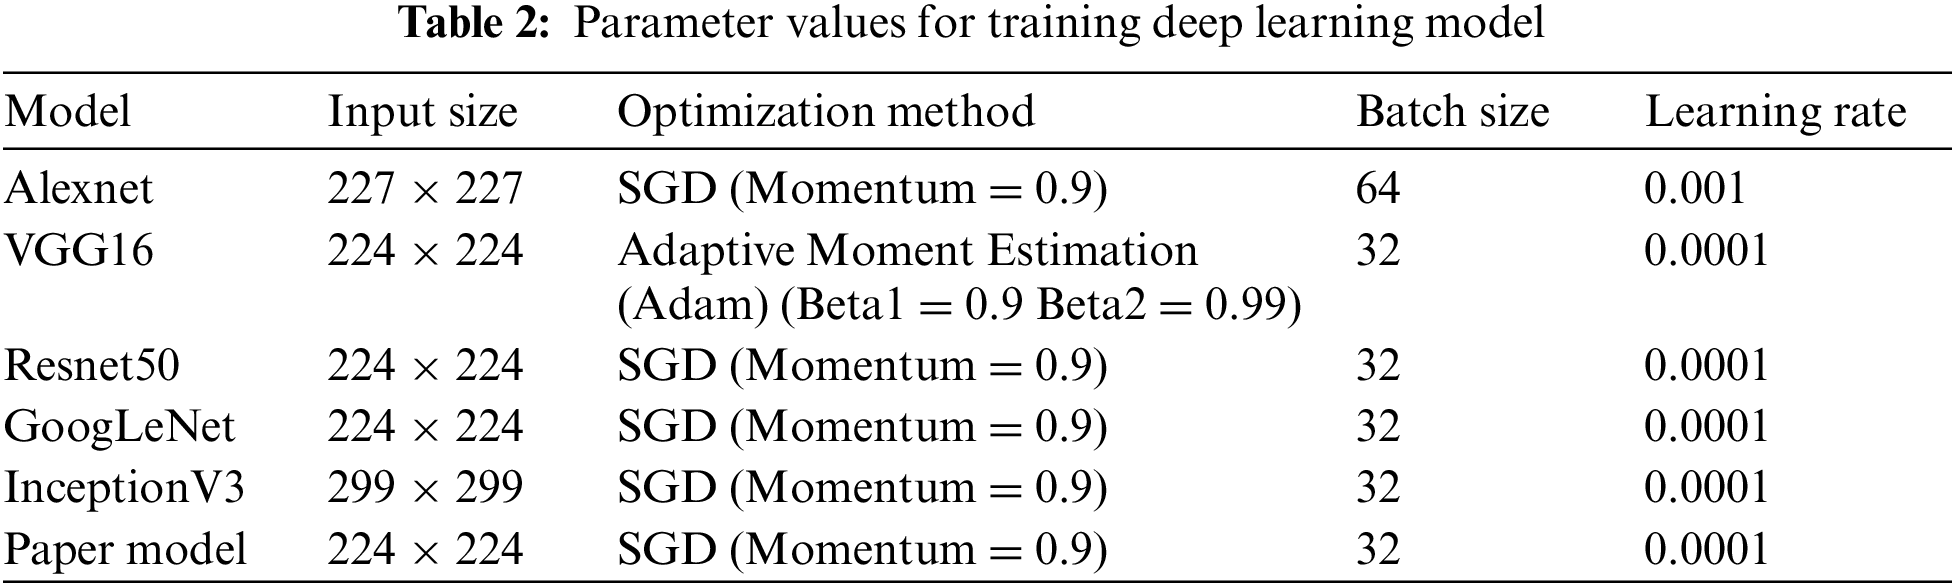
Several popular models were selected for comparison in this paper to demonstrate the effectiveness of the proposed model. Based on the behavioural dataset of sika deer constructed in this paper, the model in this paper was compared with Alexnet [21], Geometry Group-Very-Deep-16 CNN(VGG16) [22], Residual Network 50(Resnet50) [23], GoogLeNet [21,23] and InceptionV3 [24]. All the comparative experiments were trained from zero, and the dataset was consistent with that described in Section 2.2. After the loss convergence of the verification set, the model was selected as the final preservation model. Tab. 2 shows various model parameters selected for comparison in this paper. The classification layer was optimised, whereas the basic model parameters remain unchanged. Then, the whole model was adjusted to observe the performance differences of the results.
Figs. 13 and 15 show that the training results of the model in this paper were better in both the training set and the verification set. Figs. 14 and 16 show that the loss function of the model in this paper is lower. The accuracy of the proposed model was significantly higher than that of Alexnet, VGG16, Resnet50, GoogLeNet and InceptionV3. The model’s accuracy in this paper was as high as 98.92%. The figures demonstrate that the model’s accuracy in this paper was significantly higher than that of the comparison model.
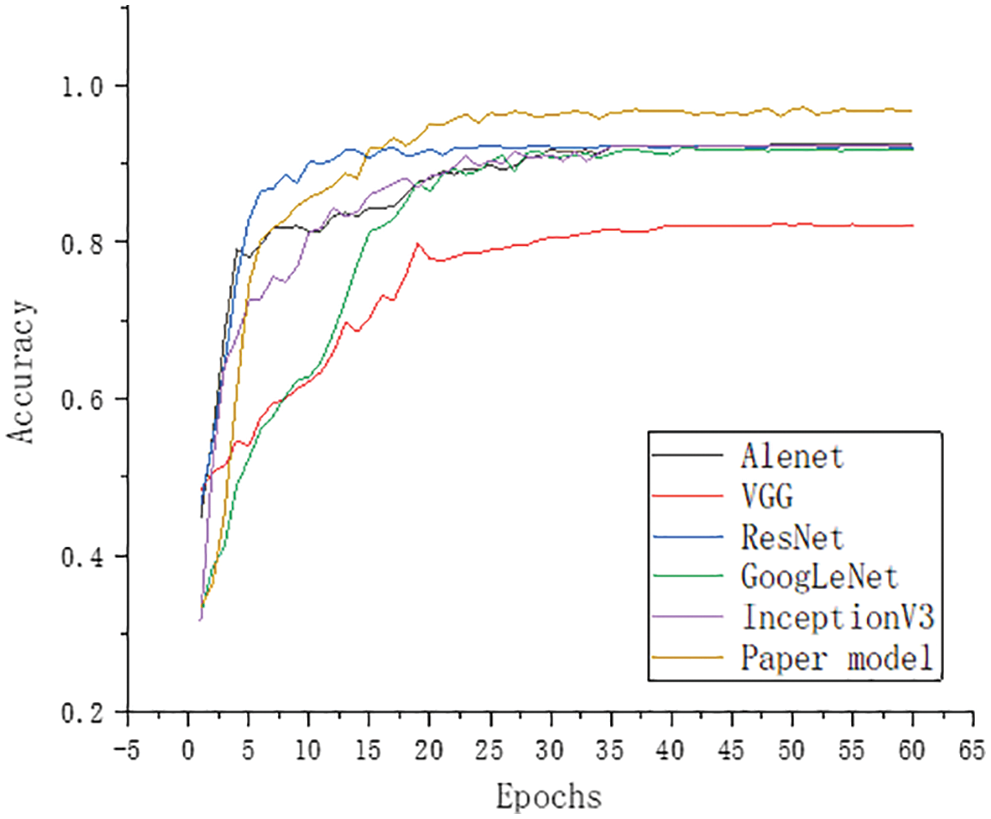
Figure 13: Comparing the model training set curve
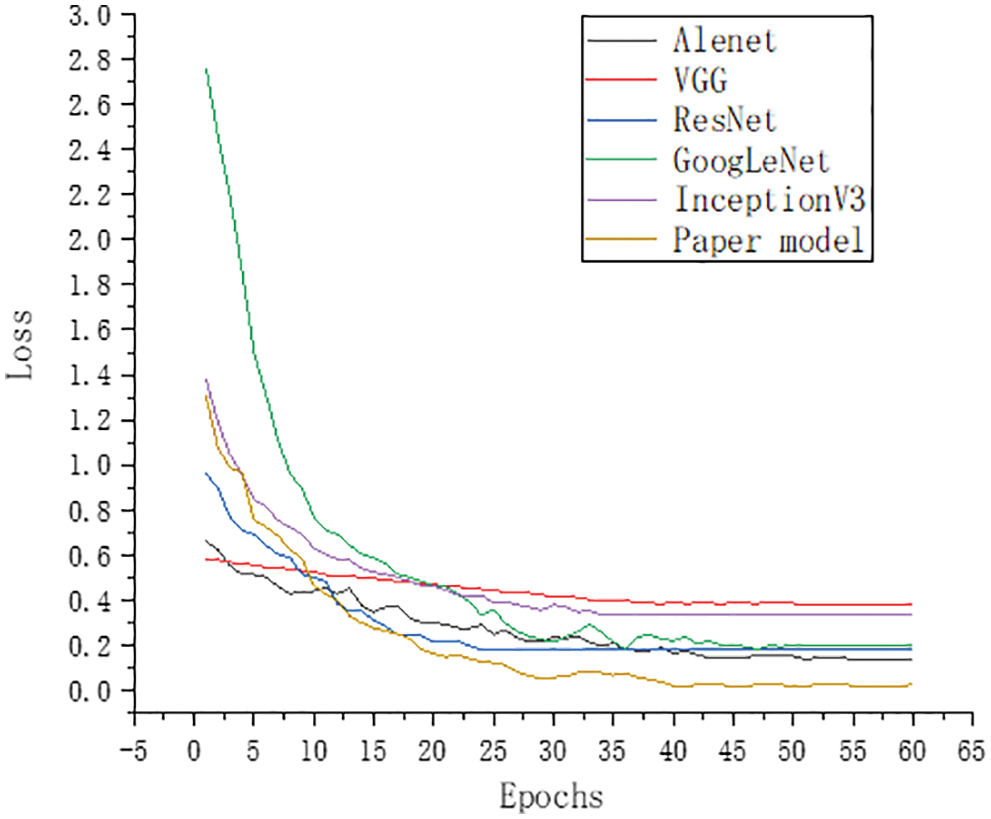
Figure 14: Training set loss curve
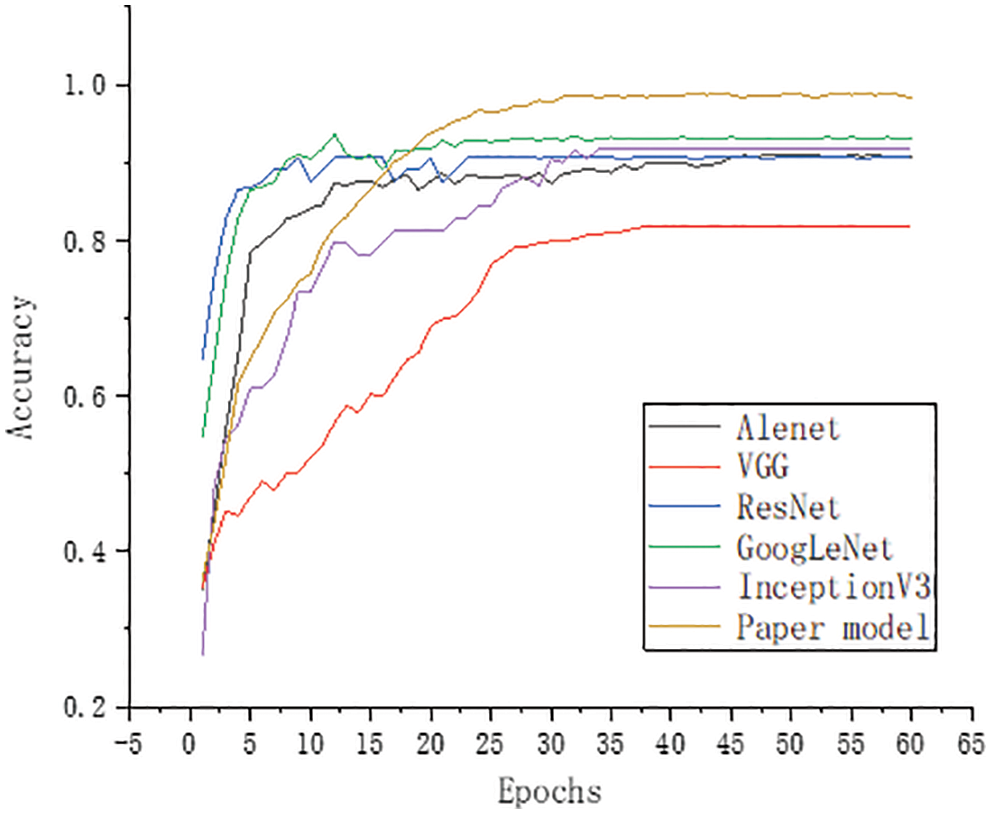
Figure 15: Comparison the model validation set curve
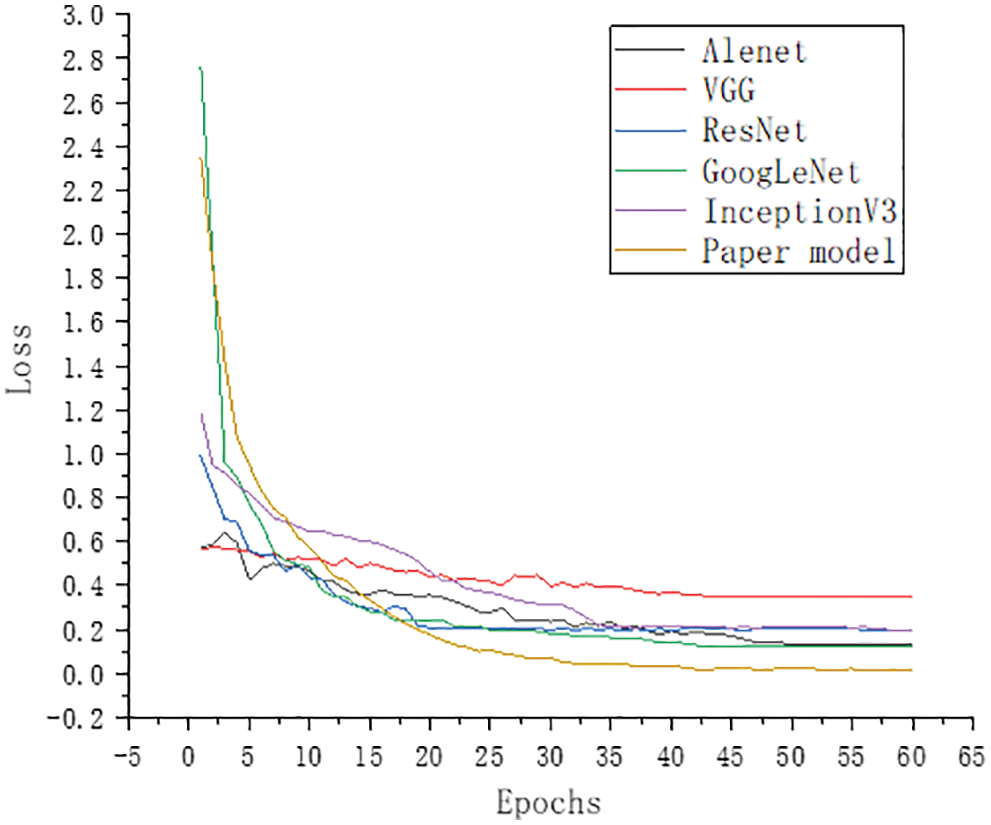
Figure 16: Validation set loss curve
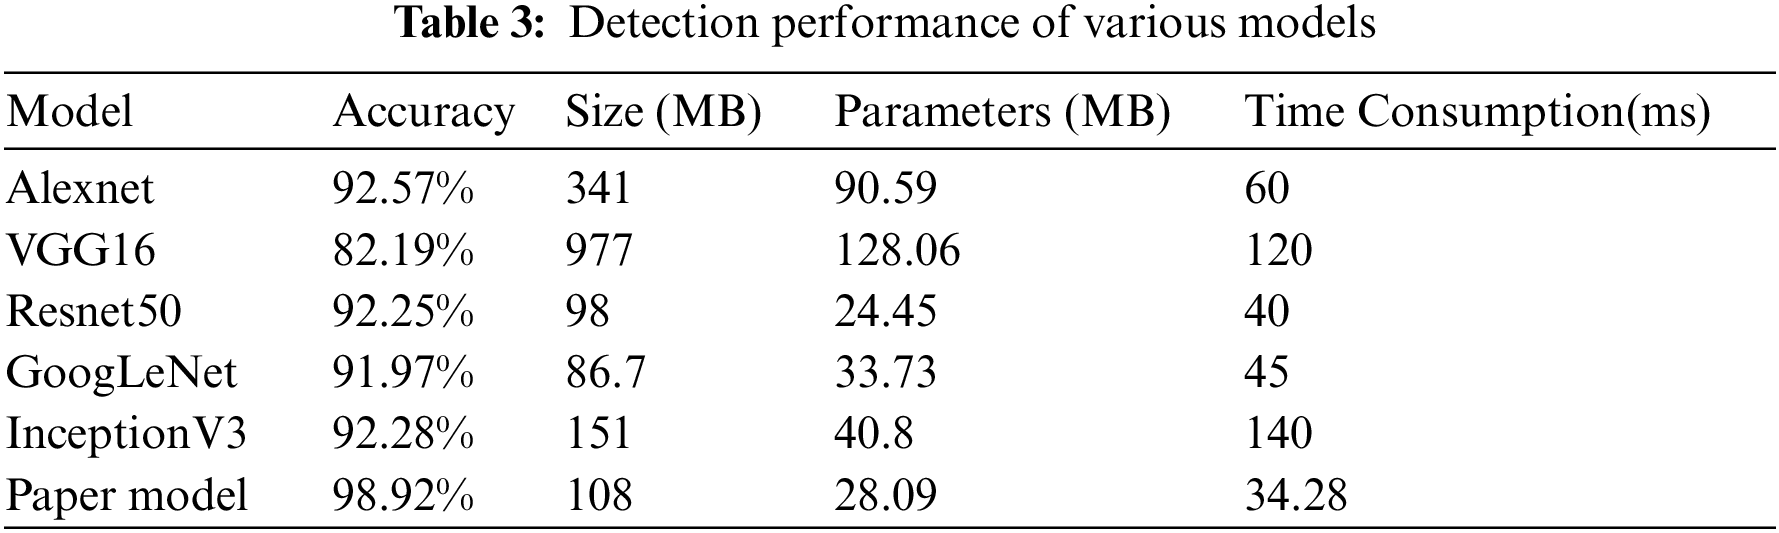
Tab. 3 shows that the model presented in this paper outperformed some classical convolutional neural networks in various aspects. In terms of consumption time, the model presented in this paper was superior to Alexnet, VGG16 and InceptionV3 models, and is not larger than other models in terms of accuracy and model size. However, the model presented in this paper outperforms the comparative models in terms of accuracy.
From the confusion matrix shown in Fig. 17, the recognition rate of the rest image reaches 100%; however, the walking image is confused with the standing image by 2.24%. The standing images were confused with the walking images by 1%. Many reasons, such as the amount of data and the image’s background, can be attributed to this event. If the model were to be trained for these factors, the model’s accuracy should improve.
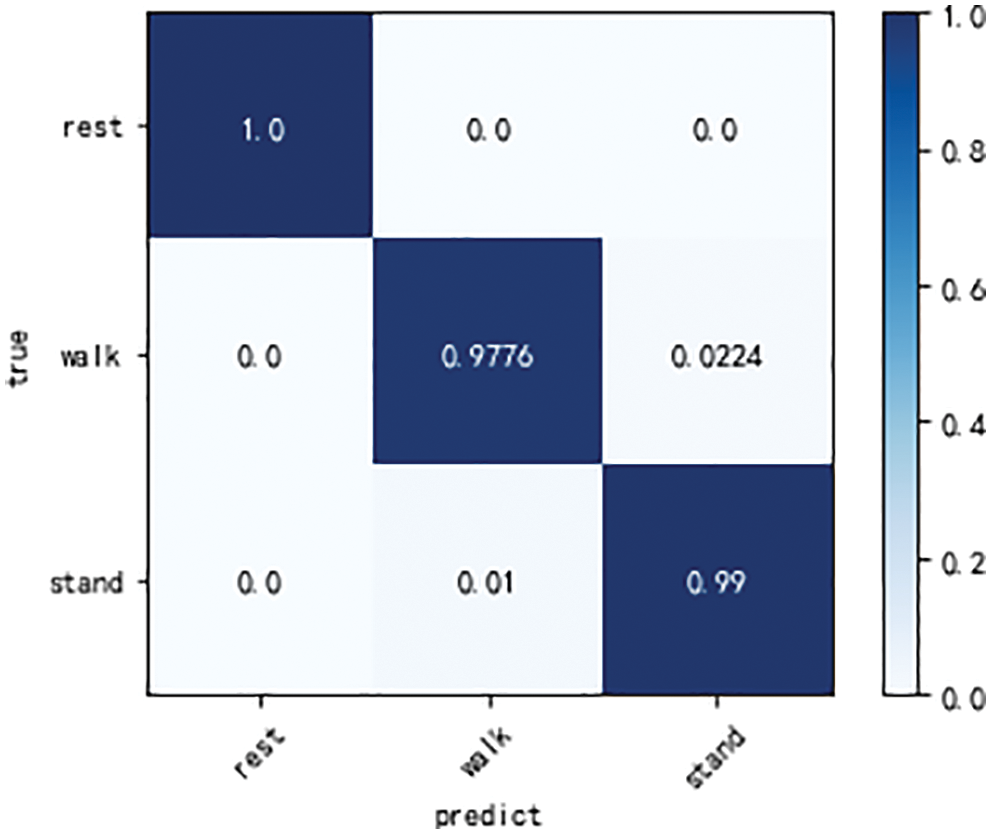
Figure 17: Confusion matrix of our model
According to the formulas of precision rate (Eq. (4)) and recall rate (Eq. (5)), the precision rate and recall rate of each behaviour of sika deer can be obtained as shown in Tab. 4.
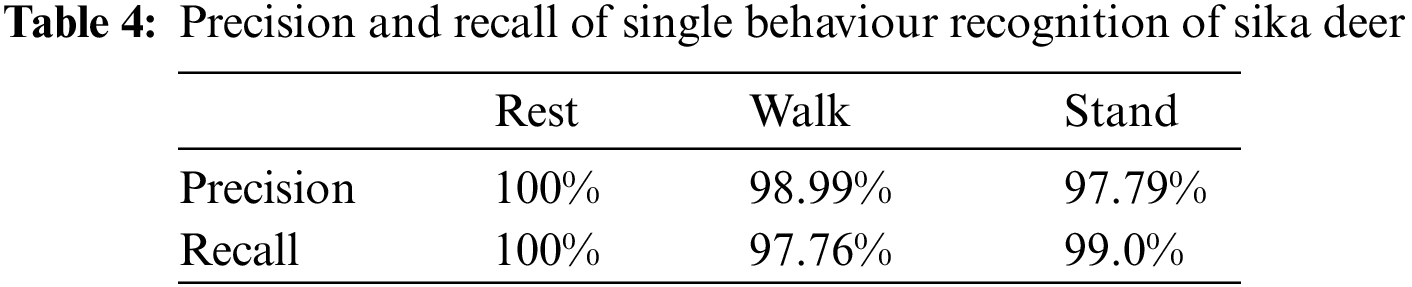
The precision and recall rate of each behaviour of the sika deer presented in Tab. 4 are above 97% after the recognition of the model, which shows the effectiveness of the model in the behaviour recognition of sika deer.
With the gradual expansion of the breeding scale of sika deer, the individual identification of sika deer as well as the health monitoring and monitoring of the quality of sika deer products have also become particularly crucial. Therefore, monitoring the health status of animals through their behaviour is also becoming increasingly popular. Keeping these factors in mind, a behaviour recognition method for sika deer based on machine vision was proposed in this paper. In this paper, GoogLeNet was used as the basic model, and the multi-scale model was added to the model to extract fine-grained features from images. The internal network structure of the Inception module was changed from 3 × 3 convolution to 5 × 5 convolution to enhance the model’s ability to extract coarse-grained features. The attention module, SE-Net module, was added to improve the channel attention and the accuracy of the model.
Alexnet, VGG16, Resnet50, GoogLeNet and InceptionV3 were selected for experimental comparison to verify the model’s validity and dataset in this paper. Importantly, the experimental environment and environmental parameters used were completely consistent. Experimental results demonstrate that the model can complete the behaviour recognition of sika deer, which is better than some common model recognition effects. The recognition accuracy of the model in this paper reached 98.92%.
In future works, the model will be adjusted to ensure the recognition rate in a small space, hence laying a foundation for the mobile terminal applications and contributing to the livestock breeding industry.
Acknowledgement: We are most grateful to the anonymous reviewers and editors for their careful work, which made this paper a substantial improvement. Thanks to my teacher for providing me with research conditions, so that I can learn knowledge at ease. Thanks for the financial support of Jilin Dongao Luye Technology Development Co., Ltd.
Funding Statement: This research is supported by the Science and Technology Department of Jilin Province [20210202128NC http://kjt.jl.gov.cn]; The People’s Republic of China Ministry of Science and Technology [2018YFF0213606-03 http://www.most.gov.cn]; Jilin Province Development and Reform Commission [2019C021 http://jldrc.jl.gov.cn] and the Science and Technology Bureau of Changchun City [21ZGN27 http://kjj.changchun.gov.cn].
Conflicts of Interest: The authors declare that they have no conflicts of interest to report regarding the present study.
References
1. C. Chen, W. Zhu and T. Norton, “Behaviour recognition of pigs and cattle: Journey from computer vision to deep learning,” Computers and Electronics in Agriculture, vol. 187, no. 1–3, pp. 106–255, 2021. [Google Scholar]
2. L. Saggiomo, B. Esattore and F. Picone, “What are we talking about? Sika deer (Cervus nipponA bibliometric network analysis,” Ecological Informatics, vol. 60, pp. 101–146, 2020. [Google Scholar]
3. H. M. L. Andersen, L. Dybkjaer and M. S. Herskin, “Growing pigs’ drinking behaviour: Number of visits, duration, water intake and diurnal variation,” Animal, vol. 8, no. 11, pp. 1881–1888, 2014. [Google Scholar]
4. W. Shen, Y. Sun, Y. Zhang, X. Fu, H. Hou et al., “Automatic recognition method of cow ruminating behaviour based on edge computing,” Computers and Electronics in Agriculture, vol. 191, no. 6, pp. 106–495, 2021. [Google Scholar]
5. J. Maselyne, I. Adriaens, T. Huybrechts, B. De Ketelaere, S. Millet et al., “Measuring the drinking behaviour of individual pigs housed in group using radio frequency identification (RFID),” Animal, vol. 10, no. 9, pp. 1557–1566, 2016. [Google Scholar]
6. F. Adrion, A. Kapun, F. Eckert, E. M. Holland, M. Staiger et al., “Monitoring trough visits of growing-finishing pigs with UHF-RFID,” Computers and Electronics in Agriculture, vol. 144, no. 3, pp. 144–153, 2018. [Google Scholar]
7. D. D. Shane, B. J. White, R. L. Larson, D. E. Amrine and J. L. Kramer, “Probabilities of cattle participating in eating and drinking behavior when located at feeding and watering locations by a real time location system,” Computers and Electronics in Agriculture, vol. 127, no. 1–2, pp. 460–466, 2016. [Google Scholar]
8. V. Giovanetti, M. Decandia, G. Molle, M. Acciaro, M. Mameli et al., “Automatic classification system for grazing, ruminating and resting behaviour of dairy sheep using a tri-axial accelerometer,” Livestock Science, vol. 196, no. 1–18, pp. 28–42, 2016. [Google Scholar]
9. V. Pegorini, L. Z. Karam, C. S. R. Pitta, R. Cardoso, D. C. C. D. Silva et al., “In vivo pattern classification of ingestive behavior in ruminants using FBG sensors and machine learning,” Sensors, vol. 15, no. 11, pp. 28456–28471, 2015. [Google Scholar]
10. S. Hosseininoorbin, S. Layeghy, B. Kusy, R. Jurdak, G. J. Bishop-Hurley et al., “Deep learning-based cattle behaviour classification using joint time-frequency data representation,” Computers and Electronics in Agriculture, vol. 187, pp. 106–241, 2021. [Google Scholar]
11. F. Lao, T. Brown-Brandl, J. P. Stinn, K. Liu, G. Teng et al., “Automatic recognition of lactating sow behaviors through depth image processing,” Computers and Electronics in Agriculture, vol. 125, no. 1, pp. 56–62, 2016. [Google Scholar]
12. K. Zhang, D. Li, J. Huang and Y. Chen, “Automated video behavior recognition of pigs using two-stream convolutional networks,” Sensors, vol. 20, no. 4, pp. 10–85, 2020. [Google Scholar]
13. C. Chen, W. Zhu, C. Ma, Y. Guo, W. Huang et al., “Image motion feature extraction for recognition of aggressive behaviors among group-housed pigs,” Computers and Electronics in Agriculture, vol. 142, no. 7, pp. 380–387, 2017. [Google Scholar]
14. D. Li, K. Zhang, Z. Li and Y. Chen, “A spatiotemporal convolutional network for multi-behavior recognition of pigs,” Sensors, vol. 20, no. 8, pp. 23–81, 2020. [Google Scholar]
15. Q. Yang, D. Xiao and S. Lin, “Feeding behavior recognition for group-housed pigs with the faster R-CNN,” Computers and Electronics in Agriculture, vol. 155, no. 1, pp. 453–460, 2018. [Google Scholar]
16. A. Yang, H. Huang, B. Zheng, S. Li, H. Gan et al., “An automatic recognition framework for sow daily behaviours based on motion and image analyses,” Biosystems Engineering, vol. 192, no. 1–3, pp. 56–71, 2020. [Google Scholar]
17. M. Jiang, Y. Rao, J. Zhang and Y. Shen, “Automatic behavior recognition of group-housed goats using deep learning,” Computers and Electronics in Agriculture, vol. 177, pp. 105–706, 2020. [Google Scholar]
18. S. Riaz, M. W. Anwar, I. Riaz, H. Kim, Y. Nam et al., “Multiscale image dehazing and restoration: An application for visual surveillance,” Computers, Materials & Continua, vol. 70, no. 1, pp. 1–17, 2022. [Google Scholar]
19. C. B. Rasmussen, K. Kirk and T. B. Moeslund, “Anchor tuning in faster R-CNN for measuring corn silage physical characteristics,” Computers and Electronics in Agriculture, vol. 188, pp. 106–344, 2021. [Google Scholar]
20. M. Zhang, H. Su and J. Wen, “Classification of flower image based on attention mechanism and multi-loss attention network,” Computer Communications, vol. 179, no. 2, pp. 307–317, 2021. [Google Scholar]
21. H. Farman, J. Ahmad, B. Jan, Y. Shahzad, M. Abdullah et al., “Efficientnet-based robust recognition of peach plant diseases in field images,” Computers, Materials & Continua, vol. 71, no. 1, pp. 2073–2089, 2022. [Google Scholar]
22. A. Iqbal, A. Basit, I. Ali, J. Babar and I. Ullah, “Automated meter reading detection using inception with single shot multi-box detector,” Intelligent Automation & Soft Computing, vol. 27, no. 2, pp. 299–309, 2021. [Google Scholar]
23. P. Siva and N. Nandhagopal, “Classification similarity network model for image fusion using Resnet50 and GoogleNet,” Intelligent Automation & Soft Computing, vol. 31, no. 3, pp. 1331–1344, 2022. [Google Scholar]
24. I. Ahmed, H. Sardar, H. Aljuaid, F. A. Khan, M. Nawaz et al., “Convolutional neural network for histopathological osteosarcoma image classification,” Computers, Materials & Continua, vol. 69, no. 3, pp. 3365–3381, 2021. [Google Scholar]
 | This work is licensed under a Creative Commons Attribution 4.0 International License, which permits unrestricted use, distribution, and reproduction in any medium, provided the original work is properly cited. |