| Computers, Materials & Continua DOI:10.32604/cmc.2022.028644 | |
| Article |
An Artificial Heart System for Testing and Evaluation of Cardiac Pacemakers
Department of Cybernetics and Biomedical Engineering, Faculty of Electrical Engineering and Computer Science, VSB - Technical University of Ostrava, 17.Listopadu 15, Ostrava – Poruba, 708 00, Czech Republic
*Corresponding Author: Jan Kubicek. Email: jan.kubicek@vsb.cz
Received: 15 February 2022; Accepted: 02 June 2022
Abstract: The usability assessment of a pacemaker is a complex task where the dedicated programmer for testing programmed algorithms is necessary. This paper provides the outcomes of development and complex testing of the artificial cardiac system to evaluate the pacemaker’s functionality. In this work, we used the modular laboratory platform ELVIS II and created graphical user interface in LabVIEW programming environment. The electrical model of the heart allows signals generation (right atrium, right ventricle) and the monitoring of the stimulation pulses. The LabVIEW user interface allows to set the parameters of the generated signals and the simulation of the cardiac rhythm disorders as well as the monitoring and visualization of the pacemaker behavior in real-time. The results demonstrate the capability of proposed system to evaluate the paced and sensed pulses. The proposed solution allows the scientists to test the behavior of any cardiac pacemaker for its pre-programmed settings and pacing mode. In addition, the proposed system can simulate various disorders and test cardiac pacemakers in different working modes.
Keywords: Artificial heart; cardiac conduction system; electrical cardiac stimulation; pacemaker
The heart electrical activity is inherently tied to the synergy and synchrony of cardiac contraction. Specialized cardiac cells of the conduction system of the heart are adapted to the creation of electrical excitations and their conduction on the heart sections. Thus, they provide autonomy (independence), automatism (self-activity), rhythmicity (regularity) and time-sequence of cardiac contraction [1–3].
In a healthy heart, the sinoatrial (SA) node, located in the right atrium near the superior vena cava, spontaneously generates the electrical cardiac activity, i.e., physiological pacemaker. Cells of the SA node generates action potential (AP) at the rate of about 70 beats per min (bpm) [4,5]. The primary electrical impulse propagates throw the right atrium and Bachmann’s bundle into the left atrium, then stimulates the working atrial myocardium. Again, the electrical activity propagates across preferential pathways into the atrioventricular (AV) node, where the AP is delayed by approximately 0.12 s, to full completion of the atrial contraction [6]. The AV interface is composed of non-conductive fibrous tissue allowing for the transmission of excitation from the atria to the ventricles, only via the AV conduction system. The AV conduction system is proximally composed of bundle of His, distally divided into two branches spreading along both sides of the interventricular septum as the left and right bundle branches. The left bundle branch further divides into the left anterior and the left posterior fascicles, further divided into Purkinje fibers, diverging into the inner layers of the ventricular muscle [7,8].
Damage to some part of the electrical conduction system can result in the arrhythmia (bradycardia, tachycardia, atrial or ventricular extrasystoles, flutter, and fibrillation) and incorrect depolarization process, which can be lethal in severe cases. According to anatomical localization of the lesion, the arrhythmias are divided into sine (SA block), supraventricular (AV block) and ventricular (bundle branch block) [9,10].
Medical treatment can be performed either by pharmacological therapy or by artificial cardiac stimulation via implantable instruments (cardiac pacemakers (PCM), Implantable Cardioverter-Defibrillators (ICD) or Cardiac Resynchronization Therapy (CRT)). Artificial cardiac stimulation introduces, via electrodes, a pacing pulse to the affected chambers (atria, ventricles) [11]. Thus, the electrical field is created between the poles of stimulating electrode and the surrounding myocardium. For the AP creation and propagation, the difference of potentials between extracellular and relatively negatively charged intracellular environment should increase from −80 to −60 mV (above the threshold potential) [12]. By applying a negative pulse to the extracellular space, the generation of AP is achieved, which further propagates by means of biophysical mechanisms on the surrounding cells. For cardio stimulation, a rectangular pulse with programmable width and amplitude is used, where the parameters depend on the excitability of cardiac muscle, identified by the Hoorweg-Weiss curve [13,14].
The PCM, ICD and CRT instruments for cardiac stimulation provide different modes and functions and have different therapeutic capabilities. The main difference is the number of the chambers paced and sensed: single-chamber (either atrium or ventricle); dual-chamber (atrium and ventricle); biventricular (left and right ventricle – CRT only). Sensing of intrinsic cardiac activity allows synchronous or controlled stimulation [15]. Modern pacemakers are “on demand”, meaning that they only pace when necessary; they can have adaptive rate and multisite pacing as well. ICD or Cardiac Resynchronization Therapy Defibrilator (CRT-D) also provides anti tachycardia pacing and defibrillation. Basic functions for ant bradycardia pacing are revised in North American Society of Pacing and Electrophysiology (NASPE)/ British Pacing and Electrophysiology Group (BPEG) five digit long generic code, where the first three digits mean the localization of stimulation electrode (0 – None, A – Atrium, V – Ventricle, D – Dual), localization of sensing electrode (0, A, V, D) and type of the sensing response (0 – None, T – Triggered, I – Inhibited, D – Dual). The most common stimulation modes according to the NASPE/BPEG code are Ventricular Demand Pacing (VVI), Atrial Demand Pacing (AAI), Dual Chamber Pacemaker (DDD) and VDD [15–18].
Programming of the currently used PCM, ICD and CRT instruments is possible thanks to a wireless interface. Many parameters can be set (e.g., A-V delay interval following a sensed atrial depolarization, sensing and pacing thresholds) and can be read information about past events and therapies [19]. Some devices have availability to store intracardiac electrocardiograms of the onset and progress of the event, which is helpful for diagnosis and making programming changes [20,21]. Programmer also performs diagnostic testing of the implanted device (sensing of intrinsic cardiac activity, impedance of leads and threshold of generated pulses). The programmer is usually a special purpose equipment to communicate directly with a device of a specific manufacturer [22,23]. Eventually manufacturers’ wands, which communicate with programming protocols in each branded pacemaker can be plugged into one programmer with a universal user interface [24–27].
Although the programmers allow to test the PCM, ICD and CRT instruments functionality, they are not adapted to more complex simulations, such as pacemakers generated pulses measurement and visualization, its response to various states, evaluation of time intervals and synchronization of the intrinsic cardiac activity and finally the pacemaker activity in real-time [28,29]. These options would be useful for demonstration of a pacemaker function, mainly for academic and educational purposes – simulation of pathological states of the electrical conduction system of the heart–and scientific purposes – improving the design of new adaptive algorithms for pacemakers –. In addition, it may also be useful for companies engaged in pacemaker technology for testing the programmed settings in such devices [30–33].
The main motivation of the paper is the design and development of a novel complex electric system, simulating a human’s heart. This system should be capable of generating electrical impulses for the purposes of pacemakers testing. Nowadays, operation and behavior of pacemakers can be tracked by pacemaker programmers. Nevertheless, it would be suitable to utilize a device which is able to perform testing of stimulator’s algorithms without their programmer as a versatile tool, which is applicable in any clinical cardiologic workplace. The main aim of this study is a development a user interface, allowing for settings of generated impulses, which are further transferred into pacemaker. The environment allows for tracking the pacemaker’s and generator’s behavior in a real time.
The proposed solution presents an independent testing system for cardiac pacemakers that does not require any dedicated programmer and could support all types of PCM, ICD and CRT instruments of any brand. The system is composed of an electrical model of the heart, which simulates the conduction system activity in localization of right atrium and right ventricle. It also includes a measuring chain for the artificial heart and pacemaker electrical activity measurement, a graphical interface for changing sensing and pacing parameters and finally a real-time signals visualization. The main contributions of this study are as follows:
• A novel independent system for testing the individual parameters of pacemakers is proposed. This system enables to test the programmed algorithms of the pacemakers even without its dedicated programmers.
• The electrical heart model was created. This model enables to generate electrical impulses simulating physiological and pathophysiological conditions of the cardiac conduction system to track the behavior of pacemakers.
• This novel independent system could find great usability for educational purposes, but also, for pacemakers’ manufactories and further evaluation of pacemaker’s functions.
Organization of the rest of the section is following. The Section 2 deals with the state-of-the-art of synthetic physiological signals. We are especially focused on the methods for generating synthetic physiologic signals. Section 3 is aimed on the complex design of the artificial heart for the cardiac pacemaker testing. Individual components comprise a system for the generated signals adjustment, circuit for pacemaker testing, hear signal generator, and block for input parameters settings for the generated signals from the right atrium and ventricle. Section 4 is focused on the testing and evaluation of the proposed system. We provide testing for Dual-chamber pacing, dual-chamber sensing, inhibited response-The DDI mode provides dual-chamber, sequential AV pacing with atrial sensing but no tracking of the sensed atria. AV synchrony is only provided at the current atrial pacing rate (DDI) and Dual-chamber pacing, dual-chamber sensing, triggered response (DDT) mode of the heart pacemaker. Lastly, Section 5 summarizes the reported fact of this proposed system for the testing and evaluation of the cardiac pacemaker.
Generators of the artificial physiological signals has recently gained on its importance from the several reasons. Synthetic (also called artificial) electrocardiogram (ECG) records are important for the clinical specialists for the training of physiological signals from pathological disorders classification, such is atrium flutter, or various types of arrythmias [33–35]. Based on such synthetic signals, we can simulate various pathological states with different severity of manifestation in ECG signal. The further important area is testing of various signal processing techniques. In this context, we can test effectivity and robustness of signal processing methods via different simulated conditions, and consequently compare the results with the real ECG signals [36–38]. Lastly, the synthetic signals represent a significant area, frequently discussed in the research community, which enable create testing system for the cardiac pacemakers. Such systems have the potential to fully substitute pacemaker programmer, and could support all types of PCM, ICD and CRT instruments of any brand. Such pacemaker testing instrument based on the synthetic signals represents one of the most challenging issues in the area of the synthetic signal analysis and modeling [39–41].
In the area of the synthetic signals, various methods have been adopted within the research community. One of the popular approach tackles with the design of synthetic time series, representing the behavior of real clinical signals, such is ECG [42–44]. Such dynamical behavior can be studied based on the periodical synthetical generators. For such approaches, the Fourier transformation can be adopted. Fourier series allows for a periodic expansion of individual elements of physiological signals [45–47]. In such approach, individual elements of ECG signal may be determined via a system of the mathematical equations, and consequently expanded into the Fourier series [48,49]. The further approach for the modeling utilizes a system of ordinary differential equations, in which user should define the characteristics of the heart rate [50–52]. Neural networks are considered as more sophisticated approaches with the aim to generate physiological signals [53,54]. We can note WaveNet, which is based on the auto-regressive neural network [55,56]. Generative Adversarial Networks (GANs) is other powerful alternative, which enables the development of physiological signals [57,58]. The advantage of GANs is not requiring expert’s input. There are several alternatives of GANs. Firstly, they utilized multi-layer perceptron to create the discriminator and the data generator [59,60]. Lately, this approach was improved by using a Deep Convolutional Generative Adversarial Network (DCGAN). It is also worth mentioning a Recurrent GAN (RGAN), which contain a recurrent feedback loop, utilizing both the input and hidden states at each time step [61–65]. The generation of synthetic signals could find application in heart disease diagnosis using Machine Learning (ML) methods. For example, Elhoseny et al. [66] have used binary Convolutional Neural Network (CNN) with innovated multi-agent feature wrapper that implements Genetic Algorithm (GA), Support Vector Machine (SVM) and Naïve Bayes (NB). This hybrid approach achieved highest accuracy 90.1%. Such algorithms are commonly used in other biomedical signals, where the synthetic signal generation could help in fine tuning set parameters [67–71].
These reported approaches are usually aimed on the ECG signal generation, and various simulation of different heart pathological disorders. Nevertheless, such methods commonly work with predefined ECG parameters. A present challenging area is focused on the development of the complex artificial heart systems, enabling settings a wider spectrum of the parameters, including atrial rate, ventricular rate, AV node delay, atrial and ventricular amplitude, and others to provide plenty simulations of the heart function. Such complex models have the potential to provide exhausting testing and evaluation of the cardiac pacemakers.
In this section, we present a proposal and realization of the heart electrical model.
3.1 A Proposed System for Cardiac Pacemaker
This model is aimed on the electrical pulses production for the purposes of testing of pacemakers. In the present time, workflow and effectivity of the pacemakers can be studied and analyzed by its programmers. Having such physical programmers may be not economical and redundant for the each clinical and testing workspace which need perform testing of the pacemakers. Therefore, such artificial heart is challenging issue to enable testing of the pacemakers by a convenient way. This system is represented by graphical interface in the LabVIEW, enabling settings of generated pulses, which are conducted to the pacemaker. Furthermore, this environment enables a visualization-based tracking of the stimulator behavior in the real time. This is a pilot study, which is realized by using a modular laboratory platform ELVIS II and the product for adjustment of the generated signal to the real physiological values. Consequently, this system allows for generating pathological heart disorders of the cardiac conduction system and generating these disorders from individual heart components.
Fig. 1 shows the block diagram of the testing system for cardiac pacemakers. The system includes hardware for simulation of the electrical heart activity in right atrium and right ventricle – electrical model of the heart (red blocks) – and hardware for measurement of the electrical heart activity and pacemaker stimulation impulses in right atrium and right ventricle (blue block). The hardware was implemented using the analog to digital (A/D) converter and digital to analog (D/A) converter of the modular laboratory platform ELVIS II. Amplitudes of the generated signals were adjusted to physiological values by operational amplifiers NJM4580D in inverting configuration with the gain of 0.001 for simulation of the atrial electrical activity and 0.003 for simulation of the ventricular electrical activity. The further important area is testing of various signal processing techniques.
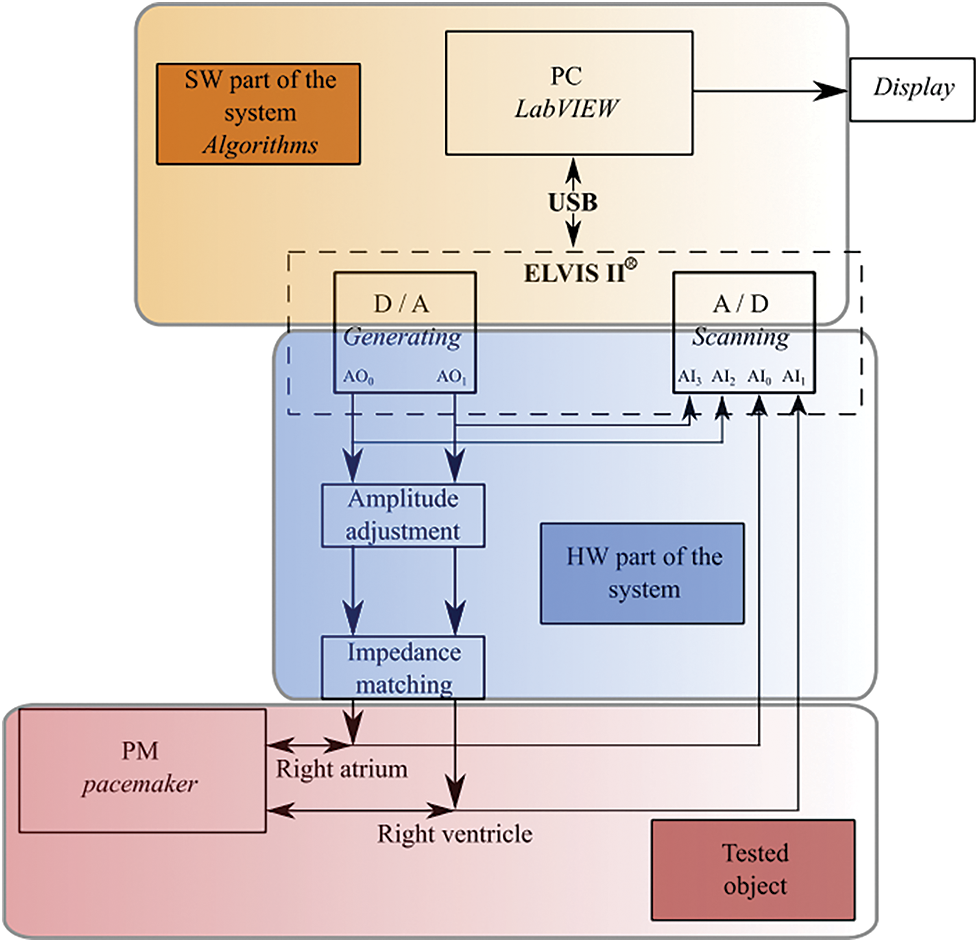
Figure 1: Block diagram of testing system for cardiac pacemakers
The whole hardware realization is done by using the platform ELVIS II, from manufacturer National Instruments. NI ELVIS II features one compact form factor integrated with 12 of the most commonly used instruments in the laboratory, including an oscilloscope, digital multimeter, function generator, variable power supply, and Bode analyzer.
3.2 System for Adjustment of Generated Signals
This section presents the block for amplitude adjustment. Since in NI ELVIS II we work with the amplitude range: 0 to 10 V, it is necessary to adjust that before conducting to the stimulator electrodes. For this reason, we propose a hardware design see Fig. 2, serving for the amplitude adjustment as from the right ventricle and from the right atrium.
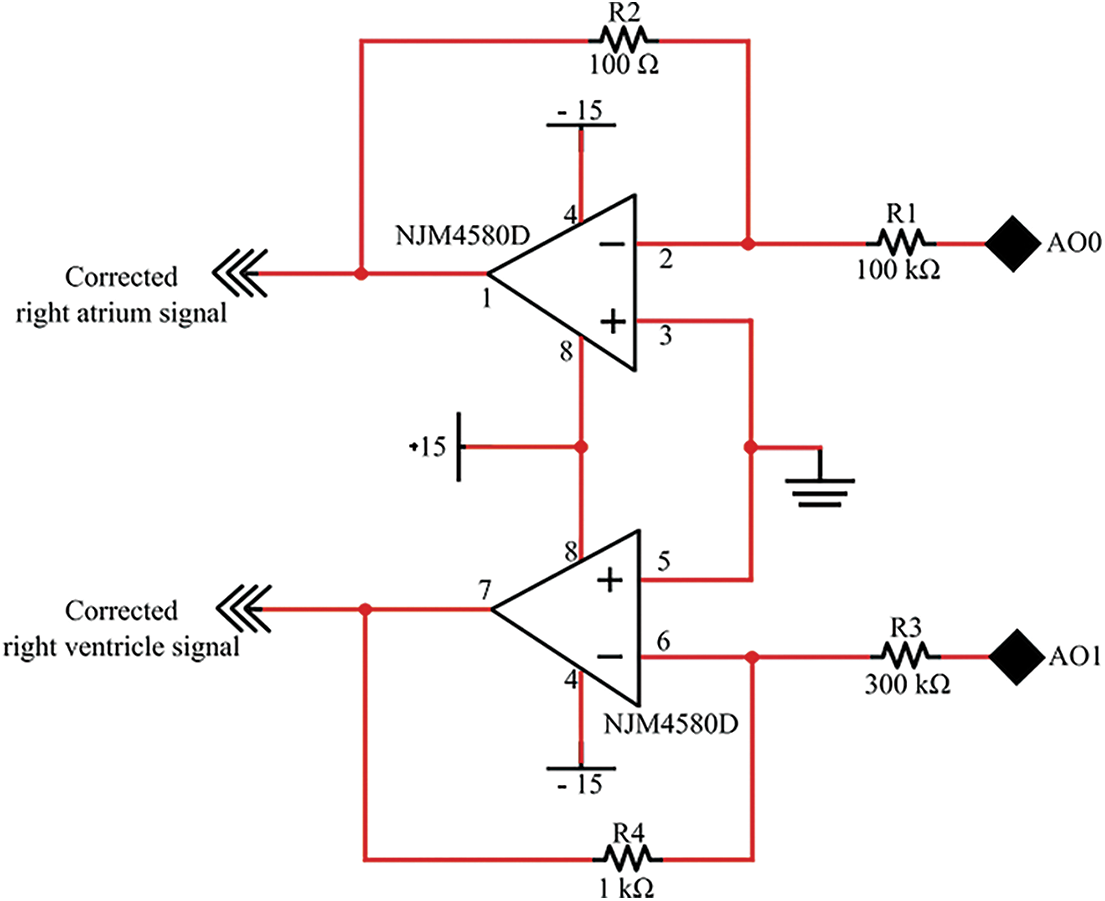
Figure 2: A design of circuit for amplitude adjustment of right atrium and ventricle from analog output D/A converter
For this implementation, we determined individual electrical components (R1, R2, R3 and R4) by the following way.
We use a general relationship for inverting amplifier:
For given amplitude values of generated signal of the right atrium we use: Uatrium = 10 mV, UAO0 = 1 : 1000. According to the expression for Uout, we can express value for: R1 = R2 ⋅ 1000 = 100 kΩ. In the case of using inverting amplifier, it is important to note that Uatrium will be inverse to UAO0.
For given maximal amplitude value of generated right ventricle signal, which is: Uventricle = 30 mV and UAO1 = 10 V, we selected the value: R4 = 1 kΩ. As we have the ratio: Uventricle : UAO1 = 1 : 300, we can determine the value: R3 = R4 ⋅ 300 = 300 kΩ. Uventricle will also be inverse to UAO0.
Moreover, the electrical circuit included functions for the adjustment of generated signals from the right atrium and ventricles.
3.3 A Design of Electronic Solution for Pacemaker’s Testing
After adjusting generated signal amplitudes of the right ventricle and atrium upon a converter outputs, we designed a circuit for the testing of whole system with the real stimulator. Fig. 3 shows the circuit diagram of the pacemaker’s atrial and ventricular lead connection, the generated signal amplitude adjustment, and the impedance matching. The signals were paced and sensed with unipolar-wired electrodes with the reference signal connected to the pacemaker housing and the analog system ground. The generated signal from the pacemaker was measured on the cathode (distal tip) of the atrial or ventricular lead and connected to the Analog Input AI0 or AI1 of the A/D converter through a 1 kΩ resistance. The generated signal from the electrical heart model was connected to the anode (proximal O-ring) of the atrial or ventricular lead through a 2 kΩ resistance for the measurement of cardiac activity by pacemaker. The anode and cathode of the atrial or ventricular lead were connected through a 1 kΩ resistance to simulate blood resistance.
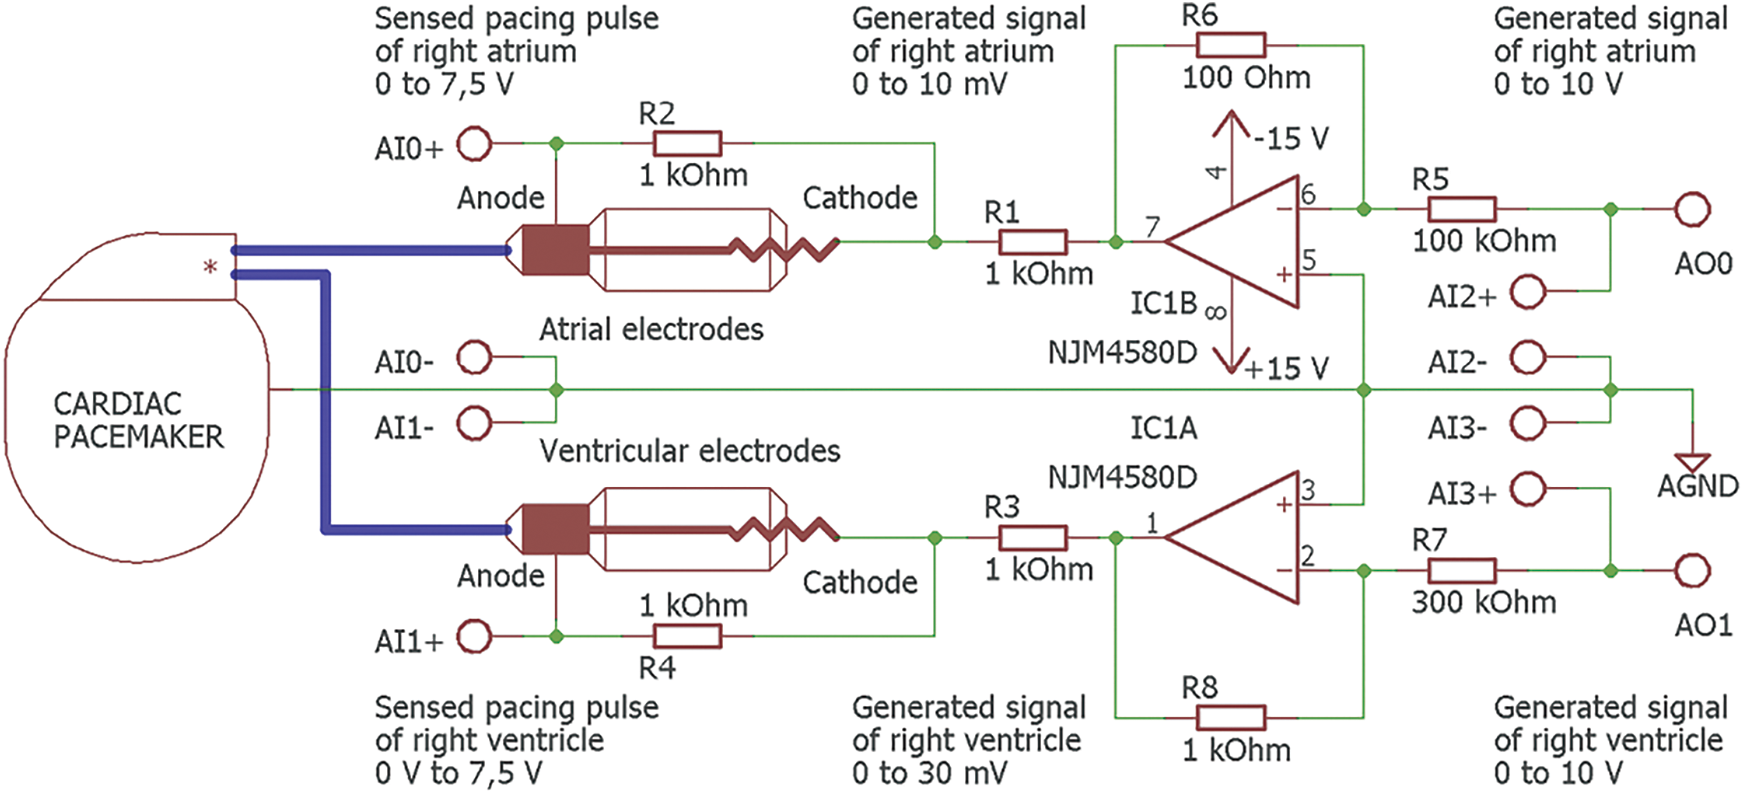
Figure 3: Circuit diagram of the pacemaker atrial and ventricular lead connection, generated signal amplitude adjustment and impedance matching. Connection of generated and sensed signals to the channels of A/D and D/A converters
Fig. 4 shows the waveform type used for the generation of the signal. The waveform complies with the EN 45502–2–1 standard, and it is used for the accurate determination of sensitivity (threshold potential) of PCM, ICD and CRT instruments.
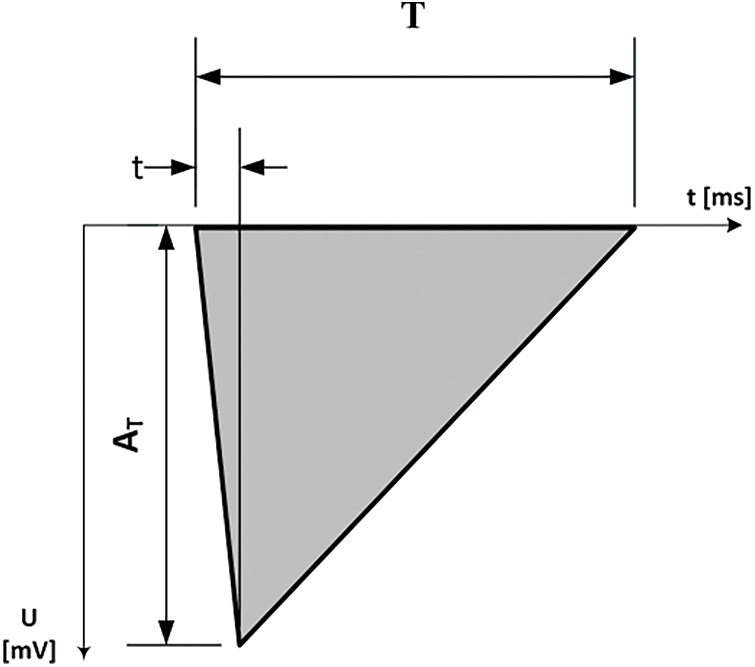
Figure 4: Waveform signal used for generation. Parameters T = 15 ms, t = 2 ms, AT = 0 to 10 mV (atrium), AT = 0 to 30 mV (ventricle), signal source impedance < 1 kΩ
Software for the testing system of cardiac pacemakers was developed in LabVIEW, the graphical development environment for testing, measurement, and control application. Proposed LabVIEW application allows communication with the ELVIS II hardware via USB interface see Fig. 1 and includes algorithms for the generation and sensing of the electrical impulses.
3.4 Proposal of Heart Signal Generator
In this section, we present a proposal of the heart signal generator. This generator is aimed on synthetic signals, simulating physiologic response from various heart components, and consequent detection, visualization, and stimulator testing. The whole heart signals generator is represented by the diagram in Fig. 5.
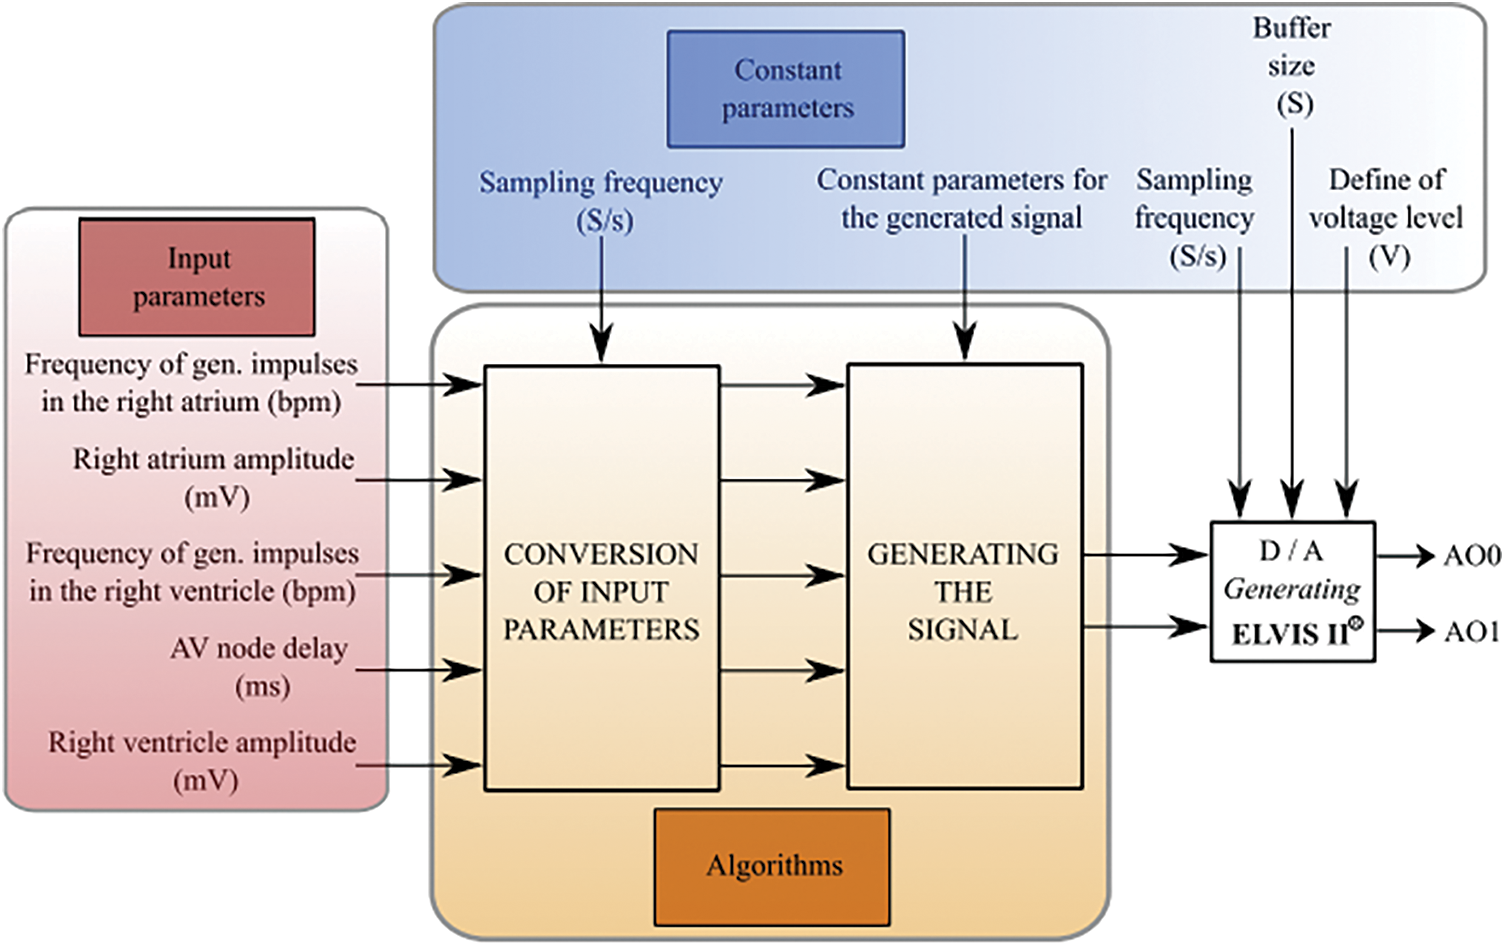
Figure 5: Block diagram of the proposed system for heart signal generator
This diagram is composed from three main function parts according to their utilization. Firstly, it is a part for definition of the input parameters, with consequent algorithms, which have the constant parameter values. The following hardware part includes D/A converter, which is intended for the signal definition upon the Analog Outputs (AO), denoted as AO0 and AO1.
The following block makes a generator of simulated signal of right atrium and ventricle. The following part of the heart signal generator is the block for the signal detection and visualization see Fig. 6. Also, in this case, we define the inputs of the system, which are the signals detected on the analog inputs of the A/D convertor. The following part is the block of A/D convertor. After that, two parallel blocks are following. One of them serves for the visualization of the signals, and the second one contains the algorithms, which determine the monitored parameters.
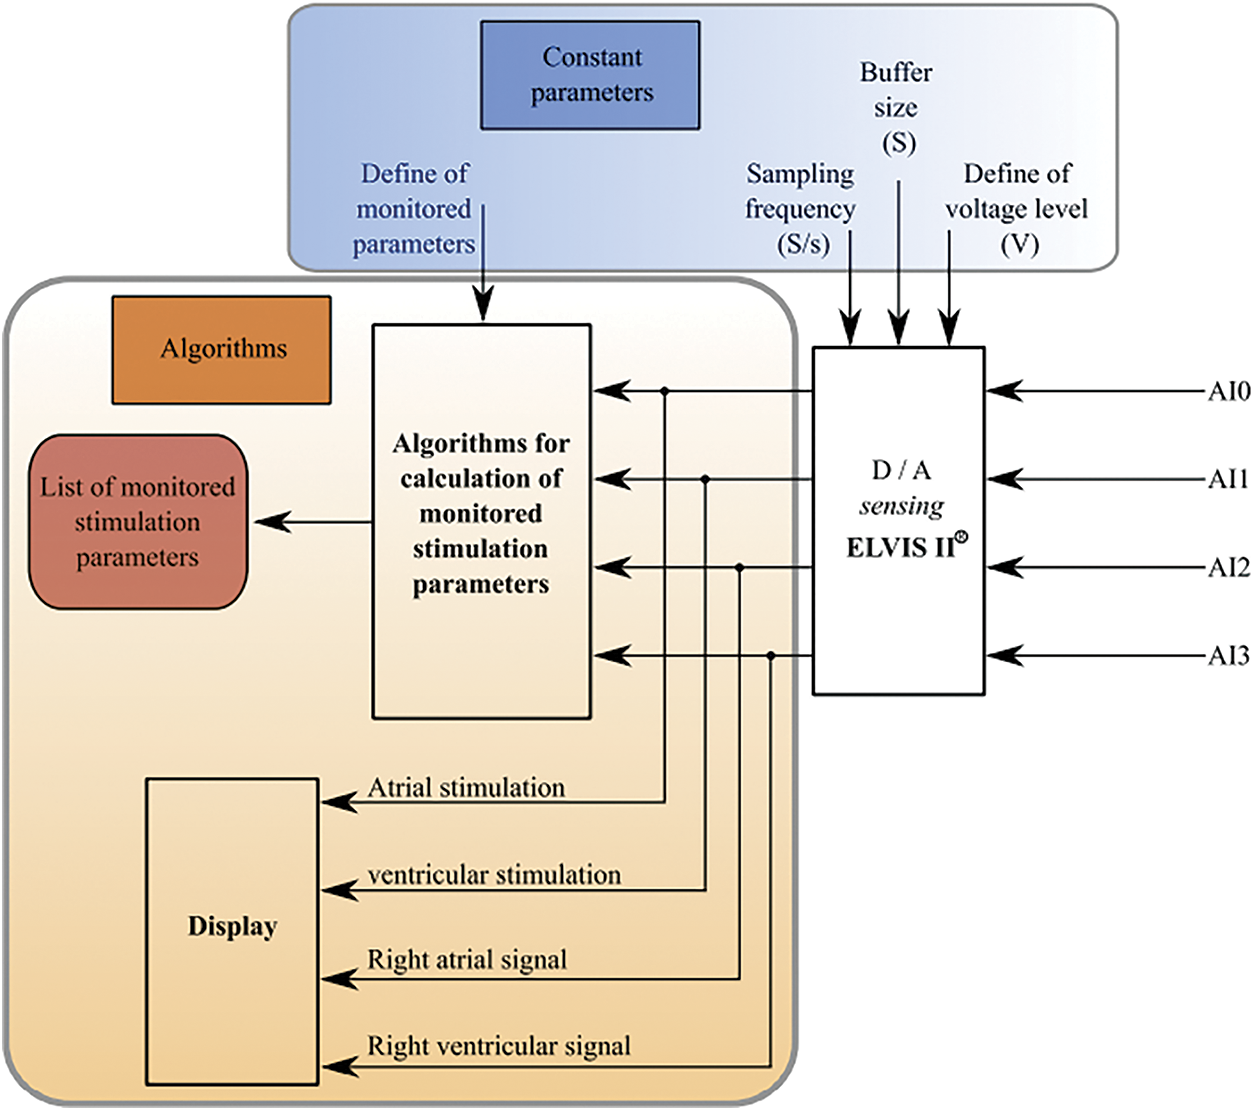
Figure 6: Block diagram of the signal detection from pacemaker and visualization
Within the experimental testing, we found out that it would be necessary to incorporate a response to the generated signal upon the detected signal from pacemaker into the systems. This feedback is indicated by green color in Fig. 7. As it is obvious from this block part, the feedback is conducted between the algorithm block for the signal generating, and the block of the algorithms, ensuring the stimulation signal parameters. By this way, it is ensured that the influence of the generated signal is given by the detection of stimulation impulses.
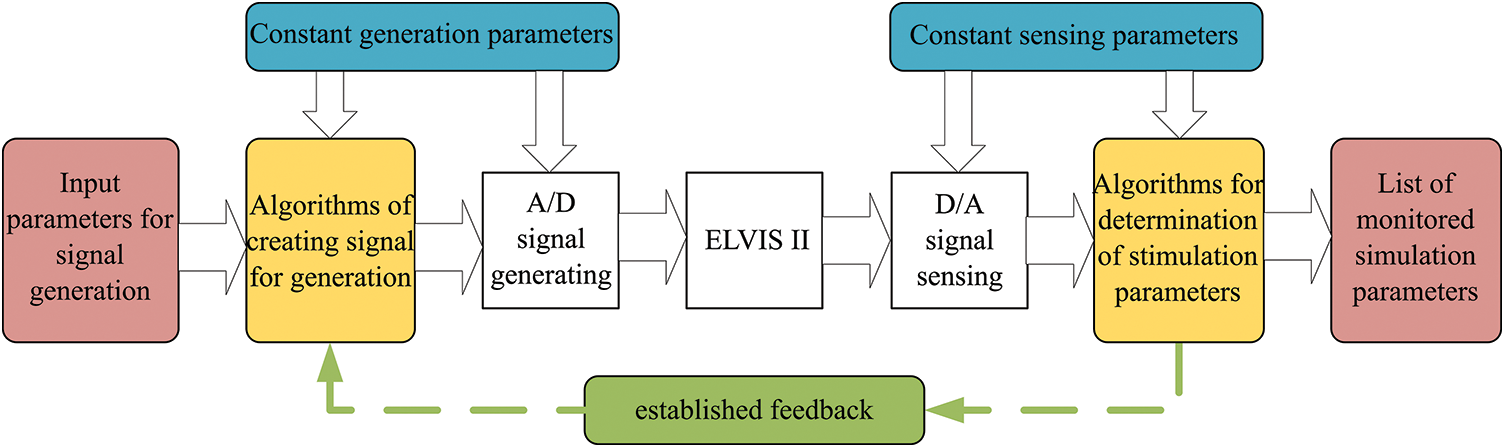
Figure 7: Block diagram of the feedback for response of signal generator based on the stimulation
3.5 A Proposal of Graphical User Interface for Settings of Heart Components Parameter
This section deals with the graphical user interface for settings of the heart components parameters. The graphical user interface see Fig. 8 allows to set parameters of the electrical heart model including frequency and amplitude of both atrial and ventricular impulses, AV node delay as well as impulse width and sampling rate of the generated waveform (shown in Fig. 4. Default sampling rate of the generated waveform was 10 kS/s. Each parameter has defined range, adjustable from physiological to pathological values. Limitation compared to the physiological values is only for the amplitude adjustment, with lowest value of 2.5 mV. This limitation is caused by noise of the used hardware. The electrical heart model can simulate disorders listed in Fig. 8 with each disorder well described in the front panel window.
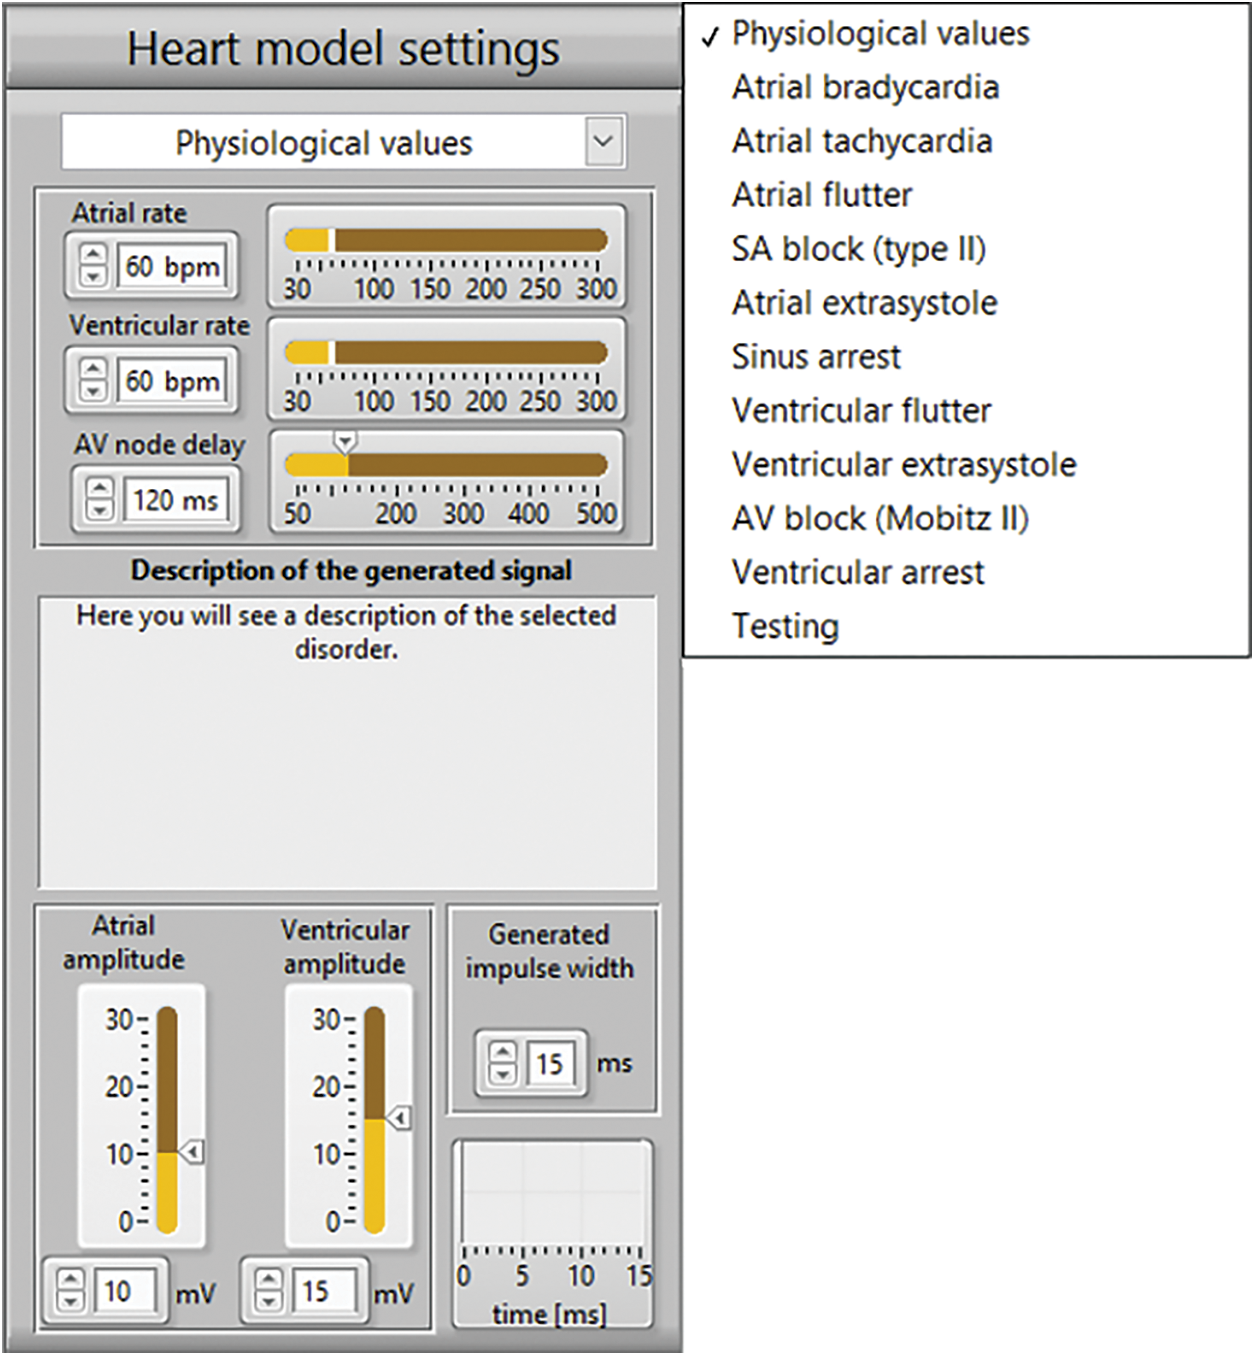
Figure 8: Parameters of the electrical heart model for signal generation and list of disorders for simulation
Sensed signals from each analog input channel see Fig. 3 were displayed using LabVIEW Waveform Charts tool. The parameters of the A/D converter allow to set the sampling rate and number of the loaded samples. The default value of the sampling rate for the sensed signals was set to 30 kS/s. Based on the sensed signals, the rate and amplitude of the sensed impulses in both atria and ventricle cavities were evaluated and displayed on the front panel window by using the LabVIEW indicators. Figs. 3 and 5 show the examples of generated signals on AI2 and AI3 input channels and sensed pacing pulse signals on AI0 and AI1 input channels for the measurements with a real cardiac pacemaker.
System response to stimulation impulses from the cardiac pacemaker made possible by introducing a feedback. The electrical model of the heart responds to stimulation impulses by resetting the time of impulse generation. Because of the long delay problem in the resetting the analog inputs and outputs, special LabVIEW block structures were used. Slow adaptation of the model was solved by introducing an algorithm for comparing the frequency of the generated impulses in the cavity with its stimulation frequency and including a decision block for the cases of inhibition or triggering pacing modes. In this way, a normal response of the conduction system of the heart to the pacemaker stimulation was simulated.
The real cardiac pacemaker Biotronik Evia DR-T and the ICS 3000 programmer were used for testing the proposed system. The pacemaker is rate-responsive dual chamber device allowing the programming for the Dual-chamber pacing, dual-chamber sensing, dual-chamber response, rate-responsive pacemaker. In DDDR mode, the pacemaker follows the fastest rate, being either the intrinsic atrial rate or the rate indicated by the sensor (DDDR) and the other appropriate modes. In the cardiac pacemaker Biotronik Evia DR-T, we can note the electrode adjustment, which serves for the connection to hardware circuit for adjustment of the generated signal amplitude. A standard couple of electrodes was used with the connector IS-1 and active fixation. In all the cases of the testing regimes, a unipolar stimulation was programmed. In the detail, showing connected electrodes spots are depicted on the Fig. 9.
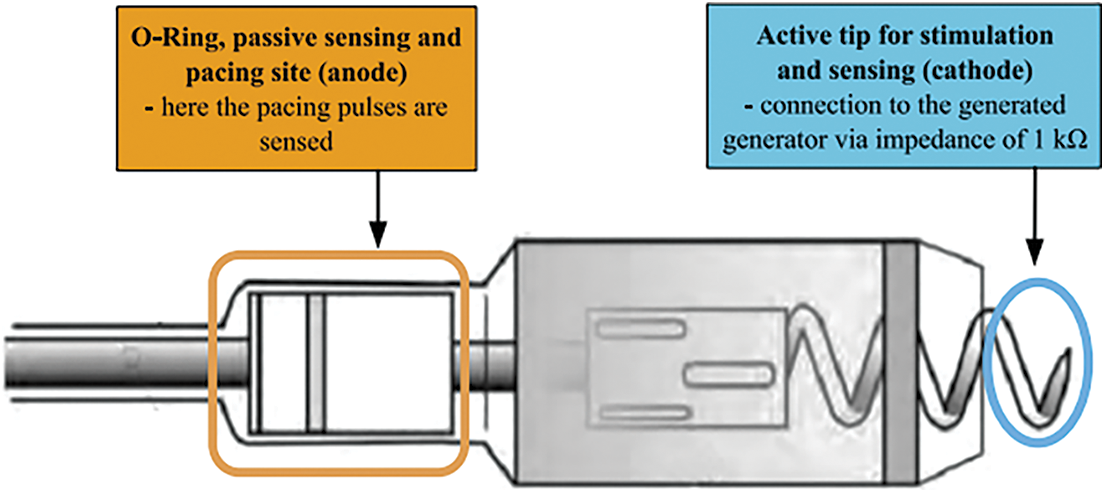
Figure 9: Detail of electrode termination and connecting points
In this part, we describe the testing procedures. The block scheme in Fig. 10 shows the measuring flowchart. Own experimental testing was done by comparing of the visualization of detected events between the proposed system and used programmer within the change of the input parameters based on the selection of the heart disorder. Further, we evaluated calculated parameters of the amplitude and frequency of the stimulation impulses.
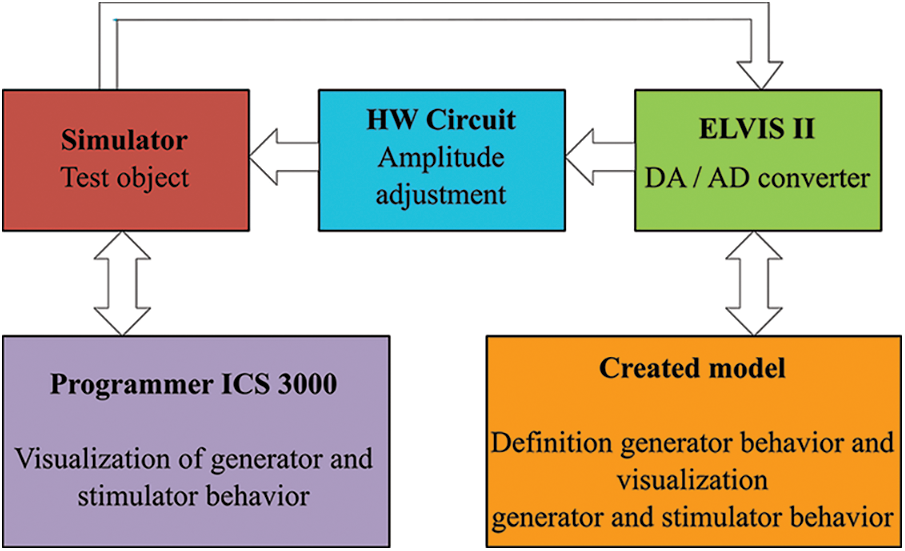
Figure 10: Block scheme of the measuring chain for testing
The test consisted of comparison of sensed events in both LabVIEW and programmer applications. The sensed signals and parameters of calculated rate and amplitude of pacing pulses were evaluated from the LabVIEW front panel see Figs. 13, 14. Impulses generated by the electrical model of the heart, frequency of impulses, AV delay parameters and sensed and paced events of the pacemaker were available in the programmer visualization software see Figs. 11 and 12. The system was tested for physiological values and for disorders listed in Fig. 8 with the pacemaker programmed to dual chamber modes +DOO – dual chamber pacing, none sensing, none response, (Dual-chamber pacing, dual-chamber sensing, inhibited response - The DDI mode provides dual-chamber, sequential AV pacing with atrial sensing but no tracking of the sensed atria. AV synchrony is only provided at the current atrial pacing rate) and Dual-chamber pacing, dual-chamber sensing, triggered response (DDT) as well as to single chamber modes as asynchronous atrial pacing (AOO - Atrial pacing, none sensing, none response), atrial demand pacing (AAI - Atrial pacing, Atrial sensing, inhibited response), atrial pacing (AAT - Atrial pacing, Atrial sensing, triggered response), asynchronous ventricular pacing (VOO - Ventricular pacing, none sensing, none response), ventricular demand pacing (VVI - Ventricular pacing, Ventricular sensing, inhibited response), ventricular pacing (VVT - Ventricular pacing, Ventricular sensing, triggered response).
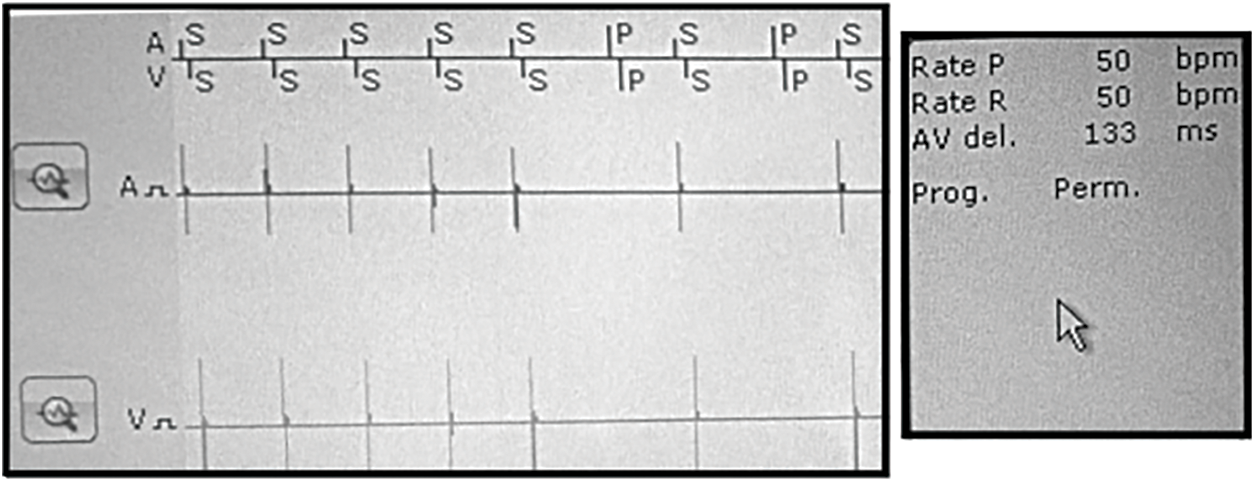
Figure 11: Visualization of signals with programmer application for the DDI mode and simulated SA
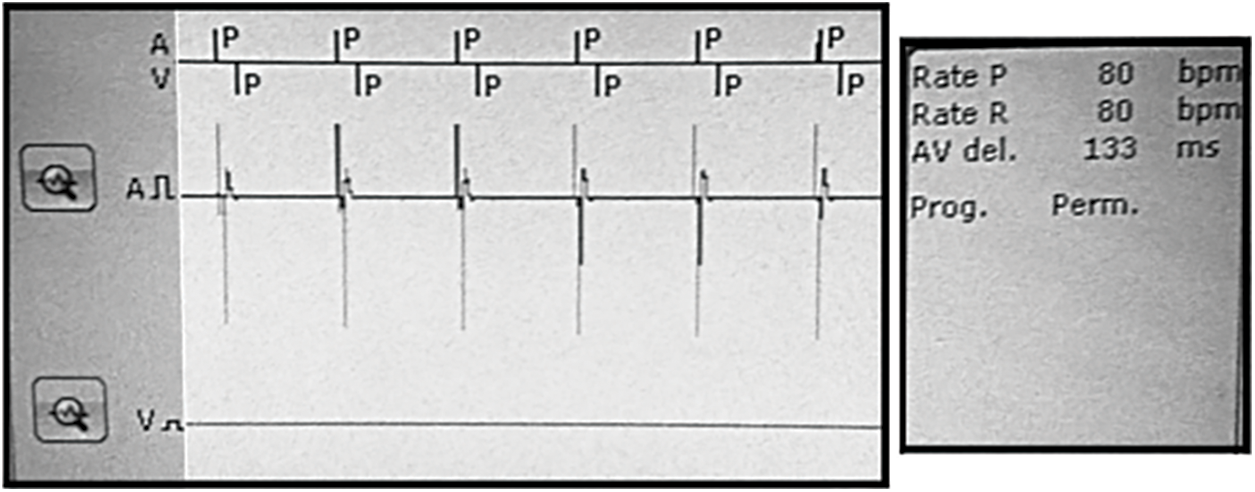
Figure 12: Visualization with programmer for the DDT mode and simulated AV block
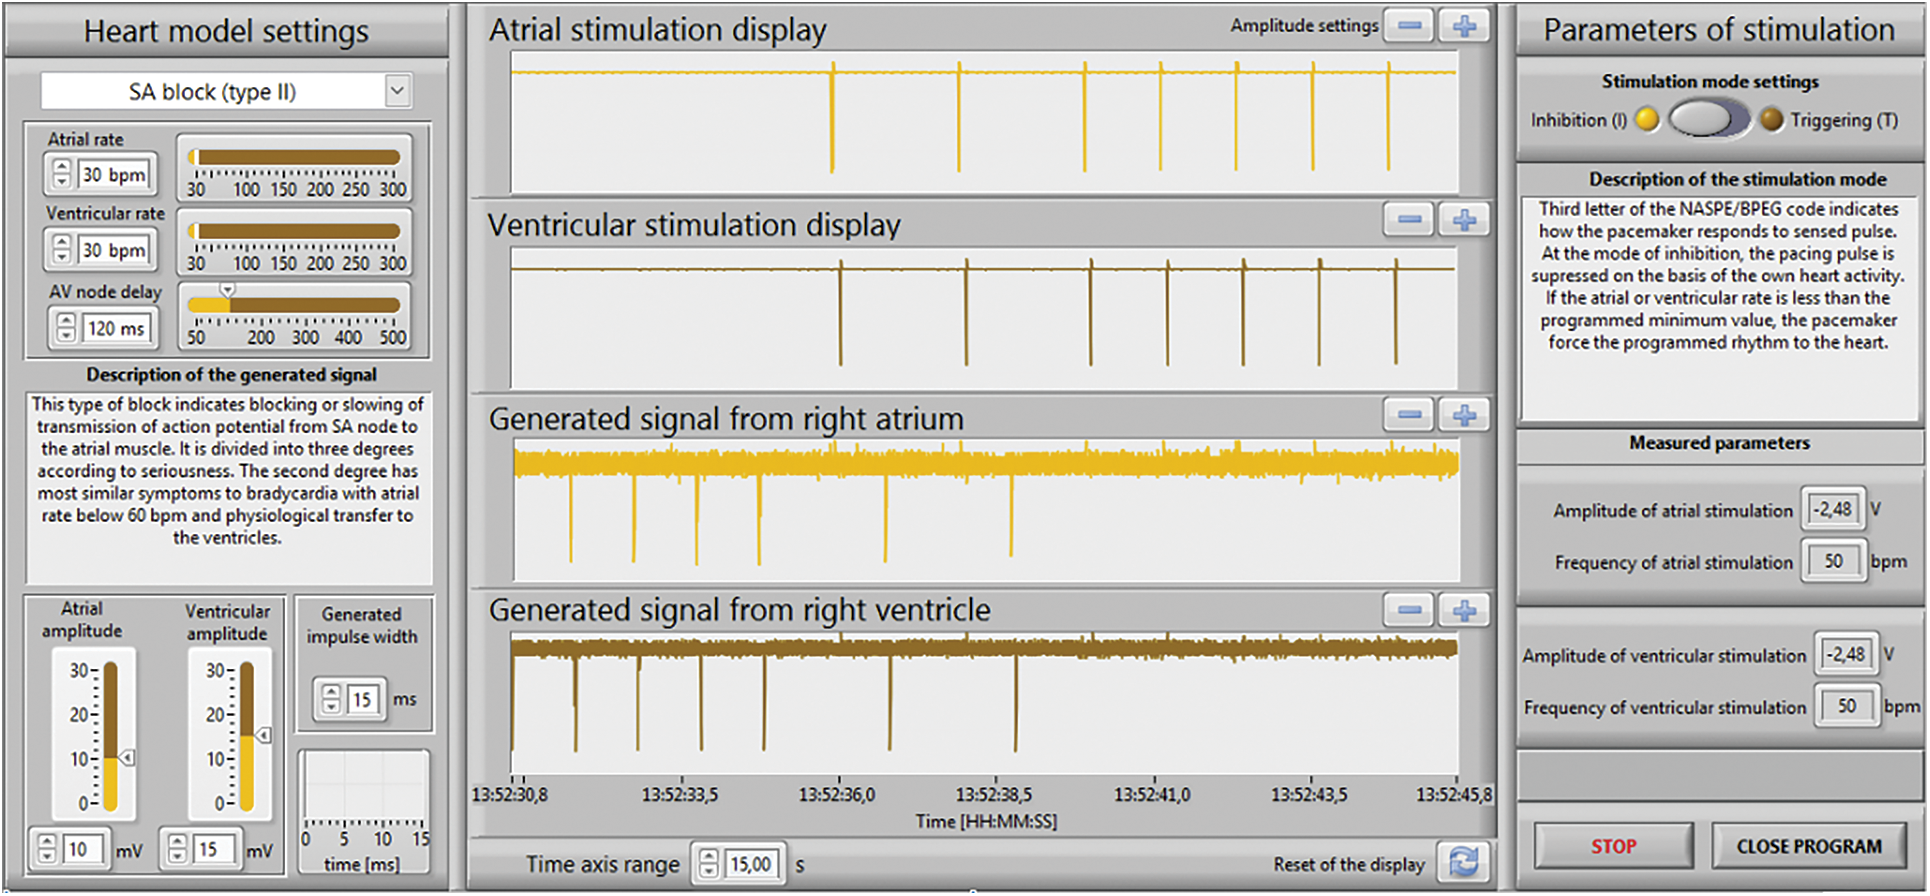
Figure 13: The LabVIEW front panel for the DDI mode and simulated SA block
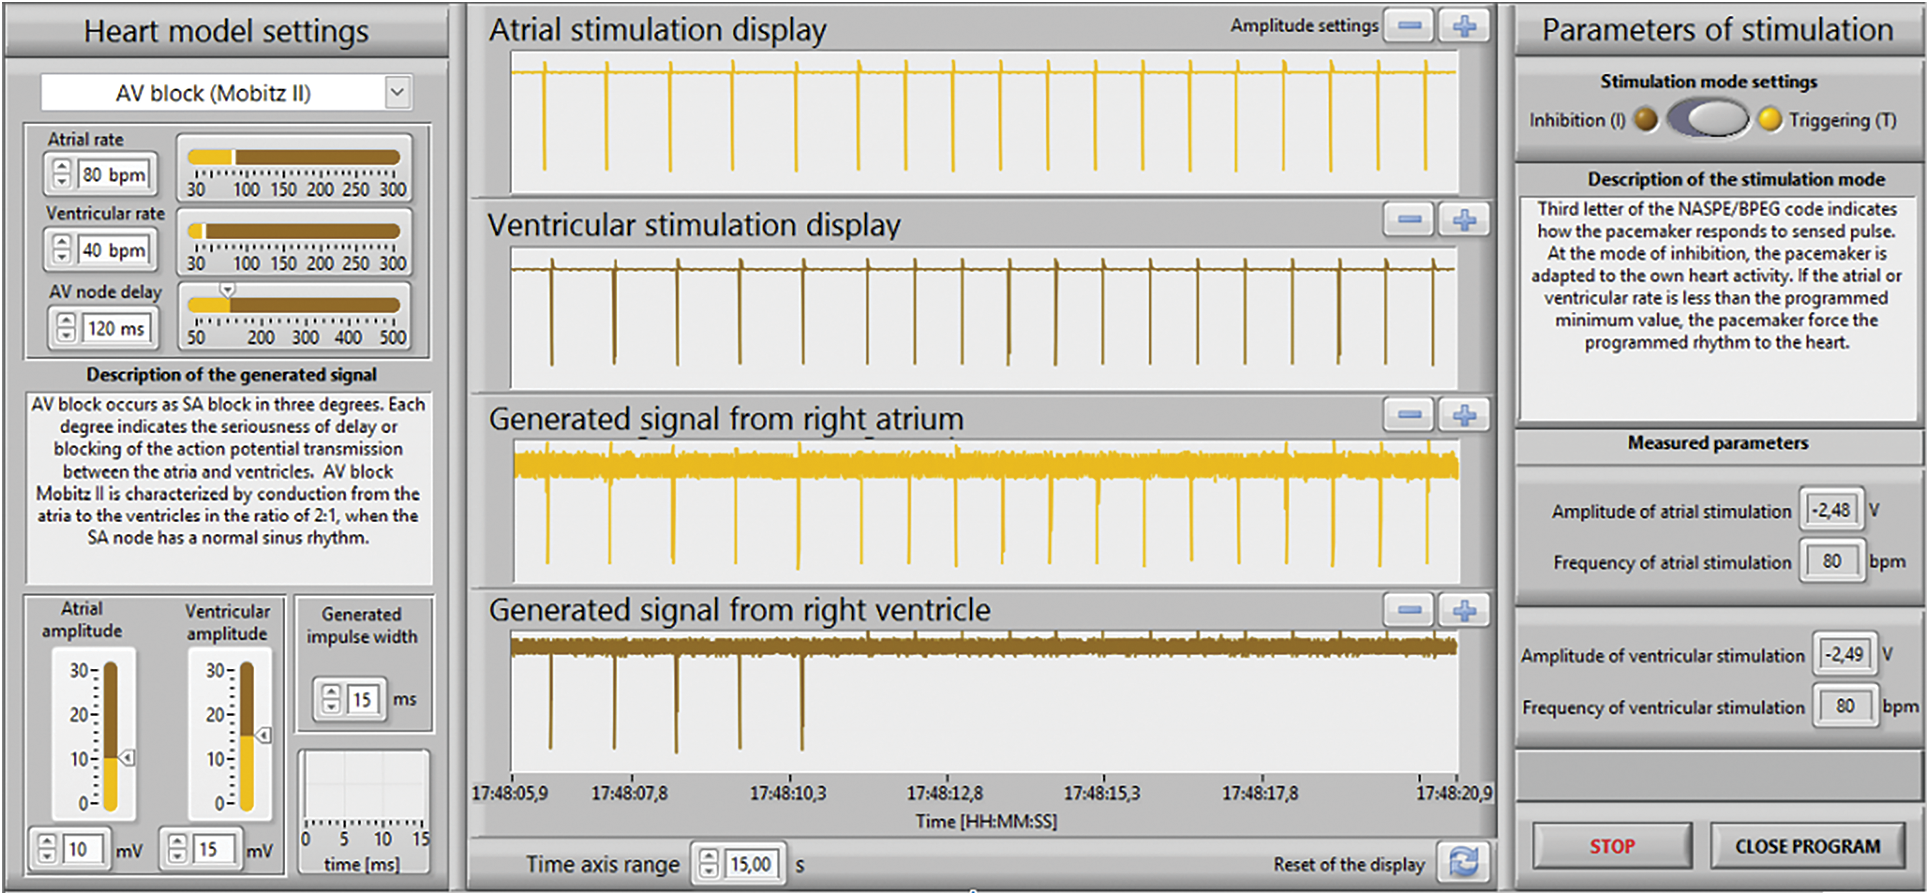
Figure 14: The LabVIEW front panel for the DDT mode and simulated AV block
Figs. 11 and 13 show the results for the DDI mode and simulated SA block (type II). The programmer Tab. 1: Programmer setup for the DDI mode. A V Mode DDI Pulse amplitude (V) 2.5 2.5 Basic rate/Night rate (bpm) 50/OFF Pulse width (ms) 1.0 1.0 Capture control off Sensor/rate fading (bpm) Atrial upper rate (bpm) 240 Sensitivity (mV) 7.5 7.5 Mode switching Refractory period/Blanking Standard Vp suppression OFF Pacing polarity UNIP UNIP AV delay (ms) 130 Sensing polarity UNIP UNIP Atriithideide Calculated ERI 8 Y. 0 Mo. was set according to the values in Tab. 1: the frequency of stimulation impulses for both atrium and ventricle cavities was set to 50 bpm; AV delay was set to 130 ms; stimulation pulse was set to amplitude of 2.5 V and pulse width of 1 ms; sensitivity for both cavities was set to 7.5 mV, i.e., the generated signals with lower amplitudes were not registered by the pacemaker.
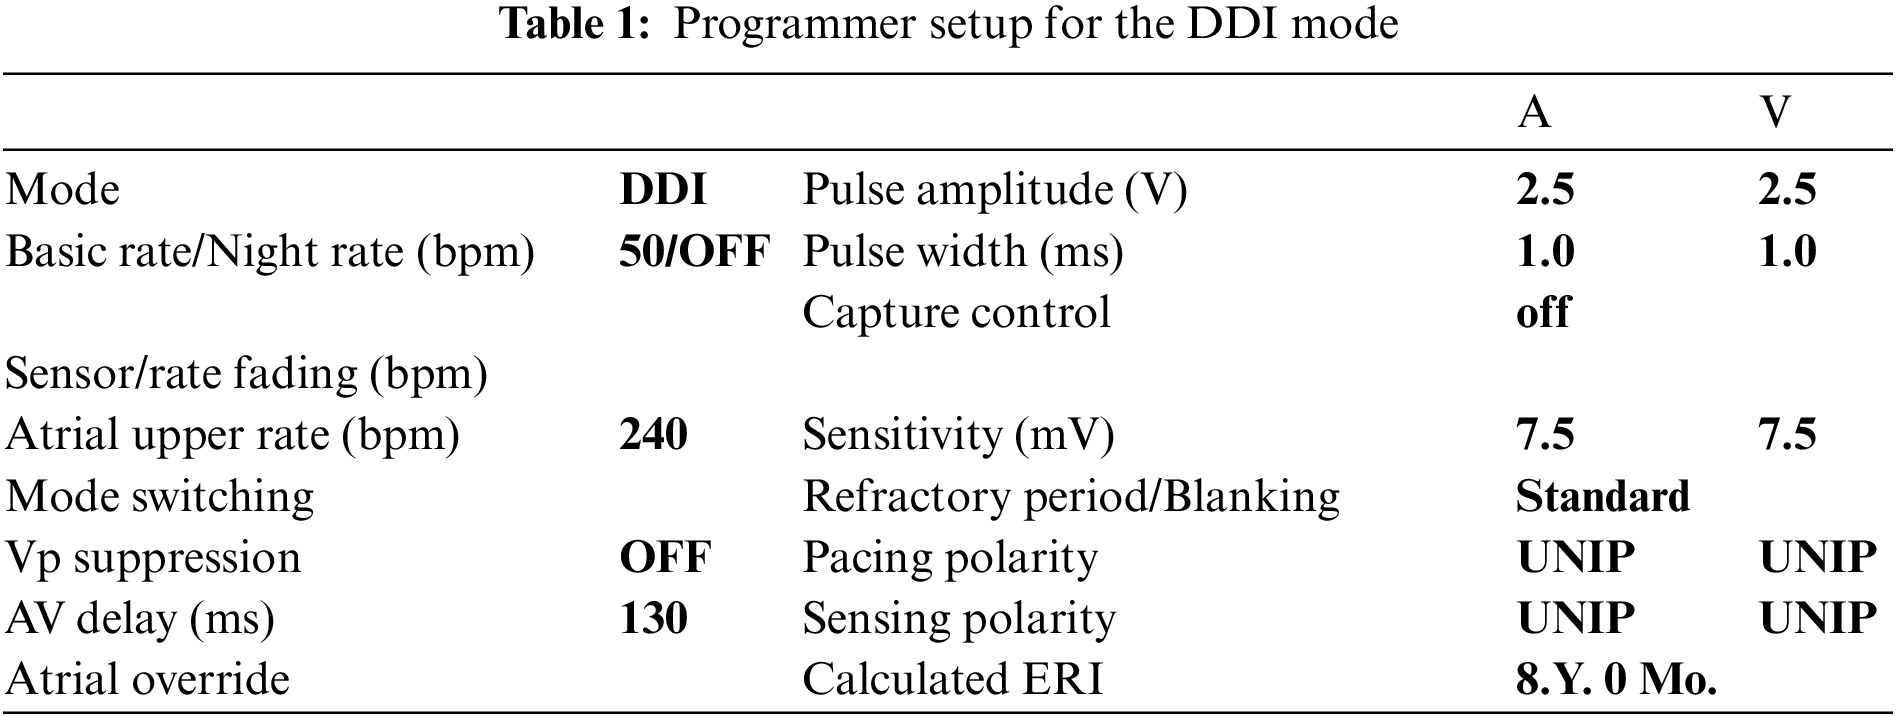
Physiological values (60 bpm atrial and ventricular rate) were changed to SA block (30 bpm atrial and ventricular rate). As shown in Figs. 12, 14, the electrical model of the heart was after 7 to 8 s fully adapted to the higher stimulation rate, controlled by the pacemaker. The heart rate and AV delay corresponded to programmer settings see Tab. 1.
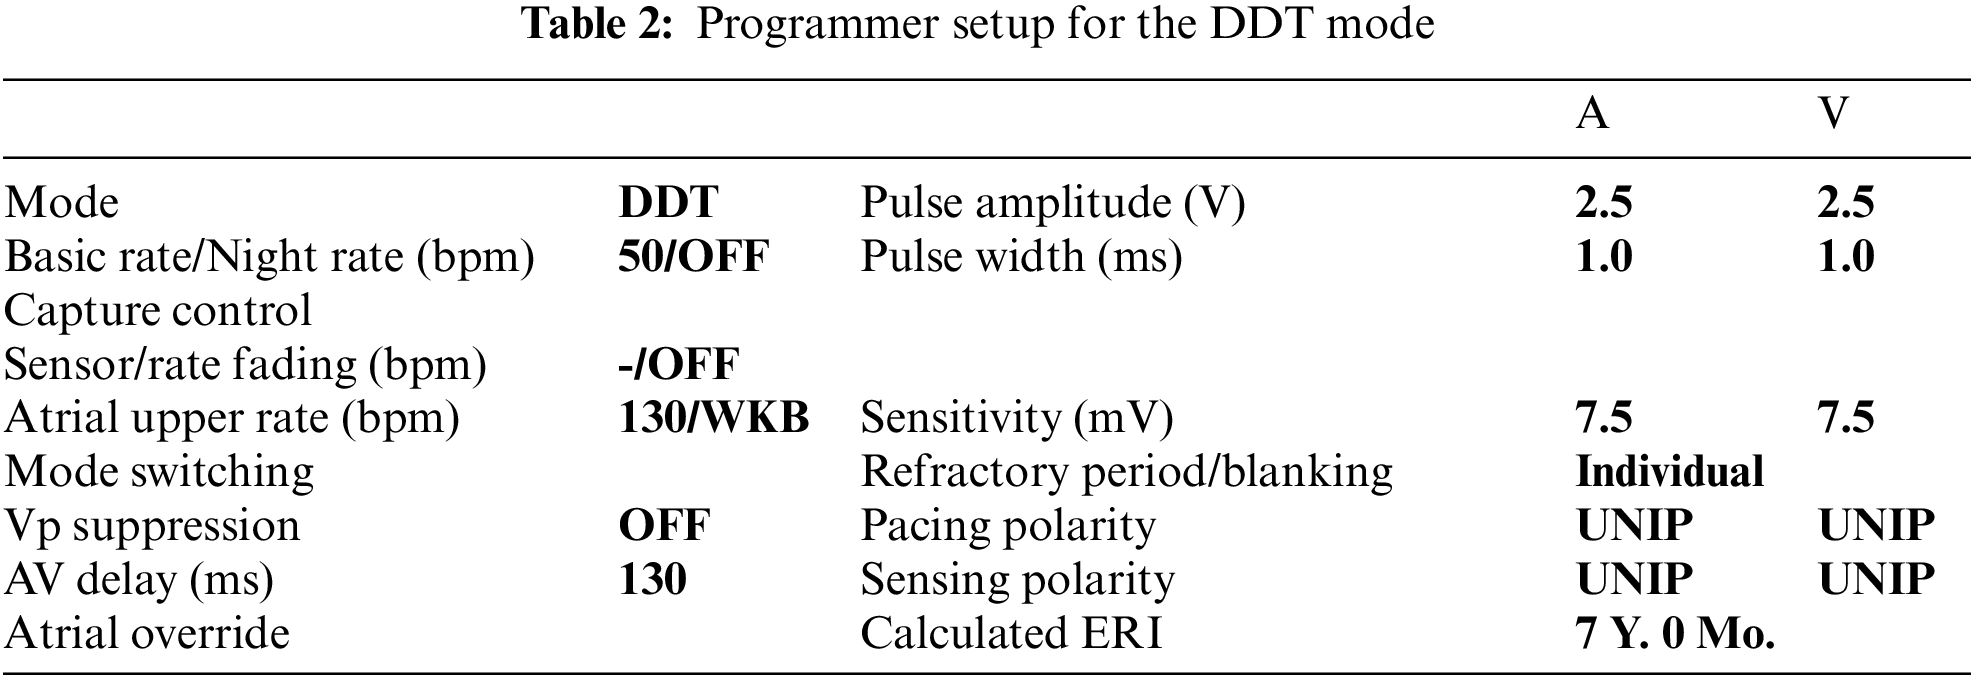
Figs. 12 and 14 shows the results for the DDT mode and the simulated AV block (Mobitz II). The programmer was set according to the values in Tab. 2: frequency an amplitude of stimulation impulses, AV delay and sensitivity parameters were set to the same values as in DDI mode see Tab. 1. Physiological values (60 bpm atrial and ventricular rate) were changed to AV block (80 bpm atrial rate and 40 bpm ventricular rate). As shown in Figs. 12, 14, the stimulator immediately adapted to the higher atrial rate, i.e., the impulses from the pacemaker, is synchronized with the generated atrial rate from the electrical model of the heart, correctly for the triggered DDT mode. The generated ventricular rate (40 bpm) was slower then programmed value (50 bpm) and has become controlled by the pacemaker with the atrial rate and AV delay according to the values in Tab. 2.
Examples of the system behavior for two types of stimulation modes and two types of disorders demonstrate that the system is functioning correctly. The paced and sensed signals were correctly visualized in both LabVIEW and programmer applications as well as the evaluated values of amplitude and frequency for atrium and ventricle. The simulated disorders of the conduction system of the heart have tested the pacemaker response and its functionality.
The presented study has certain shortcomings. Our cardiac model was limited to generate electrical signals only from two cavities, the right atrium, and the left ventricle, respectively. This was due to hardware limits of the used measuring card. Moreover, the used algorithm could be further developed for determining the AV delay of the stimulation pulses.
This paper presented a novel independent system for testing the individual parameters of pacemakers. The proposed testing system for cardiac pacemakers can be applied in the clinical area for testing all types of PCM regardless of its manufacturer. The application can be also used in teaching and research, to demonstrate the existing principles, but also for the validation of new algorithms for artificial cardiac stimulation. Its advantage is modularity and possibility of modification and extension for testing and developing new PCM, ICD and CRT instruments. The developed system allows scientists to test the PCM almost in all modes except the DDD mode. The LabVIEW application provides all necessary information about the electrical heart model and the pacemaker function and can fully replace the programmer visualization software. The presented study has certain limitation that could be investigated further. The electrical model of the heart could be extended with simulation of electrical activity from the left ventricle, in order to test the biventricular CRT instruments. The described prototype still has a deficiency in setting of the generated pulse amplitude. The lowest adjustable value of 2.5 mV does not correspond to the physiological values, especially for the atrium, where the amplitude should reach tenths of millivolts. Setting a lower value could be solved by using circuits with a controlled current source, which should reach lower output noise. This drawback is caused by the used algorithms, which require user-selectable initialization of the stimulation mode (triggering or inhibition). For the dual mode, the algorithms should be extended with automatic stimulation mode selection. The developed software can be further extended by addition of a time-cursor and AV delay indicator. This method is a promising for further robust testing of larger PM pacing modes using the automatic selecting of the stimulator mode, which would allow to test DDD mode of stimulators in the future.
Funding Statement: The work and the contributions were supported by the project SV4502261/SP2022/ 98 ‘Biomedical Engineering systems XVIII’.
Conflicts of Interest: The authors declare that they have no conflicts of interest to report regarding the present study.
References
1. H. Li and P. Boulanger, “A survey of heart anomaly detection using ambulatory electrocardiogram (ECG),” Sensors, vol. 20, no. 5, pp. 1461, 2020. [Google Scholar]
2. B. Rim, N. J. Sung, S. Min and M. Hong, “Deep learning in physiological signal data: A survey,” Sensors, vol. 20, no. 4, pp. 969, 2020. [Google Scholar]
3. C. A. Millán, N. A. Girón and D. M. Lopez. “Analysis of relevant features from photoplethysmographic signals for atrial fibrillation classification,” International Journal of Enviromental Research and Public Health, vol. 17, no. 2, pp. 498, 2019. [Google Scholar]
4. T. H. N. Le, T. M. Le, T. Q. Le and V. V. Toi, “Feature extraction techniques for automatic detection of some specific cardiovascular diseases using ECG: A review and evaluation study,” in 7th International Conference on the Development of Biomedical Engineering in Vietnam (BME7), 1st Ed., vol. 69. Fargo, USA: IFMBE, pp. 543–549, 2019. [Google Scholar]
5. L. Bacharova, “Missing link between molecular aspects of ventricular arrhythmias and QRS complex morphology in left ventricular hypertrophy,” International Journal of Molecular Sciences, vol. 21, no. 1, pp. 48, 2020. [Google Scholar]
6. D. C. Fitri, N. Nuryani and A. S. Nugraha, “A review of methods for myocardial infarction detection using of electrocardiographic features,” AIP Conference Proceedings, vol. 1364, no. 1, pp. 020098, 2019. [Google Scholar]
7. P. A. Budiman, T. Tresnawati, A. T. Alamsyah and K. Riandini, “Study for integration of multi modal biometric personal identification using heart rate variability (HRV) parameter,” Journal of Physics: Conference Series, vol. 1364, pp. 012074, 2019. [Google Scholar]
8. J. Tejedor, C. A. García, D. G. Márquez, R. Raya and A. Otero, “Multiple physiological signals fusion techniques for improving heartbeat detection: A review,” Sensors Institute, vol. 19, no. 21, pp. 4708, 2019. [Google Scholar]
9. A. Borde, G. Kolokolnikov and V. Skuratov, “Development of neural network-based approach for QRS segmentation,” in 2019 25th Conf. of Open Innovations Association (FRUCT), Helsinki, Finland, pp. 77–84, 2019. [Google Scholar]
10. H. G. Mond and H. M. Haqqani, “The footprints of electrocardiographic interference: Fact or artefact,” Heart, Lung and Circtulation, vol. 28, no. 10, pp. 1472–1483, 2019. [Google Scholar]
11. O. Anton, R. Fernandez, E. R. Morales, R. A. Espinosa, H. Jordan et al., “Heart rate monitoring in newborn babies: A systematic review,” Karger, vol. 116, no. 3, pp. 199–210, 2019. [Google Scholar]
12. F. M. M. Meseguer, F. J. G. Blanes, M. E. S. Alcaraz, J. R. G. Blanes, J. M. Sánchez et al., “Electrocardiographic fragmented activity (IPhysiological meaning of multivariate signal decompositions,” Multidisciplinary Digital Publishing Institute, vol. 9, no. 17, pp. 3566, 2019. [Google Scholar]
13. V. Jahmunah, S. L. Oh, J. K. E. Wei, E. J. Ciaccio, K. Chua et al., “Computer-aided diagnosis of congestive heart failure using ECG signals – A review,” Physica Medicat, vol. 62, pp. 95–104. 2019. [Google Scholar]
14. M. Padeletti, G. Bagliani, R. D. Ponti, F. M. Leonelli and E. T. Locati, “Surface electrocardiogram recording,” Cardiac Electrophysiology Clinics, vol. 11, no. 2, pp. 189–201, 2019. [Google Scholar]
15. M. Z. Baig and M. Kavakli, “A survey on psychophysiological analysis & measurement methods in multimodal systems,” Multimodal Technologies and Interaction, vol. 3, no. 2, pp. 37, 2019. [Google Scholar]
16. A. Tiwari and T. H. Falk, “Lossless electrocardiogram signal compression: A review of existing methods,” Science Direct, vol. 51, pp. 338–346, 2019. [Google Scholar]
17. G. Acar, O. Ozturk, A. J. Golparvar, T. A. Elboshra, K. Böhringer et al., “Wearable and flexible textile electrodes for biopotential signal monitoring: A review,” Electronics, vol. 8, no. 5, pp. 479, 2019. [Google Scholar]
18. P. Kudrna and M. Rožánek, “The influence of an orifice plates as a flow sensors on the removal of carbon dioxide in high frequency oscillatory and jet ventilation,” in Simona Vlad and Nicolae Marius Roman, Editors, International Conference on Advancements of Medicine and Health Care Through Technology, IFMBE Proceedings, Springer Nature, 1st Ed., vol. 59, Prague, Kladno, Czech republic, pp. 137–140, 2016. [Google Scholar]
19. S. Kiranyaz, T. Ince, O. Abdeljaber, O. Avci and M. Gabbouj, “1-d convolutional neural networks for signal processing applications,” in ICASSP 20–9–2019 IEEE Int. Conf. on Acoustics, Speech and Signal Processing (ICASSP), Brighton, UK, pp. 8360–8364, 2019. [Google Scholar]
20. S. Ziani and Y. E. Hassouani, “Fetal-maternal electrocardiograms mixtures characterization based on time analysis,” in 2019 5th Int. Conf. on Optimization and Applications (ICOA), Kenitra, Morocco, pp. 1–5, 2019. [Google Scholar]
21. G. M. Lozito, M. Schmid, S. Conforto, F. R. Fulginei and D. Bibbo, “A neural network embedded system for real-time estimation of muscle forces,” in Int. Conf. on Computational Science, vol. 51, pp. 60–69, 2015. [Google Scholar]
22. M. Elgendi and C. Menon, “Assessing anxiety disorders using wearable devices: Challenges and future directions,” Brain Sciences, vol. 9, no. 3, pp. 50, 2019. [Google Scholar]
23. K. S. Park and S. H. Choi, “Smart technologies toward sleep monitoring at home,” Biomedical Engineering Letters, vol. 9, no. 1, pp. 73–85, 2019. [Google Scholar]
24. M. N. Teferra, J. S. Ramos, C. Kourbelis, P. Newman, A. Fleury et al., “Electronic textile-based electrocardiogram monitoring in cardiac patients: A scoping review,” JBI Database of Systematic Reviews and Implementation Reports, vol. 17, no. 10, pp. 1958–1998, 2019. [Google Scholar]
25. H. Smulyan, “The computerized ECG: Friend and foe,” The American Journal of Medicine, vol. 132, no. 2, pp. 153–160, 2019. [Google Scholar]
26. D. Bibbo, M. Schmid, A. Scorza, S. A. Sciuto and S. Conforto, “A novel approach to improve the technical maintenance of biomedical equipment,” in Springer International Publishing. Series Title: IFMBE Proc., Springer Verlag, 1st Ed., vol. 57, Rome, Italy, pp. 1034–1039, 2016. [Google Scholar]
27. X. R. Zhang, X. Sun, X. M. Sun, W. Sun and S. K. Jh, “Robust reversible audio watermarking scheme for telemedicine and privacy protecti”n,” Computers, Materials & Continua, vol. 71, no. 2, pp. 3035–3050, 2022. [Google Scholar]
28. T. Lindow, Y. Birnbaum, K. Nikus, A. Maan, U. Ekelund et al., “Why complicate an important task? an orderly display of the limb leads in the 12-lead electrocardiogram and its implications for recognition of acute coronary syndrome,” BMC Cardiovascular Disorders, vol. 19, no. 1, pp. 13, 2019. [Google Scholar]
29. R. B. Berry, S. Ryals, M. Dibra and M. H. Wagner, “Use of a transformed ECG signal to detect respiratory effort during apnea,” Journal of Clinical Sleep Medicine, vol. 15, no. 7, pp. 991–998, 2019. [Google Scholar]
30. S. Subramani, L. Arora, S. Krishnan, S. Hanada, A. Sharma et al., “Analysis of conduction abnormalities and permanent pacemaker implantation after transcatheter aortic valve replacement,” Journal of Cardiothoracic and Vascular Anesthesia, vol. 34, no. 4, pp. 1082–1093, 2020. [Google Scholar]
31. P. Tran and P. Banerjee, “Iatrogenic decompensated heart failure,” Current Heart Failure Reports, vol. 17, no. 2, pp. 21–27, 2020. [Google Scholar]
32. E. Demerouti, G. Stavridis, G. Pavlides and G. Karatasakis, “Myocardial infarction complicating blunt chest trauma: Case report and literature review,” Sage Journals, vol. 22, no. 2, pp. 159–162, 2020. [Google Scholar]
33. P. Palmisano, D. Melissano, G. Zanotto, G. B. Perego, T. Toselli et al., “Change in the use of remote monitoring of cardiac implantable electronic devices in Italian clinical practice over a 5-year period: Results of two surveys promoted by the AIAC (Italian association of arrhythmology and cardiac pacing),” Journal of Cardiovascular Medicine, vol. 21, no. 4, pp. 305–314, 2020. [Google Scholar]
34. J. H. García, D. N. Carrillo and E. O. Piñero, “Alterations of circadian rhythms and their impact on obesity, metabolic syndrome and cardiovascular diseases,” Critical Reviews in Food Science and Nutrition, vol. 60, no. 6, pp. 1038–1047, 2019. [Google Scholar]
35. M. Rozanek, P. Kudrna and K. Valkova, “Variability of vital signs in simulations with mannequin in education of bioengineers,” in 2017 EHealth and Bioengineering Conf. (EHB), Sinaia, Romania, pp. 611–614, 2017. [Google Scholar]
36. R. M. John and D. L. Stern, “Use of implantable electronic devices in patienithith cardiac amyloidosis,” Canadian Journal of Cardiology, vol. 36, no. 3, pp. 408–415, 2020. [Google Scholar]
37. J. C. Edelmann, D. Mair, D. Ziesel, M. Burtscher and T. Ussmueller, “An ECG simulator with a novel ECG profile for physiological signals,” Journal of Medical Engineering and Technology, vol. 42, no. 7, pp. 501–509, 2018. [Google Scholar]
38. D. Bibbo, J. Kijonka, P. Kudrna, M. Penhaker, P. Vavra et al., “Design and development of a novel invasive blood pressure simulator for patient’s monitor testing,” Sensors, vol. 20, no. 1, pp. 259, 2020. [Google Scholar]
39. A. Mahdi, G. D. Clifford and S. J. Payne, “A model for generating synthetic arterial blood pressure,” Institute of Physics and Engineering in Medicine, vol. 38, no. 3, pp. 477–488, 2017. [Google Scholar]
40. N. J. Raden, K. H. Wolf and M. Marschollek, “Signal detection accuracy of digital accelerometers for ballistocardiographic propose,” in 2017 Computing in Cardiology Conf., Rennes, France, pp. 1–4, 2017. [Google Scholar]
41. F. Shayegh, S. Sadri, R. Amirfattnahi and K. A. Asl, “Proposing a two level stochastic model for epileptic seizure genesis,” Journal of Computational Neuroscience, vol. 36, no. 1, pp. 39–53, 2014. [Google Scholar]
42. M. Marsousi, J. Alirezaie and K. Umapathy, “A flexible approach for simulating physiological signals,” vol. 34, no. 6, pp. 695–712, 2013. [Google Scholar]
43. J. Kubicek, M. Penhaker and R. Kahankova, “Design of a synthetic ECG signal based on the Fourier series,” in 2014 Int. Conf. on Advances in Computing, Communications and Informatics (ICACCI), Delhi, India, pp. 1881–1885, 2014. [Google Scholar]
44. O. Bardhi and B. G. Zapirain, “Machine learning techniques applied to electronic healthcare records to predict cancer patient survivability,” Computers, Materials and Continua, vol. 68, no. 2, pp. 1595–1613, 2021. [Google Scholar]
45. X. R. Zhang, W. F. Zhang, W. Sun, X. M. Sun and S. K. Jha, “A robust 3-D medical watermarking based on wavelet transform for data protection,” Computer Systems Science & Engineering, vol. 41, no. 3, pp. 1043–1056, 2022. [Google Scholar]
46. T. M. Nguyen and P. Wira, “A linear multi-layer perceptron for identifying harmonic contents of biomedical signals,” in Artificial Intelligence Applications and Innovations, Mulhouse, France, vol. 412, pp. 262–271, 2013. [Google Scholar]
47. X. B. Fan, B. Zhao and B. X. Fan, “Wavelet decomposition and nonlinear prediction of nonstationary vibration signals,” Noise & Vibration Worldwide vol. 51, no. 3, pp. 52–59, 2020. [Google Scholar]
48. M. McConnell, B. Schwerin, S. So and B. Richards, “RR-APET - heart rate variability analysis software,” Computer Methods and Programs in Biomedicine, vol. 185, pp. 105127, 2020. [Google Scholar]
49. C. Tan, L. Zhang and T. Qian, “A new supervised learning approach: Statistical adaptive Fourier decomposition (SAFD),” Neural Information Processing, Macao, China, vol. 1143, pp. 397–404, 2019. [Google Scholar]
50. P. Kovács, “Rational variable projection methods in ECG signal processing,” Computer Aided Systems Theory – EUROCAST 2017, Springer Verlag, 1st Ed., vol. 10672. Budapest, Hungary, pp. 196–203, 2018. [Google Scholar]
51. P. Kundu and R. Gupta, “Electrocardiogram synthesis using Gaussian and Fourier models,” in 2015 IEEE Int. Conf. on Research in Computational Intelligence and Communication Networks (ICRCICN), Kolkata, India, pp. 312–317, 2015. [Google Scholar]
52. J. Wang, X. Sun, S. Nahavandi, A. Kouzani, Y. Wu et al., “Multichannel biomedical time series clustering via hierarchical probabilistic latent semantic analysis,” Computer Methods and Programs in Biomedicine, vol. 117, no. 2, pp. 238–246, 2014. [Google Scholar]
53. Y. Jin, C. Qin, Y. Huang, W. Zhao and C. Liu, “Multi-domain modeling of atrial fibrillation detection with twin attentional convolutional long short-term memory neural networks,” Knowledge-Based Systems, vol. 193, pp. 105460, 2020. [Google Scholar]
54. K. K. Patro, S. P. R. Reddi, S. K. E. Khalelulla, P. R. Kumar and K. Shankar, “ECG data optimization for biometric human recognition using statistical distributed machine learning algorithm,” The Journal of Supercomputing, vol. 76, no. 2, pp. 858–875, 2020. [Google Scholar]
55. S. Yang, W. S. W. Zaki, S. P. Morgan, S. Y. Cho, R. Correia et al., “Blood pressure estimation with complexity features from electrocardiogram and photoplethysmogram signals,” Optical and Quantum Electronics, vol. 52, no. 3, pp. 135, 2020. [Google Scholar]
56. C. T. Bui, P. K. Huynh, H. T. Phan, T. Q. Le and V. V. Toi, “Developing neural-fuzzy-based unscented kalman filter algorithm for atrial fibrillation onset prediction,” in Vo Van Toi, Trung Quoc Le, Hoan Thanh Ngo, and Thi-Hiep Nguyen, Editors, 7th Int. Conf. on the Development of Biomedical Engineering in Vietnam (BME7), Ho Chi Minh City, Vietnam, Fargo, USA, vol. 69, pp. 119–125, 2018. [Google Scholar]
57. S. K. Pandey and R. R. Janghel, “Automatic detection of arrhythmia from imbalanced ECG database using CNN model with SMOTE,” Australasian Physical and Engineering Sciences in Medicine, vol. 42, no. 4, pp. 1129–1139, 2019. [Google Scholar]
58. A. M. Shaker, M. Tantawi, H. A. Shedeed and M. F. Tolba, “Generalization of convolutional neural networks for ECG classification using generative adversarial networks,” IEEE, vol. 8, pp. 35592–35605, 2020. [Google Scholar]
59. J. Wang, R. Li, R. Li, K. Li, H. Zeng et al., “Adversarial De-noising of electrocardiogram,” Adversarial de-Noising of Electrogram, vol. 349, pp. 212–224, 2019. [Google Scholar]
60. C. Y. Banjo and O. A. Ugot, “A review of generative adversarial networks and its application in cybersecurity,” Artificial Intelligence Review, vol. 53, no. 3, pp. 1721–1736, 2020. [Google Scholar]
61. F. B. Aissa, M. Mejdoub and M. Zaied , “A survey on generative adversarial networks and their variants methods,” in Twelfth Int. Conf. on Machine Vision (ICMV 2019), Amsterdam, Netherlands, vol. 11433 pp. 130, 2020. [Google Scholar]
62. B. Yu, Y. Wang, L. Wang, D. Shen, and L. Zhou, “Medical image synthesis via deep learning,” In Gobert Lee and Hiroshi Fujita, Editors, Deep Learning in Medical Image Analysis, vol. 1213, pp. 23–44, 2020. [Google Scholar]
63. F. A. Alzahrani, M. Ahmad, M. Nadeem, R. Kumar, R. A. Khan, “Integrity assessment of medical devices for improving hospital services,” Tech Science Press, vol. 67, no. 3, pp. 3619–3633, 2020. [Google Scholar]
64. K. A. Bhavsar, J. Singla, Y. D. Al-Otaibi, O. Y. Song, Y. B. Zikria et al., “Medical diagnosis using machine learning: A statistical review,” Computers, Materials and Continua, vol. 67, no. 1, pp. 107–125, 2021. [Google Scholar]
65. Y. Chen, X. Qin, L. Zhang, B. Yi, “A novel method of heart failure prediction based on DPCNN-XGBOOST model,” KMS Chongqing Institute of Green and Intelligent Technology, vol. 65, no. 1, pp. 495–510, 2020. [Google Scholar]
66. M. Elhoseny, M. A. Mohammed, S. A. Mostafa, K. H. Abdulkareem, M. S. Maashi et al., “A new multi-agent feature wrapper machine learning approach for heart disease diagnosis,” Computers, Materials & Continua, vol. 67, no. 1, pp. 51–71, 2021. [Google Scholar]
67. Z. A. A. Alyasseri, O. A. Alomari, J. P. Papa, M. A. AI-Betar, K. H. Abdulkareem et al., “EEG channel selection based user identification via improved flower pollination algorithm,” Sensors, vol. 22, no. 6, pp. 2092, 2022. [Google Scholar]
68. Z. A. A. Alyasseri, A. T. Khader, M. A. AI-Betar, X. S. Yang, M. A. Mohammed et al., “Multi-objective flower pollination algorithm: A new technique for EEG signal denoising,” Neural Comput & Applic, pp. 1–20, 2022. [Google Scholar]
69. Z. A. A. Alyasseri, O. A. Alomari, M. A. Al-Betar, M. A. Awadallah, K. Hameed Abdulkareem et al., “EEG channel selection using multiobjective cuckoo search for person identification as protection system in healthcare applications,” Computational Intelligence and Neuroscience, vol. 2022, pp. 1–18, 2022. [Google Scholar]
70. J. Prasanna, M. S. P. Subathra, M. A. Mohammed, M. S. Maashi, B. G. Zapirain et al., “Detection of focal and non-focal electroencephalogram signals using fast walsh-hadamard transform and artificial neural network,” Sensors, vol. 20, no. 17, pp. 4952, 2020. [Google Scholar]
71. J. Prasanna, M. S. P. Subathra, M. A. Mohammed, R. Damaševičius, N. J. Sairamya et al., “Automated epileptic seizure detection in pediatric subjects of CHB-MIT EEG database—A survey,” JPM, vol. 11, no. 10, pp. 1028, 2021. [Google Scholar]
 | This work is licensed under a Creative Commons Attribution 4.0 International License, which permits unrestricted use, distribution, and reproduction in any medium, provided the original work is properly cited. |