| Computers, Materials & Continua DOI:10.32604/cmc.2022.028801 | |
| Article |
Apex Frame Spotting Using Attention Networks for Micro-Expression Recognition System
1Department of Electrical, Electronic and Systems Engineering, Universiti Kebangsaan Malaysia, Bangi, 43600, Malaysia
2Department of Electrical, Electronic and Systems Engineering, Universiti Kebangsaan Malaysia, Bangi, 43600, Malaysia
3Faculty of Mathematics and Natural Science, Universitas Indonesia, Depok, 16424, Indonesia
4Faculty of Humanities, Management and Science, Universiti Putra Malaysia Bintulu Campus, Bintulu, 97008, Malaysia
*Corresponding Author: Mohd Asyraf Zulkifley. Email: asyraf.zulkifley@ukm.edu.my
Received: 11 February 2022; Accepted: 18 May 2022
Abstract: Micro-expression is manifested through subtle and brief facial movements that relay the genuine person’s hidden emotion. In a sequence of videos, there is a frame that captures the maximum facial differences, which is called the apex frame. Therefore, apex frame spotting is a crucial sub-module in a micro-expression recognition system. However, this spotting task is very challenging due to the characteristics of micro-expression that occurs in a short duration with low-intensity muscle movements. Moreover, most of the existing automated works face difficulties in differentiating micro-expressions from other facial movements. Therefore, this paper presents a deep learning model with an attention mechanism to spot the micro-expression apex frame from optical flow images. The attention mechanism is embedded into the model so that more weights can be allocated to the regions that manifest the facial movements with higher intensity. The method proposed in this paper has been tested and verified on two spontaneous micro-expression databases, namely Spontaneous Micro-facial Movement (SAMM) andChinese Academy of Sciences Micro-expression (CASME) II databases. The proposed system performance is evaluated by using the Mean Absolute Error (MAE) metric that measures the distance between the predicted apex frame and the ground truth label. The best MAE of 14.90 was obtained when a combination of five convolutional layers, local response normalization, and attention mechanism is used to model the apex frame spotting. Even with limited datasets, the results have proven that the attention mechanism has better emphasized the regions where the facial movements likely to occur and hence, improves the spotting performance.
Keywords: Deep learning; convolutional neural networks; emotion recognition
Emotions are an incredibly important aspect of human life. For the past several years, many basic research on emotions has led to several discoveries that are important to real-world applications. One of the most important discoveries in this field is the existence of micro-expressions (MEs) that portray real emotion, which is a hot topic in psychology. In a world where humans are interacting with each other formally or casually, many people choose to conceal their inner genuine feelings and disguise them with neutral faces by suppressing their real expressions due to many reasons. On other hand, MEs are hard to forge and suppress without extensive training because of the difficulty in invoking this expression willingly [1]. Hence, the emotion could only be recognized by the physiological characteristics that have been displayed by the subject. Normally, MEs manifest between two neutral expressions, whereby it happens because of failure in restraining the movement of facial muscles at a particular moment. After that slip occurrence of ME, most of the subjects will try to manifest the neutral expression again. The facial movement of MEs can be described in four general phases: neutral, onset, apex, and offset. According to [2], the onset phase is the moment when a muscular contraction begins and the intensity of facial changes starts to grow stronger; the apex phase is the instance when the facial movement reaches the highest intensity relative to the neutral phase; and the offset phase is the moment when there are little or no facial muscles activation, as such the face looks relax again [3]. Usually, a facial motion shifts through the sequence of neutral-onset-apex-offset-neutral. Fig. 1 shows the order of the motions of facial MEs.
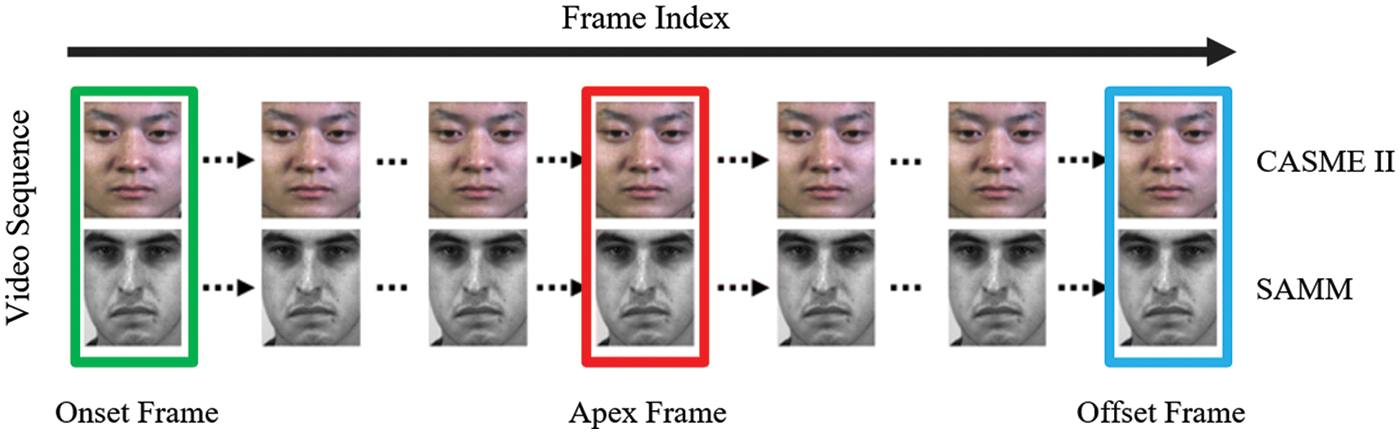
Figure 1: Illustration of the order of onset, apex and offset frames in a video sequence fromChinese Academy of Sciences Micro-expression (CASME) II and Spontaneous Micro-facial Movement (SAMM)
Hence, to uncover people’s real emotions or hidden intents automatically, the recognition system generally follows a two-step procedure. The first step is to pinpoint the moment when the ME happens with the highest intensity and the second step is to determine which class of emotion the ME belongs to. The first step is known as ME apex spotting which is the primary step of the ME recognition research, which is the primary focus of this paper. Nonetheless, the task of apex spotting is critical for successful ME recognition, yet it is a challenging task. Unlike macro-expressions which are relatively easy to spot, MEs are expressions that manifest on and off in less than 0.5 s, sometimes as fast as 0.04 s [4]. They are easily overlooked due to their rapid appearance and disappearance. This fast emotion flickering also supports the fact that they merely happen in a few frames of normal camera videos. Moreover, the emotion is manifested in low facial muscle movements intensity, whereby not all facial muscles will react to a particular emotion [5]. As a result, it is difficult to precisely determine the exact moment at which a ME occurred from a video sequence just based on naked eyes observation. Besides, it is evident that the precision of apex spotting by human beings is very low in general, except for professionals that have been trained for a prolonged time. During the development of Chinese Academy of Sciences Micro-expression databases [6,7], the apex frame for each video has been labeled manually by the psychology experts, which serves as the ground truth for ME spotting research. Nevertheless, the labeling work is a time-consuming and tiresome process, where at least two coders have to work separately to go through the video sequences, frame by frame. Due to the possibility of imprecise labeling and inconsistent decision by different coders, an automated ME spotting system, which is faster and more consistent is essential to detect genuine human emotion.
Along with the rapid advancement of visual sensors quality, the improvement in the automated analytic algorithm has also followed a new direction in designing a ME spotting system. However, the requirement of having enough labeled and effective training data itself is a challenging hurdle in developing any automatic ME spotting system. Currently, there are numerous publicly accessible ME databases that cover both posed and spontaneous ME databases. For posed MEs, facial expressions are purposely elicited and they are irrelevant to the present true emotion of the subjects. Meanwhile, spontaneous MEs are the facial expressions induced by the subjects are genuine and they have to put in the effort to suppress their true emotions [8]. According to [9], spontaneous MEs are much more difficult for spotting than posed MEs, because a ME is considered involuntary and difficult to disguise. With that being said, posed ME databases are not really helpful for the research of ME spotting. Henceforth, it is essential to develop an automated ME spotting system that fully utilizes all spontaneous ME data available to produce a more accurate system. However, the amount of spontaneous ME databases available is still relatively low given that most of the ME research that is based on computer vision has only started to attract interest in the past few years.
Although the study of ME apex spotting has significant importance, unfortunately, only a few studies have focused on automatic micro-expressions apex spotting [10]. The main idea in most methods for ME spotting is to compare the feature differences between the first frame and the other frames in a sequence of videos. Feature differences allow consistent comparisons between frames over a time window of the size of an ME. The algorithm of feature difference methods considers the temporal characteristic differences of ME, whereby the search window size depends on the average time interval of the occurrence of ME. However, the motions captured between frames are not necessarily the ME movements. This is because not all muscle movements on the face make the same contribution to ME spotting, as some of the motions on certain facial regions do not even contain any emotional information. Due to that, the feature difference technique is ineffective in differentiating ME from other facial movements. With that being said, the ability to distinguish MEs from other movements persists to be an open challenge. It is vital to search for a method that could decrease the recognition sensitivity to irrelevant facial movements. To improve the existing ME spotting methods, this paper proposes an optimal setup for the deep learning network for apex frame spotting. Our main novelty is the optimal implementation of the attention mechanism to a compact network. The attention mechanism is embedded into the network with the goal of improving the performance of the model learning process by concentrating on key localized features of the optical flow to spot the apex frame from onset-offset temporal sequences. For the secondary novelties, the compact network that utilizes just five convolutional layers with Local Response Normalization (LRN) has been tuned to improve the performance of the ME spotting task.
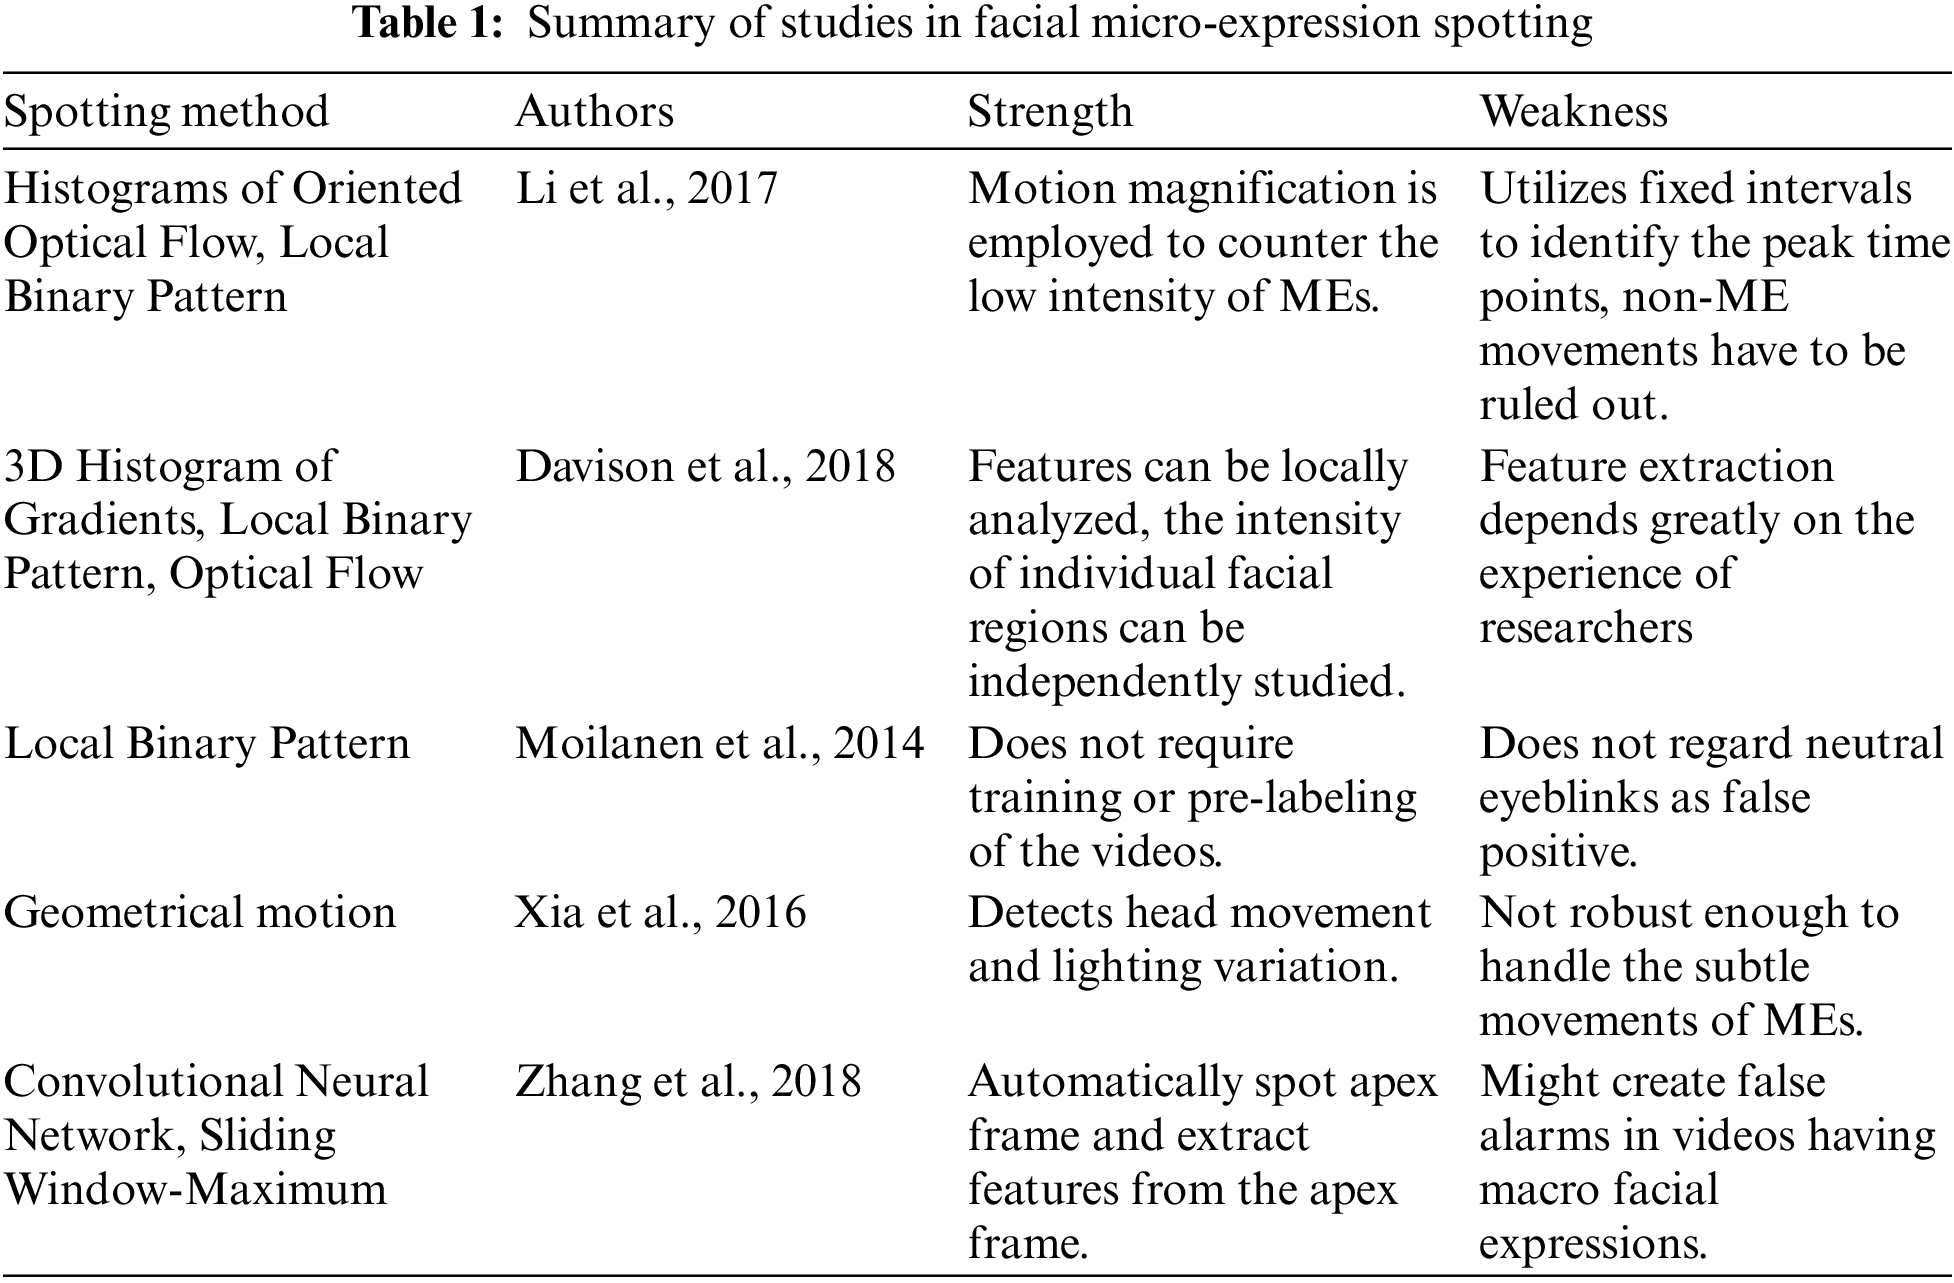
Whenever ME analysis is implemented in the actual application, it requires the detection of temporal locations of ME events before proceeding into the recognition phase. Therefore, ME spotting is indeed an essential module for a fully automated ME analysis system. Even though much research has been done, there is still no fully automatic ME analyzing system that has been constructed on a pragmatic level. This is due to the fact that most of the ME research only concentrates on the recognition part, while casting aside the spotting task. This section briefly summarizes the existing study on ME spotting. Tab. 1 summarizes some previous studies.
There are several researches that have focused on ME spotting using information from the whole video clip sequences [11–14]. However, a study in [15] also argued that using the onset-offset temporal sequences is more effective than utilizing the whole video sequence for recognizing the emotion. There are few researchers who have opted to spot the apex frame first instead of spotting the facial micro-movements because an apex frame is the most expressive frame in a short video that contributes the majority of information [16–18]. When apex frame is used in MEs recognition, it could reduce the possibility of information redundancy. Besides that, the efficiency of apex frame spotting can be determined with the Mean Absolute Error performance metric [16]. According to [19], MAE is the average of absolute differences between the predicted frame and the ground truth. Automated apex frame spotting algorithm generally depends on the features extracted from each frame in the raw video. Typically, features that are popularly used in ME spotting are hand-crafted features and the feature selection depends greatly on the skill of researchers. Meanwhile, there are diverse feature descriptor methods have been used in the previous works, to name a few: Local Binary Pattern (LBP) [20], Histogram of Gradient (HOG) [21], optical flow [22,23], integral projection [24], Riesz pyramid [25], frequency domain [10], etc. In a certain work [26], the sensor readings are directly passed to the machine learning module without any optimization in selecting the features. In [27], an optical flow was used as the basis to calculate the optical strain magnitude used for ME spotting. On the other hand, the work in [28] used 3D gradient histograms as the feature of interest to detect the onset, apex, and offset frames. This approach has a high potential to be expanded for future development of ME spotting as they have been tested on spontaneous ME data, which are a good representation of naturally stimulated (spontaneous) facial MEs.
The method proposed in [17] used Constraint Local Model (CLM) and LBP as feature extractors for searching the apex frame from spontaneous ME video. The apex frame signifies the largest feature differences relative to the first frame or onset frame for a short video. Nevertheless, there are two demerits in their work, which are (a) low accuracy results as the average frame distance computed is not the absolute mean values, and; (b) only 20% of the video samples from the database are used to validate the method, therefore, the spotting approach proposed by them is inconclusive and not convincing. In [18], optical flow is used as the feature extractor to determine the apex frame from a short video configuration. This method may include frames with unrelated movements that take place before the onset frame and right after the offset frame. While, the work in [20] utilized an LBP histogram to extract temporal and spatial locations for spotting the apex frame based on the appearance features between the average frame and the current frame. As an extension, the method in [9] presented another method that is based on deep multi-task learning with Histograms of Oriented Optical Flow (HOOF) as the input feature for ME detection. Yet, they used Convolutional Neural Network (CNN) only to identify the location of the facial landmarks, which are then used to split the facial area into regions of interest (ROI). They have introduced an automatic ME analysis for a long video configuration, in which the apex frame was located by employing an optical strain feature extractor, after performing eye masking and ROI selection techniques. Nevertheless, even by a combination of pre-processing methods, the detected highest peak frame still contains movements that are irrelevant and unhelpful to recognize the ME.
Consequently, several subsequent works have proposed the implementation of machine learning as a robust tool to differentiate between ME and normal facial actions. The study conducted in [29] has initiated the first step of employing machine learning in ME spotting. They utilized Adaptive Boosting (Adaboost) to approximate the probability of successive frames belonging to an ME. Subsequently, random walk functions are used to enhance and incorporate the output from Adaboost to produce the final results. Other than that, method in [30] presented the use of a multi-scale and sliding-window-based approach to identify MEs. They have provided a normalized performance benchmark to measure the ME spotting capability. In this approach, ME spotting was treated as a binary classification problem based on a window sliding across positions and scales of a video sequence. However, the performance of these two studies [29,30] is not satisfying because of the outdated learning methods that are not robust enough to manage those subtle ME motions. Fortunately, the deep learning approach, which has been accurately proposed in various computer vision fields was proposed to overcome the previously mentioned shortcomings. Although the development of deep learning technology continues to bloom, there are only a few deep learning-based approaches have been devised for ME spotting. The first work that used the CNN model to detect the apex frame is proposed in [19]. In their work, they have classified first the neutral and apex frames, followed by merging the nearby detected samples by a feature engineering method. Nevertheless, this technique might accidentally create a deception when it is applied to a video that also includes macro facial expressions, whereby this technique was only trained as the single-image classifier. Aside from that, another deep learning-based method is proposed in [31] that merged the spatiotemporal features with a deep sequence model to calculate the apex score in a longer video configuration. In this work, a spatiotemporal feature, which can be used to distinguish MEs from amongst irrelevant movements was first obtained based on each video position. Then, a Long Short-term Memory (LSTM) network that correlates both the local and global features was used to make a prediction on the apex frame score of ME. Nonetheless, this methodology is only assessed on short clips of ME datasets.
To improve the existing ME spotting performance, this paper proposed an attention mechanism to a compact deep learning network. The architecture comprises of neurons along with the convolution and fully connected layers that are highly interconnected and are organized in a distributed way to learn from the provided input data. Generally, if a network consists of more than five layers, it can be considered as a deep network. Unlike conventional systems that employ handcrafted features, these deep neural network models learn the respective features in an end-to-end manner as such they can reveal the morphological patterns in a provided input image. This technique does not need any manual feature design or specialized skills to select the features for a particular problem. Since the apex frame contains the highest intensity of facial motion, it will be used to represent the emotion of the whole video based on extracted micro-expression. Based on the outline of the methodology in Fig. 2, the sample frames and the ground truth labeling are first obtained from the publicly available ME database. Then, the optical flow of all frames will be input to the network, which is then used to train the model to spot the apex frame through a supervised learning method. Based on Fig. 3 which compares the original image and the optical-flow image, it is evident that the optical flow features are better at expressing the movement of MEs. In the end, the trained model is used to predict the frame number that has the highest possibility to be the apex frame. This section describes in detail the research flow of the proposed apex frame spotting method. First, the two databases used in this study, CASME II and SAMM are discussed in detail in the next subsection. Then, the proposed optimized base CNN architecture that emphasizes on larger feature map sizes in the two early layers is detailed out, followed by an explanation of the proposed attention-mechanism module. The last subsection is dedicated to the performance metric used to measure the apex frame spotting, which can be categorized as a regression problem.
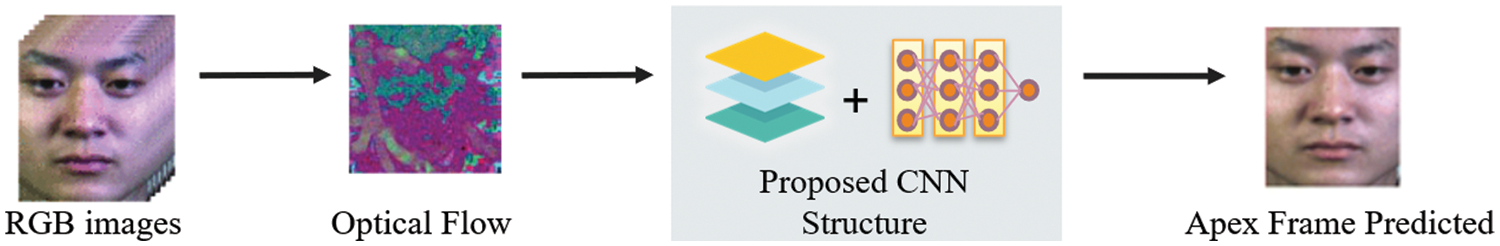
Figure 2: The proposed methodology outline
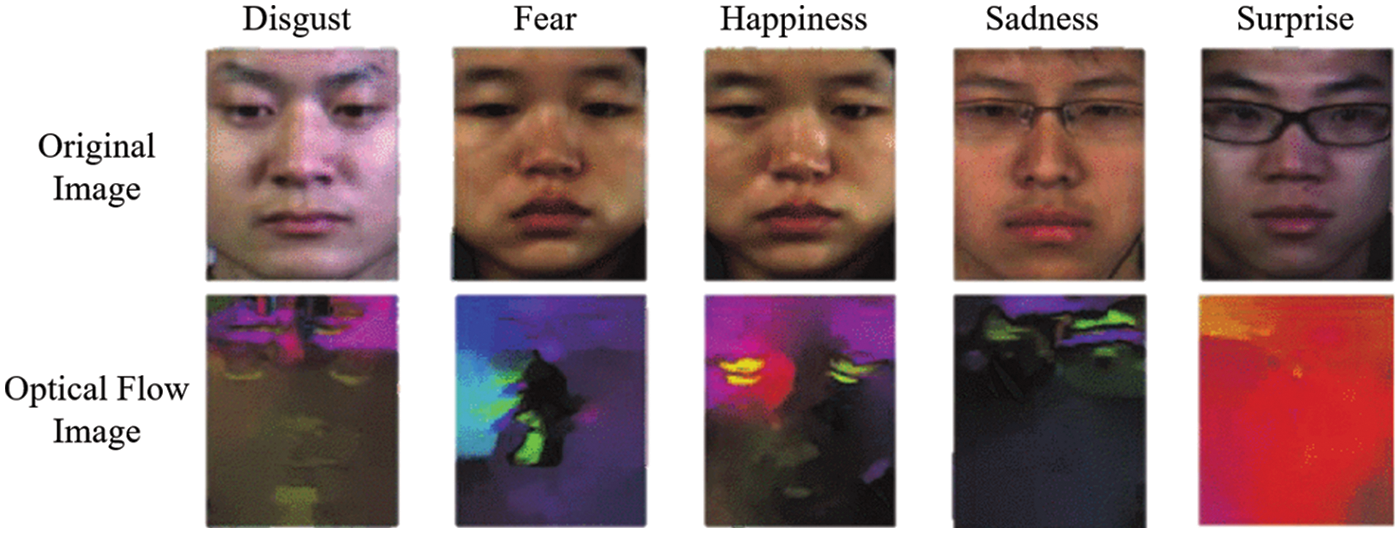
Figure 3: Optical flow maps of six micro-expressions from CASME II database
There are two recent spontaneous ME databases that are suitable for ME apex frame spotting. The ones used in this project are CASME II [7] and SAMM [32]. Due to their suitability, most works in the literature are also tested on these two spontaneous ME datasets. The CASME II database is actually one of the biggest and most broadly applied databases, and it is an upgraded version of the CASME dataset. In the CASME II dataset, there are 247 micro-expressions video samples obtained from 26 participants, which are all Chinese residents. The videos were filmed using a Point Grey GRAS-03K2C camera with a spatial resolution of 640 × 480 pixels and a frame rate of 200 frames per second (fps). The ground truths offered by this database consist of the onset, apex, and offset frame indexes. Each of the samples is assigned one of five ME labels involving Happiness, Disgust, Repression, Surprise, and Others. Each video clip is only comprised of one type of emotion; hence it is a one-to-one mapping between each video and a label. Some sample frames of the CASME II dataset are shown in Fig. 4.
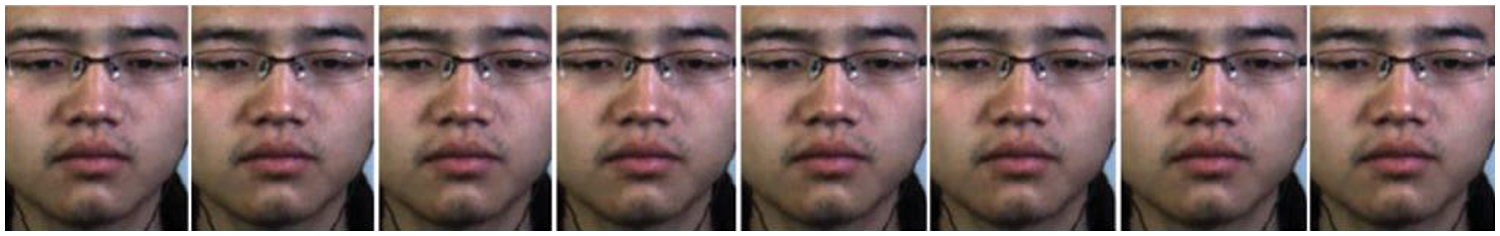
Figure 4: Sample frames from a Happiness sequence (Subject 6) in CASME II
For SAMM database, it comprises of a total of 32 participants, whereby each participant will have seven recorded videos. There are a total of 159 video sequences were collected from these subjects, whose ages are between 19 and 57. The imaging sensor used was a Basler Ace acA2000-340km, equipped with a grey-scale sensor. The ethnicities of the participants are 17 White British, 3 Chinese, 2 Malay, 2 Arab, and one each of African, White British/Arab, Afro-Caribbean, Spanish, Nepalese, Black British, Pakistani, and Indian. For the gender-wise, there are uniformly distributed with 16 male and 16 female participants. The index for onset, apex, and offset frames for each were also provided. The intended emotion categories involved in SAMM are Contempt, Disgust, Anger, Fear, Sadness, Happiness, and Surprise. A few sample frames from the SAMM dataset are shown in Fig. 5.
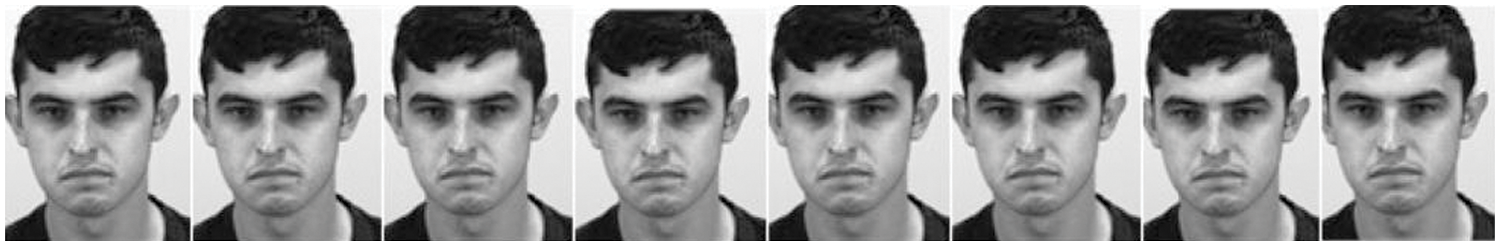
Figure 5: Sample frames from a sequence (Subject 6) in SAMM
The summarized basic differences between CASME II and SAMM databases are presented in Tab. 2. Other than the basic differences listed in Tab. 2, these two datasets have their own challenges and disadvantages which prompts this work to combine both instead of using either one solely. This is due to the influence of factors that will affect the practical effectiveness of the deep learning model such as the initialization methods and pre-trained configurations and imbalance distribution among the emotion categories. For CASME II, the dataset includes only participants from one ethnicity that follows the same categorization scheme as its predecessor version (CASME). Along with only using one ethnicity, this dataset involved only young participants who are mostly students with a mean age of 22.03 years. Thus, these factors might confine the model to learn similar-looking participants instead of features from diverse ages and races. On top of CASME II’s diversity limitation, the assignment of emotion label to the videos are based on self-reporting that is judged by each participant. The participants will first experience the stimulus, which is then asked to jot down their emotion felt after each stimulus.
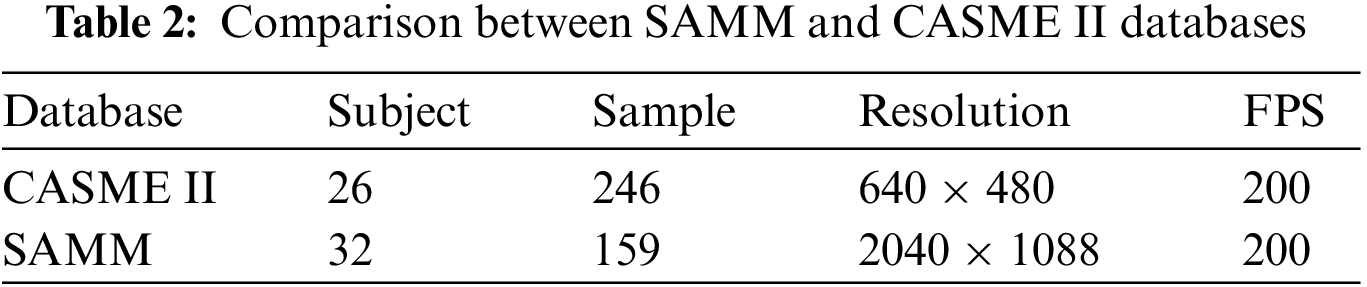
In contrast to CASME II, the SAMM database has a balanced split between female and male gender, plus consists of more mature participants with a higher mean age of 34.48 years. In addition, SAMM is providing a dataset with a wider demographic of participants. Thus, SAMM indeed provides a better overall view of a population by using subjects from various ethnicities, ages, and genders. With regards to the emotion labeling annotation, SAMM’s experiments require the subjects to complete a questionnaire to personalize the different types of video stimuli that will be shown to them. This means that specific videos that have higher chances of arousing their emotions are played, hence, increasing the potential of inducing the right MEs. However, despite SAMM being better in terms of subject diversity and induced emotion strategy, the number of samples available in SAMM is lesser than CASME II. Furthermore, this coincides with one of the limitations in previous deep learning works, which is the lack of training samples. Since both CASME II and SAMM databases contain a thorough representation of spontaneous MEs, therefore, it is a better strategy to utilize both datasets to allow the CNN model to achieve better prediction results.
In this subsection, a compact base CNN model is proposed to be the baseline to compare the effectiveness of an attention mechanism for the apex frame spotting task. The base model will be optimally embedded with an attention mechanism to address the assumption that there are specific regions on the face that are more important for micro-expression recognition compared to the others. CNN is a class of deep neural networks that are primarily employed for various recognition tasks [33,34]. The architecture of a CNN allows multilevel hierarchical feature learning. The initial layers of CNN can extract the low-level features, whereas the later layers can extract the high-level semantic features that are combined to pinpoint the patterns precisely. Based on the optimized features, the continuous output variable (apex frame number in this case) can be determined by solving a regression problem. Besides that, through continuous learning, the general performance of the model can be improved until weights convergence is achieved. To address the issue of distinguishing MEs from other movements, the proposed network aims to concentrate on different regions of the facial optical flow image and the weights of each region will be given a priority score according to its contribution to the task. The input to the network is the form of optical flow, which is calculated from the original RGB data. It is then fed into the proposed network, which will be processed layer by layer of feature maps. Tab. 3 shows the configuration details of the proposed network structure.
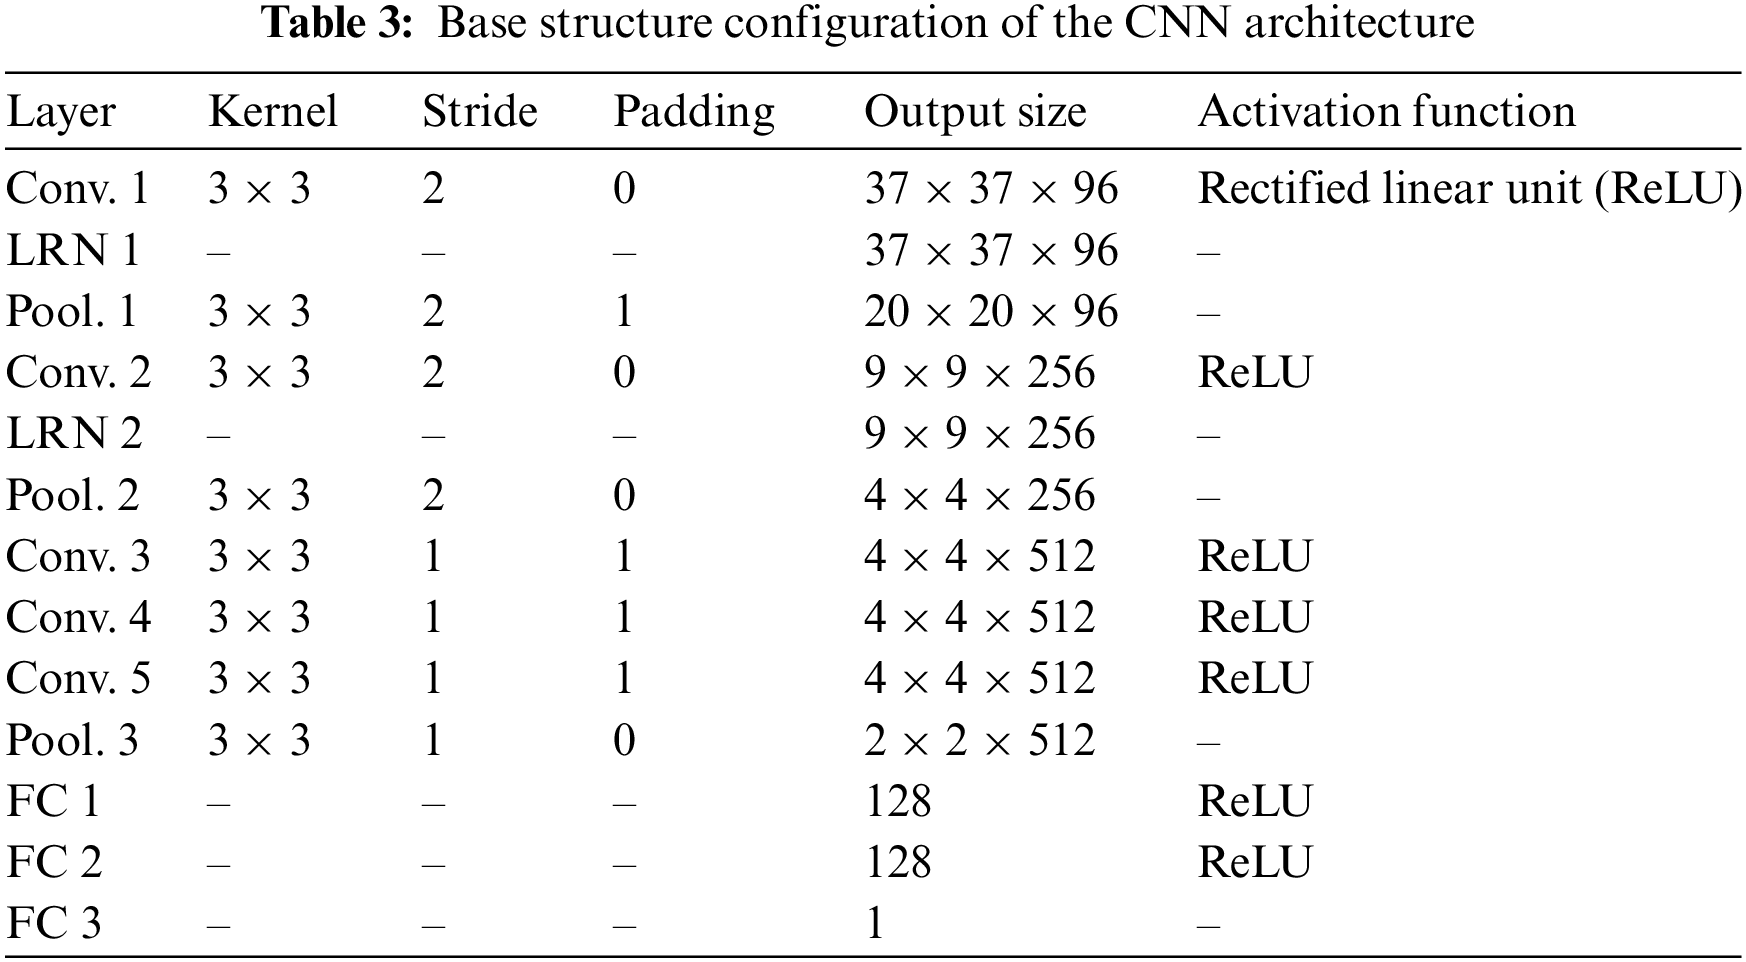
The base CNN design was inspired by a compact architectural design by the Visual Geometry Group – Mobile (VGG-M) [35]. The architecture of this CNN consists of an input layer, convolutional layer, rectified linear unit (ReLU), pooling layer, fully connected layer (FC), and output layer. All these layers are stacked to construct the full compact CNN architecture. The structure is modified through experiments to compare the performance yielded (experiment results in the Results and Discussion section). Based on Tab. 3, the number of convolutional and pooling layer pairs applied is the most fitting for this project’s database size. This is because a smaller number of pairs cannot extract high enough abstract features, while a bigger number of pairs will be redundant for this limited training dataset. Consequently, when either of the situations happened, the performance of the model will become poorer. The first layer, which is the convolutional layers are the major building blocks that take input and pass the resultant feature maps to the next layer. As the convolution filter is applied to an image, the image size will be diminished as well as bringing all the information in the field together into a smaller feature representation. The type of convolution used in this work is the 2D convolution layer (conv2D). The CNN output size formulas are:
In the formula,
In the previous formula,
In this formula, x is the input to a neuron. The function and its derivative both are monotonic. If it receives any negative input and returns 0 output. Whereas, for any positive value of x, it will return that original value back. Consequently, it gives an output that has a range from 0 to infinity. The regression is done in the fully connected layer. When it filters out those unrelated features, slowly, the model becomes more susceptible to significant patterns and manages the task in a more meaningful way. In order to speed up the learning of CNN and lead to faster convergence, LRN has been implemented as the normalization method to introduce competition between the pixels which occurs between the adjacent convolution outputs by significantly magnifying the little difference between the two of them. This characteristic is useful to differentiate various feature maps. When LRN is implemented, the most activated neuron suppresses neurons of the same location in different feature maps. The LRN can be modeled as the following formula, whereby i refers to the i-th feature map, r is the radius length and K denotes the bias.
3.3 Attention-based CNN Architecture
Continuing from the optimized base CNN design from the previous subsection, a proposed attention mechanism will be embedded in the base model to find the ROIs mask that is more attentive to the micro-expression recognition problem. This mask will assign more weights to the regions that are more informative to derive the possibility of micro-expression, which in theory should be the regions around the human eyes and mouth. Therefore, for ME spotting, such a mechanism may help decrease the negative influence from irrelevant facial movements. With the application of an attention mechanism, the model can be taught the appropriate weights between the features by itself and dynamically distribute it in the training process based on its importance to the spotting task. The attention network is employed through the use of a skip or shortcut connection. Fig. 6 shows the base network that has been modified with the shortcut connection. The shortcut connection introduces the attention mechanism with the addition of extra parameters and computation burden. In particular, the proposed trainable attention unit is shown in the dashed-line area of Fig. 6, where the average spatial feature map M(X) is computed. The attention map is computed using the features learned within the front part of the main CNN architecture, which is the input unit, X. The attention mechanism applied here is in the form of a mask that mimics a basic semantic segmentation network in the form of an encoder-decoder unit. The encoder side is used to compact the latent variable representations whereas the decoder task is to select specific elements to produce the output mask.
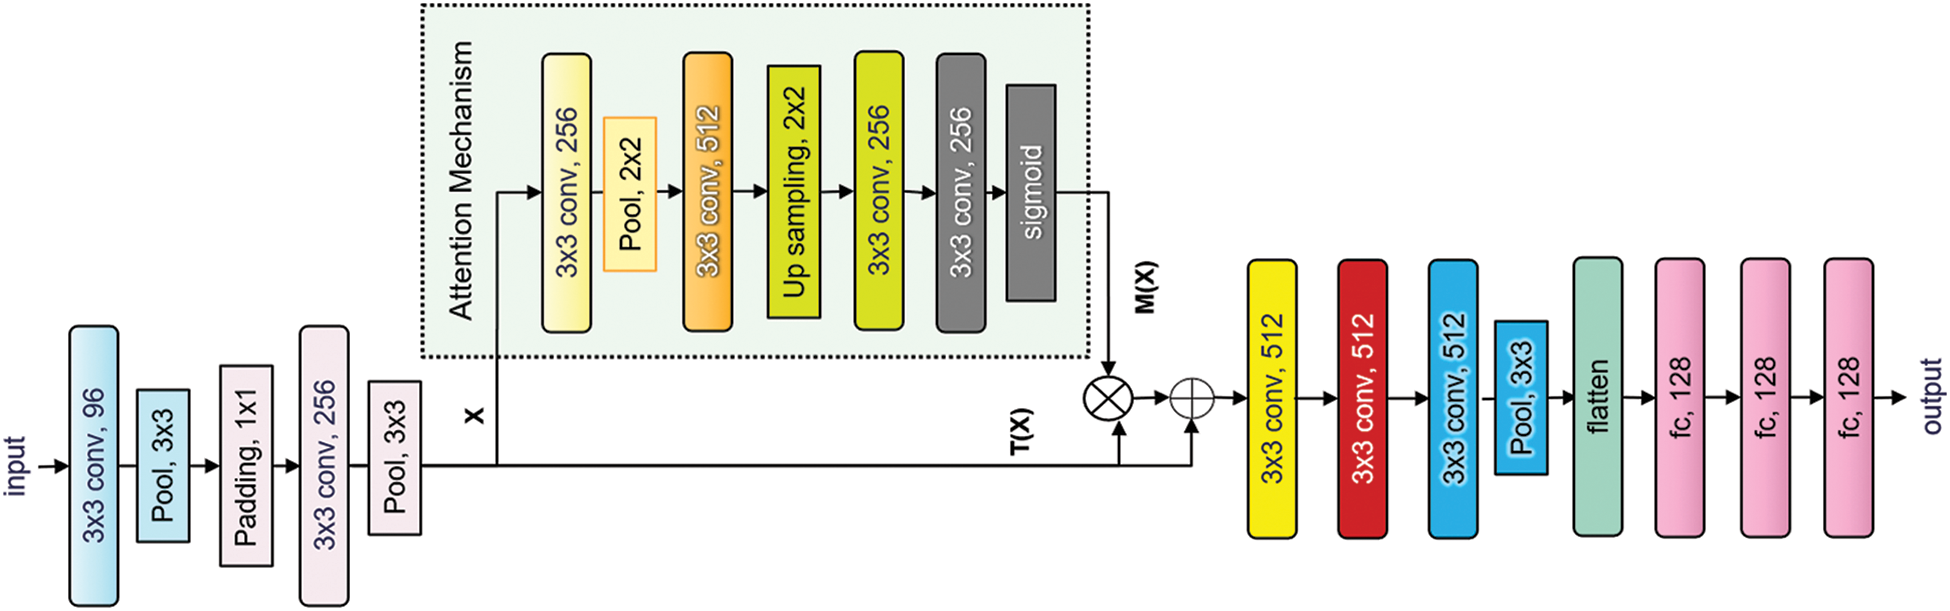
Figure 6: Framework of the proposed network architecture with the embedded attention mechanism
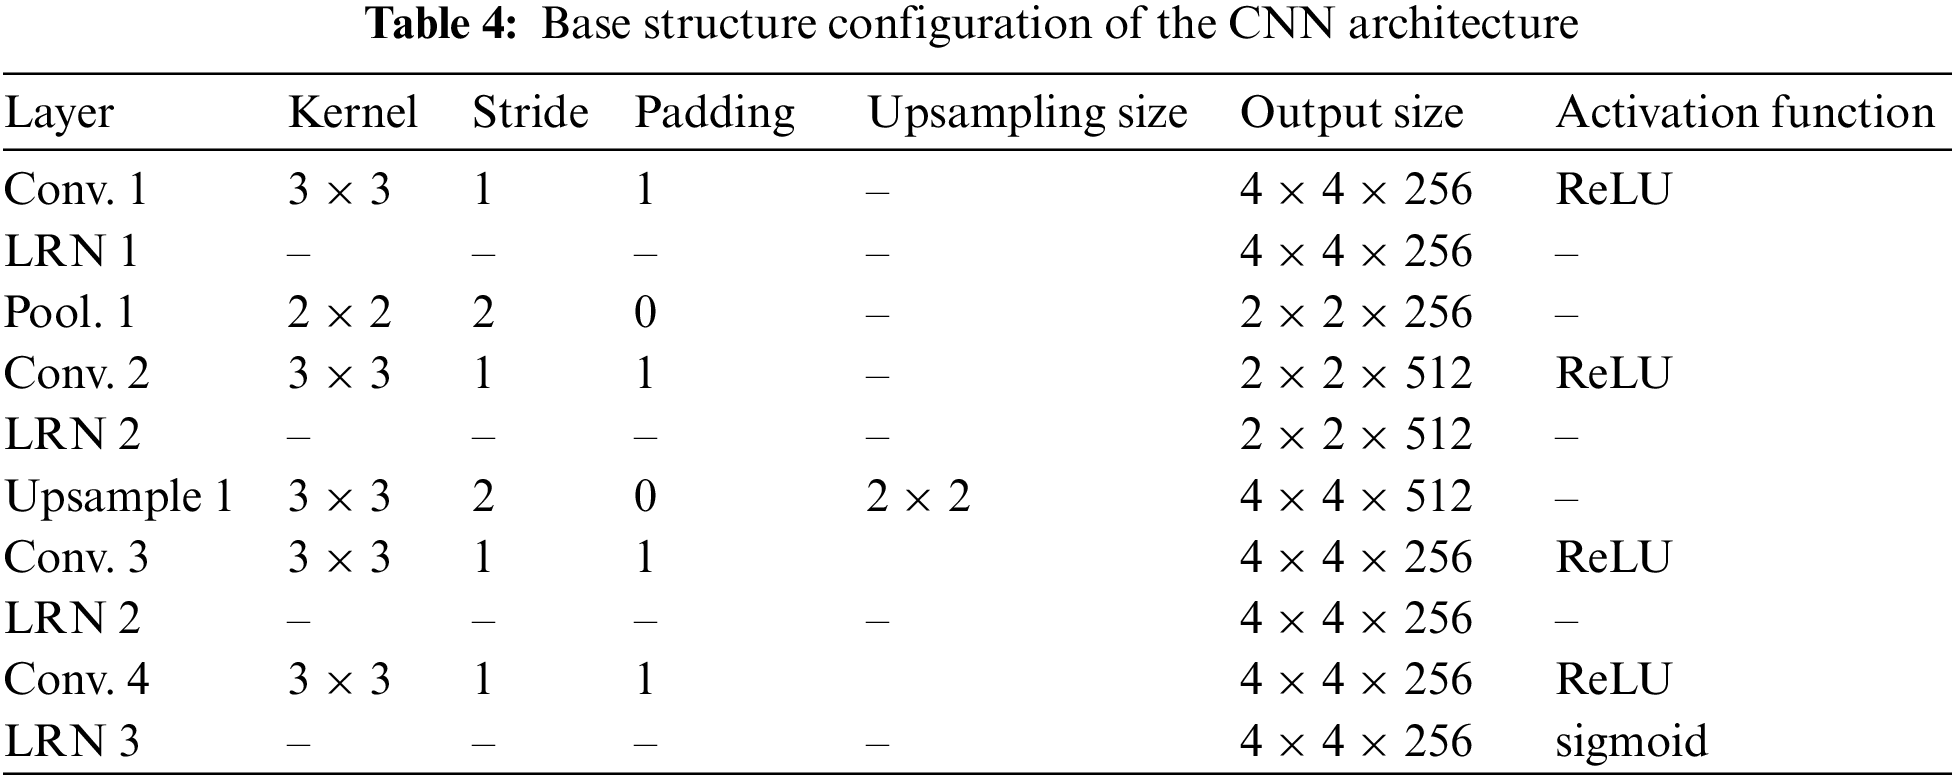
Tab. 4 shows the configuration details of the proposed network with an attention unit. The proposed unit consists of convolutional operations, pooling operations and the up-sampling operation. The up-sampling operation used in this attention unit will average out the input, creating the nice smoothness of the enlarged output map by applying interpolation. In general, this operation is used to match the output of the previous layer to generate the desired output size at the following layer. ReLU is used as the activation function for all convolutional layers except for the last layer, in which the sigmoid function is employed. The sigmoid function is used in the last layer to produce a mask between 0 and 1. The function is modeled as follows:
In this formula, z is the input to a neuron. The function is monotonic, but its derivative is not. Inputs that are much larger than 1.0 are transformed to the value of 1.0. Similarly, values that are much smaller than 0.0 are snapped to 0.0. The shape of the function for all possible inputs imitates the S-shape from zero up through 0.5 to 1.0. To compare the attention map M(X) with the output T(X) from the original CNN block, the proposed shortcut connection only brings in the T(X) * M(X) section which denotes the attention computation. This means that the attention map is then multiplied and added back to the original input feature map. The output of the attention mechanism layers is the attention map. The attention map M(X) would approximately approach zero when the attentional areas are not learning any feature of interest from the original output. After going through the same process for multiple iterations, the network will gradually learn to assign more weight to the regions that are more important.
The performance of the network model is evaluated by using the Mean Absolute Error that represents the average frame distance between the ground truth and the predicted apex frame result. The mathematical formula for MAE is shown as follows, whereby M is the total number of video sequences, and e is the frame distance between the ground-truth apex frame and the predicted apex frame.
In order to fully extract the image features optimally during the training phase, it is necessary to initialize the network hyper-parameters reasonably. The common hyper-parameters involved in the attention-based model are as follows, which are set as; the maximum number of training epochs is 200, mini-batch size is 128, and the update learning rate is 0.0001. These hyper-parameters are determined by evaluating the training performance of the model using the Mean Squared Error (MSE) metric. Considering the computational resources and timing available, the current best configuration is found through the Greedy search algorithm as the algorithm improvement seems to behave in a linear fashion. The greedy algorithm is a simple, intuitive algorithm that is used in optimization problems. As the algorithm attempts to find the overall optimal way to solve the entire problem, it makes the optimal choice at each stage sequentially and uses the selected choice as the basis for the next experiment. The results were obtained by applying a leave-one-subject-out training-testing scheme, whereby each subject will take a turn to be the test subject, in which all its videos will be the test videos, while all the other videos from the rest of the subjects will be used as the training videos. The same process will be repeated until all subject has become the test subject. Therefore, for the subject with ID-1 in CASME II dataset, three videos will be used as the test data, while 145 videos from the other 25 subjects will be the train data. Since the number of videos per subject is not equal, the number of videos used for training and testing will be different between the subjects.
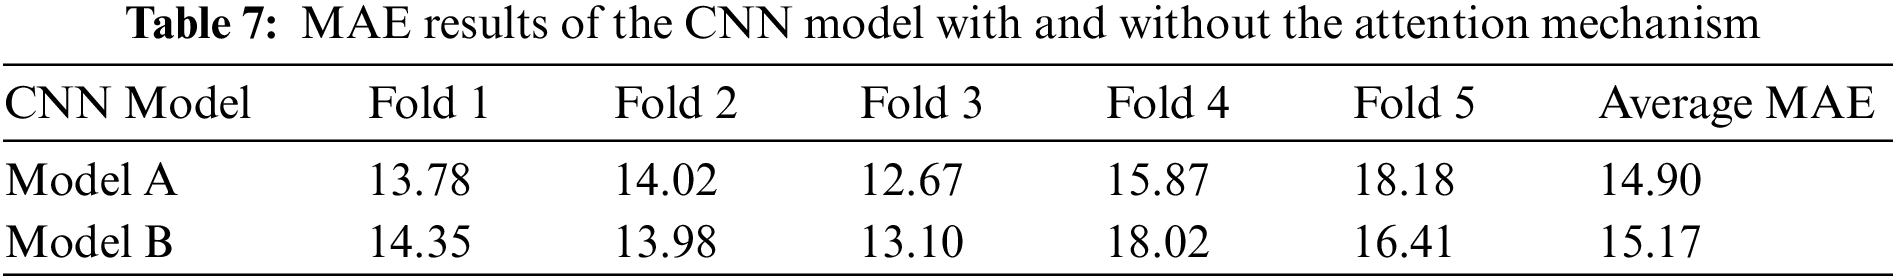
To produce results that are less biased according to the dataset selection, this paper split the dataset into test and train sets through k-fold cross-validation. The total number of folds used in this paper is five. With that, the data from the combined database were divided into five sub-sections, each of which contains frames from the divided video clips. For each fold, the proposed network was trained on the four subsections and then, validated on the remaining sub-section. After training and testing on all five-fold, every subsection should have been used once as the validation set, which produces five sets of spotting results as shown in Tabs. 5–7. The final spotting results will be the average of these five-fold spotting results. The CNN framework was deployed using Python, Keras with Tensorflow, and a graphical processing unit that is provided by the Google Colab. To select the best structure that produces the best prediction performance, there are three experiments have been performed. The first experiment will compare models with different numbers of convolutional layers, the second experiment will compare models with different normalization methods and the third experiment will compare models with or without an attention mechanism.
4.2 Experiment on the Number of Convolutional Layers for a Compact Network
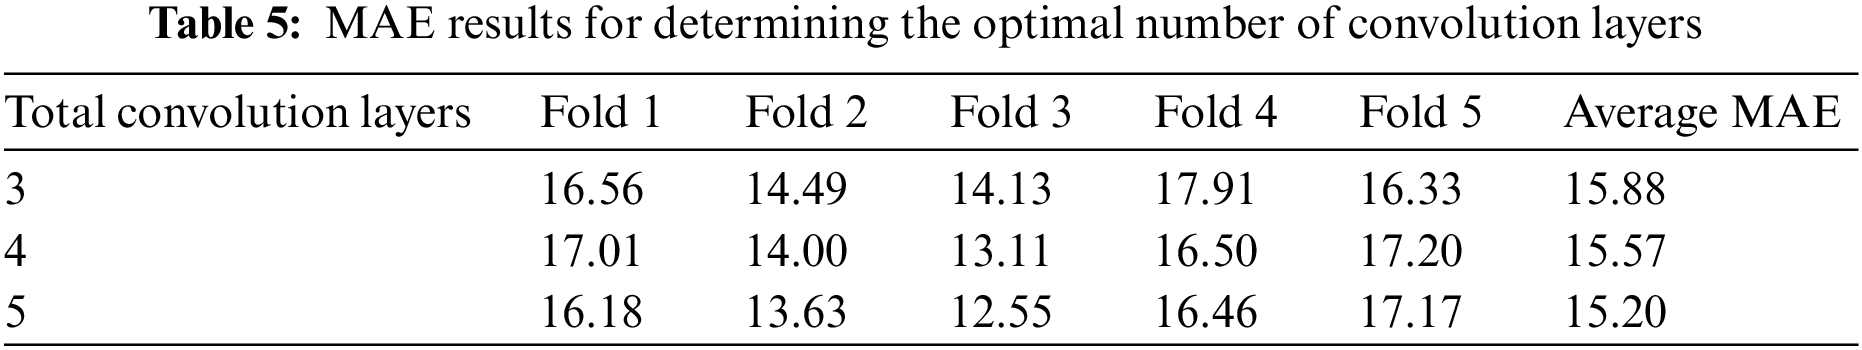
For the first set of experiments, the number of convolutional layers to be tested are three, four, and five. There is no necessity to go beyond five layers as the original structure of VGG-M only has five layers of convolution, which is the mark of a compact network. Although a deeper CNN may extract deeper features, if such simple network depth continues to deepen, the vanishing gradient problem will occur. This will make the network harder to train as it prevents the weight from changing its value, given that the training data is not that large. If the CNN is too deep or complex, overfitting will occur as the model tries to predict a complex trend with relatively few data. A model that is overfitted is inaccurate because the trend does not reflect the reality present in the data. Hence, the experiment will start with three layers and stop at five layers. By referring to Tab. 5, it displays the average MAE of apex frame spotting for the models with three, four, and five layers. Based on the results, the more convolutional layers are used, the higher the MAE performance will be. This might indicate that a deeper network can learn optimally even with the limited number of training data available, and hence a smaller network can still extract the finer features, but not as good as the five-layer network. Generally, as the depth of the model increases, the power of the model to extract complex features will also increase at the cost of the computational complexity. Therefore, the five layers model is selected to be the best model because it has the lowest MAE of 15.20 among the tested three variants.
4.3 Experiment on the Type of Normalization Method
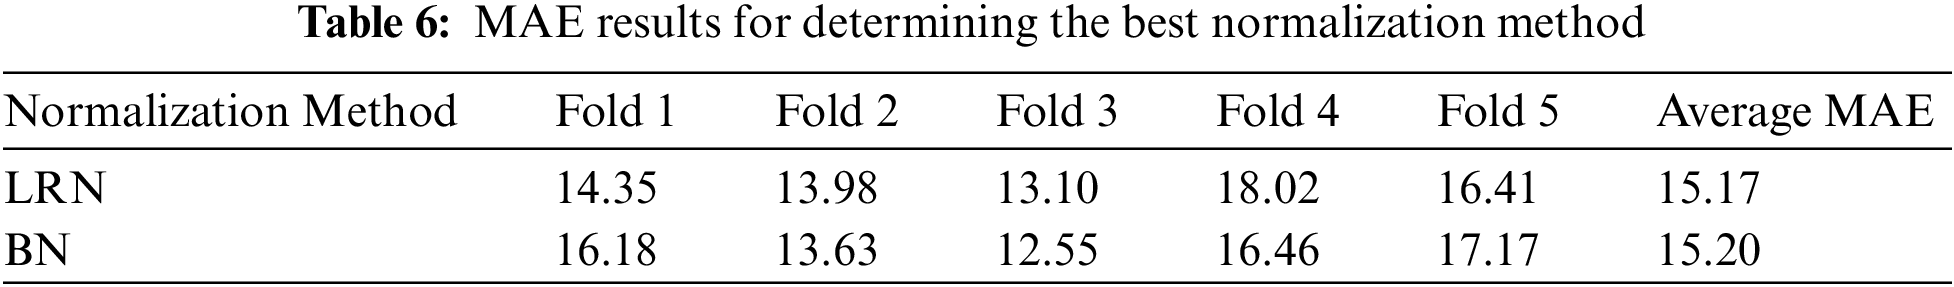
For the second set of experiments, the normalization methods that are tested are LRN and Batch Normalization (BN). Normalization layers have been proven to improve deep neural networks convergence [36]. These normalization techniques can enhance the performance of the models with a slight increment in the computational burden. Thus, it is crucial to employ the normalization method at the appropriate layers to maximize the performance output. Since the previous experiment has proven that five convolutional layers are the most suitable for apex frame spotting, thus, the normalization methods will be embedded in this particular network. By referring to Tab. 6, the results show the average MAE of apex frame spotting for both normalization methods. The results show that LRN produced a lower MAE compared to BN. Although the computational burden has increased when LRN was implemented, but the results show that LRN is more effective in predicting the apex frame. One possible reason in which BN has a less desired result is due to the lack of training data and restrain the variety in a batch application. As training is done with a small number of mini-batch, the effectiveness of BN will be diminished. This is because the regularization strength of BN is decided by the batch size. A small batch size may produce an under-fitting problem, causing a model to be less effective. For LRN wise, this method is not affected significantly by the batch size while relying on suitable architecture for optimal application. Thus, LRN is chosen to be the best normalization method for the proposed model.
4.4 Experiment on the Attention Mechanism
For the third set of experiments, a performance comparison is made between a CNN model with an attention mechanism and without it. Since the previous experiments have proven that the best model obtained is a combination of five convolution layers and LRN, therefore, the attention mechanism will be embedded in this optimized model. Based on Tab. 7, the average MAEs of apex frame spotting results for both variants, with (Model A) and without attention mechanism (Model B) are displayed. The results reveal that Model A has a lower MAE result compared to Model B. This improvement is due to the effectiveness of the attention mechanism in unifying the image features extracted from various ROIs. The mask also puts more emphasis on the regions that are more likely to induce the respective emotions. Therefore, the model with an attention mechanism can better capture subtle muscle motions compared to the model without the attention mechanism. As a result, the application of an attention mechanism is necessary for better prediction performance of apex frame spotting.
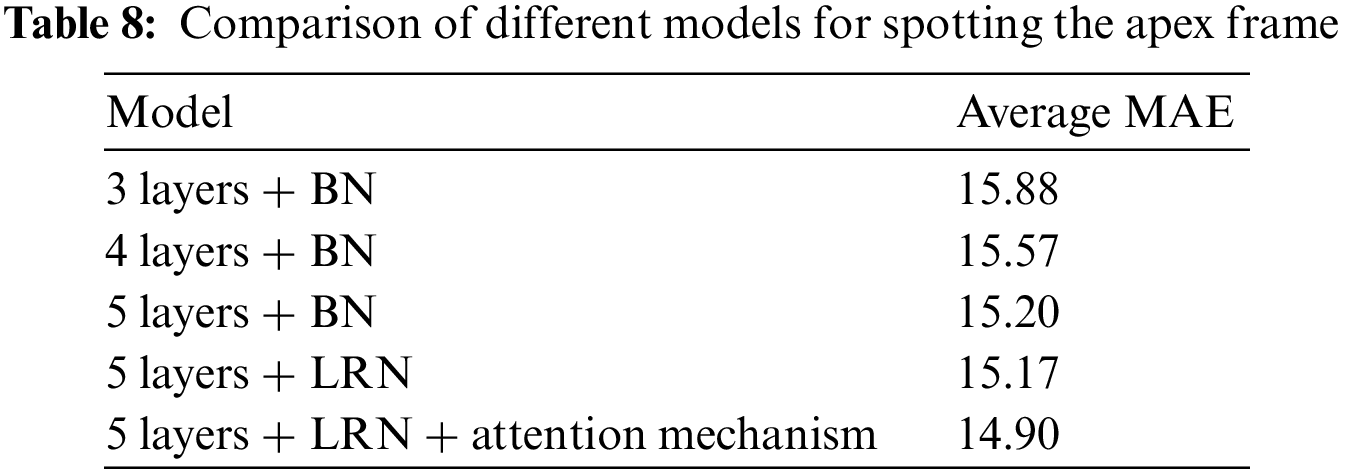
For a clear comparison, Tab. 8 summarizes the average MAE results for all the tested models. All the models tend to converge after training for 200 epochs. In brief, the experiments’ results have shown that the spotting results achieved by using the proposed method (with five convolutional layers model as the basis, added with LRN and attention mechanism) have the best capability in spotting the apex frame.
4.5 Performance Benchmarking with State-of-the-Art Methods
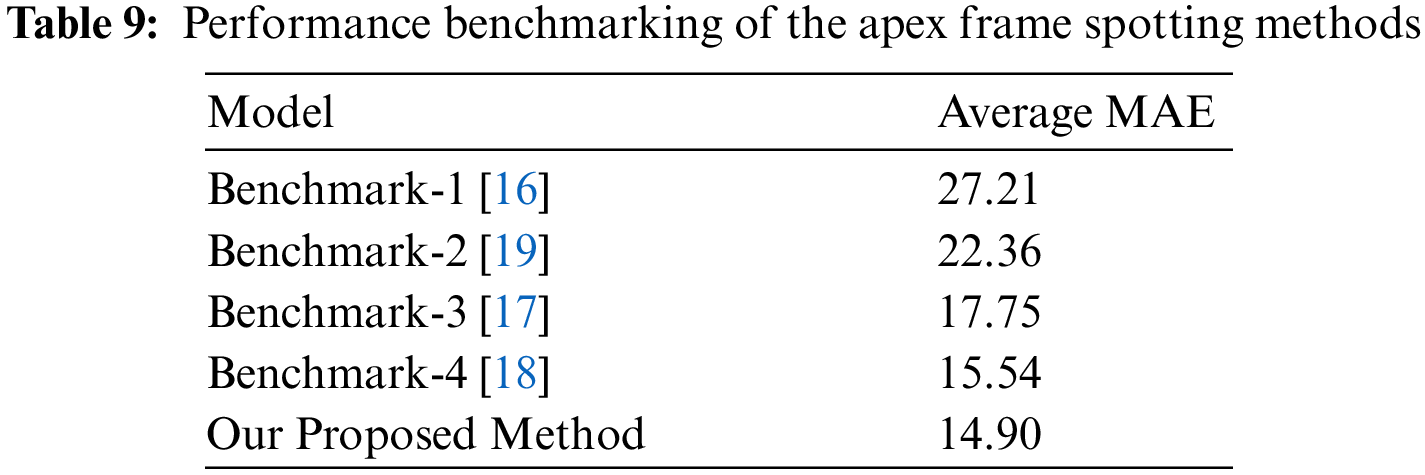
In this subsection, the performance of the proposed attention mechanism will be compared with several state-of-the-art methods for apex frame spotting. There are four methods that will become the benchmark, which are Benchmark-1 [16], Benchmark-2 [19], Benchmark-3 [17], and Benchmark-4 [18]. Only performances that are based on the whole face information will be considered in this paper for a fair comparison. Benchmark-1 determined the apex frame based on the maximum optical strain magnitude, which is obtained through the optical flow of the horizontal and vertical components. The method also implemented eye masking by negating any eye blinking for optical strain calculation. According to Tab. 9, this method produced the biggest MAE of 27.21 frames. The primary weakness of this method is due to its exclusion of facial movement features that surround the eye regions. With the masking applied, crucial information of micro-expression will be removed in identifying the apex frame. Contrary to Benchmark-1, the method in Benchmark-2 specifically utilized two inner eye corners as the regions of interest in identifying the apex frame. They have devised four CNN layers architecture, in which the annotated ground truth will be assigned with a high label, while the rest will be assigned with a low label. As a result, their method showed observable performance improvement over Benchmark-1 with an MAE of 22.36 frames. Rather than treating each individual frame separately, Benchmark-3 applied a constraint local model approach to track the features of interest over the successive frames. This method managed to reduce the MAE significantly to 17.75 frames. However, tracking features of interest requires the videos to be captured in a stable environment without significant changes to surrounding illumination, whereby any sudden change will affect the model performance severely. Besides that, apart from our proposed method, the second performance is reported by Benchmark-4 with an MAE of 15.54 frames. They have used the local binary pattern to extract the facial muscle movement features coupled with a binary search method that is applied to the whole face region. Their MAE is only slightly higher than our proposed method with an MAE of 14.90 frames. Hence, the proposed method that used attention-based CNN with a continuous labeling format has produced the best performance to detect the apex frame in a video sequence.
In this paper, an improved CNN model for spotting the apex frame of ME has been successfully proposed and validated. The deep learning technique used has incorporated the attention mechanism to get a better performance in apex frame spotting. Based on the experimental results, the improved network has the advantages of having a low complexity and simple structure, as such, it can be trained quickly and effectively. The embedded attention mechanism allows the network to focus on the essential feature information on selected ROIs by suppressing the background information interference. The lowest MAE is obtained by using a compact CNN model with five layers, coupled with LRN and attention mechanism. However, there are still some limitations encountered such as limited accessibility to spontaneous ME databases. For future work, the network structure could be further improvised using more advanced strategies such as group and shuffle operators.
Funding Statement: Authors would like to acknowledge funding from Universiti Kebangsaan Malaysia (Geran Universiti Penyelidikan: GUP-2019-008 and Dana Padanan Kolaborasi: DPK-2021-012).
Conflicts of Interest: The authors declare that they have no conflicts of interest to report regarding the present study.
References
1. K. S. Min, M. A. Zulkifley, B. Yanikoglu and N. A. M. Kamari, “Apex frame spotting using convolutional neural networks with continuous labeling,” in Proc. of the 11th Int. Conf. on Robotics, Vision, Signal Processing and Power Applications, Penang, Malaysia, pp. 834–839, 2022. [Google Scholar]
2. M. F. Valstar and M. Pantic, “Fully automatic recognition of the temporal phases of facial actions,” IEEE Transactions on Systems, Man and Cybernetics, vol. 42, no. 1, pp. 28–43, 2012. [Google Scholar]
3. K. S. Min, M. A. Zulkifley, N. A. M. Kamari and A. A. Moubark, “Analysis of feed-forward connections for apex frame spotting,” in Proc. of the 6th Int. Conf. on Electrical, Control and Computer Engineering, Gambang, Malaysia, pp. 1–10, 2022. [Google Scholar]
4. W. J. Yan, Q. Wu, J. Liang, Y. H. Chen and X. Fu, “How fast are the leaked facial expressions: The duration of micro-expressions,” Journal of Nonverbal Behavior, vol. 37, no. 4, pp. 217–230, 2013. [Google Scholar]
5. S. Porter and L. Brinke, “Reading between the lies: Identifying concealed and falsified emotions in universal facial expressions,” Psychological Science, vol. 19, no. 5, pp. 508–514, 2008. [Google Scholar]
6. W. J. Yan, Q. Wu, Y. J. Liu, S. J. Wang and X. Fu, “CASME database: A dataset of spontaneous micro-expressions collected from neutralized faces,” in Proc. of IEEE Conf. on Auto Face Gesture Recognition, Shanghai, China, pp. 1–7, 2013. [Google Scholar]
7. W. J. Yan, S. J. Wang, G. Zhao, X. Li, Y. J. Liu et al., “CASME II: An improved spontaneous micro-expression database and the baseline evaluation,” PLoS ONE, vol. 9, pp. e86041, 2014. [Google Scholar]
8. U. Hess and R. E. Kleck, “Differentiating emotion elicited and deliberate emotional facial expressions,” European Journal of Social Psychology, vol. 20, pp. 369–385, 1990. [Google Scholar]
9. X. Li, X. Hong, A. Moilanen, X. Huang, T. Pfister et al., “Towards reading hidden emotions: A comparative study of spontaneous micro-expression spotting and recognition methods,” IEEE Transactions on Affective Computing, vol. 9, no. 4, pp. 563–577, 2017. [Google Scholar]
10. Y. Li, X. Huang and G. Zhao, “Can micro-expression be recognized based on single apex frame?,” in Proc. of 25th IEEE Int. Conf. on Image Processing (ICIP), Athens, Greece, pp. 3094–3098, 2018. [Google Scholar]
11. S. J. Wang, W. J. Yan, X. Li, G. Zhao, C. G. Zhou et al., “Micro-expression recognition using color spaces,” IEEE Transactions on Image Processing, vol. 24, no. 12, pp. 6034–6047, 2015. [Google Scholar]
12. X. Huang, G. Zhao, X. Hong, W. Zheng and M. Pietikainen, “Spontaneous facial micro-expression analysis using spatiotemporal completed local quantized patterns,” Neurocomputing, vol. 175, no. 4, pp. 564–578, 2016. [Google Scholar]
13. V. Mayya, R. M. Pai and M. M. Pai, “Combining temporal interpolation and DCNN for faster recognition of micro-expressions in video sequences,” in Proc. of Int. Conf. on Advances in Computing, Communications and Informatics (ICACCI), Jaipur, India, pp. 699–703, 2016. [Google Scholar]
14. Y. Zong, X. Huang, W. Zheng, Z. Cui and G. Zhao, “Learning from hierarchical spatiotemporal descriptors for micro-expression recognition,” IEEE Transactions on Multimedia, vol. 20, no. 11, pp. 3160–3172, 2018. [Google Scholar]
15. B. Sun, S. M. Cao, J. He and L. J. Yu, “Affect recognition from facial movements and body gestures by hierarchical deep spatio-temporal features and fusion strategy,” Neural Networks, vol. 105, no. 2, pp. 36–51, 2018. [Google Scholar]
16. S. T. Liong, J. See, K. Wong and R. C. W. Phan, “Automatic micro-expression recognition from long video using a single spotted apex,” in Proc. of Asian Conf. on Computer Vision, Taipei, Taiwan, pp. 345–360, 2016. [Google Scholar]
17. W. J. Yan, S. J. Wang, Y. H. Chen, G. Y. Zhao and X. Fu, “Quantifying micro-expressions with constraint local model and local binary pattern,” in Proc. of European Conf. on Computer Vision, Zurich, Switzerland, pp. 296–305, 2014. [Google Scholar]
18. S. T. Liong, J. See, K. Wong, A. C. Le-Ngo, Y. H. Oh et al., “Automatic apex frame spotting in micro-expression database,” in Proc. of IEEE Conf. on Pattern Recognition, Cancun, Mexico, pp. 665–669, 2016. [Google Scholar]
19. Z. Zhang, T. Chen, H. Meng, G. Liu and X. Fu, “SMEConvNet: A convolutional neural network for spotting spontaneous facial micro-expression from long videos,” IEEE Access, vol. 6, pp. 71143–71151, 2018. [Google Scholar]
20. A. Moilanen, G. Zhao and M. Pietikainen, “Spotting rapid facial movements from videos using appearance-based feature difference analysis,” in Proc. of Int. Conf. on Pattern Recognition (ICPR), Stockholm, Sweden, pp. 1722–1727, 2014. [Google Scholar]
21. A. Davison, W. Merghani, C. Lansley, C. C. Ng and M. H. Yap, “Objective micro-facial movement detection using FACS-based regions and baseline evaluation,” in IEEE Int. Conf. on Automatic Face & Gesture Recognition, Xi’an, China, pp. 642–649, 2018. [Google Scholar]
22. X. Li, J. Yu and S. Zhan, “Spontaneous facial micro-expression detection based on deep learning,” in Proc. of IEEE Int. Conf. on Signal Processing, Chengdu, China, pp. 1130–1134, 2017. [Google Scholar]
23. H. Ma, G. An, S. Wu and F. Yang, “A region histogram of oriented optical flow (RHOOF) feature for apex frame spotting in microexpression,” in Proc. of Intelligent Signal Processing and Communication Systems (ISPACS), Xiamen, China, pp. 281–286, 2017. [Google Scholar]
24. H. Lu, K. Kpalma and J. Ronsin, “Micro-expression detection using integral projections,” Journal of WSCG, vol. 25, no. 2, pp. 87–96, 2017. [Google Scholar]
25. C. Duque, O. Alata, R. Emonet, A. C. Legrand and H. Konik, “Microexpression spotting using the Riesz pyramid,” in Proc. of IEEE Winter Conf. on Applications of Computer Vision, Nevada, USA, pp. 66–74, 2018. [Google Scholar]
26. K. C. Onyelowe, E. J. Fazal, E. O. Michael, C. O. Ifeanyichukwu, U. A. George et al., “Artificial intelligence prediction model for swelling potential of soil and quicklime activated rice husk ash blend for sustainable construction,” Jurnal Kejuruteraan, vol. 33, no. 4, pp. 845–852, 2021. [Google Scholar]
27. M. Shreve, S. Godavarthy, D. Goldgof and S. Sarkar, “Macro- and micro-expression spotting in long videos using spatio-temporal strain,” in Proc. of IEEE Conf. Auto Face Gesture Recognition, California, USA, pp. 51–56, 2011. [Google Scholar]
28. S. Polikovsky, Y. Kameda and Y. Ohta, “Facial micro-expression detection in hi-speed video based on facial action coding system (FACS),” IEICE Transactions on Information and Systems, vol. E96.D, no. 1, pp. 81–92, 2013. [Google Scholar]
29. Z. Xia, X. Feng, J. Peng, X. Peng and X. Fu, “Spontaneous micro-expression spotting via geometric deformation modeling,” Computer Vision and Image Understanding, vol. 147, no. 4, pp. 87–94, 2016. [Google Scholar]
30. T. K. Tran, X. Hong and G. Zhao, “Sliding window based micro-expression spotting: A benchmark,” in Int. Conf. on Advanced Concepts for Intelligent Vision Systems, Antwerp, Belgium, pp. 542–553, 2017. [Google Scholar]
31. T. Tran, Q. Vo, X. Hong and G. Zhao, “Dense prediction for micro-expression spotting based on deep sequence model,” Electronic Imaging, vol. 2019, no. 8, pp. 401-1–401-6, 2019. [Google Scholar]
32. A. K. Davison, C. Lansley, N. Costen, K. Tan and M. H. Yap, “SAMM: A spontaneous micro-facial movement dataset,” IEEE Transactions on Affective Computing, vol. 9, no. 1, pp. 116–129, 2018. [Google Scholar]
33. N. A. Mohamed, M. A. Zulkifley, N. A. M. Kamari and Z. Kadim, “Symmetrically stacked long short-term memory networks for fall event recognition using compact convolutional neural networks-based tracker,” Symmetry, vol. 14, no. 2, pp. 293, 2022. [Google Scholar]
34. N. A. Mohamed, M. A. Zulkifley, A. A. Ibrahim and M. Aouache, “Optimal training configurations of a CNN-LSTM-based tracker for a fall frame detection system,” Sensors, vol. 21, no. 19, pp. 6485, 2021. [Google Scholar]
35. K. Simonyan and A. Zisserman, “Very deep convolutional networks for large-scale image recognition,” in Proc. of the 3rd Int. Conf. on Learning Representations (ICLR), Banff, Canada, 2014. [Google Scholar]
36. S. R. Abdani, M. A. Zulkifley and A. Hussain, “Compact convolutional neural networks for pterygium classification using transfer learning,” in Proc. of IEEE Int. Conf. on Signal and Image Processing Applications (ICSIPA), Kuala Lumpur, Malaysia, pp. 140–143, 2019. [Google Scholar]
 | This work is licensed under a Creative Commons Attribution 4.0 International License, which permits unrestricted use, distribution, and reproduction in any medium, provided the original work is properly cited. |