| Computers, Materials & Continua DOI:10.32604/cmc.2022.029317 | |
| Article |
Performance Enhancement of Praseodymium Doped Fiber Amplifiers
1Department of Electrical Engineering, Faculty of Engineering, Jouf University, Sakaka, 42421, Saudi Arabia
2SEECS Photonics Research Group, Islamabad, 44000, Pakistan
3Institute of Space Technology, Islamabad, 44000, Pakistan
4School of Electrical Engineering and Computer Science (SEECS), National University of Sciences and Technology (NUST), Islamabad, 44000, Pakistan
*Corresponding Author: Salman Ghafoor. Email: salman.ghafoor@seecs.edu.pk
Received: 01 March 2022; Accepted: 17 May 2022
Abstract: In this paper, we report a simulation study on the performance enhancement of Praseodymium doped silica fiber amplifiers (PDFAs) in O-band (1270–1350 nm) in terms of small signal gain, power conversion efficiency (PCE), and output optical power by employing bidirectional pumping. The PDFA performance is examined by optimizing the length of Praseodymium doped silica fiber (PDF), its mode-field diameter (MFD) and the concentration of Pr3+. A small-signal peak gain of 56.4 dB, power conversion efficiency (PCE) of 47%, and output optical power of around 1.6 W (32 dBm) is observed at optimized parameters for input signal wavelength of 1310 nm. Minimum noise figure (NF) of 4.1 dB is observed at input signal wavelength of 1310 nm. Moreover, the effect of varying the pump wavelength and pump power on output optical power of the amplifier and amplified spontaneous emission (ASE) noise is also investigated, respectively. Finally, the impact of ion-ion interaction (up-conversion effect) on small-signal gain of the amplifier is also studied by considering different values of up-conversion coefficient.
Keywords: Praseodymium-doped fiber; doped fiber amplifiers; optical amplification; mode field diameter; noise figure
Recently, a significant increase in bandwidth demand is faced by the network operators due to growing number of internet users both in wired and wireless domains [1,2]. This surge in demand is primarily due to the use of multiple bandwidth hungry applications in our daily life such as different social media platforms, voice over internet protocol (VoIP), Video telephony, high-definition television (HDTV), live streaming, online games, virtual reality platforms, e-health, e-commerce etc. [2]. As a result, the capacity of existing optical networks has expanded during the past few years to such an extent that the conventional 1550 nm optical window is on the verge of its capacity crunch [3]. Therefore, induction of new optical windows is urgently needed, where the scattering and absorption losses should be minimum to accommodate the rapid increase in bandwidth demand. In this regard, the second preferred optical window i.e., 1300 nm is being widely explored for optical communication due to its low overall attenuation of 0.3 dB/km and low value of dispersion that is close to zero [3,4].
The commercial wavelength division multiplexed (WDM) networks that are currently in operation generally use the 1550 nm optical window. This window is generally divided into approximately 160 wavelengths resulting in a combined data rate close to 1.6 Tbps over a standard single mode fiber (SSMF) that spans over lengths in the range of hundreds of kilometers [3,5]. The optical signals transmitted over longer fiber spans are usually attenuated due to fiber attenuation and insertion losses of optical add-drop multiplexers (OADMs) used for frequent add-drop of wavelengths [3]. Therefore, optical amplifiers are essential link elements which are used at regular intervals to compensate for the optical losses incurred due to fiber attenuation and insertion losses of various passive components including OADMs. The dopants generally used to develop doped fiber amplifiers for different optical windows are known as Erbium, Ytterbium, Holmium, Praseodymium and Thulium [3,6]. PDFAs are now commercially available for amplification in the O-band (1260–1360 nm) and are compatible with the second optical window [7]. PDFAs are getting huge research attention as they are expected to play a vital role in realizing the optical transmission systems operating in the 1300 nm optical window to address the bandwidth and capacity related issues of future optical networks. The PDFAs operating in O-band are now widely being used in data center networks (DCNs), metro networks, and access networks (various passive optical network (PON) systems) as booster as well as in-line amplifiers [8].
So far, a handful of research studies have been performed on PDFAs as compared to other rare earth doped fiber amplifiers. Mirza et al. evaluated the performance of PDFA for the wavelength range of 1250–1350 nm by employing a single forward pump source whose length, Pr3+ concentration and pump power are properly optimized. A small-signal peak gain and PCE of 22.7 dB and 12.5 % were respectively observed at 1300 nm [3]. Anashkina and Hu et al. proposed optical amplification schemes in the 4000–5000 nm wavelength range for mid infrared (IR) ultra-short pulses where, double-clad chalcogenide fiber is doped with Pr3+ in [9], double-clad chalcogenide fiber is doped with Praseodymium, Dysprosium, or Terbium ions in [10], and chalcogenide fiber is doped with Pr3+ for cascaded amplification in [11]. Hu et al. investigated the cascaded amplification in a three-level mid IR amplification in a chalcogenide fiber doped with Pr3+ [12]. It has been observed that 45% of the pump power at 2000 nm shifted to signal at 4500 nm. Khamis et al. proposed a Pr3+-doped chalcogenide photonic crystal fiber (PCF) design based on large mode area for high efficiency mid IR fiber laser [13]. Slope efficiency of more than 64% at 4500 nm for fiber loss of 1 dB/m has been obtained. Philippe et al. investigated the gain evolution in the case of alteration of state of polarization of both pump and signal during propagation through a Pr3+/ Tm3+ co-doped fluoride fiber [14]. Gains and PCEs in the range of 25–30 dB and 20%–25% respectively, are obtained. Shan et al. demonstrated a resonantly pumped PDFA operating at 4100 nm employing forward and backward pumping schemes and chalcogenide fiber doped with Pr3+ [15]. It was shown that PCE and output optical power of 62.8% and 7.2 W are obtained with backward pumping. The study in [16,17], considers the impact of concentration of Pr3+ ions on the amplified spontaneous emission (ASE) noise generated by the amplifier. It also considers the optimization of Judd-Ofelt parameters to maximize the cross-section of stimulated emission. Liu et al. [18] proposed a method for obtaining ultra-broadband near IR signal amplification employing a Pr3+ doped ultraviolet (UV)-sensitive Germanium-Tellurite glass fiber in 1280–1680 nm wavelength range. Schimmel et al. evaluated the gain performance of PDFA in the 1250–1350 nm spectral range by employing different pump configurations [19]. Peak small-signal gain of around 15 dB was obtained at 1300 nm at optimized parameters. In [20], the 1310 nm dense wavelength division multiplexing (DWDM) based system level performance of semiconductor optical amplifier (SOA) and PDFA are studied experimentally. The maximum gain obtained was 25 dB for SOA and 20.9 dB for PDFA while, the minimum values of receiver sensitivity for single channel was −11.5 and −11 dBm for SOA and PDFA, respectively. Different samples of chalcogenide fibers with core of special pure Ga (In)-Ge-As-Se glasses doped with different concentrations of Pr3+ have been prepared to experimentally study the broadband photoluminescence in the spectral range of 3500–5500 nm in [21]. The values of the PCEs of these samples at 4700 nm were calculated with the highest value obtained as 29%. Nishida et al. developed an efficient PDFA using PbF2-InF3-based fluoride SMF doped with Pr3+ [22]. A small-signal gain and PCE of 22.5 dB and 11.5%, respectively were obtained. Ohishi et al. investigated the concentration quenching effect in PDFA by considering the different doping concentration of Pr3+ in fluoride fiber operating at the 1300 nm. The authors observed that the doping concentration of around 1000 ppm results into significant degradation in performance [23]. Valles et al. proposed a numerical study to evaluate the gain and ASE performance of PDFA based on fluoride fiber and bidirectional pumping [24]. A peak small-signal gain of around 31 dB is obtained by using a double-path configuration with a reflective type of mirror. In [25], a high output optical power PDFA based on fluoride fiber and single pump source was proposed. A small-signal peak gain and output power of 36 dB and 20 dBm were obtained in double-pass configuration at 1300 nm. Miroslav et al. investigated the transient effect of adding or dropping of wavelengths in WDM networks that are required during reconfiguration or for coping with line failures [26]. The analysis was performed on a network composed of eight Pr3+ doped fluoride fiber amplifiers concatenated together [26]. Tab. 1 presents a comparison between the previously proposed PDFA related studies with our work. The information that has not been provided in a particular study is represented with a dash in Tab. 1.
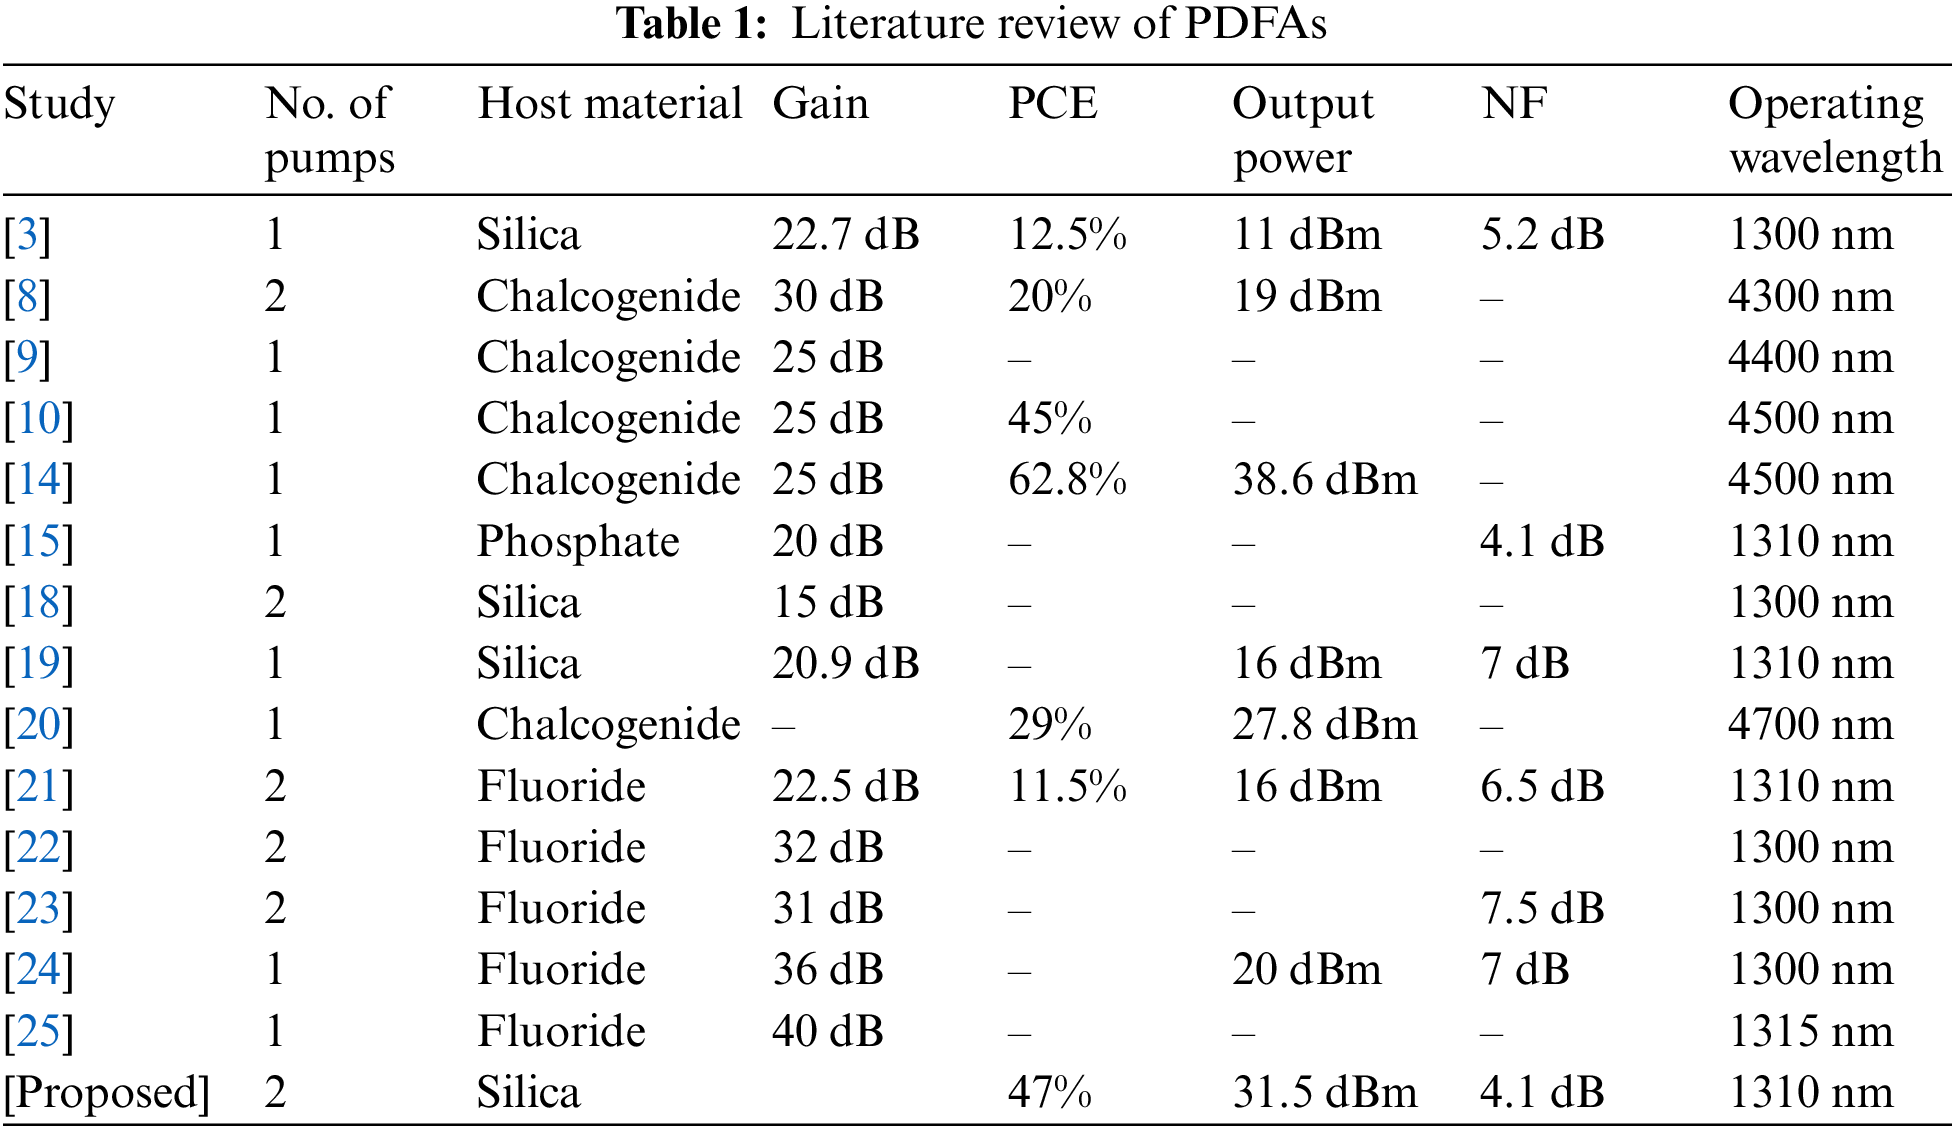
The highest ever small-signal gain, PCE, and output optical power of PDFA with silica glass host material reported in literature is 22.7 dB, 12.5% and 11 dBm, respectively [3]. Similarly, highest ever small-signal gain, PCE and output optical power of PDFA with fluoride glass host material reported in literature is 40 dB [26], 46% [27] and 20 dBm [25], respectively. Finally, the highest ever small signal gain, PCE and output optical power of PDFA using chalcogenide fibers reported in literature is 30 dB [9], 62.8% [15] and 38.6 dBm [15], respectively. To the best of our knowledge, we report for the very first time an enhanced performance of PDFA by employing the bidirectional pumping where the wavelength of both pumps is 1030 nm. The output power, gain and NF of the amplifier are evaluated by optimizing the length of PDF, concentration of Pr3+ and the MFD of the fiber used. Highest ever small-signal gain of 56.4 dB, PCE of 47% and output optical power of around 1.6 W is observed at optimized parameters for signal wavelength of 1310 nm. In view of the literature discussed earlier, the novel aspects of our work are as under:
i) Performance of the PDFA is enhanced by employing a short length of silica fiber doped with Pr3+ and bidirectional pumping.
ii) To date, the highest small-signal gain, PCE, and output optical power of 56.4 dB, 47%, and 1.6 W, respectively are achieved at signal wavelength of 1310 nm.
iii) Minimum NF of 4.1 dB is observed at signal wavelength of 1310 nm.
iv) The effect of up-conversion on small-signal gain of PDFA is also investigated by considering different values of up-conversion coefficient.
The simulation work in this paper has been performed by using the OptiSystem 18 commercial tool from Optiwave Corporation, Ontario, Canada [28]. The enhancement in the performance of PDFA presented in our work gives a design guideline to amplifier manufacturers.
To design an efficient PDFA for small-signal amplification in O-band, it is necessary to understand the theoretical background of PDF i.e., absorption and emission cross-sections of Pr3+ doped in glass fibers, energy level diagram, and rate equations. Fig. 1 shows the absorption and emission cross-sections and simplified energy level diagram of Pr3+. It may be observed that the blue curve is the ground state absorption (GSA), and the red curve is the emission of Pr3+. Although, the Pr3+ has two pump absorption bands having their peaks centered at 1010 and 1400 nm, but the pump wavelengths in 1000–1040 nm wavelength range are widely used to excite the Pr3+ [3,16,19,23,25]. Similarly, the emission starts at 1220 nm but emission cross-section is maximum around 1300 nm.
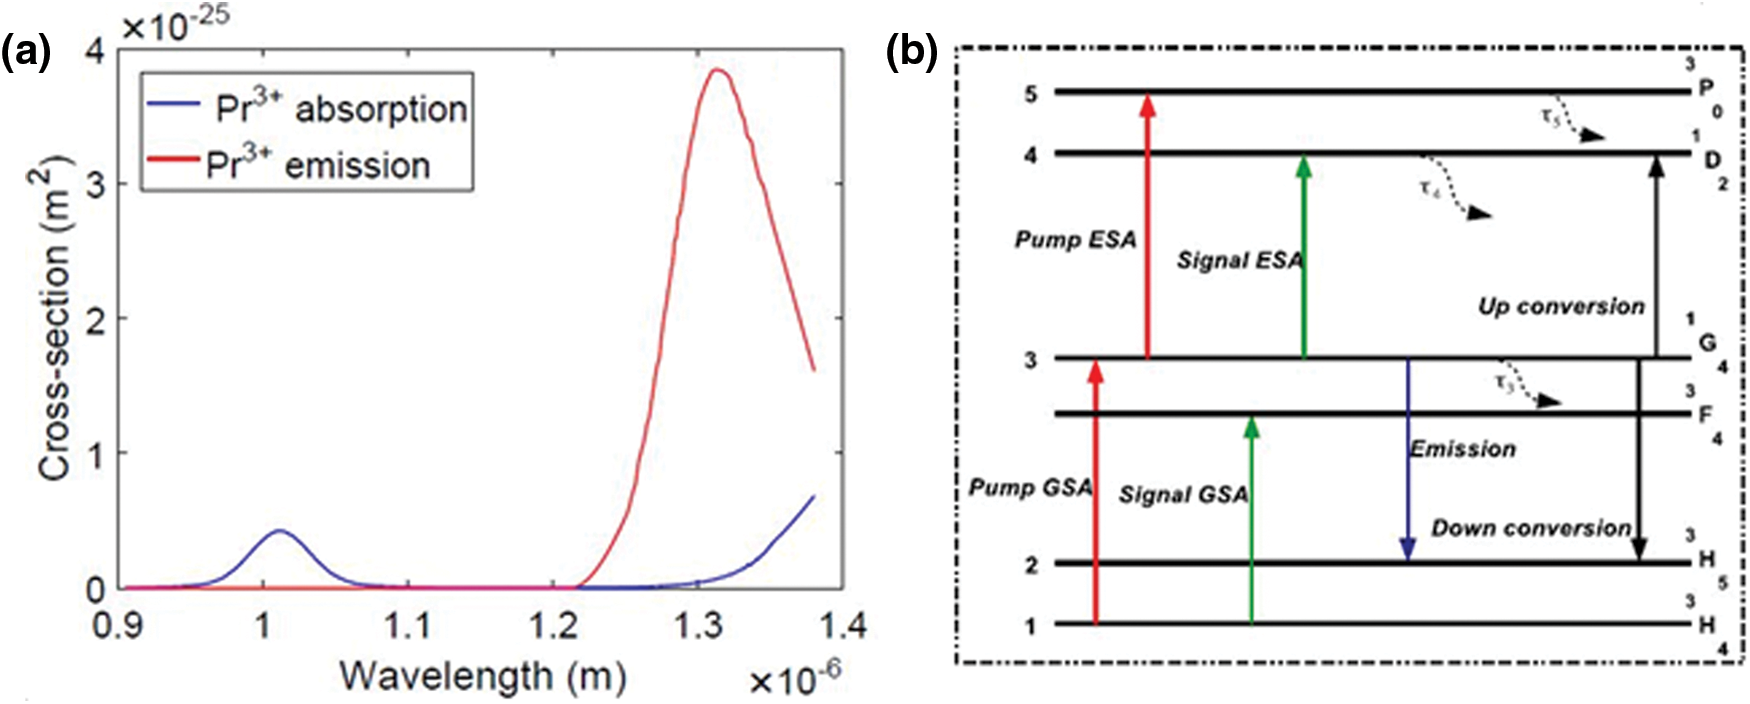
Figure 1: (a) Pr3+ absorption and emission spectra (b) Energy level diagram
The simplified energy level diagram of Pr3+ based on four-level absorption and radiative transitions is shown in Fig. 1b. It may be observed that the main transitions among energy levels are labelled as 1G4, 3P0, 1D0, 3F4, 3F3, 3H5, and 3H4 [28]. 1G4 ↔ 3H4 transitions enable the pump GSA and emission. Similarly, 3H4 → 3F4 and 1G4 → 3H5 transitions hold signal GSA and signal emission. Moreover, the carrier density of 1G4 level can be decreased by the up-conversion effect due to the 1G4 → 1D2 and 1G4→ 3H5 transitions [29] because energy difference between 1G4 and 1D2 levels equals to energy difference between 1G4 and 3H5 levels [3,29]. The carrier densities at each level are represented as n1, n2, n3, n4, and n5 and the total density nt is given by:
Based on the above discussion, the rate equations for energy level diagram of Pr3+ as shown in Fig. 1b can be written as [23]:
In expressions (2) to (4), the transition rates γ13, γ31, γ32, γ34 and γ35 are given by
The small-signal gain of the PDFA completely depends upon the transitions between 3H4 and 1G4 levels having the carrier densities of n1 and n3, respectively. When a signal passes through the gain medium of PDFA having thickness of dz, then the propagation equation of signal can be written as [29]:
In above expression, the σ34 is the excited state absorption (ESA) cross-section at the signal wavelength which is not considered by OptiSystem. Therefore, the small-signal gain achieved is given by [29]:
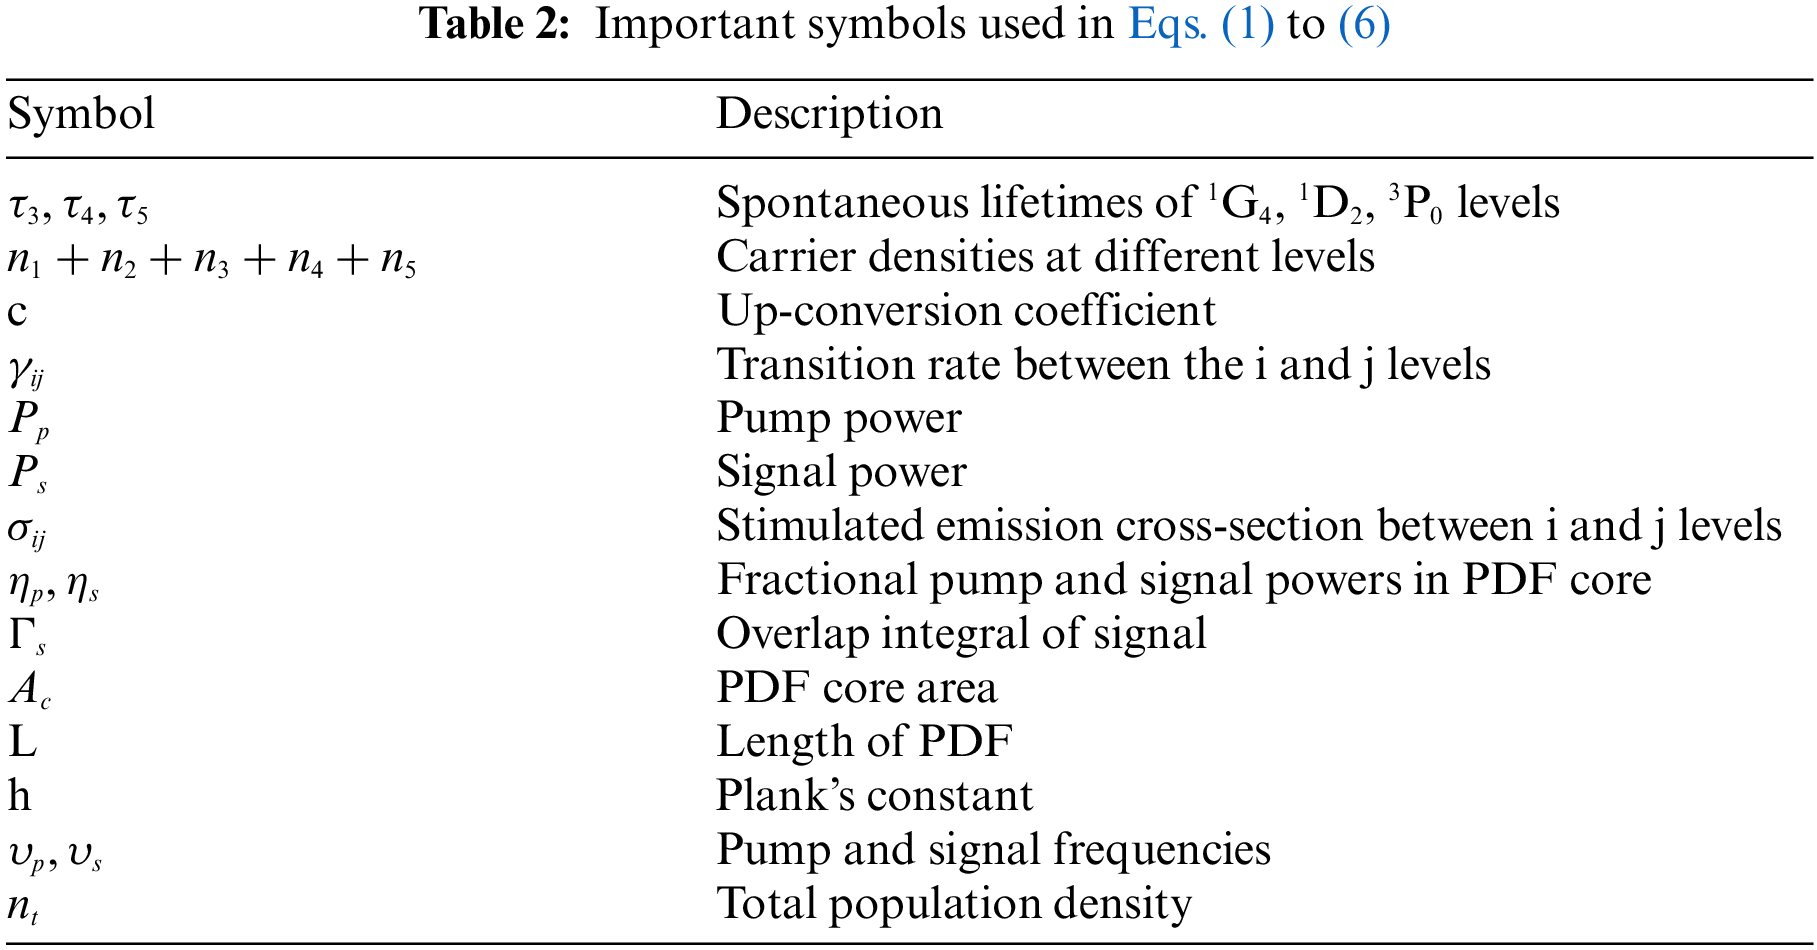
where L is the length of PDF. Tab. 2 describes the various symbols mentioned in Eqs. (1) to (6).
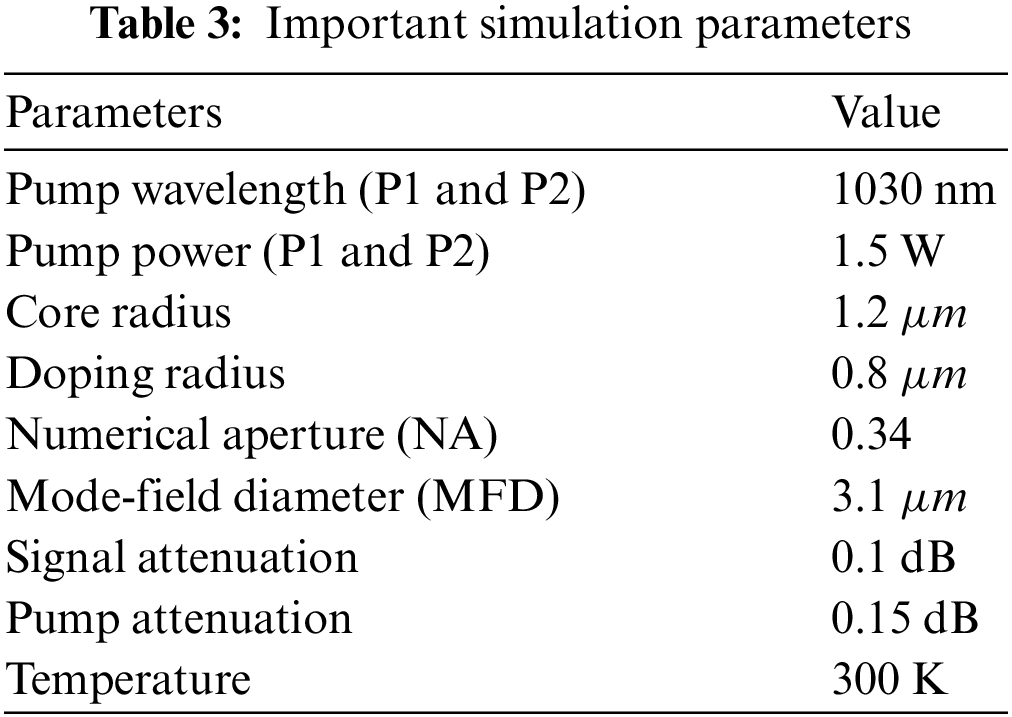
The simulation setup implemented to observe the performance of the PDFA is shown in Fig. 2. The gain medium of the amplifier is excited through bidirectional pumps (P1 and P2), where each pump has power and wavelength of 1.5 W and 1030 nm, respectively. Two isolators are also employed in the setup to stop the back reflections from entering the PDF and the continuous wave (CW) laser source. The Pr3+ ions in gain medium of the amplifier get excited from ground energy level (3H4) to higher energy level (1G4) via GSA [3]. As a results, the emission takes place via radiative decay from higher energy level (1G4) to first excited level (1H5) [3]. Dual port WDM analyzer, optical power meter (OPM), and optical spectrum analyzer (OSA) are used for monitoring the results and their analysis. The PDF is one of the most important components of the PDFA which significantly affects the overall performance of the PDFA. The OptiSystem has internally defined the absorption and emission cross-sections for Pr3+ as per specification of the commercially available PDF developed by FiberCore. Various important parameters of PDF such as PDF length, Pr3+ concentration, diameter of the core, MFD and numerical aperture (NA) used in simulations are according to the specifications of commercially available components. The important simulation parameters and their values have been shown in Tab. 3.
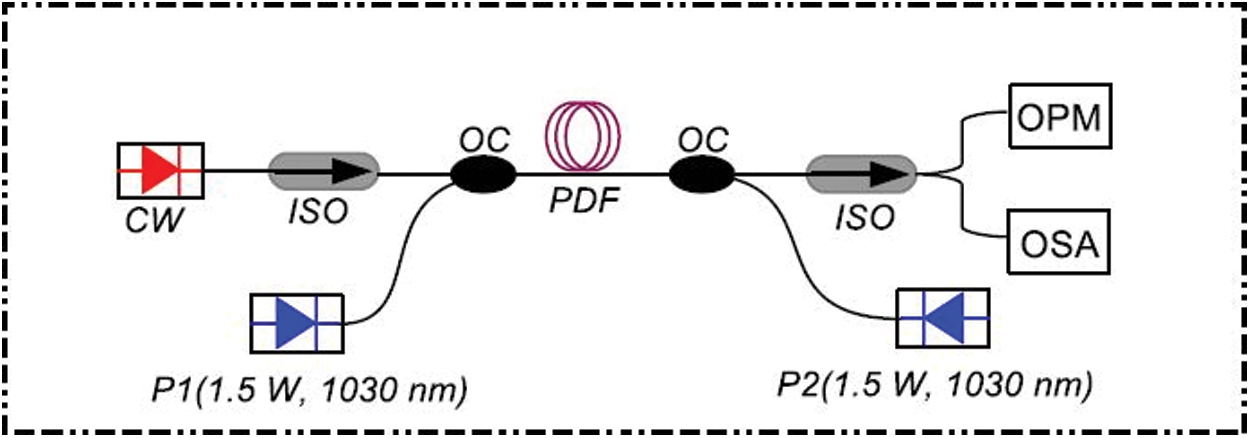
Figure 2: Simulation set-up for PDFA, CW: Continuous wave laser, P1/P2: Bidirectional pumps,OC: WDM Optical coupler, ISO: Optical isolator, PDF: Praseodymium doped fiber, OSA: Optical spectrum analyzer and OPM: Optical power meter
Length of PDF, Pr3+ concentration, and MFD are three major design parameters that have a significant effect on the performance of the PDFA [3,25,30]. Therefore, these parameters require proper optimization in order to obtain a high performance PDFA. The performance in terms of gain of the amplifier is evaluated at different lengths of the PDF while keeping the concentration of Pr3+, MFD of the fiber, pump and signal powers at 50 × 1024 m−3, 4.3 μm, 3 W and −30 dBm, respectively as shown in Fig. 3a. It may be observed that the small-signal gain of the PDFA increases as the length of the PDF is increased. This trend can be explained by considering Eq. (6) which shows that the gain of the PDFA depends upon the length of PDF and carrier density at ground state energy level. Moreover, for signal wavelength of 1310 nm, small-signal gain equal to 55.3 and 55.6 dB is observed at PDF lengths of 15 and 20 m, respectively. Since the difference between the gain is negligible for both the PDF lengths, we choose the smaller length of 15 m as the optimized length It may also be observed that there is no significant increase in small-signal gain for PDF lengths of 15 and 20 m, which is due to decrease in population inversion for lengths above 15 m [3,30]. Moreover, for a fixed pump power, the gain saturates at PDF length of 15 m because this limited pump power is not enough to introduce a complete population inversion throughout the PDF, as discussed in [11,31].
Fig. 3b shows signal wavelength versus gain plots as a function of Pr3+ concentration at PDF length, MFD, pump and signal powers of 15 m, 4.3 μm, 3 W and −30 dBm, respectively. It may be observed that peak gain equal to 55.3 dB is obtained when Pr3+ concentration is 50 × 1024 m−3 for signal wavelength of 1310 nm. Again, becomes clear that the small-signal gain of the PDFA increases on increasing the Pr3+ concentration, as explained Eq. (6), which shows that the gain of the PDFA also depends on carrier density at ground state energy level. The small-signal gain tends to saturate after the optimal value of Pr3+ concentration. As Pr3+ ions reside in pairs called clusters, the degree of clustering in PDF increases by increasing the doping concentration, leading to the loss of pumping efficiency [32]. Therefore, increasing the doping concentration reduces or saturates the gain due to up-conversion. Finally, Fig. 3c shows signal wavelength vs. gain plots for different values of MFD at PDF length, Pr3+ concentration, pump and signal powers of, 15 m, 50 × 1024 m−3, 3 W and −30 dBm, respectively. It may be observed that the small-signal gain of the PDFA is around 55.3, 55.7, 56.4 and 56.5 dB at MFD values of 4.3, 3.6, 3.1 and 2.6 μm, respectively, for signal wavelength of 1310 nm. Since the difference between the gain is negligible for MFD values of 3.1 and 2.6 μm, the MFD of 3.1 μm is considered as optimized MFD. Typically, the MFD of a fiber is always greater than the physical diameter of its core [33]. It means that some fraction of optical power is always guided by the fiber cladding. A decrease in MFD means that the mode of the source is matched to that of the fiber and so maximizes the launching efficiency, resulting in an increase of small-signal gain [33].
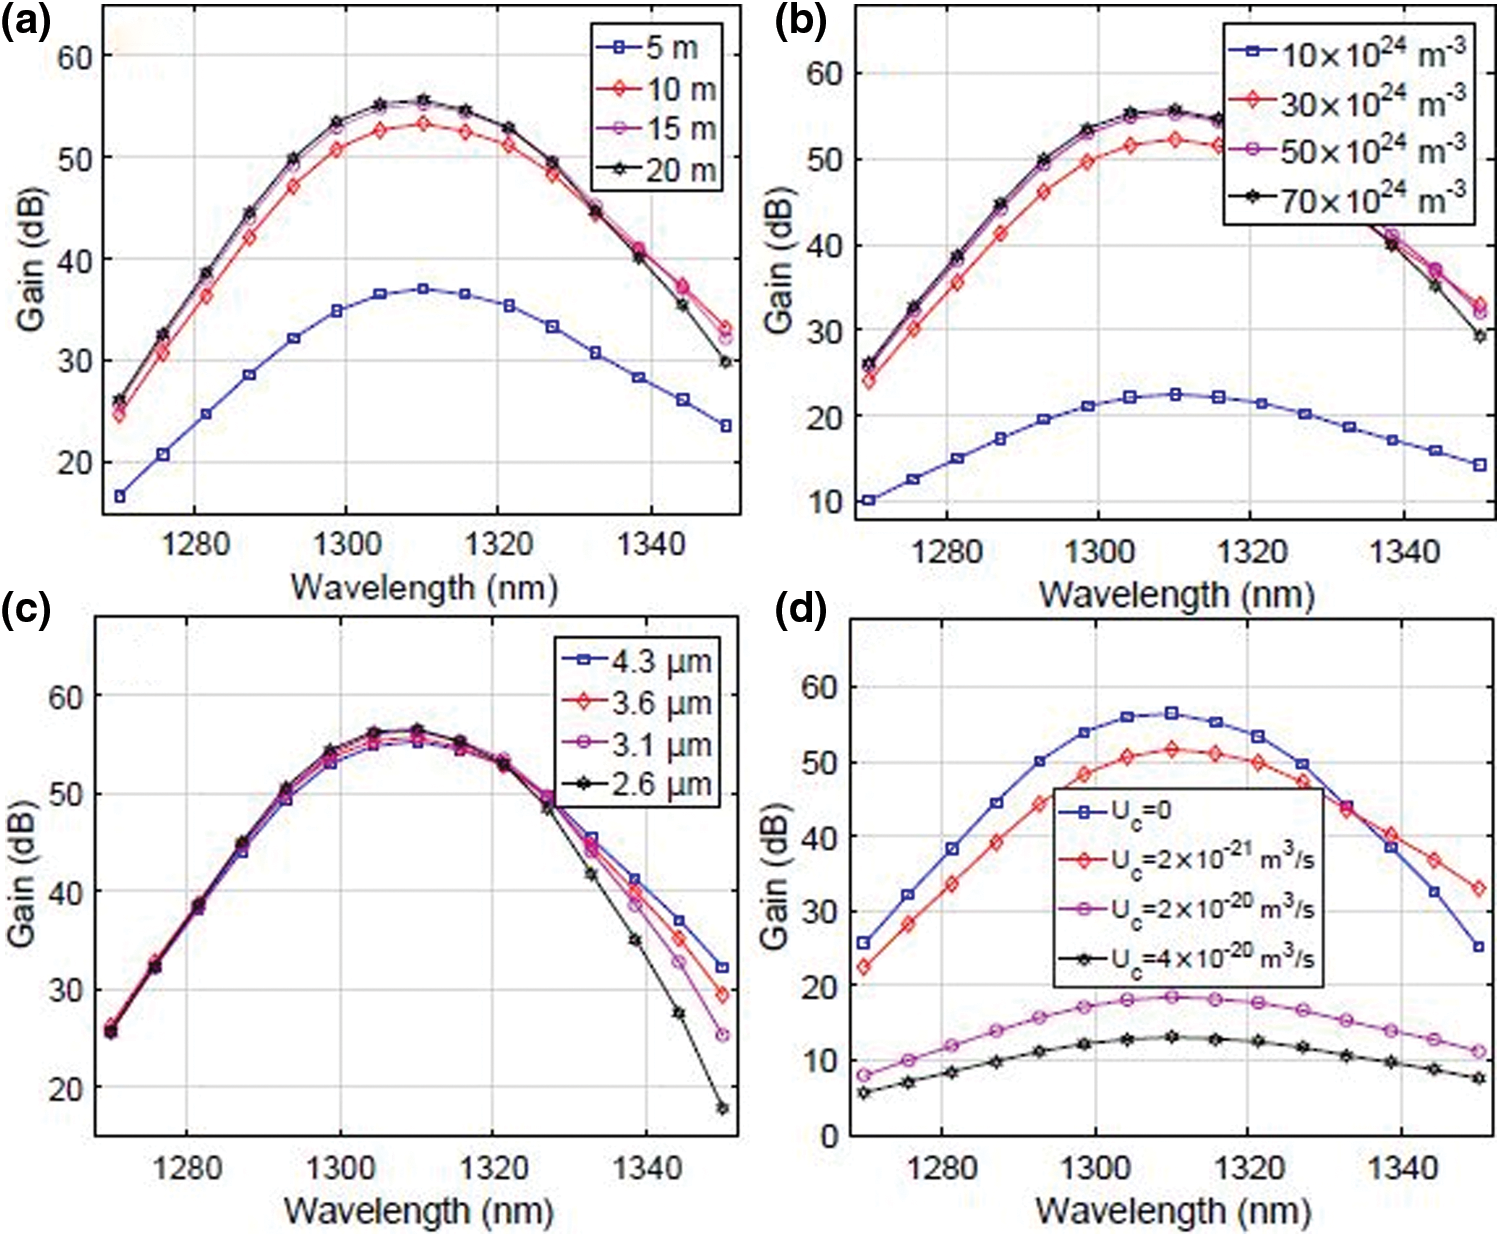
Figure 3: Signal wavelength vs. gain plots at different values of (a) PDF length (b) Pr3+ concentration (c) MFD (d) Up-conversion coefficient
The up-conversion effect is an ion-ion interaction and its impact on the PDFA performance is linked to the concentration of Pr3+ in PDF. For PDF having a high concentration of Pr3+ such that nt > 50 × 1024 m−3, the up-conversion tends to degrade the performance of PDFA [34]. In highly doped PDFs, about 10% of Pr3+ ions remain in the ground state, even for high pump powers. When both ions in the pairs are pumped, they rapidly undergo the up-conversion, leading to the loss of pumping efficiency [34]. Fig. 3d shows signal wavelength vs. gain plots for different values of up-conversion coefficient by considering the optimized values of PDF length, Pr3+ concentration, and MFD, while pump and signal powers are 3 W and −30 dBm, respectively. It may be observed that the small-signal gain of the PDFA is highest, having a value of 56.4 dB in the absence of up-conversion effect for signal wavelength of 1310 nm. The gain reduces to 51.7, 18.5 and 13.1 dB by considering the up-conversion effect for up-conversion coefficients of 2 × 10⁻²¹ m3 s−1, 2 × 10⁻²⁰ m3 s−1, and 4 × 10⁻²⁰ m3 s−1, respectively.
Mathematically, the PCE of PDFA is defined as [3]:
Pin, Pout, and Pp are the powers of input signal, amplified signal, and pump respectively. We plot pump power against the output optical power at different signal powers to evaluate the PCE of the PDFA for PDF length, Pr3+ concentration, and MFD of 15 m, 50 × 1024 m−3, and 3.1 μm respectively. It is clear from Fig. 4a that the maximum PCE of 47% is obtained when the signal has a power of 0 dBm, while a minimum value PCE of 41% is obtained when the signal power is at −30 dBm. Furthermore, it may also be observed that the lasing threshold is lower when the signal power is higher and vice versa, at a fixed value of pump power, PDF length, Pr3+ concentration, and MFD. Similarly, Fig. 4b shows signal wavelength vs. output power plots of the amplifier as a function of signal power for PDF length, Pr3+ concentration, MFD, and pump power of 15 m, 50 × 1024 m−3, 3.1 μm, and 3 W, respectively. It may be observed that highest output power of 1.6 W is obtained at signal power of 0 dBm.
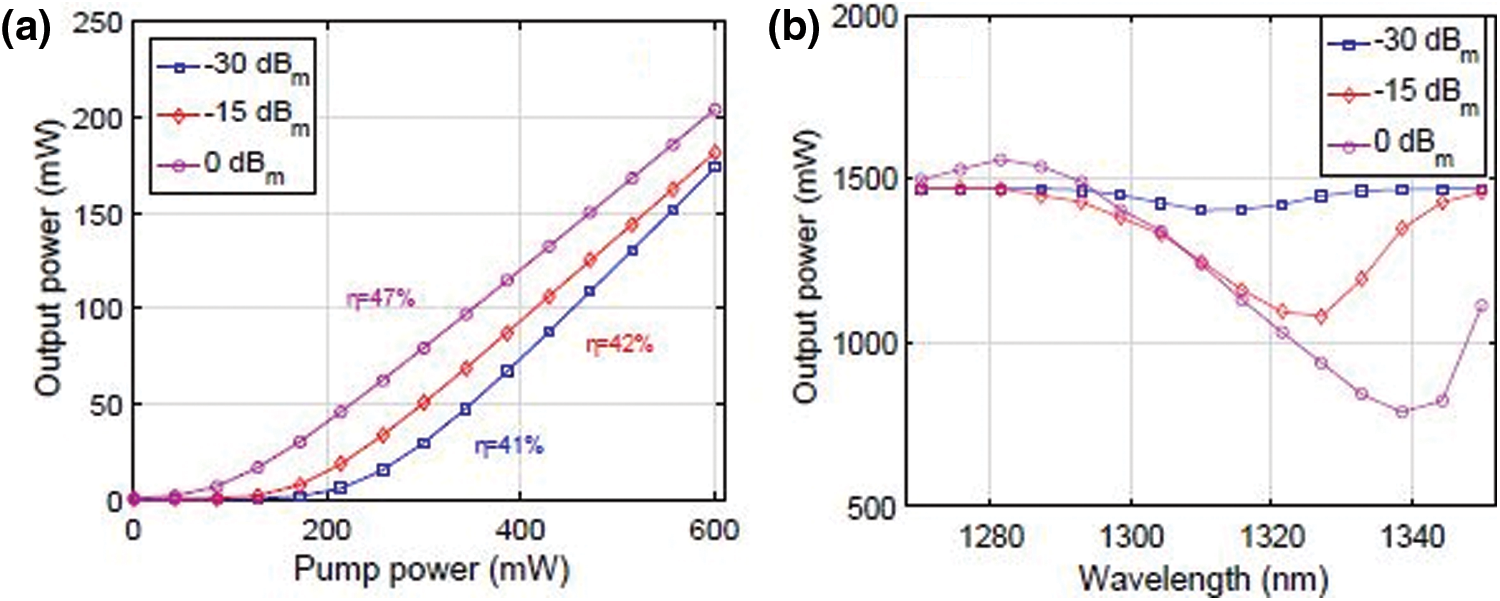
Figure 4: (a) Pump power vs. output power plots as a function of signal power (b) Signal wavelength vs. output power plots as a function of signal power
To consider the effect of variation of pump wavelength on output optical power of the PDFA, we have plotted the wavelength of pump (P1) against output optical power at different pump powers for signal power of 0 dBm while keeping the wavelength of the pump (P2) fixed at 1030 nm as shown in Fig. 5a. It is evident from Fig. 5a that output optical power of the PDFA first starts increasing slowly in 1020–1080 nm wavelength ranges from 25.5, 29 and 31 dBm and reaches to 27.34, 31 and 33.5 dBm for pump powers of 1, 2 and 3 W, respectively. Similarly, no significant increase in output optical power of the PDFA can be seen in the wavelength range of 1080–1100 nm for each of the three pump powers. Therefore, we can infer that the PDFA has gone into saturation for wavelengths longer than 1080 nm resulting into no significant increase in output optical power of the amplifier for each value of pump powers as shown in Fig. 5a. This particular behavior of the PDFA can be explained by observing Fig. 1a. It is clear that pump absorption exists in the 960–1080 nm wavelength range for Pr3+. There is a gradual decrease in pump absorption of Pr3+ for wavelengths longer than 1080 nm, which results into a decrease in the small-signal gain of the PDFA and consequently, the output optical power of PDFA stops increasing further [3]. Fig. 5b shows the plot between signal wavelength and ASE noise power as a function of pump power by considering an optimized PDF length, Pr3+ concentration, and MFD for signal power of −30 dBm. It is obvious that the peak ASE is around −1.1 dBm at pump power of 1 W for signal wavelength of 1310 nm. It increases to 2.7 and 4.7 dBm for pump powers of 2 and 3 W, respectively at signal wavelength of 1310 nm. As a result of increasing the pump power, the number of photons generated due to spontaneous emission during the process of optical amplification also increases. Therefore, the ASE noise power also increases with an increase in pump power. Moreover, it may be noticed that the ASE exhibits a decreasing trend for longer wavelengths, which is due to poor population inversion at longer wavelengths [19]. Furthermore, a 3 dB ASE bandwidth of 25 nm is obtained for pump power of 3 W.
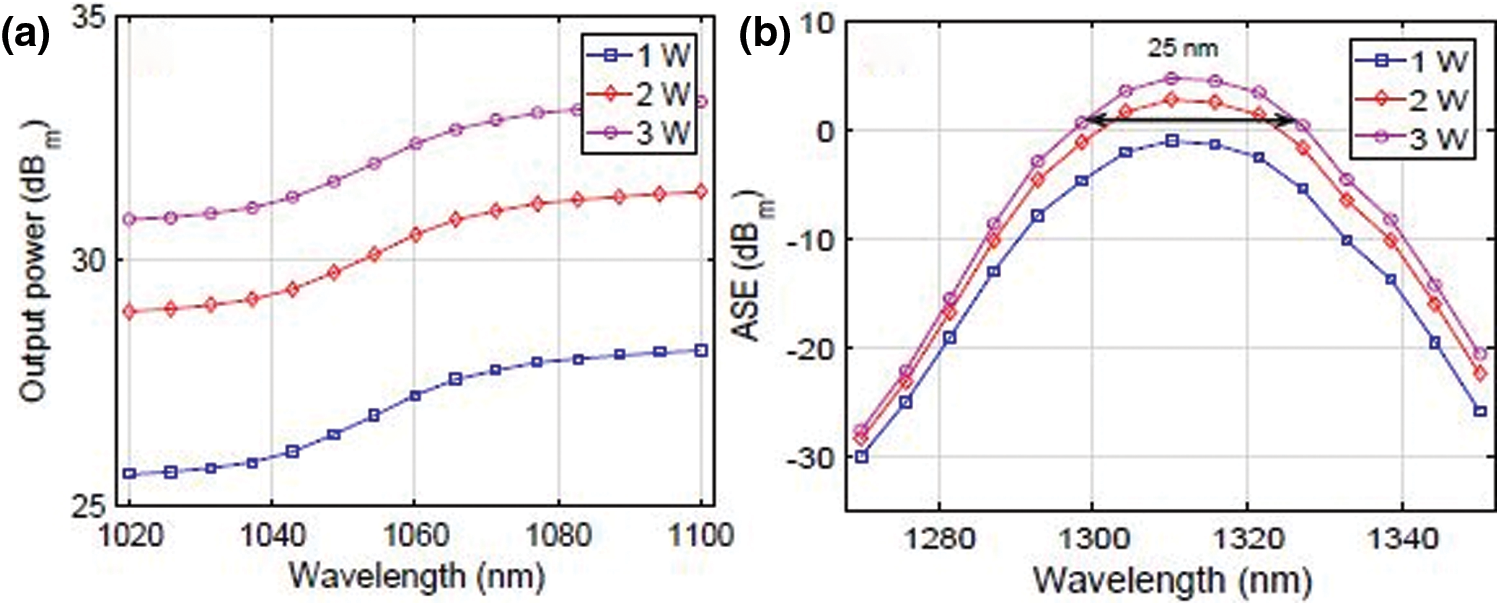
Figure 5: (a) Pump wavelength vs. output power plots as a function of pump powers (b) Signal wavelength vs. ASE plots as a function of pump power
The NF is an important criterion used in characterizing the performance of an optical amplifier. It is the ratio of the input to output signal to noise ratios (SNRs) of the amplifier and can be expressed in dB as [3]:
As a result of spontaneous emission occurring along with stimulated emission inside the doped region of the amplifier, some undesired photons are generated and added to the signal photons, thus reducing the overall SNR of the signal at the output of the amplifier. Therefore, NF is considered to be one of the crucial parameters which can readily reflect the system performance. Fig. 6 shows the signal wavelength vs. NF plots as a function of signal power for an optimized PDF length, Pr3+ concentration, and MFD for pump power of 3 W. NF equal to 4.1 dB, 4.8 dB, and 5.7 dB is observed at wavelength of 1310 nm for signal powers of −30 dBm, −15 dBm and 0 dBm, respectively, as shown in Fig. 6. It is also clear that NF increases on decreasing the signal powers, which is due to the fact that ASE boosts abruptly when signal is weak.
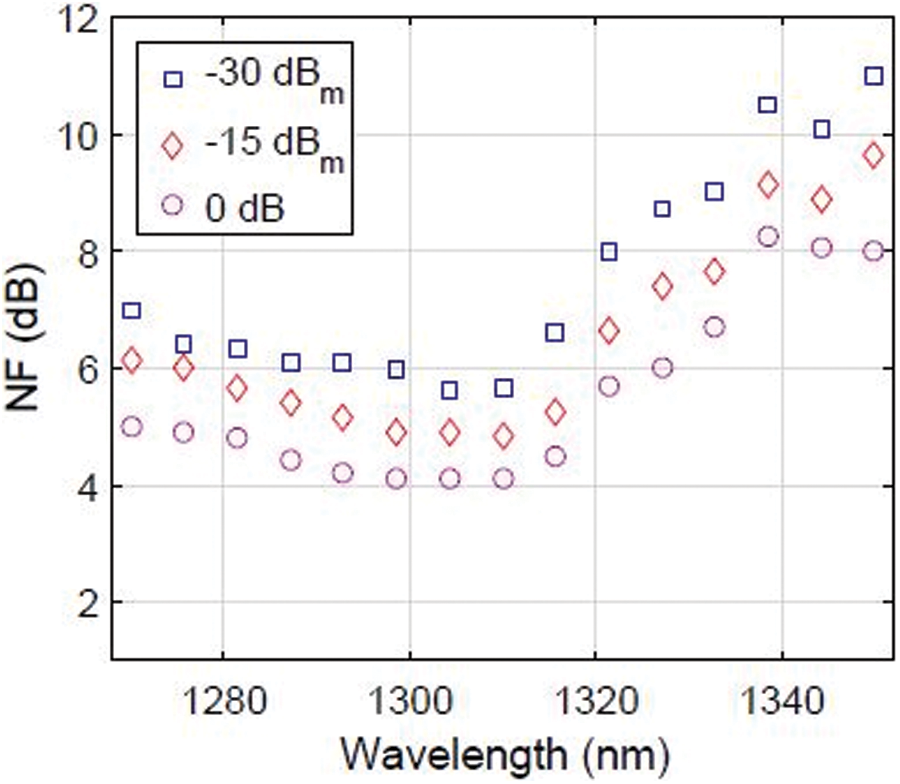
Figure 6: Signal wavelength vs. NF plot as a function of signal power
The performance enhancement of PDFAs in 1270–1350 nm wavelength range based on bidirectional pumping has been reported. A substantial increase in small signal gain, power conversion efficiency, and output optical power of PDFA are observed by considering an optimized length of PDF, Pr3+ concentration, and mode-field diameter. A highest ever small-signal gain, power conversion efficiency, and output optical power of 56.4 dB, 47%, and 1.6 W, respectively are obtained. The effect of up-conversion on performance of the PDFA is also studied.
Funding Statement: The authors received no specific funding for this study.
Conflicts of Interest: The authors declare that they have no conflicts of interest to report regarding the present study.
References
1. J. Mirza, W. A. Imtiaz, A. J. Aljohani and S. Ghafoor, “A high bit rate free space optics based ring topology having carrier-less nodes,” IET Communications, vol. 15, no. 11, pp. 1530–1538, 2021. [Google Scholar]
2. J. Mirza, W. A. Imtiaz, A. J. Aljohani, A. Atieh and S. Ghafoor, “Design and analysis of a 32 × 5 Gbps passive optical network employing FSO based protection at the distribution level,” Alexandria Engineering Journal, vol. 59, no. 6, pp. 4621–4631, 2020. [Google Scholar]
3. J. Mirza, S. Ghafoor, N. Habib, F. Kanwal and K. K. Qureshi, “Performance evaluation of Praseodymium doped fiber amplifiers,” Optical Review, vol. 28, no. 6, pp. 611–618, 2021. [Google Scholar]
4. H. Tawarayama, E. Ishikawa, K. Yamanaka, K. Itoh, K. Okada et al., “Optical amplification at 1.3 μm in a praseodymium-doped sulfide-glass fiber,” Journal of the American Ceramic Society, vol. 83, no. 4, pp. 792–796, 2000. [Google Scholar]
5. M. C. Paul, A. Dhar, S. Das, M. Pal, S. K. Bhadra et al., “Enhanced erbium-zirconia–yttria-aluminum co-doped fiber amplifier,” IEEE Photonics Journal, vol. 7, no. 5, pp. 1–7, 2015. [Google Scholar]
6. D. Sliwinska, P. Kaczmarek, G. Sobon and K. M. Abramski, “Double-seeding of Er/Yb co-doped fiber amplifiers for controlling of Yb-ASE,” Journal of Lightwave Technology, vol. 31, no. 21, pp. 3381–3386, 2013. [Google Scholar]
7. ThorLabs, “O-band booster optical amplifiers (BOAshttps://www.thorlabs.com/newgrouppage9.cfm?objectgroup_id=3990. [Google Scholar]
8. Praseodymium doped fiber amplifiers, https://www.fiberlabs.com/glossary/praseodymium-doped-fiber-amplifier/. [Google Scholar]
9. E. A. Anashkina and A. V. Kim, “Numerical simulation of ultrashort mid-IR pulse amplification in Praseodymium doped chalcogenide fibers,” Journal of Lightwave Technology, vol. 35, no. 24, pp. 5397–5403, 2017. [Google Scholar]
10. E. A. Anashkina, “Design and numerical modeling of broadband mid-IR rare-earth-doped chalcogenide fiber amplifiers,” IEEE Photonics Technology Letters, vol. 30, no. 13, pp. 1190–1193, 2018. [Google Scholar]
11. J. Hu, C. R. Menyuk, C. Wei, L. B. Shaw, J. S. Sanghera et al., “Highly efficient cascaded amplification using Pr3+ doped mid-infrared chalcogenide fiber amplifiers,” Optics Letters, vol. 40, no. 16, pp. 3687–3690, 2015. [Google Scholar]
12. J. Hu, C. R. Menyuk, C. Wei, L. B. Shaw, J. S. Sanghera et al., “Pr3+-doped midinfrared chalcogenide fiber amplifiers using cascaded amplification,” in Proc. of CLEO, San Jose, CA, USA, pp. 1–2, 2016. [Google Scholar]
13. M. A. Khamis, R. Sevilla and K. Ennser, “Large mode area Pr3+-doped chalcogenide PCF design for high efficiency mid-IR laser,” IEEE Photonics Technology Letters, vol. 30, no. 9, pp. 825–828, 2018. [Google Scholar]
14. S. Philippe, M. Lynch and J. F. Donegan, “Polarization dependent gain in Pr3+/Yb3+ doped fluoride fibre,” in Proc. of ICTON, Athens, Greece, 3, pp. 223–226, 2008. [Google Scholar]
15. M. Shen, D. Furniss, Z. Tang, E. Barny, L. Sojka et al., “Modeling of resonantly pumped mid-infrared Pr3+ doped chalcogenide fiber amplifier with different pumping schemes,” Optics Express, vol. 26, no. 18, pp. 23641–23660, 2018. [Google Scholar]
16. A. K. M. Husein and F. I. El-Nahal, “Noise figure and gain temperature dependent of Praseodymium-doped fiber amplifier by using rate equations,” Optics communications, vol. 283, no. 3, pp. 409–413, 2010. [Google Scholar]
17. L. F. Shen, B. J. Chen, H. Lin and E. Y. B. Pun, “Praseodymium ion doped Phosphate glasses for integrated broadband ion-exchanged waveguide amplifier,” Journal of Alloys and Compounds, vol. 622, pp. 1093–1097, 2015. [Google Scholar]
18. X. Liu, B. J. Chen, E. Y. B. Pun and H. Lin, “Ultra-broadband near-infrared emission in Praseodymium ion doped Germanium-Tellurite glasses for optical fiber amplifier operating at E-, S-, C-, and L-band,” Journal of Applied Physics, vol. 111, pp. 116101, 2012. [Google Scholar]
19. R. C. Schimmel, H. J. D. van de Sluis, R. J. W. Jonker and H. de Waardt, “Characterisation and modelling of Praseodymium doped fibre amplifiers,” in Proc. of IEEE/LEOS, Brussels, Belgium, Benelux Chapter, pp. 133–136, 2001. [Google Scholar]
20. L. Chorchos and J. P. Turkiewicz, “Experimental performance of semiconductor optical amplifiers and Praseodymium doped fiber amplifiers in 1310-nm dense wavelength division multiplexing system,” Optical Engineering, vol. 56, no. 4, pp. 46101, 2017. [Google Scholar]
21. V. Shiryaev, E. Anashkina, E. Karaksina and T. Kotereva, “Experimental and numerical study of emission properties of Pr3+ doped Ga (In)-Ge-As-Se Glass fibers,” in Proc. of ICTON, Angers, France, pp. 1–4, 2019. [Google Scholar]
22. Y. Nishida, M. Yamada, T. Kanamori, K. Kobayashi, J. Temmyo et al., “Development of an efficient Praseodymium doped fiber amplifier,” IEEE Journal of Quantum Electronics, vol. 34, no. 8, pp. 1332–1339, 1998. [Google Scholar]
23. Y. Ohishi, T. Kanamori, T. Nishi, S. Takahashi and E. Snitzer, “Concentration effect on gain of Pr3+-doped Fluoride fiber for 1.3 μm amplification,” IEEE Photonics Technology Letters, vol. 4, no. 12, pp. 1338–1341, 1992. [Google Scholar]
24. J. A. Valles, J. A. Lazaro, M. Hotoleanu, M. Karasek and E. Voiculescu, “Analysis of gain and noise performance of bidirectionally pumped Pr3+ doped Fluoride fibre amplifier configurations with unbalanced pumping,” Journal of Modern Optics, vol. 45, no. 12, pp. 2551–2560, 1998. [Google Scholar]
25. V. Morin and E. Taufflieb, “High output-power Praseodymium doped fiber amplifier singlepumped at 1030 nm: Analysis and results,” IEEE Journal of Selected Topics in Quantum Electronics, vol. 3, no. 4, pp. 1112–1118, 1997. [Google Scholar]
26. M. Sek, “Fast power transients in concatenated Pr3+ doped Fluoride fiber amplifiers,” Journal of Lightwave Technology, vol. 16, no. 3, pp. 358–363, 1998. [Google Scholar]
27. T. Whitley, “A review of recent system demonstrations incorporating 1.3 μm Praseodymium doped Fluoride fiber amplifiers,” Journal of Lightwave Technology, vol. 13, no. 5, pp. 744–760, 1995. [Google Scholar]
28. Optiwave, “OptiSystem overview, [Online]. Available: https://optiwave.com/optisystem-overview/. [Google Scholar]
29. C. Berkdemir and S. Ozsoy, “Modelling consideration of Praseodymium-doped fiber amplifiers for 1.3 μm wavelength applications,” Optics Communications, vol. 269, no. 1, pp. 102–106, 2007. [Google Scholar]
30. S. Mukhtar, K. N. Aliyu and K. K. Qureshi, “Performance evaluation of Er3+/Yb3+ co-doped fiber amplifier,” Microwave and Optical Technology Letters, vol. 62, no. 6, pp. 2243–2247, 2020. [Google Scholar]
31. L. Zhang, Y. Du, Y. Xi, J. Li and C. Zhao, “Gain characteristics of Erbium doped fiber amplifier,” in Proc. of SPIE, Beijing, China7157, pp. 303–308, 2009. [Google Scholar]
32. M. Z. Amin and K. K. Qureshi, “Investigation of clustering effects on Erbium-doped fiber laser performance,” Chinese Optics Letters, vol. 15, no. 1, pp. 010601–010605, 2017. [Google Scholar]
33. A. Nakamura, K. Okamoto, Y. Koshikiya and T. Manabe, “Effective mode field diameter for LP11 mode and its measurement technique,” IEEE Photonics Technology Letters, vol. 28, no. 22, pp. 2553–2556, 2016. [Google Scholar]
34. P. Myslinski, D. Nguyen and J. Chrostowski, “Effects of concentration on the performance of Erbium-doped fiber amplifiers,” Journal of Lightwave Technology, vol. 15, no. 1, pp. 112–120, 1997. [Google Scholar]
 | This work is licensed under a Creative Commons Attribution 4.0 International License, which permits unrestricted use, distribution, and reproduction in any medium, provided the original work is properly cited. |