| Computers, Materials & Continua DOI:10.32604/cmc.2022.029484 | |
| Article |
Optimum Design for the Magnification Mechanisms Employing Fuzzy Logic–ANFIS
1Faculty of Automobile Technology, Industrial University of Ho Chi Minh City, Ho Chi Minh City, 70000, Vietnam
2Faculty of Mechanical Technology, Industrial University of Ho Chi Minh City, Ho Chi Minh City, 70000, Vietnam
3Faculty of Mechanical Engineering, Hung Yen University of Technology and Education, Hung Yen, 160000, Vietnam
*Corresponding Author: Quoc Manh Nguyen. Email: nguyenquocmanh@utehy.edu.vn
Received: 04 March 2022; Accepted: 19 May 2022
Abstract: To achieve high work performance for compliant mechanisms of motion scope, continuous work condition, and high frequency, we propose a new hybrid algorithm that could be applied to multi-objective optimum design. In this investigation, we use the tools of finite element analysis (FEA) for a magnification mechanism to find out the effects of design variables on the magnification ratio of the mechanism and then select an optimal mechanism that could meet design requirements. A poly-algorithm including the Grey-Taguchi method, fuzzy logic system, and adaptive neuro-fuzzy inference system (ANFIS) algorithm, was utilized mainly in this study. The FEA outcomes indicated that design variables have significantly affected on magnification ratio of the mechanism and verified by analysis of variance and analysis of the signal to noise of grey relational grade. The results are also predicted by employing the tool of ANFIS in MATLAB. In conclusion, the optimal findings obtained: Its magnification is larger than 40 times in comparison with the initial design, the maximum principal stress is 127.89 MPa, and the first modal shape frequency obtained 397.45 Hz. Moreover, we found that the outcomes obtained deviation error compared with predicted results of displacement, stress, and frequency are 8.76%, 3.6%, and 6.92%, respectively.
Keywords: Compliant mechanism; grey relational analysis; taguchi method; multi-objective optimization; fuzzy logic system; adaptive neuro-fuzzy inference system (ANFIS)
Recent theoretical development has revealed that the study of the growth of effectively exact positioning-mechanisms has many challenges. As a result of the basic requirement for cutting edge advances in a few enterprises, for example, semiconductor production, where super exact machining and miniature electro-mechanical-frameworks (MEMS) are obligatory. For instance, the size of 0.15-l (130 nm) measurement on 300 mm silicon-wafer created with a 65 nm cycle would be realized early. Other activating systems and control methodologies are fundamental to overwhelm the current restrictions and get an accuracy position in the nanometer dimension. One technique for taking care of this sort of issue is to plan new flexure pivots fueled by piezoelectric actuators. The inalienable highlights of piezoelectric actuators (piezo actuators for short) make them tremendously alluring for driving components in these exactness position applications since they give smooth movements. They are interminable control goals, quick reaction time, and high intransigence. Nonetheless, they have experienced the failure effects of the genuine constraint of a little longitudinal expansion. Ordinary piezo actuators broaden just about 0.1% of their length. To straightforwardly utilize, the piezo actuator to make an ideal scope of movement in various applications and an extended actuator is required. This is unrealistic. To sidestep this restriction and understand the low scope of work, with an accuracy position of a few nanometers, an amplification system utilizing adaptable pivots and driven by a piezo actuator can be used. The magnification mechanism has a compact size, high magnification ratio, high frequency, and lightweight. Therefore, the leaf flexible hinge is selected for the mechanism. To select appropriated dimensions for the mechanism, this investigation proposes a hybrid Taguchi approach based on grey relational analysis and neural network with fuzzy logic and ANFIS algorithms [1–5].
The problem with such an implementation is that many flexure hinges are designed for many compliant mechanisms to eliminate the effects of clearance joints. The circular flexure hinge is designed for the 3-degree of freedom (DOF) mechanism, and 3-DOF parallel mechanism [6–8], the stress distribution at all critical points, natural frequencies, and the corresponding modal shape estimated and verified by experiment. The dynamic performance of the 3-DOF flexible mechanical system is determined by FEA and verified by experiments. A recent study by Xu et al. [9] concluded designing a compliant mechanism flexible hinge by employing many optimum approaches such as particle swarm optimization, the Taguchi method, grey relational analysis, and artificial neural network [10–14]. The shaped flexure hinges were designed for many applications as presented in the reference [15]. The shaped flexure hinges obtained higher motion precision than the circular and V-shaped flexure hinges(such as the general-two segments, circular-axis, symmetry flexure-hinges) was proposed by Lobontiu et al. [16]. The novel circular-axis flexure design was compared with the existing straight-axis right circular flexure hinge. The leaf flexible hinge was created by Qi et al. [17], which the amplification ratio of the mechanism was determined and compared with existing methods and verified by the experiment. The Triple- Lamina Emergent Torsional (LET) and LET flexible hinge was manufactured by Qiu et al. [18]. Triple-LET flexible hinge could obtain 1800 without plastic deformation. Three traditional flexible hinges, filleted V-shaped flexure hinges, and cycloidal hinge were designed by Tian et al. [19]. The near form compliant formulation for filleting V-shape flexure-hinges was established and confirmed via FEA. Yang et al. [20] proposed the filleted leaf and circular flexible hinge. The static responses of the planar symmetric superplastic flexible hinge with different notches were analyzed and compared. The static deformation and the modal shaped frequency were compared to another existing theoretical method and FEA. This is successfully established as described by Choi et al. [21] who designed and manufactured a magnification mechanism model using a flexure hinge and confirmed by the experiment. Chen et al. [22] computed, designed, manufactured new ultra compact decoupled XYZθ stage based on bridge-type compliant mechanism. The experiment outcomes are good agree with the computed results and the finite element analysis outcomes with 2% error for the first natural frequency of stage. The bridge-type compliant mechanism with one output port was improved double output ports by Ling et al. [23]. The improved modeling is also manufactured and experiment. The experiment verified that the stept response time is 0.8, frequency bandwidth of 120 Hz. The rhombus-tyoe stick-slip having two driven modes was computed and manufactured for the test by Shi et al. [24]. The results pointed out that the stage works stably with input force 1.2 N to 1.6 N, and work velocity with over 400 μm/s at frequency of 800 Hz. Chen et al. [25] applied nonlinear modeling method to analyze and optimize microgripper using the bridge-type amplifier. The model for experiment is also manufactured to verified the analyzed outcomes and the optimized results. The bridge-type mechanism amplifier and scott-russel mechanism were applied for a new compliant XY micro positioning stage by Wu et al. [26]. The model for the test is also manufactured with a workspace of 181.0 μm * 179.5 μm. The new microgripper with high amplifier was designed and manufactured by Wu et al. [27]. The outcomes displacement and the first frequency obtained 548.2 μm and 334 Hz, respectively.
The analysis and optimization are different from the previous investigation, Gey relational analysis (GRA) based Taguchi method (TM) and ANFIS are applied to predicted displacement amplification ratio of magnification mechanism based on analysis of finite element in ANSYS. Most of the research in this field aims to solve this problem. The Taguchi method is an optimization method for one objective. However, many dimensions are requested for optimal design. Therefore, in this investigation, we utilize grey relational analysis to select one optimum case for a magnification mechanism with three objectives. Then the outcomes are verified by analysis of the signal to noise of the Taguchi method, analysis of variance, analysis of regression, Fuzzy logic, and ANFIS. Designed mechanism set up of the finite element model and boundary condition are presented in Section 2. The Grey-Taguchi, Fuzzy logic system, and ANFIS method are presented in Section 3. The outcomes and arguments will be presented in Section 4. The conclusions will be stated in Section 5.
2 Design Mechanism and Setup the Finite Element Model and Boundary Condition
2.1 Design Magnification Mechanism Model
This assumption is supported by the fact that the model of the magnification mechanism is illustrated in Fig. 1. In this study, we propose a projection of the 3 dimension model of the mechanism study. The dimensions A, B, and C are design variables. The flexure hinge thickness is 0.3 mm. When the model presented in this figure was set like the input value at the input position with an external force or displacement. The output position could be moved vertically up called as the output displacement value. And the value of the output displacement per the input displacement was called as the displacement amplification ratio.

Figure 1: Magnification mechanisms employing flexible hinge
2.2 Setup Finite Element Model and Boundary Condition
The magnification mechanism with dimensions as presented in Fig. 1 was designed by using Solid-works and then it was imported into the mechanic’s static structural module of ANSYS to analyze displacement, principal stress, and modal shape frequency. The material AL-7075 was used for this mechanism as listed in Tab. 1. The young’s modulus, Poisson’s ratio, and tensile yield strength of the material AL-7075 are 72 GPa, 0.33, 503 MPa, respectively. The model mesh was divided automatically as shown in Fig. 2a. with 68,233 elements and 316,289 nodes, and the element size of 0.5 mm. The boundary condition was set up at the hole surface as the fix support at the A surface, and at the B surface as input displacement of 0.01 mm, see Fig. 2b. When set up a force at input position according to the y axis then the output position will translate according to the y axis.


Figure 2: Meshing for the mechanism, (b) Boundary condition
The TM employed by Minitab 18 software to create an orthogonal array. The optimal output characteristics is obtained like the theoretical model which has to be pointed out first, before the optimal methods are applied. However, the deviations seem to be very big in scale in comparison with the theoretical model. After that, the optimal methods could not be approving. Hence, in this investigation, we applied the Taguchi approach based on grey relational analysis and an artificial neural network, fuzzy logic system, and ANFIS to optimize these output characteristics. Step 1: Choosing optimization combination parameters for the output characteristics. Step 2: Designing the control factors and their levels. Step 3: Laying-out L27 orthogonal array. Step 4: Carrying out simulation and collecting data. Step 5: Generating the GRA in comparison of the changes in a system undergoing analysis to estimate the importance of the design variable. The GRA is the approach applied to discretize-sequences. Normalization: Rewrite each sequence between 0 and 1 as follow [10,14] and larger the better:
Smaller the better:
Grey relational coefficient (GRC)
Compute grey relational coefficient (GRC).
Here,
Computational GRG: Determine the weight
where
Determination of the total grey-relational-coefficient
Estimation of the normalized coefficient
Determination of the entropy
Here,
Computation of sum of entropy
Determination of the weight
GRG
where n is the quantity of experiment.
Step 6: Analysis of Taguchi [28,29]. The target of the Taguchi method is to optimize the processes for minimizing quality loss by employing an objective function. There are three functions: “the-smaller-the-best”, “the-larger-the-better”, or “the-nominal-the-best”. In this study, the larger the better was used to maximize grey relational grade value. The signal to noise (S/N) ratio was analyzed based on this objective function. “the larger-the better” approach:
where

Figure 3: Set up in Minitab to analyze signal to noise for GRG
Step 7: Analysis of regression equation [30,31]. From the menu bar, clicks on the Stat/Regression/Regression/Fit Regression model. A Regression dialog box appears as illustrated in Fig. 4. In this dialog box clicks on GRG for Response row. And then, selects three variables, A, B, C, for the continuous predictors row. In this dialogue box clicks on Results. At Display of results selects Expanded tables. And last time clicks on ok, clicks on ok. And the results obtained in Eq. (26) as presented in the regression analysis section.

Figure 4: Set up analysis of regression for GRG
Step 8: {Analysis of variance (ANOVA)} [32,33]. From the menu bar, clicks on Stat/ANOVA/General linear model/Fit General linear model from the menu bar. A Regression dialog box appears, as illustrated in Fig. 5. In this dialog box, clicks on GRG for the Response row., And then selects three variables, A, B, and C, for the factors row. In this dialogue box, clicks on Model. And then set up as presented in Fig. 5b and selected OK. And the last one clicks on OK. The results of ANOVA were analyzed in Section 4.6.

Figure 5: Set up analysis of variance for GRG
Step 9: Analysis of mean and predicted outcomes [34,35]. Practices as presented in the analysis of the signal to noise section. The outcomes of the analysis of mean were analyzed in Section 4.7.
Step 10: Fuzzy logic system [36–38]. The procedures for handling the data followed the suggestions for designing the controller of the fuzzy logic system (FLS). The controlling mechanism had to collect data on the way the artificial determination-creator responding in the system of closed-loop which could be performed from the knowledgebase. FLSs were built from input fuzzy sets, fuzzy rules, and output fuzzy sets depended on FLS’s initial knowledgebase. Many rules managed and performed the inputs and outputs relationship of that system. Each parameter of inputs and outputs had every single membership function that would have been mentioned among those factor limitations throughout the discourse universe. The greater adaptation of fuzzy factors was set; the finer modification of fuzzy outputs was conducted.
Regarding the reactive control, the vector of fuzzy inputs includes a couple of parameters. The first one is the displacement desirability and the second one is the frequency desirability. In another word, the output of the second stage is the input of the third stage–operated by the FLS. In this stage, the output data of the multi-characteristic performance index (MCPI) would be computed by the FLS. Its controller compared the input numerical and output numerical data to solve the problem and to employ the expected MPCI. There are many parts in a FLS such as (i) a knowledge base, (ii) fuzzier, (iii) inference machine, and (iv) defuzzier. Contributions of the FLS were considered fresh qualities that contain global optimum values of this present reality. Via the fuzzier, the actual worth was changed into an etymological variable. We considered the inference machine framework as a task of enforcement depended on the rules of fuzzy, fuzzy inference systems (FIS). It controlled the way of the consolidated principles. De-fuzzier: De-fuzzier exchanged the yield of the FIS framework into a fresh worth. Regarding the defuzzed technique, we applied the centroid approach for the change. The performance of the FIS framework, a non-fuzzy worth, was known as MCPI:
where
To execute the FIS framework, the Mandami strategy is utilized in this current study. Thusly, trapezoidal MFs were received for the sources of information and outcomes of the FIS to create the sorts of fuzzy. MFs were in the range from 0 to 1, and MFs could depict how a variable met the sort of fuzzy. Data sources and yields of the fuzzification framework were, after that, changed into etymological variables. The trapezoidal MFs were characterized.
Firstly, we computed the displacement desirability and frequency one. And afterward, we considered both ones as two inputs for the FIS. We consolidated these linguistics inputs to collect the output. We operated the trapezoidal MFs for fuzzification and defuzzification. The accompanying fuzzy principles were quickly portrayed. Fuzzy regulation: If
In light of the hypothesis of the FIS framework, we found the output of MCPI via the Taguchi technique which was considered the most optimal solution for the general reactions with many optimum designing factors [39–41]. The greater the best sort picked because of the MCPI maximum, which is depicted as:
where MCPIi stands for the ith MCPI; n is known as the number ith experimental value.
We operated a Taguchi-based fuzzy logic to discover optimum competitors in the multi-objectives optimization (MOO) problem yet this methodology was considered as one of the local optimum solutions. It is clear to see that the Taguchi procedure was utilized to limit or expand a solitary wellness work as far as discrete qualities. After that, an actual issue was wanted to look for a globally optimal solution. To defeat that circumstance, ANFIS was then reached out to demonstrating the MCPI, and the MOO design for the mechanisms of one-DOF could be viably understood by utilizing the lightning attachment procedure optimization (LAPO) calculation.
Step 11: ANFIS: We undertook the empirical analysis using data collected in the model of the ANFIS algorithm [42,43]. The scheme of the ANFIS is figured out. While previously mentioned, the FIS framework was the simulation procedure regarding theoretical factors where the Mamdani strategy is utilized. In the interim, ANFIS is a counterfeit approach created by coordinating the neural network with the FIS. These days, ANFIS is viewed as wise models built an association between the inlets and outlets. In the hypothesis of ANFIS, the Sugeno method was utilized to make fuzzy principles [44,45]. We characterized the FLS for the ANFIS model as following:
where
It is clear to be seen that the ANFIS algorithm comprises the five-layer feedforward neural network. The first layer has the role of fuzzification which allotted the levels of membership to inputs dependent on the presented MFs. We depicted the first layer outlet as below:
where x stands for the inlets regarding node ith. Desii stands for the theory.
The third layer is a standardized layer utilized to assess a proportion of terminating quality of an offered rule to an aggregate of terminating qualities all things considered. Every single node was named a cycle one. Inside that layer, NFS was labeled to the rule standardized terminating quality and characterized as shown in Eq. (2):
The 4th layer stands for the defuzzification cycle and the ith hub is marked as a square one by
The 5th layer is a general outlet, he whole all things considered, which is characterized as.
In this investigation, the trapezoidal MFs were received for the ANFIS framework too.
The three-length dimension was selected as three design variables with changed dimensions and presented in Tab. 2, namely variable A (between 0 and 1 mm), variable B (20 mm, 23 mm, and 26 mm), and variable C (60 mm, 63 mm, 66 mm). The orthogonal arrays and FEM outcomes were obtained from Minitab 18.0 and ANSYS as listed in Tab. 3. The displacement, maximum principal stress, and the first modal shape frequency outcomes were utilized to select one combination parameters with maximum displacement, minimum stress, and maximum frequency by grey relational analysis. This method is a sort of multi-objective optimization.


4.2 Analysis of Grey Relational Analysis
Another promising finding in Tab. 4 was the values of


From these results, it is clear that the regression-equation (RE) of GRG was gained through Minitab 18 as presented in Eq. (16). The chart of this equation was plotted in Fig. 6 to compare simulation outcomes with the GRG values of RE.

Figure 6: Plot of GRG
We found that the results agree well with the other single methods. The graph of GRG was painted in Fig. 6 with the values of GRG as listed in Tabs. 3–4. The maximum value of GRG is 0.7973 and the minimum value of GRG is 0.5802. The predicted values of GRG as drawn in Fig. 6 to compare with the FEM values (simulation values). The predicted and simulated values are approximated with each other because the graphs of GRG lie near each other.
Overall, our proposed approach is obtained the most robust results. The surface plot of GRG as shown in Fig. 7, revealed that the output GRG has been significantly affected by three design variables. Therein, variable C has influenced more than variables A and B. The value of GRG slightly increases as variables A and B which are presented in Fig. 7a. The value of GRG reduces from 0.8 to 0.6 as variable C increases from 60 mm to 62 mm as presented in Figs. 7b–7c.

Figure 7: Surface plot of GRG vs. three variables A, B, C
From these results, it is clear that the graph of S/N of GRG was painted from the values in Tab. 6. Fig. 8 pointed out that the design variables optimal value at A1, B3, C1, respectively, to the seventh case in Tab. 5, and the optimal value of GRG obtained 0.7973.
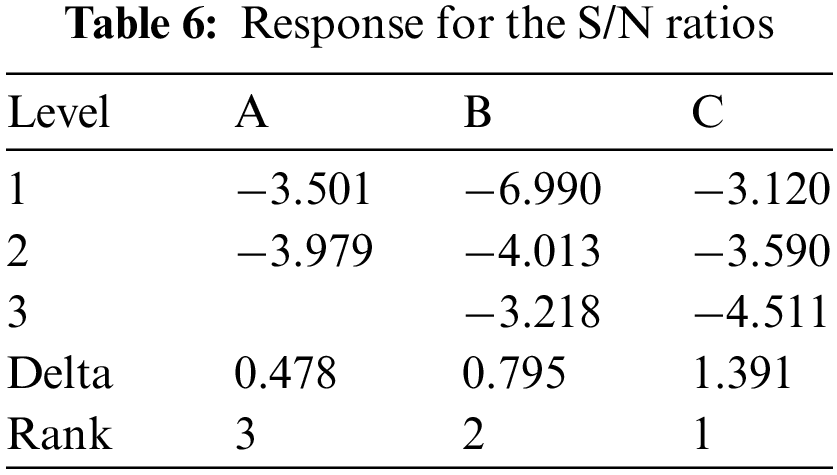

Figure 8: Plot S/N of GRG
4.6 Analysis of Variance of GRG
Tab. 7 presents the analysis of the variance of GRG and it is worth discussing these interesting facts revealed by the results of the P-values. They are less than 0.05 indicated design variables playing an important role in the optimal design amplification ratio of the magnification mechanism. The contribution percent of factors namely the following: Variable A is 8.39%, variable B is 18.83%, variable C is 44.09%, variable A×C is 17.88% and variable B×C is 8.27% with a deviation error is 2.54%. The problem indicated that FEM and optimization outcomes are good agreement with the theory [46–48].

4.7 Mean Analysis and Confirmation of Predicted and Optimization Values
The finding in this investigation is equal to or better than an outcome that is presently accepted. The outcome of the mean analysis of GRG is illustrated in Tab. 8 and Fig. 9. The maximum values of GRG are optimal, namely is A1B3C1 with the value of variable A is 0.6726, variable B is 0.694 and variable C is 0.7018, respectively. The optimal outcome is the seventh case in Tab. 5.


Figure 9: Plot means of GRG
It is significant to pay attention that the current outcome relies on the mean analysis of displacement as illustrated in Tab. 9 and Fig. 10. Whereby, the optimal values of displacement were A1, B3, C1. The value of variable A is 0.3901 mm, the variable B is 0.3444 mm and the value of variable C is 0.3466 mm, respectively. Together, the present findings confirm that the outcome of the mean analysis of maximum principal stress as illustrated in Tab. 11 and Fig. 12. whereby, the optimal values of stress A1B3C1 with the value: Variable A is 120.7 MPa, variable B is 127.8 MPa and variable C is 117.4 MPa, respectively. A further novel finding is that the outcome of the mean analysis of the first model shape of frequency as illustrated in Tab. 10 and Fig. 11. Whereby, the optimal values of stress A1B3C1 with the value of variable A is 319.3 Hz, variable B is 399.2 MPa and variable C is 359.5 MPa, respectively.
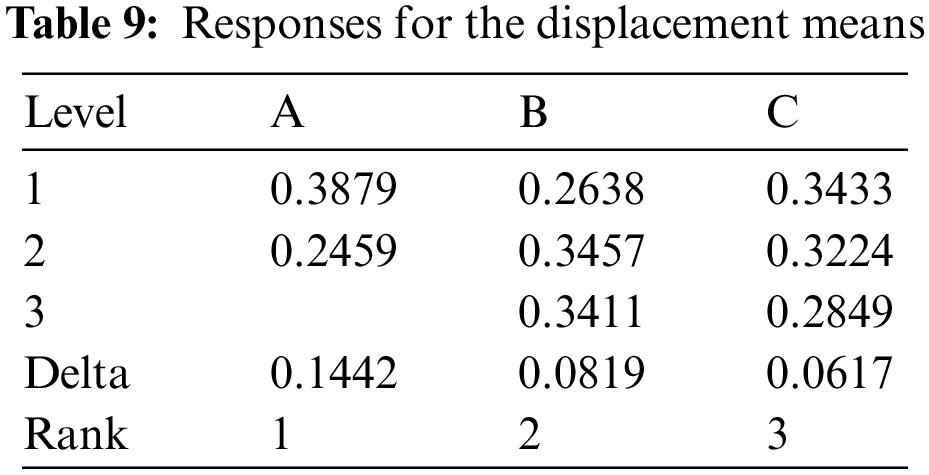

Figure 10: Plot means of DI


Figure 11: Plot means of the 1st model shape FR

Figure 12: Plot means of ST
As listed in Tabs. 12 and 13, size element and type meshed have slightly affected displacement, maximum principal stress and frequency.
at α = 0.05, Fe = 16, F0.05(1, 6) = 5.9874 [22] , Ve = 0.000335, R = 11, Re = 1, n = 18.


We showed that, whereby, the predicted values of GRG, DI, ST, frequency are 0.7616, 0.4385 mm, 126.7882 MPa and 372.4756 Hz, respectively. The GREY relational analysis outcome gained one optimization case and then use this case to simulate and obtained optimization outcomes of GRG, DI, ST and Fre are 0.7973, 0.4001 mm, 131.51 MPa and 400.18 Hz as shown in Tab. 14. In this Tab, the optimal value of GRG archived from the proposed method is 0.8212 is higher than the grey based on Taguchi method of 0.7973. However, the deviation between two methods are 2.91%. The outcomes proved the optimal methods obtained the output values approximate to the predicted values [49–55] because the deviation error of GRG, DI, ST, and frequency between the forecast and optimal value is less than 9%.

The findings are equal to or better than those of previous studies that are currently agreed upon. From these results, it is clear that after choosing the mechanism with combination variables at optimal values, the static structural and modal shape were used to obtain the optimum value of displacement, maximum principal stress, and the first modal shape of frequency which are 0.4521 mm, 127.894 MPa, and 397.45 Hz as depicted in Figs. 13a and 13b–13c, respectively. We found that our outcomes are currently better than those of the previous studies [17,21–28].

Figure 13: The FEM outcomes with variables at optimal levels: (a) displacement, (b) maximum principal stress, (c) the first model shape frequency
This conclusion follows from the fact that the influences of three variables (A, B, C) on displacement, maximum principal stress, and frequency of the first modeling shape case were analyzed through using FEA. Our findings identified that these variables have strongly affected three outputs as proved by S/N analysis, ANOVA, regression analysis, prediction of the artificial neural network, statistical analysis, Fuzzy logic system, and ANFIS. Besides, these findings provided additional information about the simulation, optimization, prediction results which are good to agree with and better than the previous publication as presented and discussed. The magnification ratio, maximum principal stress, and the first modal shape frequency were obtained larger than 40.35 times, 127.894 MPa, and 397.45 Hz, respectively. Nevertheless, we found that the optimal method was permitted to utilize optimization analysis for variables of the compliant mechanism because the outcomes of the research have errors that are less than 9%. From the obtained outputs pointed out that the Taguchi method based on grey relational analysis and ANFIS are the robust optimization methods. The methods proposed to apply for optimal problem in the fields technique, industry, life and society.
Funding Statement: This work is funded by Hung Yen University of Technology and Education and Industrial University of Ho Chi Minh City.
Conflicts of Interest: The authors declare that they have no conflicts of interest to report regarding the present study.
References
1. N. L. Chau, T. P. Dao and V. T. T. Nguyen, “Optimal design of a dragonfly-inspired compliant joint for camera positioning system of nanoindentation tester based on a hybrid integration of jaya-anfis,” Mathematical Problems in Engineering, vol. 2018, pp. 1–16, 2018. [Google Scholar]
2. N. L. Chau, T. P. Dao and V. T. T. Nguyen, “An efficient hybrid approach of finite element method, artificial neural network-based multiobjective genetic algorithm for computational optimization of a linear compliant mechanism of nanoindentation tester,” Mathematical Problems in Engineering, vol. 2018, pp. 1–19, 2018. [Google Scholar]
3. Z. Chen, V. T. T. Nguyen and N. T. Tran, “Optimum design of the volute tongue shape of a low specific speed centrifugal pump,” Journal of Electrical & Electronic Systems, vol. 6, pp. 1–5, 2017. [Google Scholar]
4. A. Bemani, A. Baghban, S. Shamshirband, A. Mosavi, P. Csiba et al., “Applying ANN, ANFIS, and LSSVM models for estimation of acid solvent solubility in supercritical CO2,” Computers, Materials & Continua, vol. 63, no. 3, pp. 1175–1204, 2020. [Google Scholar]
5. T. Yue and M. A. Wahab, “A review on fretting wear mechanisms, models and numerical analyses,” Computers, Materials & Continua, vol. 59, no. 2, pp. 405–432, 2019. [Google Scholar]
6. Y. K. Yong and T. F. Lu, “Kinetostatic modeling of 3-RRR compliant micro-motion stages with flexure hinges,” Mechanism and Machine Theory, vol. 44, no. 6, pp. 1156–1175, 2009. [Google Scholar]
7. U. Bhagat, B. Shirinzadeh, L. Clark, P. Chea, Y. Qin et al., “Design and analysis of a novel flexure-based 3-DOF mechanism,” Mechanism and Machine Theory, vol. 74, pp. 173–187, 2014. [Google Scholar]
8. Y. Tian, B. Shirinzadeh and D. Zhang, “Design and dynamics of a 3-DOF flexure-based parallel mechanism for micro/nano manipulation,” Microelectronic Engineering, vol. 87, no. 2, pp. 230–241, 2010. [Google Scholar]
9. Q. Xu and Y. Li, “Analytical modeling, optimization and testing of a compound bridge-type compliant displacement amplifier,” Mechanism and Machine Theory, vol. 46, no. 2, pp. 183–200, 2011. [Google Scholar]
10. N. T. Huynh, S. C. Huang and T. -P. Dao, “Optimal displacement amplification ratio of bridge-type compliant mechanism flexure hinge using the taguchi method with grey relational analysis,” Microsystem Technologies, vol. 27, pp. 1251–1265, 2021. [Google Scholar]
11. N. C. Vu, N. T. Huynh and S. C. Huang, “Optimization the first frequency modal shape of a tensural displacement amplifier employing flexure hinge by using taguchi method,” Journal of Physics: Conference Series, vol. 1303, no. 1, pp. 1–10, 2019. [Google Scholar]
12. C. N. Wang, K. P. Truong, N. T. Huynh and H. Nguyen, “Optimization on effects of design parameter on displacement amplification ratio of 2 DOF working platform employing bridge-type compliant mechanism flexure hinge using taguchi method,” Journal of Physics: Conference Series, vol. 1303, no. 1, pp. 1–10, 2019. [Google Scholar]
13. C. N. Wang, K. P. Truong and N. T. Huynh, “Optimization effects of design parameter on the first frequency modal of a bridge-type compliant mechanism flexure hinge by using the taguchi method,” Journal of Physics: Conference Series, vol. 1303, no. 1, pp. 1–9, 2019. [Google Scholar]
14. N. T. Huynh, S. C. Huang and T. P. Dao, “Design variables optimization effects on acceleration and contact force of the double sliders-crank mechanism having multiple revolute clearance joints by use of the taguchi method based on a grey relational analysis,” Sādhanā, vol. 45, no. 1, pp. 1–22, 2020. [Google Scholar]
15. Q. Li, C. Pan and X. Xu, “Closed-form compliance equations for power-function-shaped flexure hinge based on unit-load method,” Precision Engineering, vol. 37, no. 1, pp. 135–145, 2013. [Google Scholar]
16. N. Lobontiu and M. Cullin, “In-plane elastic response of two-segment circular-axis symmetric notch flexure hinges: The right circular design,” Precision Engineering, vol. 37, vol. 3, pp. 542–555, 2013. [Google Scholar]
17. K. Q. Qi, Y. Xiang, C. Fang, Y. Zhang and C. S. Yu, “Analysis of the displacement amplification ratio of bridge-type mechanism,” Mechanism and Machine Theory, vol. 87, pp. 45–56, 2015. [Google Scholar]
18. L. Qiu, S. Yin and Z. Xie, “Failure analysis and performance comparison of triple-LET and LET flexure hinges,” Engineering Failure Analysis, vol. 66, pp. 35–43, 2016. [Google Scholar]
19. Y. Tian, B. Shirinzadeh and D. Zhang, “Closed-form compliance equations of filleted V-shaped flexure hinges for compliant mechanism design,” Precision Engineering, vol. 34, no. 3, pp. 408–418, 2010. [Google Scholar]
20. M. Yang, Z. Du and W. Dong, “Modeling and analysis of planar symmetric superelastic flexure hinges,” Precision Engineering, vol. 46, pp. 177–183, 2016. [Google Scholar]
21. S. B. Choi, S. S. Han, Y. M. Han and B. S. Thompson, “A magnification device for precision mechanisms featuring piezoactuators and flexure hinges: Design and experimental validation,” Mechanism and Machine Theory, vol. 42, no. 9, pp. 1184–1198, 2007. [Google Scholar]
22. X. Chen, Y. Li, Y. Xie and R. Wang, “Design and analysis of new ultra compact decoupled XYZ stage to achieve large-scale high precision motion,” Mechanism and Machine Theory, vol. 167, pp. 1–22, 2021. [Google Scholar]
23. M. Ling, J. L. wang, M. wu, L. Cao and B. Fu, “Design and modeling of an improved bridge-type compliant mechanism with its application for hydraulic piezo-valves,” Sensors and Actuators A: Physical, vol. 324, pp. 1–9, 2021. [Google Scholar]
24. B. Shi, F. Wang, Z. Huo, Y. Tian, X. Zhao et al., “Design of a rhombus-type stick-slip actuator with two driving modes for micropositioning,” Mechanical Systems and Signal Processing, vol. 166, pp. 1–12, 2021. [Google Scholar]
25. W. Chen, C. Kong, Q. Lu, Y. Liang, L. Luo et al., “Nonlinear analysis, optimization, and testing of the bridge-type compliant displacement amplification mechanism with a single input force for microgrippers,” Precision Engineering, vol. 73, pp. 166–182, 2022. [Google Scholar]
26. H. Wu, L. Lai, L. Zhang and L. Zhu, “A novel compliant XY micro-positioning stage using bridge-type displacement amplifier embedded with scott-russell mechanism,” Precision Engineering, vol. 73, pp. 284–295, 2022. [Google Scholar]
27. H. Zekui, X. Qingsong, “Novel design of a piezoelectrically actuated compliant microgripper with high area-usage efficiency,” Precision Engineering, vol. 76, pp. 1–11, 2022. [Google Scholar]
28. M. Nalbant, H. Gökkaya and G. Sur, “Application of taguchi method in the optimization of cutting parameters for surface roughness in turning,” Materials & Design, vol. 28, no. 4, pp. 1379–1385, 2007. [Google Scholar]
29. R. K. Roy, “A primer on the Taguchi method,” Van Nostrand Reinhold Company, the United states America, 2nd edition, pp. 1–329, 2010. [Google Scholar]
30. M. Ling, J. Cao, Z. Jiang and J. Lin, “A semi-analytical modeling method for the static and dynamic analysis of complex compliant mechanism,” Precision Engineering, vol. 52, pp. 64–72, 2018. [Google Scholar]
31. K. B. Choi, J. J. Lee, G. H. Kim, H. J. Lim and S. G. Kwon, “Amplification ratio analysis of a bridge-type mechanical amplification mechanism based on a fully compliant model,” Mechanism and Machine Theory, vol. 121, pp. 355–372, 2018. [Google Scholar]
32. M. Fahiminia and A. Shishegaran, “Evaluation of a developed bypass viscous damper performance,” Frontiers of Structural and Civil Engineering, vol. 14, pp. 773–791, 2020. [Google Scholar]
33. P. Dangol, “An analysis of factors improving productivity at work,” Quantitative Economics and Management Studies, vol. 1, no. 4, pp. 268–274, 2020. [Google Scholar]
34. A. Shishegaran, M. Saeedi, A. Kumar and H. Ghiasinejad, “Prediction of air quality in Tehran by developing the nonlinear ensemble model,” Journal of Cleaner Production, vol. 259, pp. 1–16, 2020. [Google Scholar]
35. A. Shishegaran, M. R. Ghasemi and H. Varaee, “Performance of a novel bent-up bars system not interacting with concrete,” Frontiers of Structural and Civil Engineering, vol. 13, no. 6, pp. 1301–1315, 2019. [Google Scholar]
36. A. Shishegaran, B. Karami, T. Rabczuk, A. Shishegaran, M. A. Naghsh et al., “Performance of fixed beam without interacting bars,” Frontiers of Structural and Civil Engineering, vol. 14, pp. 1180–1195, 2020. [Google Scholar]
37. K. M. Hamdia, M. Arafa and M. Alqedra, “Structural damage assessment criteria for reinforced concrete buildings by using a fuzzy analytic hierarchy process,” Underground Space, vol. 3, no. 3, pp. 243–249, 2018. [Google Scholar]
38. S. Chowdhury and R. Kar, “Evaluation of approximate fuzzy membership function using linguistic input-an approached based on cubic spline,” JINAV: Journal of Information and Visualization, vol. 1, no. 2, pp. 53–59, 2020. [Google Scholar]
39. X. Zhuang, H. Guo, N. Alajlan and T. Rabczuk, “Deep autoencoder based energy method for the bending, vibration, and buckling analysis of kirchhoff plates,” European Journal of Mechanics, vol. 2010, no. 05698, pp. 1–32, 2020. [Google Scholar]
40. H. Guo, X. Zhuang, X. Meng and T. Rabczuk, “Integrated intelligent jaya runge-kutta method for solving falkner-skan equations for various wedge angles,” Elsevier, vol. 2010, no. 05682, pp. 1–36, 2020. [Google Scholar]
41. Y. Yang, D. Zhou and X. Yang, “A Multi-feature weighting based k-means algorithm for mooc learner classification,” Computers, Materials & Continua, vol. 59, no. 2, pp. 625–633, 2019. [Google Scholar]
42. K. M. Hamdia, T. Lahmer, T. Nguyen-Thoi and T. Rabczuk, “Predicting the fracture toughness of PNCs: A stochastic approach based on ANN and ANFIS,” Computational Materials Science, vol. 102, pp. 304–313, 2015. [Google Scholar]
43. B. Najafi, S. Faizollahzadeh Ardabili, S. Shamshirband, K. W. Chau and T. Rabczuk, “Application of ANNs, ANFIS and RSM to estimating and optimizing the parameters that affect the yield and cost of biodiesel production,” Engineering Applications of Computational Fluid Mechanics, vol. 12, no. 1, pp. 611–624, 2018. [Google Scholar]
44. C. Anitescu, E. Atroshchenko, N. Alajlan and T. Rabczuk, “Artificial neural network methods for the solution of second order boundary value problems,” Computers, Materials & Continua, vol. 59, no. 1, pp. 345–359, 2019. [Google Scholar]
45. T. V. T. Nguyen, N. T. Huynh, N. C. Vu, V. N. D. Kieu and S. C. Huang, “Optimizing compliant gripper mechanism design by employing an effective bi-algorithm: Fuzzy logic and ANFIS,” Microsystem Technologies, vol. 27, no. 9, pp. 3389–3412, 2021. [Google Scholar]
46. A. Shishegaran, M. R. Khalili, B. Karami, T. Rabczuk and A. Shishegaran, “Computational predictions for estimating the maximum deflection of reinforced concrete panels subjected to the blast load,” International Journal of Impact Engineering, vol. 139, no. 103527, pp. 1–14, 2020. [Google Scholar]
47. M. S. Es-Haghi, A. Shishegaran and T. Rabczuk, “Evaluation of a novel asymmetric genetic algorithm to optimize the structural design of 3D regular and irregular steel frames,” Frontiers of Structural and Civil Engineering, vol. 14, pp. 1110–1130, 2020. [Google Scholar]
48. J. H. Emmendoerfer, E. A. Fancello and E. C. N. Silva, “Stress-constrained level set topology optimization for compliant mechanisms,” Computer Methods in Applied Mechanics and Engineering, vol. 362, pp. 1–27, 2020. [Google Scholar]
49. J. Sadoon and B. B. Üstündağ, “Fused and modified evolutionary optimization of multiple intelligent systems using ann, svm approaches,” Computers, Materials & Continua, vol. 66, no. 2, pp. 1479–1496, 2021. [Google Scholar]
50. G. K. Durbhaka, B. Selvaraj, M. Mittal, T. Saba, A. Rehman et al., “Swarm-LSTM: Condition monitoring of gearbox fault diagnosis based on hybrid LSTM deep neural network optimized by swarm intelligence algorithms,” Computers, Materials & Continua, vol. 66, no. 2, pp. 2041–2059, 2021. [Google Scholar]
51. C. N. Wang, F. -C. Yang, V. T. T. Nguyen, Q. M. Nguyen, N. T. Huynh et al., “Optimal design for compliant mechanism flexure hinges: Bridge-yype,” Micromachines, vol. 12, no. 11, pp. 1–15, 2021. [Google Scholar]
52. N. T. Huynh and Q. M. Nguyen, “Application of grey relational approach and artificial neural network to optimise design parameters of bridge-type compliant mechanism flexure hinge,” International Journal of Automotive and Mechanical Engineering, vol. 18, no. 1, pp. 8505–8522, 2021. [Google Scholar]
53. Q. P. Tran, N. T. Huynh and S. C. Huang, “Artificial neural network base on grey relational analysis estimate displacement of bridge-type amplifier,” IOP Conf. Ser.: Mater. Sci. Eng., vol. 1113, pp. 1–10, 2021. [Google Scholar]
54. N. T. Huynh, V. T. T. Nguyen, N. T. Tam and Q. M. Nguyen, “Optimizing magnification ratio for the flexible hinge displacement amplifier mechanism design,” Lecture Notes in Mechanical Engineering, In: Long B. T., Kim Y. H., Ishizaki K., Toan N. D., Parinov I. A., Vu N. P. (Eds) in Proc. of the 2nd Annual Int. Conf. on Material, Machines and Methods for Sustainable Development (MMMS2020). MMMS 2020, Cham : Springer, pp. 769–778, 2021. [Google Scholar]
55. N. T. Huynh, Q. M. Nguyen and L. K. T. Vo, “Computed methodology for design and optimization on parameters of a tensural displacement amplifier employing flexible hinges,” Journal of Mechanical Engineering Research and Developments, vol. 44, no. 10, pp. 66–79, 2021. [Google Scholar]
 | This work is licensed under a Creative Commons Attribution 4.0 International License, which permits unrestricted use, distribution, and reproduction in any medium, provided the original work is properly cited. |