| Computers, Materials & Continua DOI:10.32604/cmc.2022.029650 | |
| Article |
An Image Edge Detection Algorithm Based on Multi-Feature Fusion
1School of Information Science and Engineering, Hebei University of Science and Technology, Shijiazhuang, 050000, China
2Department of Geophysical Engineering, Karadeniz Technical University, Trabzon, 61080, Turkey
*Corresponding Author: Xiang Wang. Email: wangxiang@hebust.edu.cn
Received: 08 March 2022; Accepted: 25 May 2022
Abstract: Edge detection is one of the core steps of image processing and computer vision. Accurate and fine image edge will make further target detection and semantic segmentation more effective. Holistically-Nested edge detection (HED) edge detection network has been proved to be a deep-learning network with better performance for edge detection. However, it is found that when the HED network is used in overlapping complex multi-edge scenarios for automatic object identification. There will be detected edge incomplete, not smooth and other problems. To solve these problems, an image edge detection algorithm based on improved HED and feature fusion is proposed. On the one hand, features are extracted using the improved HED network: the HED convolution layer is improved. The residual variable convolution block is used to replace the normal convolution enhancement model to extract features from edges of different sizes and shapes. Meanwhile, the empty convolution is used to replace the original pooling layer to expand the receptive field and retain more global information to obtain comprehensive feature information. On the other hand, edges are extracted using Otsu algorithm: Otsu-Canny algorithm is used to adaptively adjust the threshold value in the global scene to achieve the edge detection under the optimal threshold value. Finally, the edge extracted by improved HED network and Otsu-Canny algorithm is fused to obtain the final edge. Experimental results show that on the Berkeley University Data Set (BSDS500) the optimal data set size (ODS) F-measure of the proposed algorithm is 0.793; the average precision (AP) of the algorithm is 0.849; detection speed can reach more than 25 frames per second (FPS), which confirms the effectiveness of the proposed method.
Keywords: Computer vision; edge detection; deep learning; feature fusion; residual convolution
Due to the influence of external environment, transmission channel and other factors, the image will inevitably be polluted by noise in the process of acquisition, compression and transmission, resulting in image distortion and blur. Machine vision in the field of health, fitness entertainment, industrial production areas and the traffic detection, security fields have a wide range of applications, such as the computer to complete the work often involves the real-time image processing, such as video processing, image analysis, target tracking, etc. The image edge detection is one of the most important part in the field of machine vision. Image edge detection, as the most basic content in computer vision and image processing, is an important problem that has not been solved satisfactorily. Studies on the human visual system show [1] that boundaries in images are very important, and people can often recognize objects only by rough outlines. This fact provides important enlightenment for computer vision research, that is, an object can be represented by its boundary, and the original graph composed of discontinuous points of grayscale in an image can carry most of the useful information of the original image. The essence of edge detection is to extract the boundary between object and background in image by some algorithm.
The traditional edge detection algorithm is based on the original image and locates the edge by obtaining the differentiation of the obvious gray changes in the image. In short, it uses the gradient changes between light and shade [2]. Its greatest advantages lie in its simplicity and effectiveness. The classical edge detection algorithms mainly include Roberts operator, Sobel operator, Prewitt operator, Canny operator, Kirsch operator, Laplacian operator and Laplacian-Gauss (LoG) operator [3–6]. Such methods can obtain fine single-pixel edges in simple scenes, but when there are background, lighting, other non-edge interference factors in the actual scene, edge detection often appears “over-detection”, the effect is difficult to guarantee, and the robustness is not high. Because of the above limitations, it is difficult for traditional differential detection operators to solve the problem of edge extraction in complex scenes in computer vision [7,8].
In order to solve the defects of traditional edge detectors, researchers gradually use some low-level features to manually design edge detectors, and use machine learning methods to classify image edge pixels. Heath et al. [9,10] proposed a data-driven edge detection method by learning the response probability distribution corresponding to two groups of edge filters. Martin et al. [11] found that adding texture gradient can significantly improve the edge effect. Then, researchers explored edge detection based on learning. Sun et al. [12,13] proposed a data-driven, supervised edge detector, which reduced the detection problem to a dense binary labeling problem, so that features were concentrated in local areas. However, these methods still have obvious problems in expressing high-level edge features.
In recent years, with the rapid development of artificial intelligence, edge detection methods based on deep learning have made great progress. Convolutional Neural Networks [14,15] (CNN) have strong feature learning ability, which can learn higher-order features of images and detect complex edges more robustly [16]. In recent years, many Edge Detection methods based on convolutional neural networks have emerged, such as Deep Contour [17], Deep Edge, N4-Fields [18], HED [19,20] (Holistically Nested Edge Detection) and RCF [21] (Richer Convolution Features for edge detection). Deep Convolutional Neural Network [22] (DCNN) is used to learn the discriminant features of Contour detection, and structured forest is used as the Contour and non-contour classifiers of depth features. Methods such as Deep Contour, Deep Edge and N4-Fields are based on local strategy (block) for detection, which is easy to lose global information. HED uses full convolutional neural network and deep monitoring network to add side depth monitoring layer and fusion layer to realize end-to-end edge detection. HED (Holistically Nested Edge Detection) operates the whole image, providing convenience for obtaining higher-level information. At the same time, HED uses multi-scale and multi-level features to insert multiple side output layers into the convolutional layer backbone network through the mapping of ground truth, and carries out deep supervision on the side output layer. The finally result is linked to the different layers so that the corresponding level of abstraction can be achieved at different scales. However, HED still lost part of the target contour information due to the low resolution of the high-level feature map [23]. At the same time, since the edge detection result of HED output is a probability graph, non-maximum suppression is needed to obtain fine edges in the application. However, this processing method will cause a lot of burrs in the edge detection result, but there will be problems of coarse edge positioning and inaccurate edge positioning.
All in all, Algorithms based on traditional gradient detection operators, such as Canny operator and Kirsch operator, are fast in edge extraction, and the extracted edges are fine. However, some non-edge texture parts “over-detection” and problems of over-sensitivity to noise are too obvious, and poor adaptability to external scenes. At the same time, the application of deep learning models such as HED model and RCF model in the field of edge detection, multi-level feature extraction has greatly improved the scene adaptation of edge detection. However, as the neural network deepens, some necessary low-level details are lost while extracting higher level global features. And the extracted edge is too thick, the edge positioning is not accurate. These effects on image segmentation after edge detection cannot be ignored.
Therefore, due to the limitations of the above algorithm or model, an edge detection algorithm based on improved HED and feature fusion is proposed. The contributions of this paper are as follows:
1) An efficient and accurate improved HED image edge detection model is proposed. By changing the convolution kernel to residual variable convolution, the model has better edge feature extraction ability under complex background; At the same time, the method of changing the conventional convolution to empty convolution is modified to ensure that the model has smaller parameter number and accurate feature extraction ability in complex background, and can detect more accurate edges.
2) A multi-feature fusion edge detection algorithm is proposed; By integrating the low-level features extracted by adaptive gradient operator and the high-level features of HED algorithm, the algorithm overcomes the problems of poor precision and sensitivity to noise in edge detection, and has a good adaptability to edge detection in complex environment.
2 Detection Algorithm Based on Improved HED and Feature Fusion
As shown in Fig. 1, The overall structure of the network is based on Oxford Visual Geometry Group (VGG) network, combined with the whole nested network from image to image and the improved Otsu-Canny edge detection algorithm. The network structure proposed in this paper is mainly divided into three parts: The first part is a deep learning detection network based on VGG16 and combined with HED network model. The deep learning detection network is used to extract multi-level semantic features and output feature edge images. The second part is to consider the introduced Oust-Canny operator sensitive to the edge, self-adaptive single pixel edge; The third part is weight fusion, weight fusion is carried out on the feature images obtained from the side output of each stage, and finally weight fusion is carried out on the edge extracted by oust-Canny operator, and the image edges with multi-level features and high precision are extracted. This paper will focus on the improvement of the network.
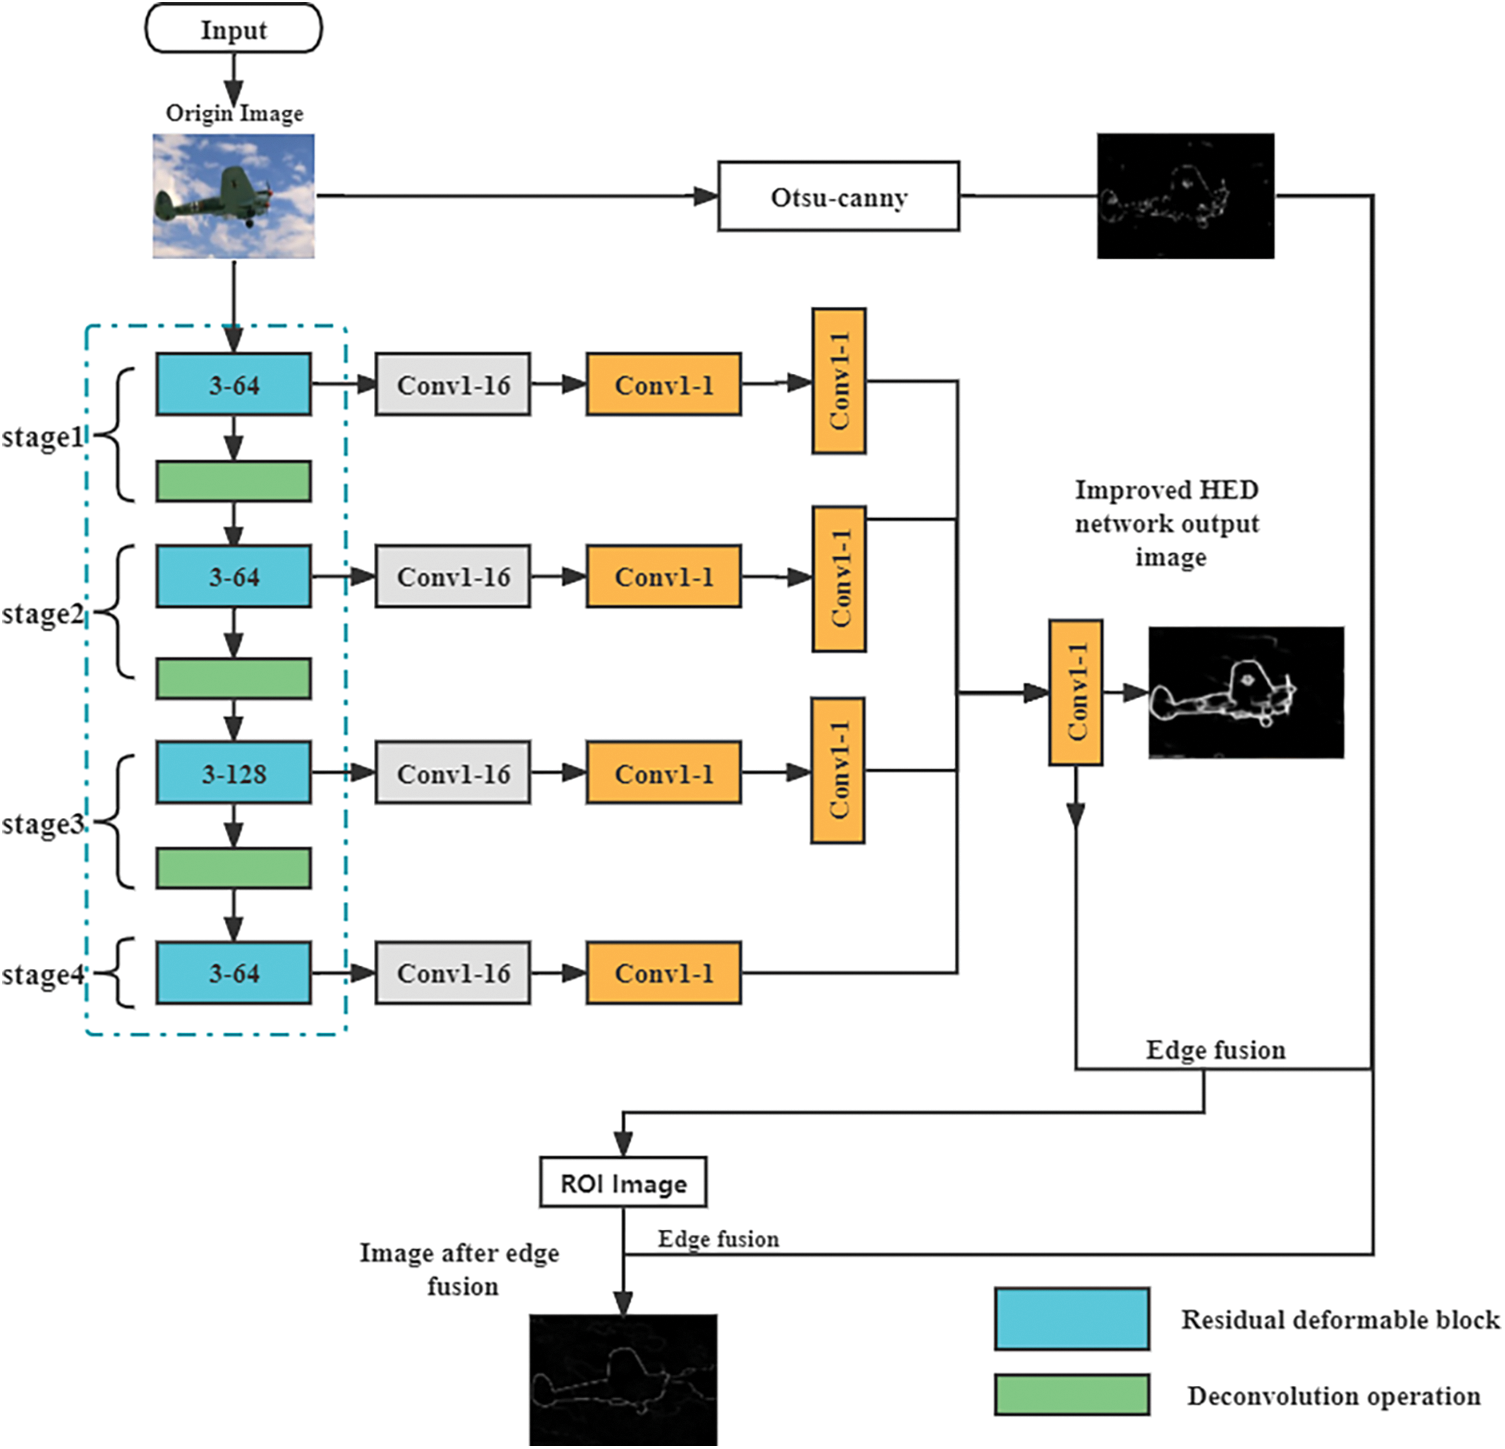
Figure 1: Network structure of edge detection algorithm
2.2 Backbone Network Construction
HED (Holistically-led Edge Detection) network is based on VGG (Visual Geometry Group) network, and is an end-to-end process, which inherits the feature extraction capability of VGG network. In the backbone part, VGG network is still used, but all the fully connected layer structures are removed, only the convolutional layer is retained, and a side output layer is added at each stage. Considering that edge detection only needs to extract the features of each layer, this structure can extract multi-level and multi-scale feature information in the image. The HED network structure is shown in Fig. 2.
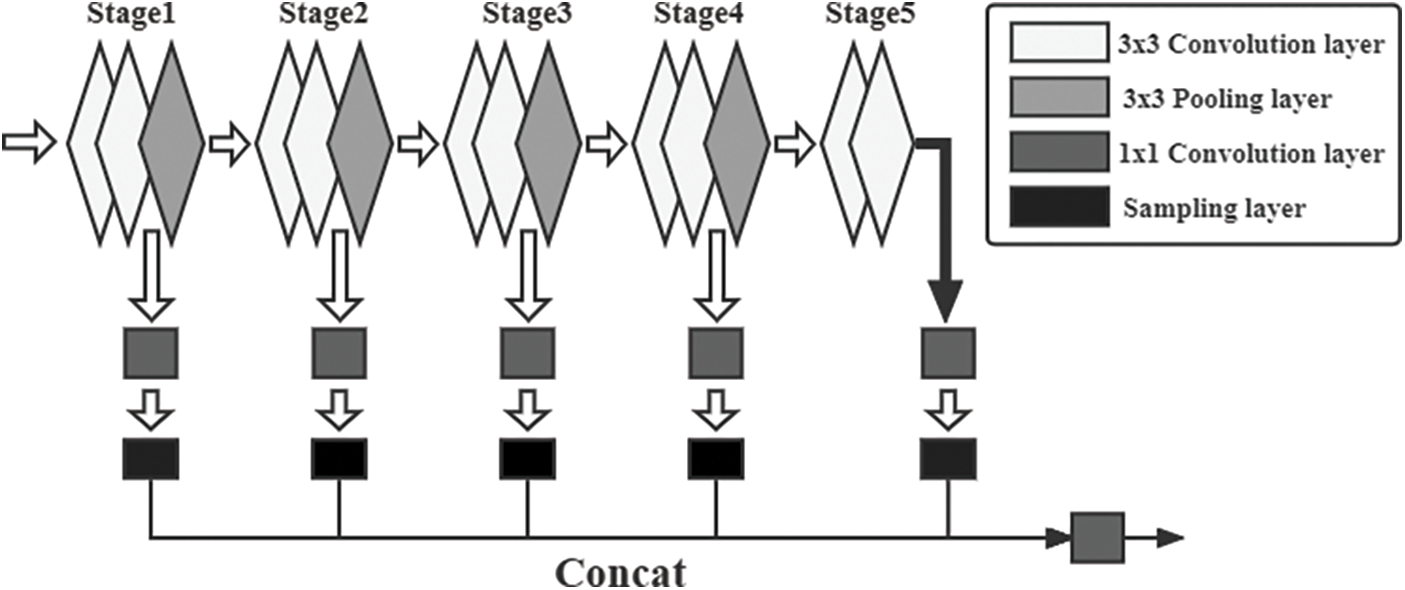
Figure 2: HED network structure
Compared with VGG network with limited input image size, HED network can realize training and post-prediction of images of any size due to the elimination of the full connection layer. The number of parameters is greatly reduced with the removal of the full connection layer, which improves the operating efficiency of the network. By using multi-scale and multi-hierarchy, HED network can insert multiple side output layers into the backbone network, and conduct in-depth supervision of feature information on the side output layer, and connect the final results with the results of different layers to optimize the edge.
HED classifies the edge detection task into a binary task for each pixel-“edge” and “non-edge”. For each output layer, the total loss function is the weighted sum of all output loss functions, as shown in Eq. (1).
where,
where
where
In this paper, HED Block1-Block5 is used as the backbone network, where each block is enhanced with a 1x1_1 convolution layer, and the image is supervised after the up-sampling value of the original image size. This design can improve the accuracy of subsequent feature extraction. At the same time, residual deformable convolution will be introduced in subsequent convolution operations to improve the generalization ability of convolution. After the convolution operation, the normalized ReLU activation function will be processed to reduce the size of data in the network. In addition, the cavity convolution model is introduced in the subsequent convolution process to increase the receptive field, so as to enhance the edge multi-scale characteristics.
2.3 Residual Deformable Convolution
In this paper, an improved whole nested edge detection network based on deformable convolution and extended convolution [24] is adopted to solve the problem that HED network is not accurate enough to detect multi-overlapping image edges. The model uses residual deformable block instead of traditional convolution to learn local detail features and adaptively adjust the receptive field. Considering that the increase of the receptive field leads to the decrease of image edge acuity, which leads to the problem of under-segmentation, the void convolution is used to replace the conventional pooling layer to increase the receptive field without reducing the image resolution.
A residual deformable convolution is introduced to solve the problem that HED network can easily lead to rough edges of segmented images and poor adaptability to complex standard convolution. An additional direction parameter is added to each convolution kernel element [25], which enables the convolution kernel to be extended to a large range during training. It is mainly composed of ConOffset, standard convolutional layer, ReLU (rectified linear unit) layer, BN (Batch Normalization) layer and Dropout layer. Its module structure is shown in Fig. 3.
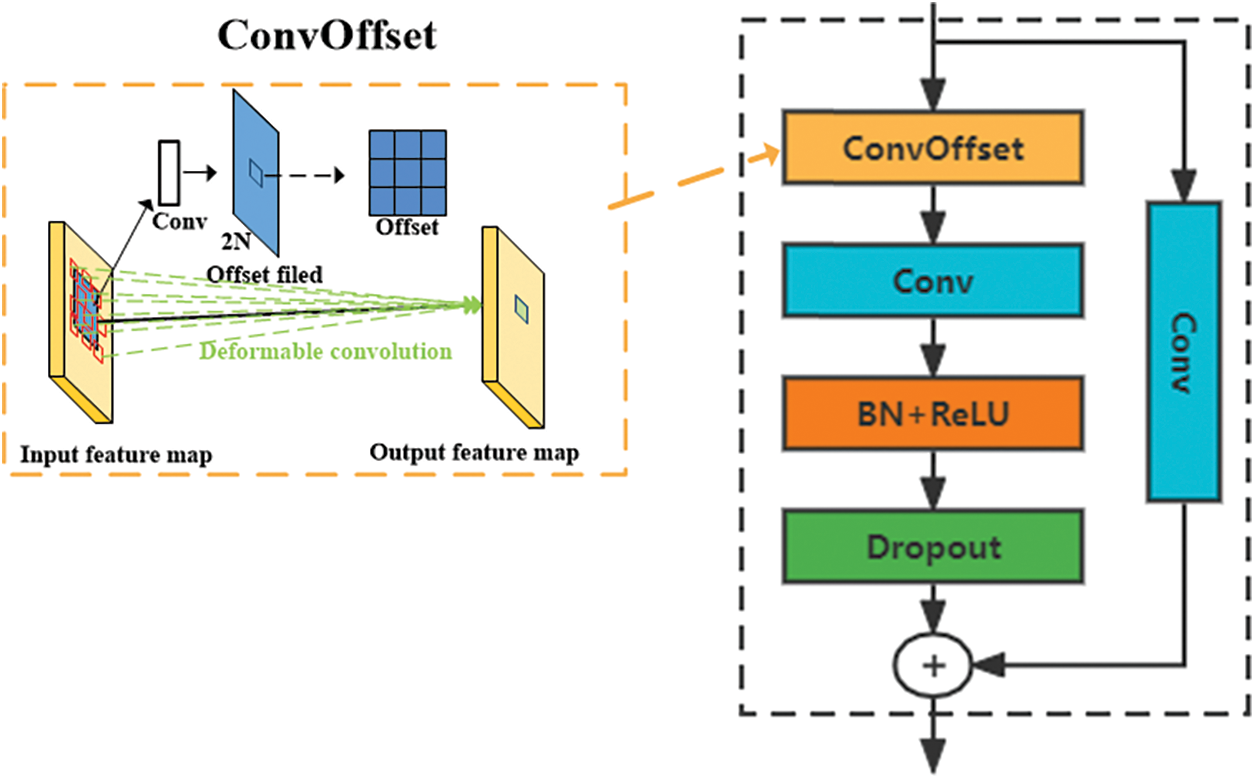
Figure 3: Residual variable convolution block
Traditional convolution kernels are mostly standard sizes, such as 3 × 3, 5 × 5, etc. Such standard convolution has poor adaptability and weak generalization ability. Due to the complex shapes and varying sizes of some image edges, it is difficult for standard convolution to extract all features of complex edges. Deformable convolution is an improvement on the standard convolution, it increase the offset through in convolution unit, end-to-end in gradient back propagation learning, after continuous training study, the offset can make the size and location of convolution kernels according to dynamically adjust the characteristics of the need to extract content, convolution kernels sampling point will be as an adaptive changes in the learning, In this way, we can learn image features of different sizes and shapes. In order to prevent over-fitting of the model, the Dropout layer is introduced and normalized results input to the Dropout layer, which reduces the time of training process and improves the generalization ability of the model.
Another improvement of this algorithm is to use empty convolution instead of conventional pooling layer. In convolutional neural networks, the pooling layer performs down-sampling of features to reduce the size of output space, thus increasing the receptive field and reducing the number of network parameters, thus reducing the complexity of computation. However, pooling layer has a defect, that is, it will not only reduce spatial sensitivity in the segmentation process, but also may lose some important edge information, which will directly lead to the under-segmentation of edge images.
Based on this, extend convolution [26,27] is used to replace conventional convolution, that is, “0” is filled in the middle of the convolution kernel, and the convolution kernel is enlarged in this way to increase the receptive field. The advantage of this operation is that it can increase the receptive field and obtain the global information of the image better even without the pooling operation. In the empty convolution, the void rate is the number of “0” between the specified kernel elements. If the kernel size of the defined empty convolution is T, then the size y of the expanded convolution kernel can be calculated, as shown in Eq. (5).
By setting the void rate, the size of the convolution kernel can be effectively expanded. Fig. 4 shows the expansion diagram of the 3 × 3 convolution kernel at different void rates:
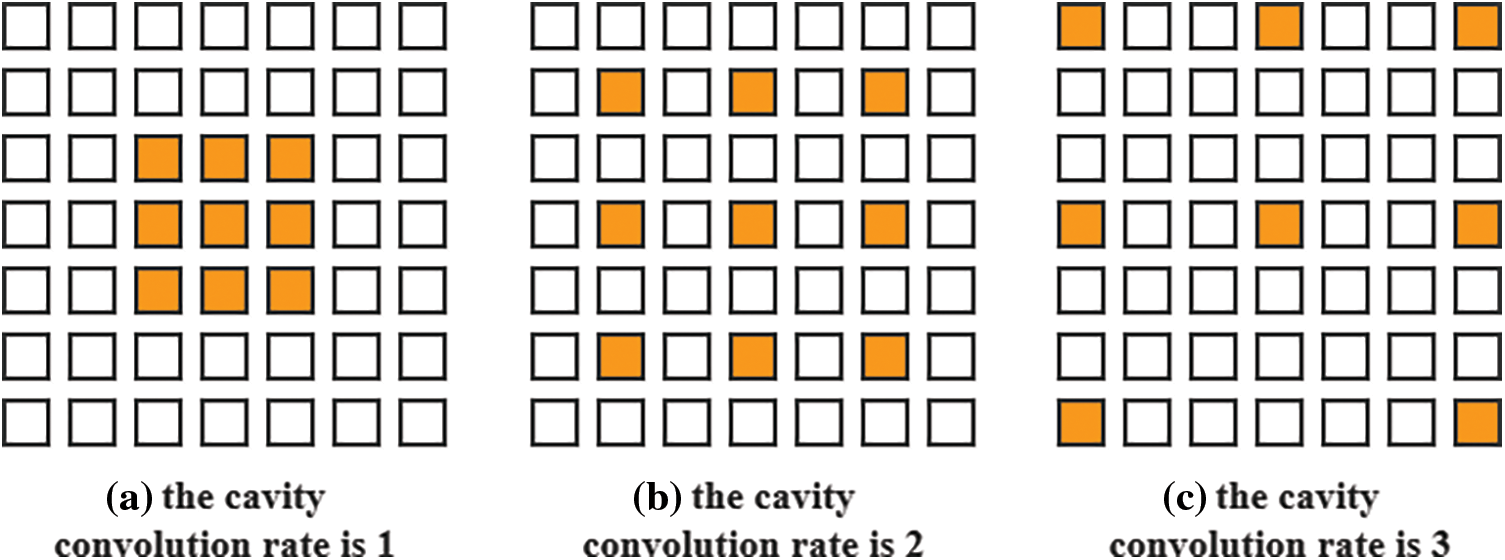
Figure 4: Extended convolution
2.5 Edge Fusion Based on Adaptive Canny Algorithm
Since the output result of the network is abstract edge, which reflects the middle and high level semantic information of the image, it is the probability graph of the edge position in the image. In order to obtain the edge of a single pixel [28], the method of non-maximum suppression is usually used to process the probability graph. However, since the probability distribution usually has a small deviation from the actual position of the edge, the single-pixel edge obtained by non-maximum suppression will have certain fracture and burr. In order to avoid this phenomenon, an edge response fusion algorithm is proposed. By binarization of the edge probability distribution map obtained by the improved HED network, the edge extraction result based on the improved HED network is obtained, and then the edge is fused with the edge with accurate position detected by the traditional filtering algorithm. The edge detection results of single pixel, accurate positioning and prominent edge are obtained. The edge fusion process is shown in Fig. 4.
In this paper, the maximum variance between classes (Otsu) method is used to obtain the edge extraction threshold TH, which is used to binarize the edge probability graph output by the improved HED network into an edge graph. Set
There are many traditional filtering based edge extraction methods, such as Sobel, Roberts, Prewitt, LOG, etc. Compared with the above method, Canny algorithm has a larger signal-to-noise ratio and higher detection accuracy. Therefore, this paper adopts the edge extraction method based on adaptive Canny and the edge extraction method based on improved HED network.
Compared with the above method, adaptive Canny can adaptively adjust the threshold value according to the local gray value of the image to achieve the maximum SNR (signal-noise ratio) improvement. Therefore, the edge detected based on Otsu-Canny is fused with the edge detected by the improved HED network in this paper, and the fusion algorithm has higher sensitivity. Higher accuracy and stronger anti-noise interference ability make the fusion result more accurate with the probability graph obtained by improved HED. The specific fusion process is shown in Fig. 5.
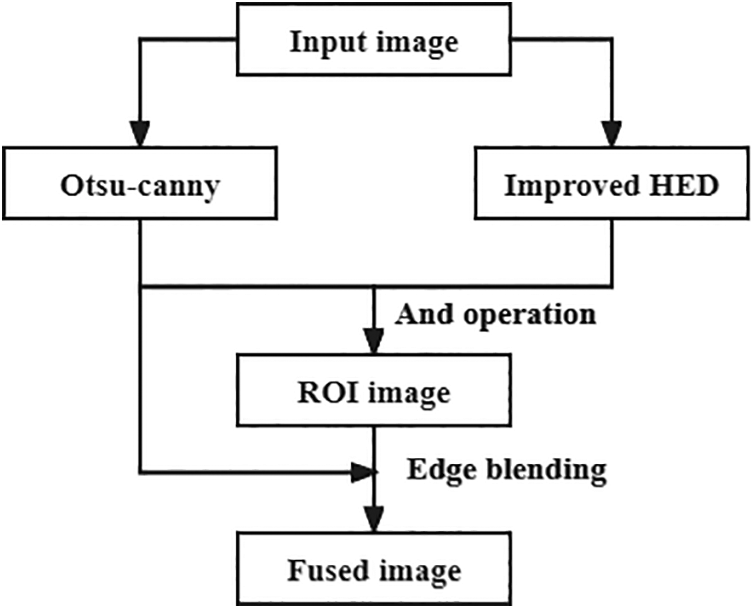
Figure 5: Edge fusion algorithm
3 Experimental Results and Analysis
3.1 Dataset and Training Network Models
Edge detection algorithm was used in the dataset using the open-source dataset BSDS500 from Berkeley University. BSDS500 is a widely used edge detection dataset, which contains 200 training images, 100 validation images and 200 test images. BSDS500 has a natural image segmentation database with manually drawn truth value. Each image is manually labeled by at least 5 callers, and the final truth value is averaged for all labeled edges. In addition, to prevent insufficient data from leading to over-fitting training, the original data set was enhanced [29], and the training images were cropped, rescaled, flipped, and rotated to form a set of 260,000 overlapping 48 × 48 patches.
In terms of network parameter setting, Adam algorithm was used to optimize the loss function of the network model in the pre-training stage. The initial learning rate was 0.001, weight attenuation was 0.001, and the number of iterations of the model was 200. In the side output training of the pre-trained network, the initial learning rate was set at 0.001, the weight attenuation rate was 0.001, and the number of model iterations was 150.
The experimental running software environment is 64-bit Ubuntu 16.04 system, running framework is Pytorch 1.3.0 and Python 3.6. The hardware environment is Intel(R) Xeon(R) E5-2678CPU @2.50 GHz, memory 16 GB, GPU GeForce GTXTITAN Xp, and video memory 12 GB.
In order to fully compare the advantages and disadvantages of the network in this paper, Canny algorithm and HED network, four test images are successively selected for simulation test. The test results of each image in each algorithm are shown in Tab. 1.
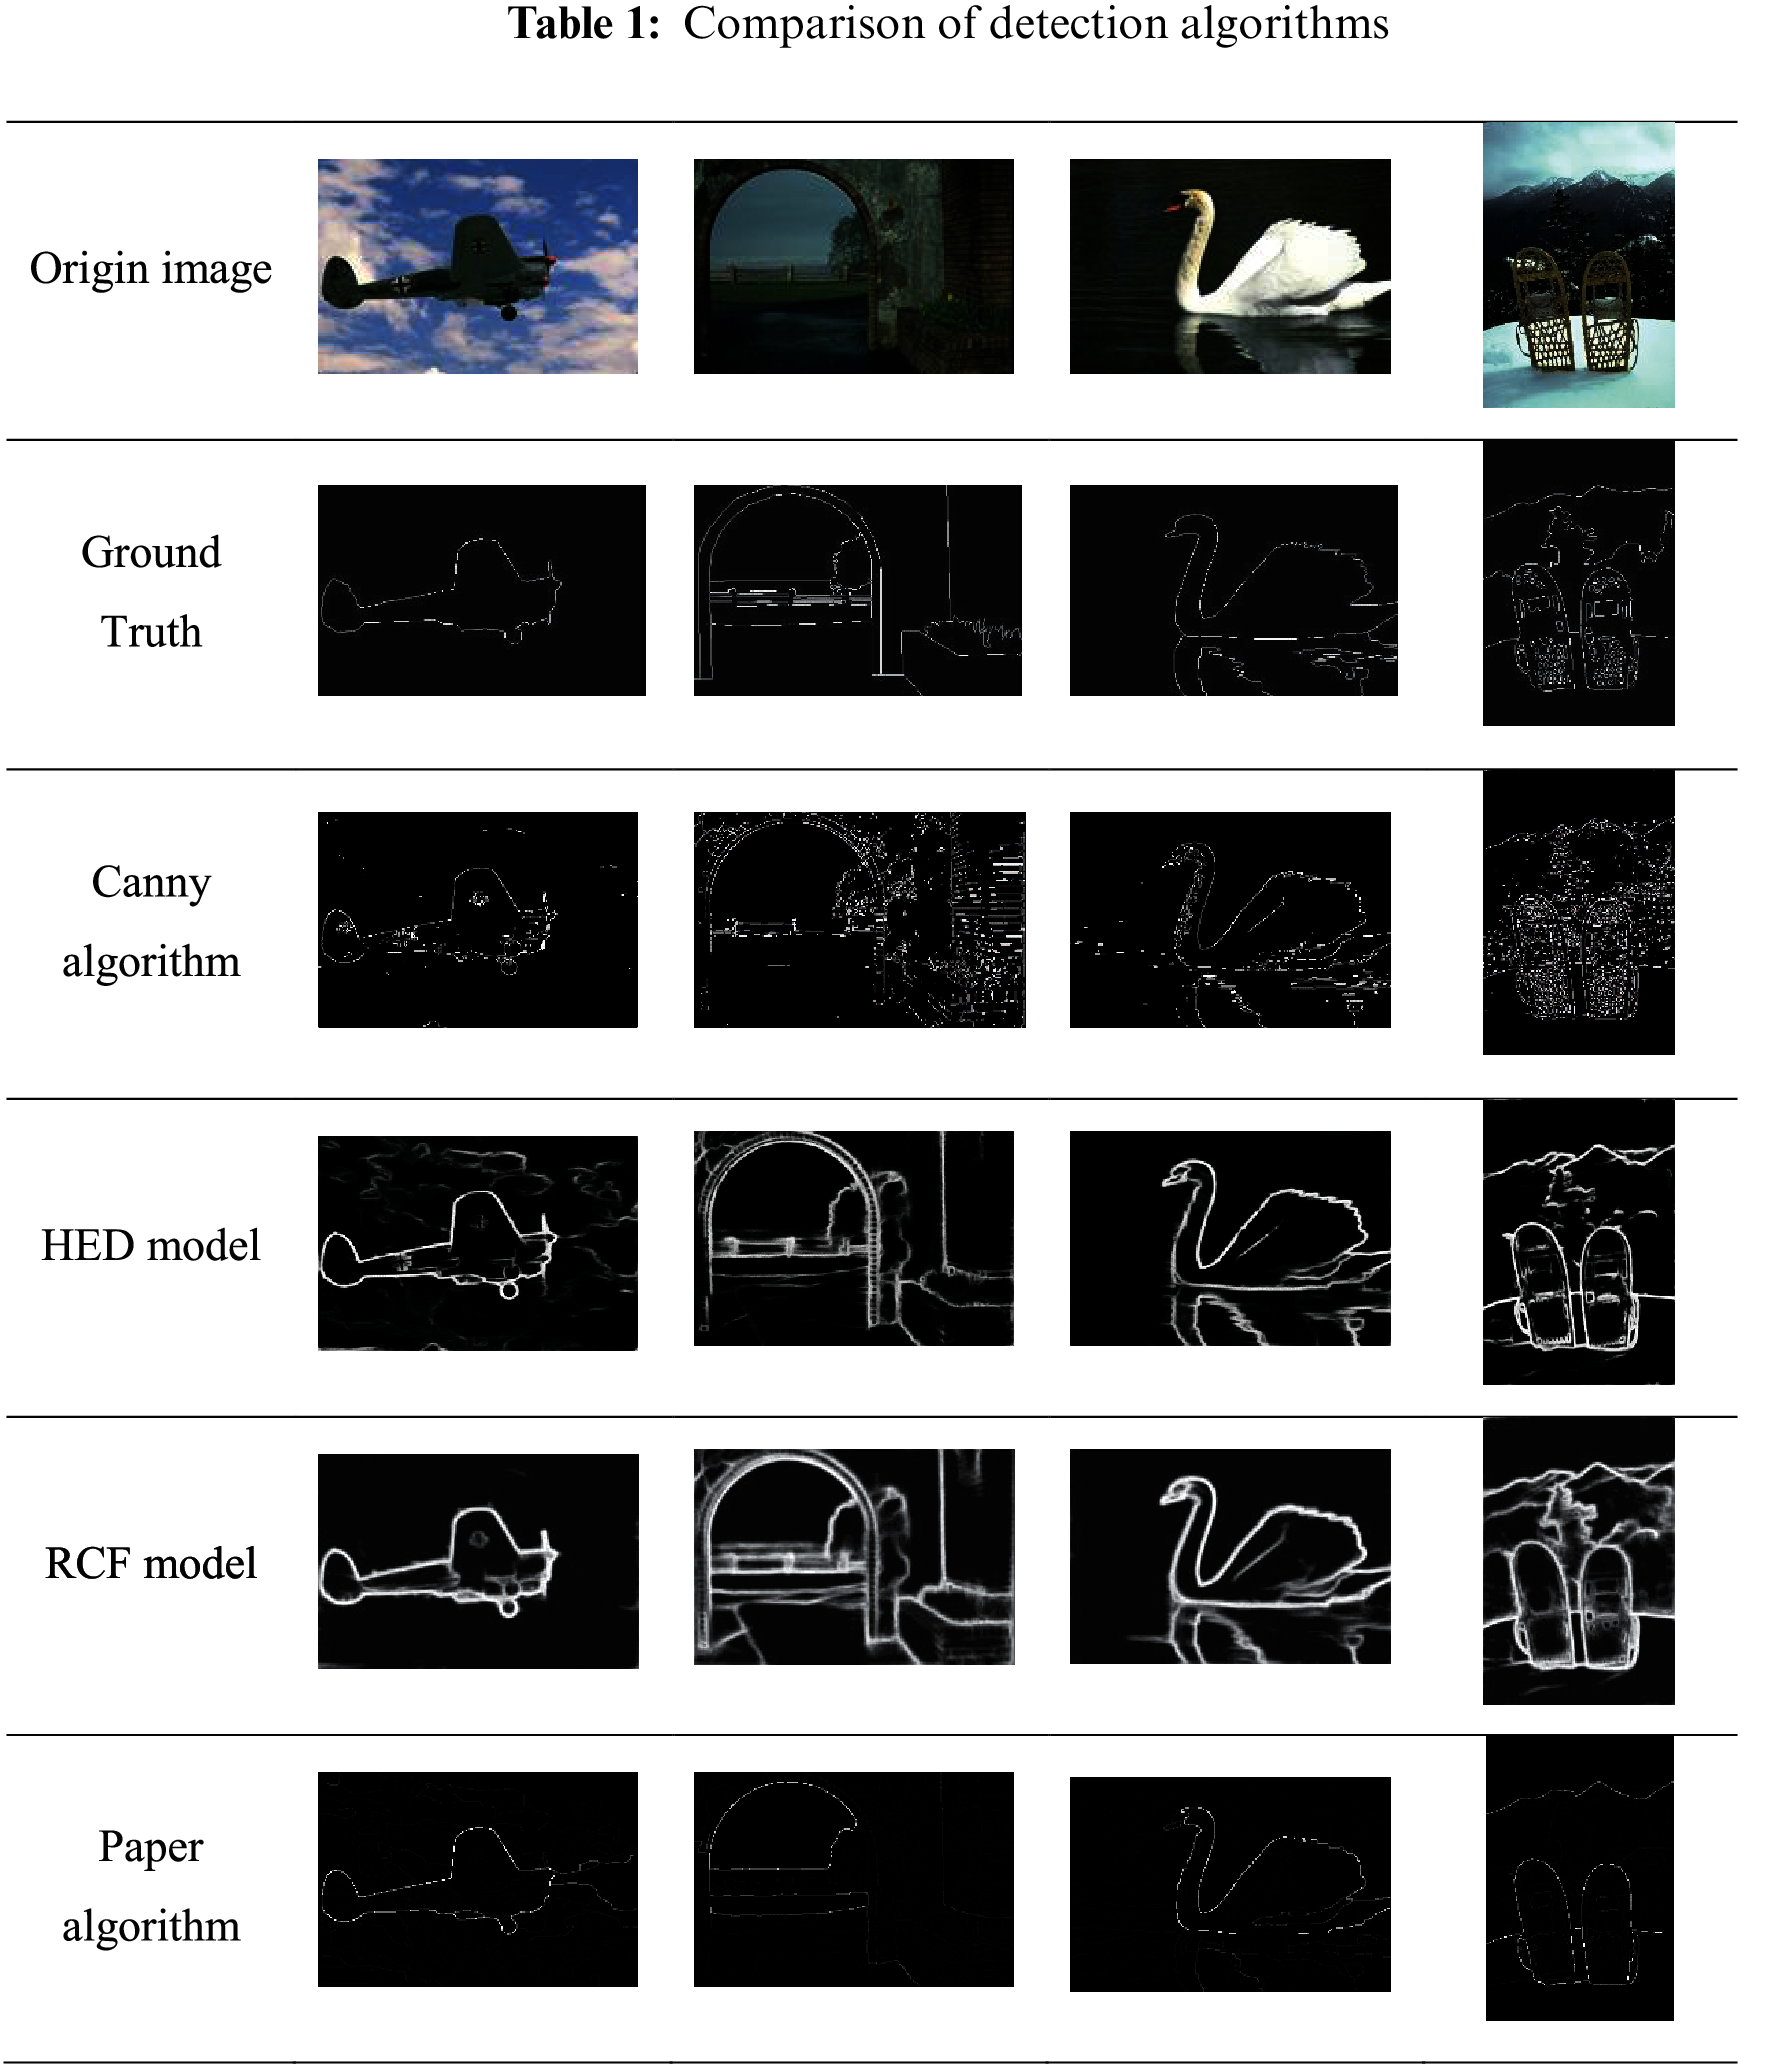
According to the simulation results in Tab. 1, the accuracy and the integrity of the improved HED edge fusion algorithm are significantly improved: the original HED algorithm can better reflect significant edges in the scene, but the contour is fuzzy. The edge line obtained by Canny operator is thinner, but some texture parts in the scene are mistakenly detected as edges. RCF algorithm is still not ideal for some complex background processing, and the outline is not too fine and thick. According to the above simulation results, the edge detection results of the multi-feature fusion model proposed in this paper are closest to the truth value.
The results of edge detection algorithm need unified quantitative standards, that is, quantitative evaluation through evaluation indicators, The optimal dataset scale (ODS), optimal image scale (OIS), average precision (AP), FPS (Frames Per Second) and distance error curves [23] are usually used for image edge detection. ODS represents the F-measure value of the whole database under the same threshold value of test set images, as shown in Eq. (7). OIS represents the best F-measure value of a single image when the best threshold is obtained in the samples of the test set. AP is the curve area of precious and recall. The P-R (precious-recall) curve represents the edge detection capability of the algorithm.
where precision = TP/(TP + FP); recall = TP/(TP + FN); The number of TP (true positives) cases that were correctly classified as positive examples; FP (false positive) is the number of positive cases incorrectly classified, while FN (false negative) is the number of negative cases incorrectly classified, that is, the number of positive cases actually classified as negative cases.
AP is the curve area of precision and recall. The P-R curve represents the edge detection capability of the algorithm.
where, P(r) is the precision-recall curve, and r is the recall rate. AP is the average precision of the P-R curve.
BSDS500 data set was used for performance evaluation, and the model proposed in this paper was compared with HED model, RCF model and Canny model. It can be concluded from the results in Tab. 2 and Fig. 6 that the average accuracy of the model proposed in this paper on the BSD500 data set is 0.849, while the F1 value is 0.79. The model proposed in this paper has good accuracy and at the same time guarantees the detection speed of more than 25 frames per second.
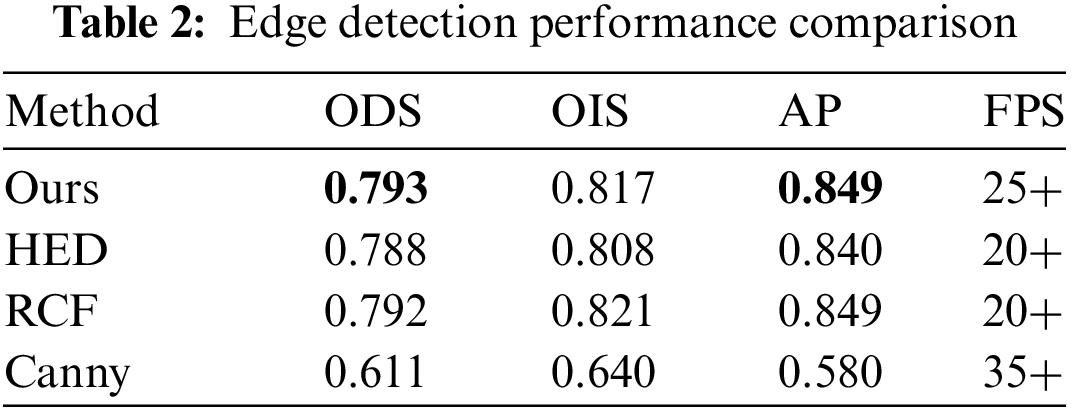
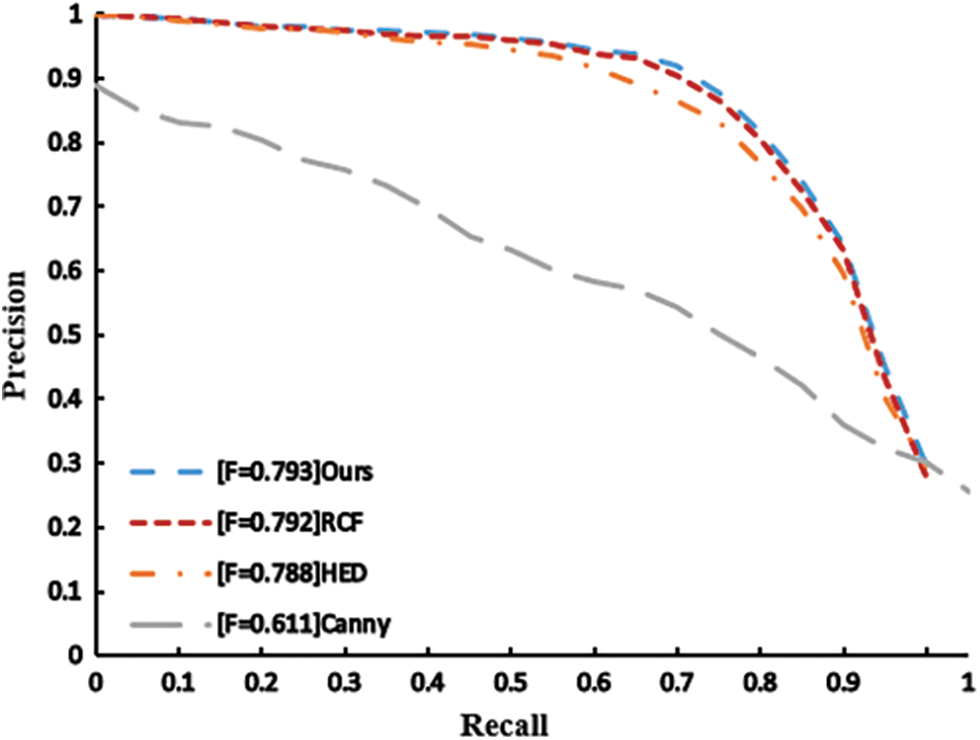
Figure 6: Precision-Recall assessment
Since the edge points are extracted by the neural network, the edge regions predicted by the neural network should not only contain all the real edge points as far as possible, but also require the false positive points to be as close to the real edge as possible to avoid isolated connected domains. However, P-R curve cannot reflect the spatial position of predicted edge points, so distance error is introduced as an evaluation index in this paper. The distance error represents the closest pixel distance between the false positive point and the real edge. In order to calculate the distance between false positive point and real edge, the concept of distance field is introduced. The core idea of range field is to define a range value for each target point in discrete space, which represents the minimum distance between the point and all boundary points, and all target points and their corresponding distance value form a range field.
Range error as shown in Fig. 7, the results can be seen that the proposed fusion algorithm to extract the edge of the edge response range error curve under the condition of different thresholds are better than the other measurement methods, especially when the threshold is less than 100, advantage is obvious, to illustrate the results of the proposed algorithm is more gathered near the edge of real, It has certain advantages in edge extraction.
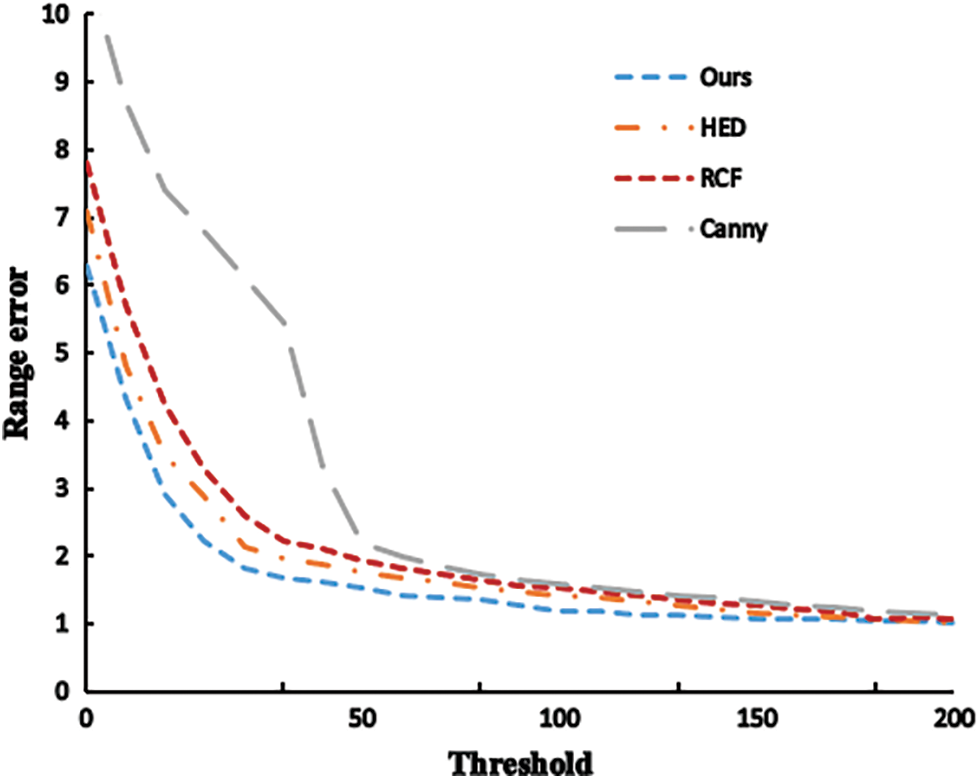
Figure 7: Distance error curve
Although the overall effect of the model proposed in this paper is effective in the above evaluation, the effect on a small part of images is not satisfactory. A typical wrong picture is selected, as shown in Fig. 8. Similarly, the HED model and RCF model were tested, and similar problems occurred in the complex multi-object background, that is, the network model made mistakes in the feature fusion of edges of different scales. It can be seen that the detected edge lost part of the left wall feature, as well as the ear hair feature. In addition, the comparison of the three network models at the edges of the animal’s face was too complex and fuzzy. Although the edge detection technology based on deep learning has greatly improved the detection accuracy and robustness compared with the traditional algorithm, it has the problem of detection failure for the edge with too complicated background.

Figure 8: Detection failure cases
According to the above comparative experiments, the network model proposed in this paper is quantitatively evaluated on ODS, OIS, AP, FPS and distance error curves. The OIS of the algorithm proposed in this paper is 0.793, which is the best of the comparison algorithms. The AP of the model proposed in this paper is 0.849, which is not inferior to the performance of RCF, and the FPS is much higher than that of RCF model--the frame rate is above 25; At the same time, because the edge contour detected by HED model and RCF model is relatively thick, the distance error is unacceptable. The distance error curves of the network model proposed in this paper are superior to those of other methods, and have a good effect on the edge location of precision objects. The multi-feature fusion edge detection algorithm proposed in this paper has good detection accuracy while maintaining good detection speed. Meanwhile, the precision of edge ensures the precision of edge positioning and the overall performance is the best.
In order to improve the performance of edge detection in complex natural scenes, this paper proposes an edge detection network based on improved HED network and adaptive Canny fusion. In this network, VGG16 is used as the network backbone, and the feature extraction part is combined with the extended convolution and the empty convolution of the variable residual line, so that the model can obtain the edge structure features and spatial information of the scene to a greater extent, which makes the model better adapt to the complex scene. At the same time combined with Otsu-Canny high sensitivity and high fine edge advantages; The BSDS500 data set is used for performance evaluation. The edge detection results of the algorithm model proposed are closer to the true value and performs better at multi-scale subjectively. Meanwhile, the algorithm model in this paper obtains the best edge detection results: ODS-0.793, OIS-0.817, and AP (average precision)-0.849. Although the network in this paper is superior to the comparison algorithm in terms of objective indicators, some scenes with overly complex backgrounds are still over-detection and feature missing, which will continue to be studied in the future.
Acknowledgement: We acknowledge funding from College Student Innovation and Entrepreneurship Training Program, Grant Numbers 2021055Z and S202110082031, the Special Project for Cultivating Scientific and Technological Innovation Ability of College and Middle School Students in Hebei Province, Grant Numbers 2021H011404 and 2021H010203.
Funding Statement: This research was funded by College Student Innovation and Entrepreneurship Training Program, Grant Numbers 2021055Z and S202110082031, the Special Project for Cultivating Scientific and Technological Innovation Ability of College and Middle School Students in Hebei Province, Grant Numbers 2021H011404 and 2021H010203.
Conflicts of Interest: The authors declare that they have no conflicts of interest to report regarding the present study.
References
1. Y. Yuan, K. Yang and C. Zhang, “Hard-aware deeply cascaded embedding,” in 2017 IEEE Int. Conf. on Computer Vision (ICCV), Venice, Italy, pp. 814–823, 2017. [Google Scholar]
2. P. Dollár and C. L. Zitnick, “Fast edge detection using structured forests,” IEEE Transactions on Pattern Analysis and Machine Intelligence, vol. 37, no. 8, pp. 1558–1570, 2015. [Google Scholar]
3. T. Hu, Z. Qi, Y. Qin and J. Shi, “Detecting technology of current generator blade shape based on improved canny algorithm,” IOP Conference Series: Materials Science and Engineering, vol. 452, pp. 26–32, 2018. [Google Scholar]
4. P. Bao, Z. Lei and W. Xiaolin, “Canny edge detection enhancement by scale multiplication,” IEEE Transactions on Pattern Analysis and Machine Intelligence, vol. 27, no. 9, pp. 1485–1490, 2005. [Google Scholar]
5. W. Chao, Y. Rui, Y. Sun, Y. Jiang and X. Lin, “A new method of multi-focus image fusion using laplacian operator and region optimization,” Journal of Computer and Communications, vol. 6, no. 5, pp. 106–118, 2018. [Google Scholar]
6. Q. Zhou, J. Qin, X. Xiang, Y. Tan and N. N. Xiong, “Algorithm of helmet wearing detection based on AT-YOLO deep mode,” Computers, Materials and Continua, vol. 69, no. 1, pp. 159–174, 2021. [Google Scholar]
7. I. J. Hussein, M. A. Burhanuddin, M. A. Mohammed, M. Elhoseny, B. Garcia-Zapirain et al., “Fully automatic segmentation of gynaecological abnormality using a new viola–jones model,” Computers, Materials & Continua, vol. 66, no. 3, pp. 3161–3182, 2021. [Google Scholar]
8. C. Yuan, S. Jiao, X. Sun, Q. M. J. Wu et al., “MFFFLD: A multi-modal feature fusion based fingerprint liveness detection,” IEEE Transactions on Cognitive and Developmental Systems, vol. 23, pp. 1, 2021. [Google Scholar]
9. M. Heath, S. Sarkar, T. A. Sanocki and K. W. Bowyer, “Comparison of edge detectors: A methodology and initial study,” Computer Vision and Image Understanding, vol. 69, no. 1, pp. 38–54, 1998. [Google Scholar]
10. S. Konishi, A. L. Yuille, J. M. Coughlan and C. Z. Song, “Statistical edge detection: Learning and evaluating edge cues,” Pattern Analysis & Machine Intelligence IEEE Transactions on, vol. 25, no. 1, pp. 57–74, 2003. [Google Scholar]
11. D. R. Martin, C. C. Fowlkes and J. Malik, “Learning to detect natural image boundaries using local brightness, color, and texture cues,” IEEE Transactions on Pattern Analysis and Machine Intelligence, vol. 26, no. 5, pp. 530–549, 2004. [Google Scholar]
12. W. Sun, G. Z. Dai, X. R. Zhang, X. Z. He and X. Chen, “TBE-Net: A three-branch embedding network with part-aware ability and feature complementary learning for vehicle re-identification,” IEEE Transactions on Intelligent Transportation Systems, vol. 15, pp. 1–13, 2021. [Google Scholar]
13. X. R. Zhang, X. Sun, X. M. Sun, W. Sun and S. K. Jha, “Robust reversible audio watermarking scheme for telemedicine and privacy protection,” Computers, Materials & Continua, vol. 71, no. 2, pp. 3035–3050, 2022. [Google Scholar]
14. M. D. Zeiler and R. Fergus, “Visualizing and understanding convolutional networks,” in Computer Vision–ECCV 2014, Zurich, Switzerland, pp. 818–833, 2014. [Google Scholar]
15. A. Kamilaris and F. X. Prenafeta-Boldu, “Deep learning in agriculture: A survey,” Computers and Electronics in Agriculture, vol. 147, pp. 70–90, 2018. [Google Scholar]
16. D. Riehle, D. Reiser and H. W. Griepentrog, “Robust index-based semantic plant/background segmentation for RGB- images,” Computers and Electronics in Agriculture, vol. 169, pp. 1–12, 2020. [Google Scholar]
17. S. Wei, W. Xinggang, W. Yan, B. Xiang and Z. Zhang, “DeepContour: A deep convolutional feature learned by positive-sharing loss for contour detection,” in 2015 IEEE Conf. on Computer Vision and Pattern Recognition (CVPR), Boston, MA, USA, pp. 3982–3991, 2015. [Google Scholar]
18. Y. Ganin and V. Lempitsky, “N4-Fields: Neural network nearest neighbor fields for image transforms,” in Computer Vision--ACCV 2014, Singapore, pp. 536–551, 2014. [Google Scholar]
19. S. Xie and Z. Tu, “Holistically-Nested edge detection,” International Journal of Computer Vision, vol. 125, no. 1, pp. 3–18, 2017. [Google Scholar]
20. L. Lou, and S. Zang. “Research on edge detection method based on improved HED network.” Journal of Physics: Conference Series, vol. 1607, no. 1, pp. 7–13, 2020. [Google Scholar]
21. Y. Liu, M. M. Cheng, X. Hu, J. W. Bian, L. Zhang et al., “Richer convolutional features for edge detection,” IEEE Transactions on Pattern Analysis and Machine Intelligence, vol. 41, no. 8, pp. 1939–1946, 2019. [Google Scholar]
22. K. Simonyan and A. Zisserman, “Very deep convolutional networks for large-scale image recognition,” Computer Science, vol. 32, pp. 25–37, 2014. [Google Scholar]
23. J. Dai, H. Qi, Y. Xiong, Y. Li, G. Zhang et al., “Deformable convolutional networks,” in 2017 IEEE Int. Conf. on Computer Vision (ICCV), Venice, Italy, pp. 764–773, 2017. [Google Scholar]
24. S. R. S. P. Malladi, S. Ram and J. J. Rodríguez, “Superpixels using morphology for rock image segmentation,” in 2014 Southwest Symp. on Image Analysis and Interpretation, Santa Fe, USA, pp. 145–148, 2014. [Google Scholar]
25. P. Arbeláez, M. Maire, C. Fowlkes and J. Malik, “Contour detection and hierarchical image segmentation,” IEEE Transactions on Pattern Analysis and Machine Intelligence, vol. 33, no. 5, pp. 898–916, 2011. [Google Scholar]
26. D. Mély, J. Kim, M. Mcgill, Y. Guo and T. Serre, “A systematic comparison between visual cues for boundary detection,” Vision Research, vol. 120, pp. 235–243, 2016. [Google Scholar]
27. X. R. Zhang, W. F. Zhang, W. Sun, X. M. Sun and S. K. Jha, “A robust 3-D medical watermarking based on wavelet transform for data protection,” Computer Systems Science & Engineering, vol. 41, no. 3, pp. 1043–1056, 2022. [Google Scholar]
28. W. Sun, L. Dai, X. R. Zhang, P. S. Chang and X. Z. He, “RSOD: Real-time small object detection algorithm in UAV-based traffic monitoring,” Applied Intelligence, vol. 74, pp. 1–16, 2021. [Google Scholar]
29. Z. Zhong, L. Zheng and G. Kang, “Random erasing data augmentation,” in Proc. of the AAAI Conf. on Artificial Intelligence, San Francisco, USA, vol. 34, 2017. [Google Scholar]
 | This work is licensed under a Creative Commons Attribution 4.0 International License, which permits unrestricted use, distribution, and reproduction in any medium, provided the original work is properly cited. |