| Computers, Materials & Continua DOI:10.32604/cmc.2022.029927 | |
| Article |
Model for Generating Scale-Free Artificial Social Networks Using Small-World Networks
Department of Information and Communication Engineering, Yeungnam University, Gyeongsan, 38541, Korea
*Corresponding Author: Gyu Sang Choi. Email: castchoi@ynu.ac.kr
Received: 14 March 2022; Accepted: 14 April 2022
Abstract: The Internet of Things (IoT) has the potential to be applied to social networks due to innovative characteristics and sophisticated solutions that challenge traditional uses. Social network analysis (SNA) is a good example that has recently gained a lot of scientific attention. It has its roots in social and economic research, as well as the evaluation of network science, such as graph theory. Scientists in this area have subverted predefined theories, offering revolutionary ones regarding interconnected networks, and they have highlighted the mystery of six degrees of separation with confirmation of the small-world phenomenon. The motivation of this study is to understand and capture the clustering properties of large networks and social networks. We present a network growth model in this paper and build a scale-free artificial social network with controllable clustering coefficients. The random walk technique is paired with a triangle generating scheme in our proposed model. As a result, the clustering control mechanism and preferential attachment (PA) have been realized. This research builds on the present random walk model. We took numerous measurements for validation, including degree behavior and the measure of clustering decay in terms of node degree, among other things. Finally, we conclude that our suggested random walk model is more efficient and accurate than previous state-of-the-art methods, and hence it could be a viable alternative for societal evolution.
Keywords: Social networks; small-world networks; network generation models; graph theory; random walk; network design; social network analysis
In recent years, social networks have gained popularity and the attention of researchers working in different fields of science [1]. Social networks offer a combined solution for network growth [2]. A few years ago, a trend in online social networks (OSNs) emerged. The number of OSNs is increasing quickly, and they have become popular in recent years [3].The most popular OSNs are Facebook and Twitter [4,5]. It was estimated that the number of Facebook users exceeded 1.8 billion in 2017 [6,7]. In a typical OSN, many users connect through several links [8]. Typically, the structure of a social network is dynamic because it grows quickly with the addition of new links [9]. These links denote interactions among the users in a network [10]. In these networks, social interaction is a fundamental problem [11]. The growth and evolution of networks is also a problem in network science, especially since networks constantly change over time. In this direction, a lot of research has been done. Plenty of graphical networks have been proposed, and are used for analyzing the structure of social networks. In many cases, the networks such as World Wide Web (WWW) exhibit complex structures. These networks are known as complex networks [12]. Generally, social networks are the same as complex networks and contain many short paths, known as small-world networks [13]. The small world has long been the subject of scientific interest in network growth and evolution. Initially, the small-world phenomenon was proposed by Watts and Strogatz [14]. They have demonstrated that the topology of some social and biological networks is neither completely random nor regular. Hence, they termed an intermediate network a small world [15]. In reality, the small-world phenomenon refers to the principle that all people are linked together by a short chain of acquaintances [16]. For instance, six degrees of separation is the idea that everyone is linked by a chain that is, at most, six people long [16]. For example, Fig. 1 demonstrates the small-world phenomenon. In this example, a group of people in a social network is shown. Given two people, Emma and Lucas, there is a chain of other people such that Emma knows Liam, who knows Noah, who knows Olivia, who also knows Lucas. Suppose that Emma holds a letter and wants to forward this letter to Lucas (the target person). Under the six degrees of separation theory, she forwards it to a neighbor (e.g., Liam). The condition imposed on this network is that each participant can advance the letter only by forwarding it to a single acquaintance. Hence, Emma forwards it to Liam, Liam sends it to Noah, then Noah to Olivia, and finally, it reaches Lucas via Olivia. In this figure, we can observe that short paths (no more than six hops) always exist between all people. This is known as six degrees of separation [14]. Small-world networks comprise three significant properties: (i) degree distribution (ii) clustering coefficients, and (iii) path lengths [17]. The degree of a node in the network is the measure of how many connections the node has. A subgraph of a small world contains many connections between any two nodes, termed a clustering coefficient. Furthermore, in a network, pairs of nodes are linked by at least one short path, called the path length. A lot of researchers have focused on the effect of different aspects of the small world, such as spreading a disease [18,19], the Internet [20], and metabolic networks [21]. These networks share three significant properties [21]. (1) The average path length remains as small as possible; hence, only a few edges are available when two nodes on a graph are to be attached. (2) The average clustering coefficient is large enough to yield a separation of nodes containing common neighbors that are far from each other. (3) The degree distribution of these networks should be scale-free because it follows the power law [22]. Typically, the lack of a scale-free structure for node connectivity is often related to these networks [23]. Social network analysis (SNA) [24], is a process of investigation to study a social structure through graph theory and networks [7]. In a social network [25], it is nearly impossible to obtain the information of all nodes in the network. Typically, SNA is observed in many practical circumstances where a social network is addressed using publicly available interfaces, such as an application programming interface (API) [26]. An API is used to answer a query regarding a target node. In many networks, a public interface is available for analysis of a network. In Fig. 2, a scientist obtains a node ID and a friendship list from a social network using a public API. The self-loop shows the repetition of the scientist’s query. The estimation of structural measures in this network is performed by using the public API. The research on providing public interfaces has received much attention in recent years [27]. To calculate the clustering coefficient of these networks, scientists apply the query to nodes other than the sampled nodes. In fact, in social networks and large scale networks, the estimation of network-based features is difficult because the sizes of these networks are extremely large [28,29]. Also, they contain large datasets that are occasionally unavailable because of privacy concerns [30]. To overcome these issues, authors have proposed several processes, such as the random walk [31]. The random walk is a Markov chain process in which a sequence of nodes is visited using a succession of random steps [31]. Fig. 3 shows the simple process of a random walk in a network. In this figure, the number of nodes in graph
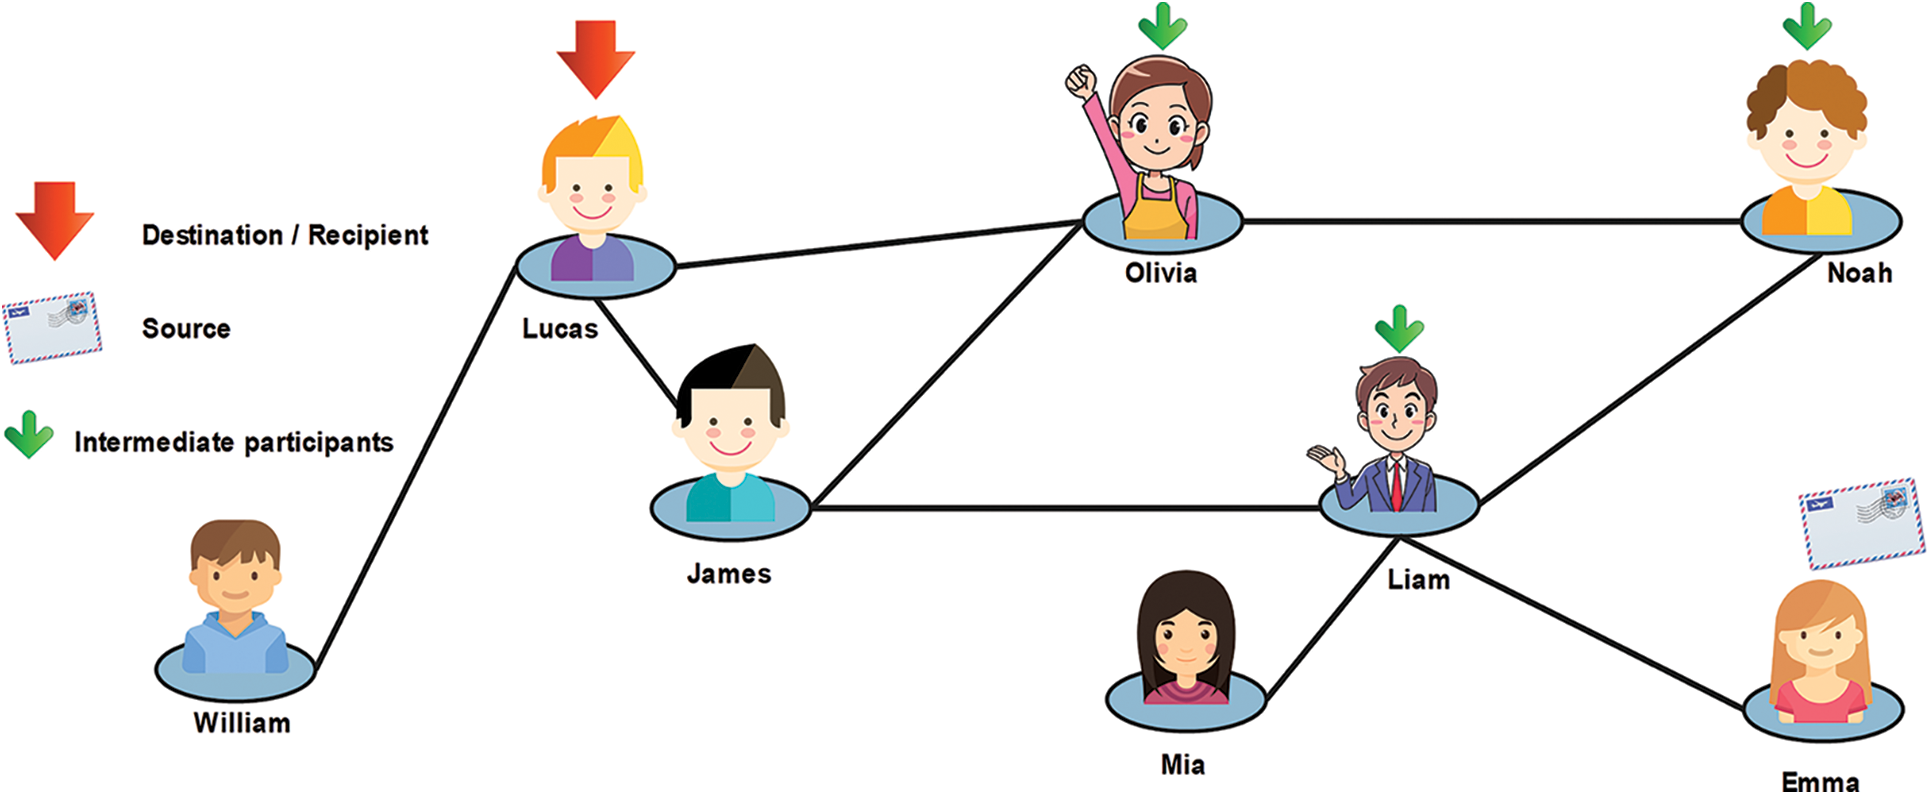
Figure 1: An example of a small-world network
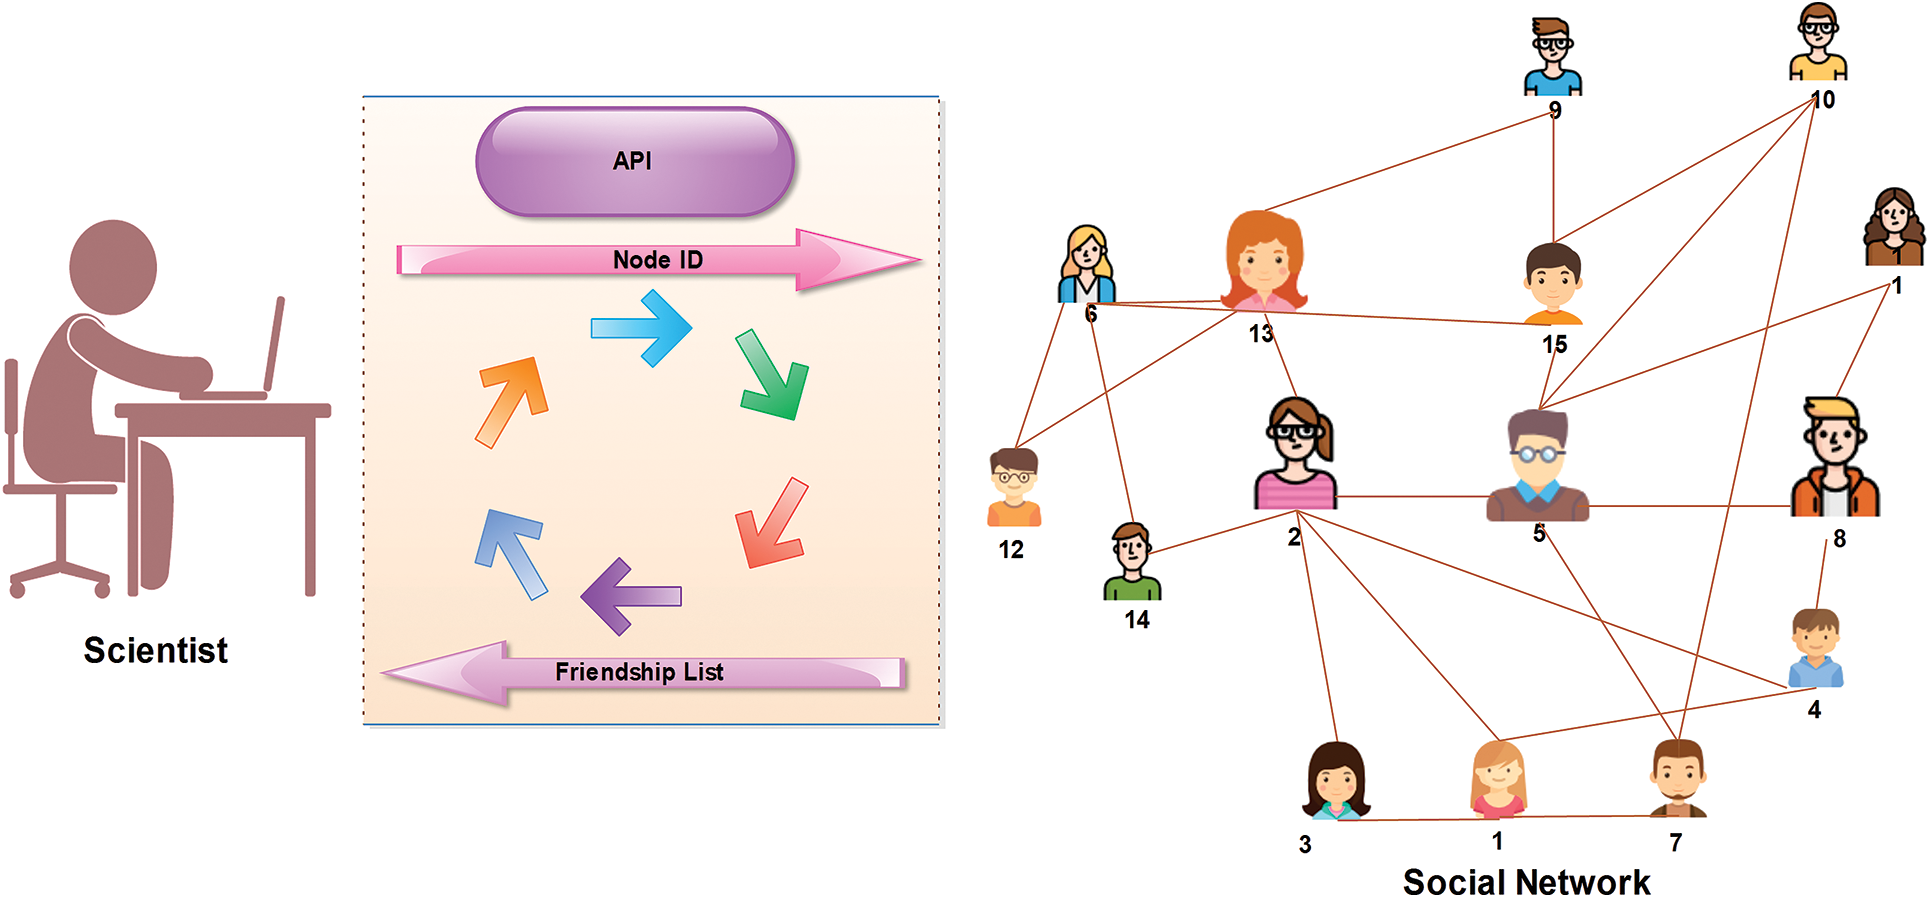
Figure 2: Social network interaction using an API
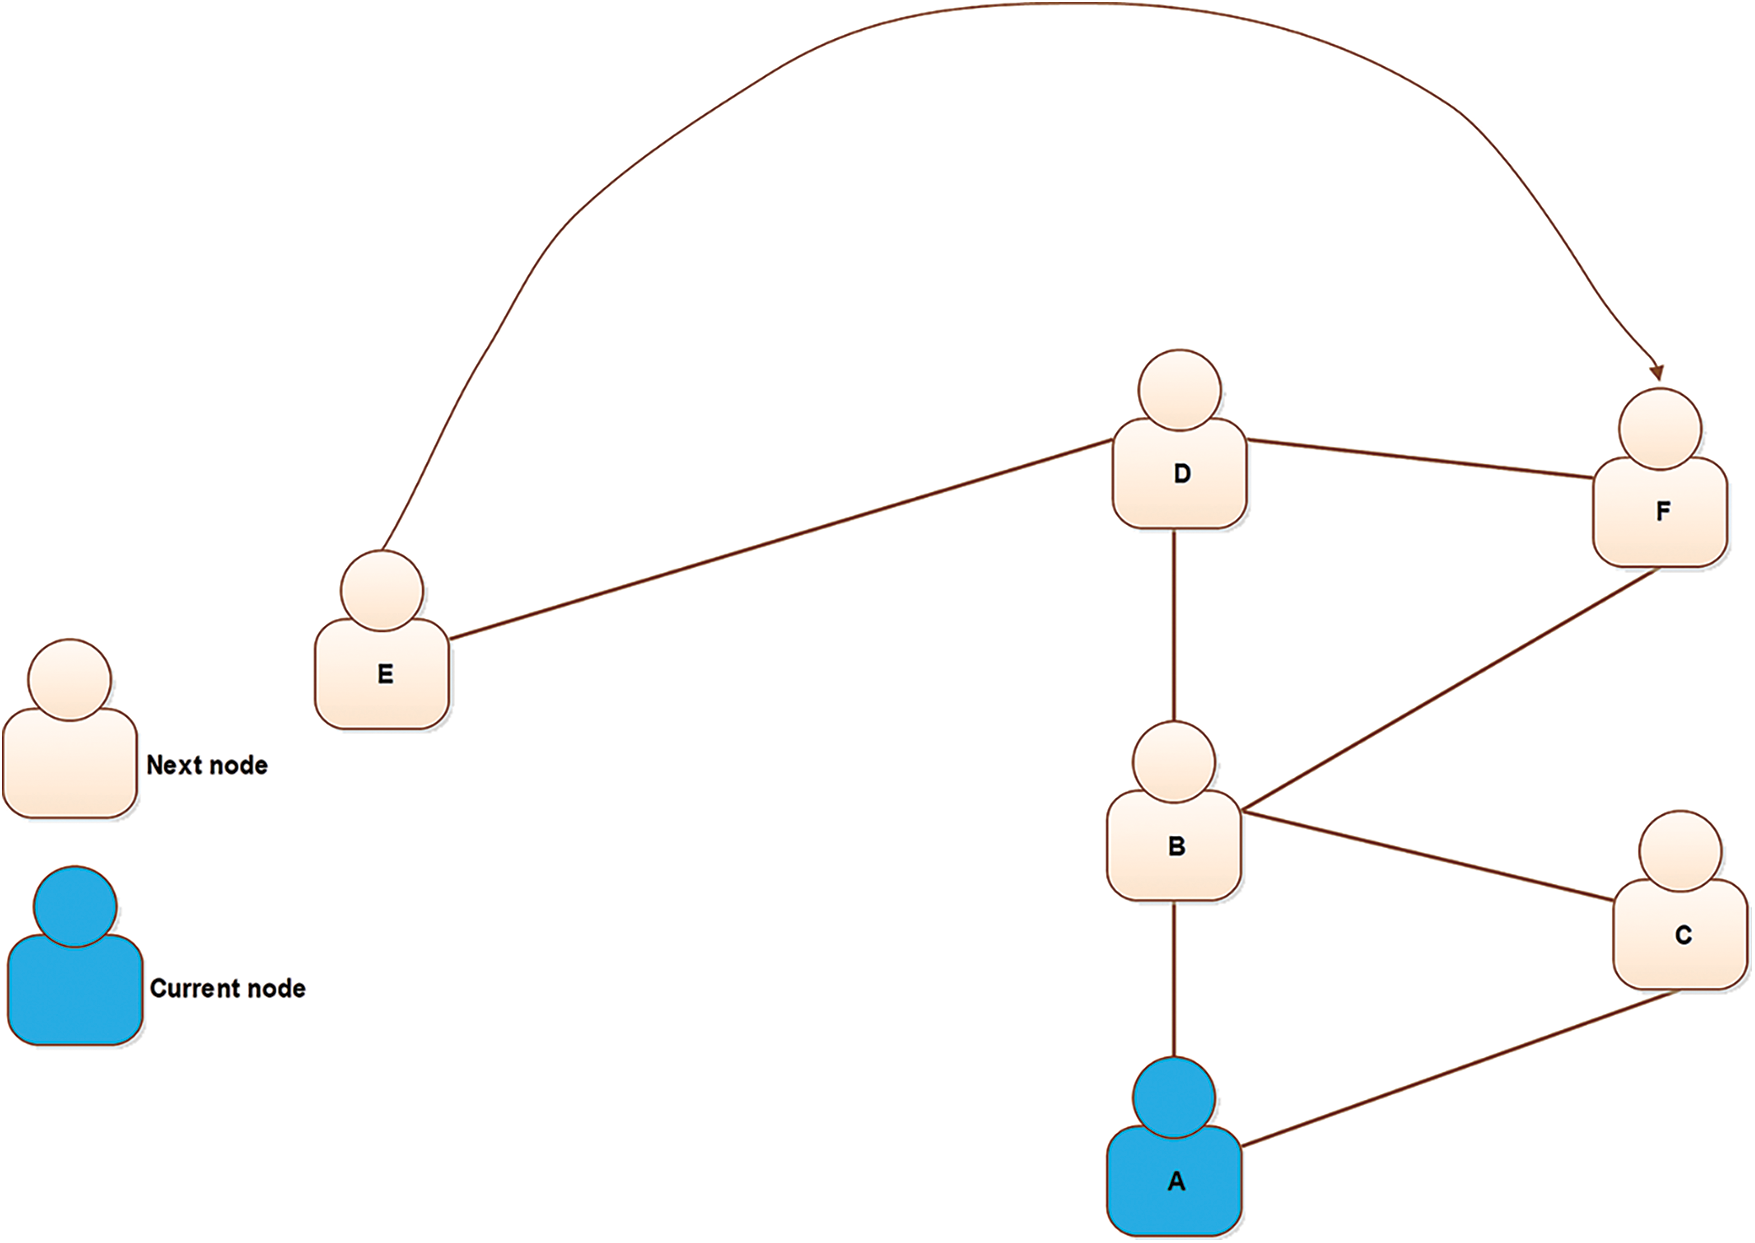
Figure 3: An example of a simple random walk process
The motivation of our study is to capture the basic network properties of large-scale social networks [3,21,36] These networks have larger clustering than the state-of-the-art Barabasi and Albert (BA) model [22]. The artificial social network generation, growth, and evolution of networks is a fundamental problem in network science [2], especially since networks constantly change over time. The random walk process is helpful for the construction of an artificial social network. Therefore, in this study, we discuss the concept of the artificial social network construction model. This growth model reaches toward highly connected nodes and is attained by using a random walk. This study intends to understand the key properties of small-world networks and to enable them to be used for the growth of the network. Several network-generation models have been proposed in the past. These models have both scale-free and small-world properties. For example the author network [37] and the author’s collaboration network [38] etc. In general, randomly generated networks are used to explore the predictions of a theory in the context of a social network. This study is a connection between small-world networks and scale-free networks. More specifically, it is a unifying concept provided in a single model.
The main contributions of this study are given below.
• We propose a scale-free, artificial social network generation model that is purely local, requiring no global selection of nodes, or any initial network.
• The random walk model is used to generate artificial networks that incorporate the properties of small-world and scale-free networks, with the additional advantage of having an adjustable clustering coefficient.
• Using a visual analytics method introduced earlier [38], we demonstrated that there are considerable structural differences between networks that are generated by real-world artificial social networks.
The benefits of this study are given below.
• It will be helpful to researchers who wish to learn the methods of generating artificial networks.
• The researchers who want to understand the structural properties of a network.
• This research is also beneficial for several network mining problems including extrapolation, sampling, model testing, etc.
In Section 2, we discussed standard network measures. Subsequently, we present prior studies on scale-free and small-world networks. we discussed classic random walk models (along with their limitations) and also the problem statement. We discussed our proposed model in Section 3. Section 4 offers detailed experimental results and a discussion related to this study. The conclusion and future work from this study are presented in Section 5.
2 Standard Network Measures and Related Studies
This section is divided into three subsections. In Section 2.1, we discuss classic standard measures in networks. In Section 2.2, we discuss the scale-free and small-world concepts along with their limitations. In Section 2.3, we discuss a few studies related to the classic random walk.
In this section, we first discuss the standard network measures, and then, we discuss the relationships between these network measures.
Perhaps the most important property of a node in a network is its degree. Node degree illustrates the number of nodes that are directly connected. Generally, nodes may have any whole-numbered degree (including zero, for an isolated node that is not connected to any other). In a network, the degree will be twice the number of edges. In most networks, every edge is usually incident to two different nodes.
The degree distribution is how the degrees of the nodes arise across the network, i.e., the number of nodes in a network with degree 1, degree 2, and so forth. In short, any network will have the largest (maximal) and the smallest (minimal) degree.
which indicates that
The clustering coefficient is used to measure the grouping, or the triadic closure, in a graph. It is a calculation of the number of triangles in the network. More simply, it is a measure of the extent to which one’s friends are also friends of each other:
where
The path length (geodesic) is the average distance between two nodes chosen at random. The path length lies in the range between
where
2.2 Concepts of Scale-free and Small-world Networks
We divided this section into three distinct subsections. In Section 2.2.1, we discuss a few studies related to the small-world network. In Section 2.2.2, we discuss two basic concepts: scale-free and PA. In Section 2.2.3, we performed a survey and compare various studies in tabular form.
The patterns in several networks, such as the social network [36,39], the technological network, the biological network, and the information network, are explained by complex networks. A random graph is a collection of randomly connected pairs of nodes with a Poisson degree distribution. The only problem with that random model is that it is not completely appropriate for clarifying the behavior of both random and complex networks. Traditionally, a few methods are used by random networks, such as the Erdős-Rényi (ER) model [40]. The ER model is one of the simplest, in which every possible edge is created with the same constant probability. This network starts with isolated nodes (having no edges). It adds an edge between a pair of nodes at a random time. The addition of random edges to a node is based on two parameters; the first is the number of nodes, i.e.,
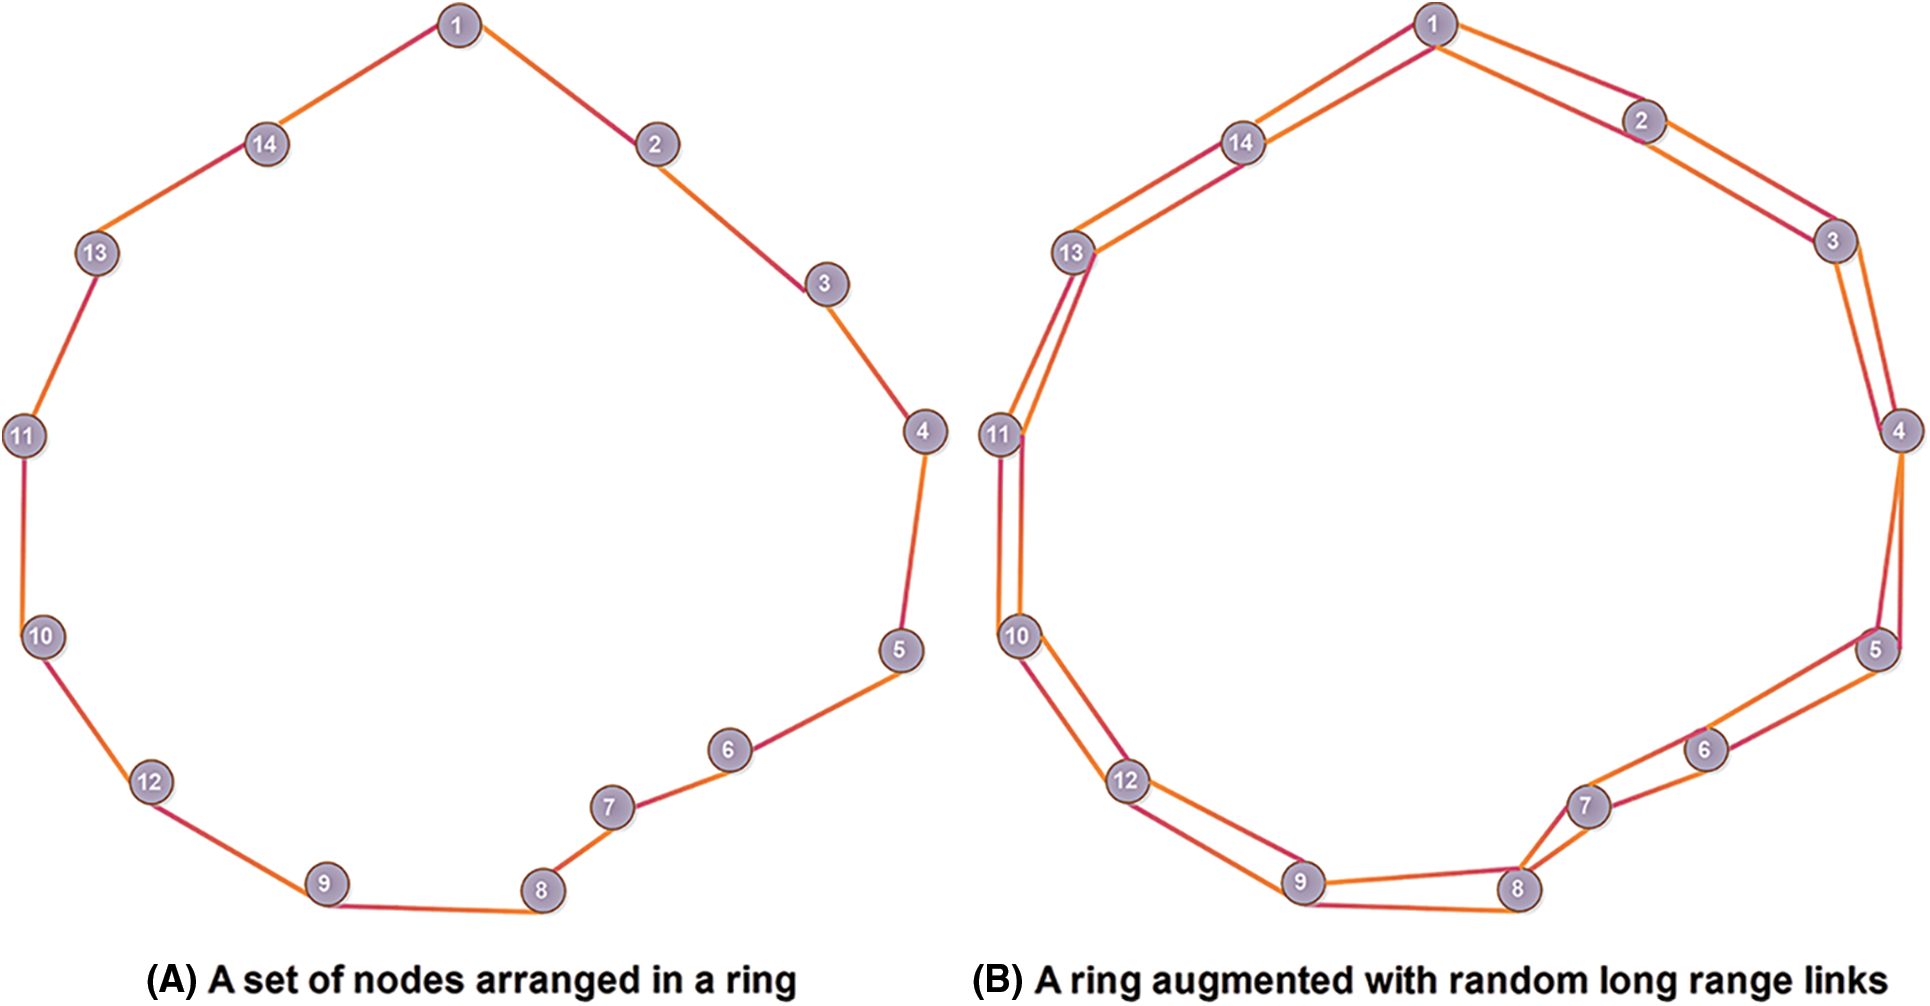
Figure 4: The WS model
2.2.2 Preferential Attachment and the Existence of the Scale-free Network Structure
Saramäki et al. [5], introduced the power law by Barabási et al. [22]. This model is used to find the formation of hubs in a network. In addition, it combines the simple principle of growth and PA. According to the power law, when a new node is added to the network, it is preferentially linked to the nodes already processing a large number of links. The proposed model is based on two fundamental laws. The first is network growth, and the second is PA [5]:
• In the growth phase, at each timestamp, a new node is added with
• During PA, the attachment preference for a node is only assigned to high-degree nodes.
According to the power law, when a new node is about to join a network, it is preferably linked to the current nodes that constitute a large part of the links in the network. The computed probability,
Fig. 5 illustrates the PA process. In Fig. 5A, the network growth using PA is shown. The network grows by adding a new node in the network. The new node selects a link, as indicated by the black arrow. In Fig. 5B, a new node connects with equal probability to one of the two nodes at the ends of the selected link. In this case, the new node connects to the node at the right end of the selected link. This intuitive method results in the generation of a scale-free network [5]. The BA algorithm uses global information. The BA model was proposed by assuming that in the WWW, new pages link preferentially to the hubs (i.e., very well-known sites such as Google) rather than to pages that hardly anyone knows about. In this model, the authors assumed that every new node has complete information about the whole network, which is not true for large networks and real networks [41]. They did not state completely how PA should be performed. PA typically uses global information on node degrees from the entire network but differs compared with many real networks, such as social networks, the WWW, etc. In addition, the integration of new links in the network is difficult.
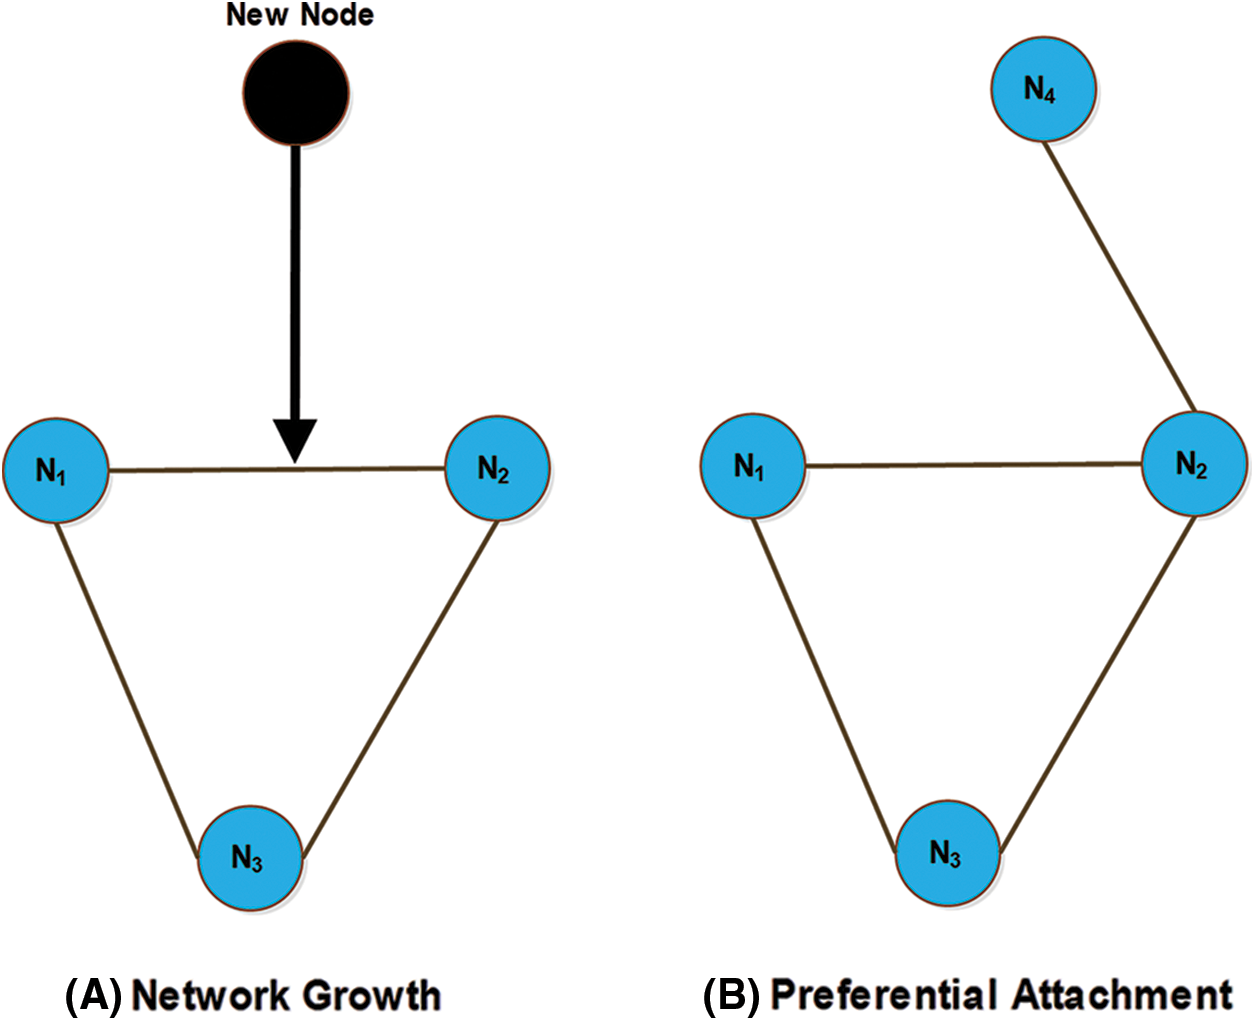
Figure 5: The preferential attachment
2.2.3 Comparison Between Scale-free and Small-world Networks
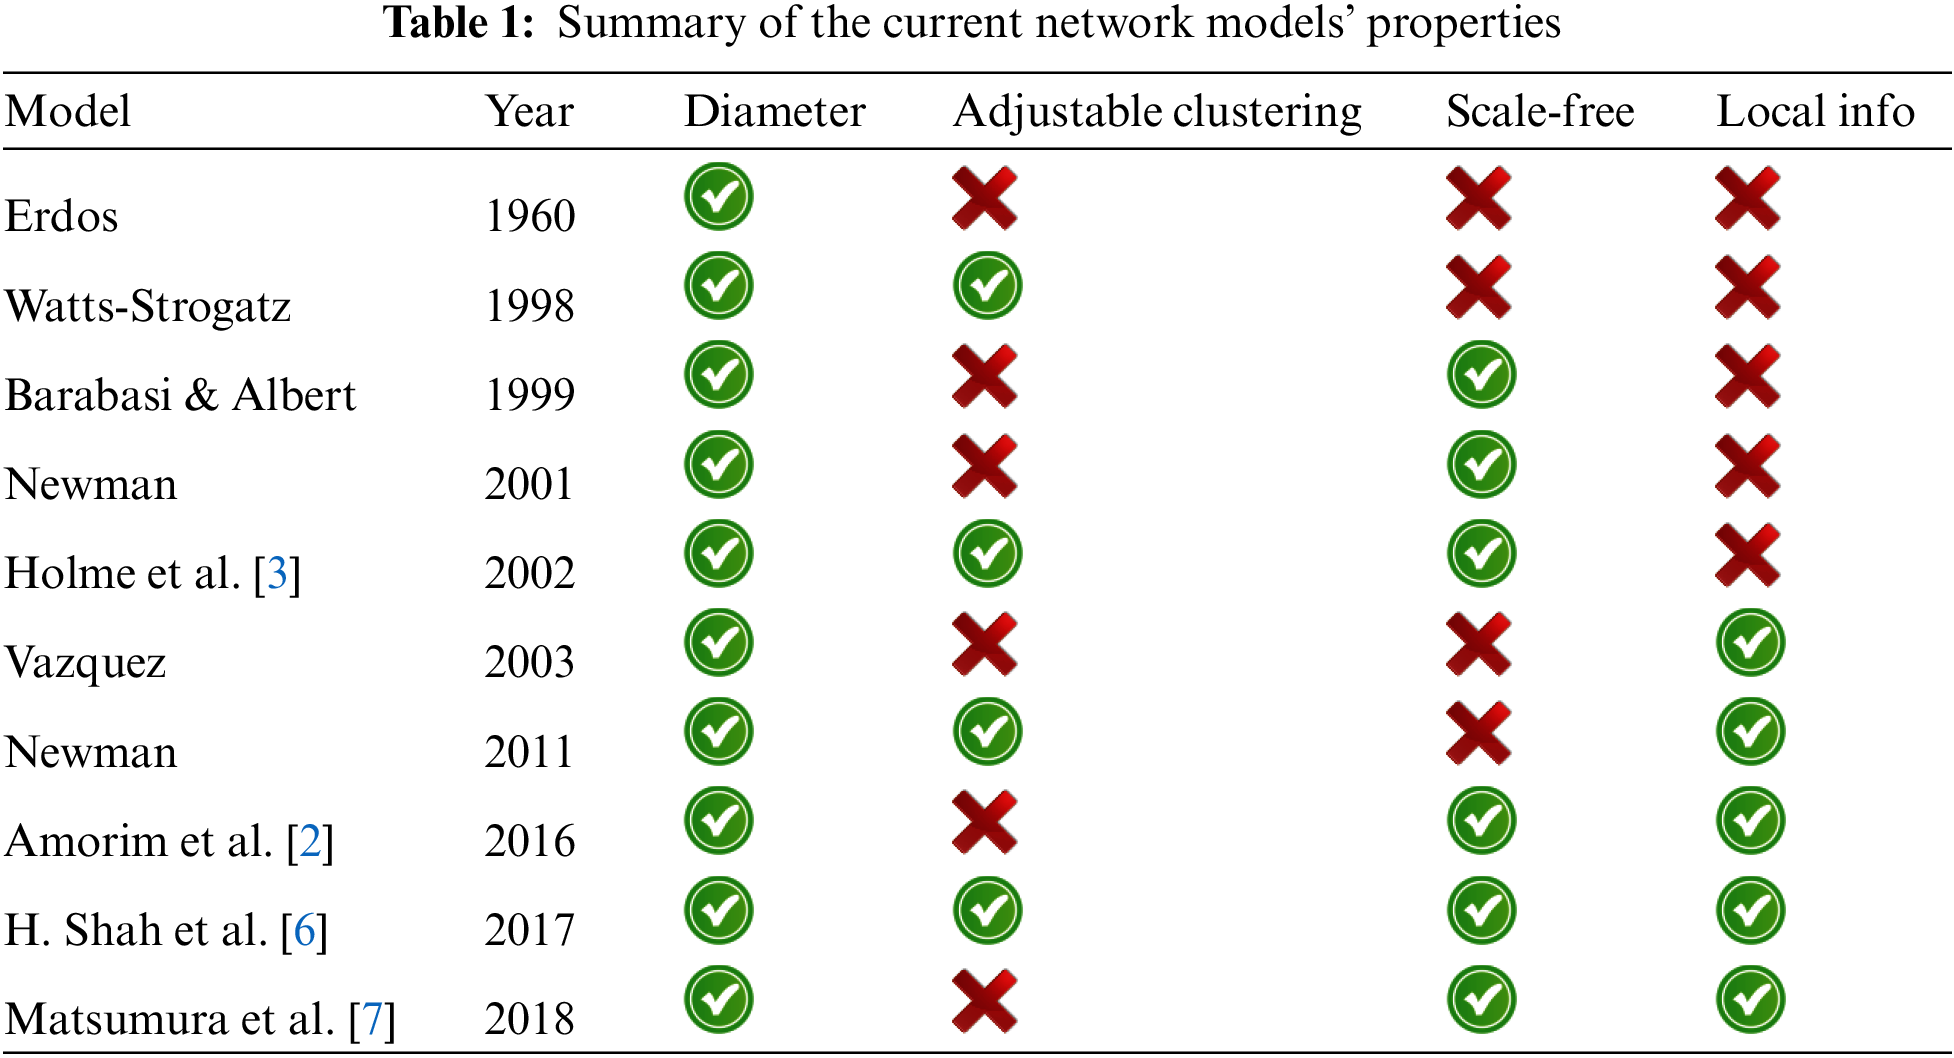
BA model provides the key information for scale-free networks, and the WS model has small-world properties [41]. The WS model exhibits high clustering, but lacks power-law degree distribution, whereas the BA model exhibits the scale-free property but does not possess high clustering. Dorogovtsev and Mendes [42] proposed a simple clustering model for scale-free networks. The addition of new, undirected vertices is made at each stage. However, their model does not describe real networks because they have a fixed average degree. Tab. 1 provides a comparison of different network models, along with the different metrics discussed in the previous section. In this table, we can see which model has a lack of local properties, such as diameter and the clustering coefficient. In this tabular representation, we can easily examine how each model is described. In addition, we can identify which models lack network properties. The objective of this study is to propose a network growth model combining the features of scale-free and small-world networks by using a random walk and producing a network. For that purpose, we modified the BA model by using a random walk method, and our objective is to incorporate a navigable triadic closure. The presence of scale-free structures in many real networks inspired us to write this proposal and further investigate features of real networks, such as short diameters, clustering, and long-tail distribution.
2.3 Classic Random Walk Models and the Problem Statement
In this section, we first discuss a few classic random walk processes, and then, we discuss the problem statement.
2.3.1 Classic Random Walk Models
Generally, in real networks, adding a new node would not require global information about the network. Several studies have been conducted in which local network information is used to spawn scale-free networks without using global information [43,44]. One of these approaches demonstrates how a random walk process is used for the selection of a node that can be attached. This study proves that it can be used for the growth of a network. In [12,5,45], the authors successfully employed different random walk algorithms. A random walk having length
where
Katzir et al. [49] suggested the average clustering coefficient of a network using a random walk process. In their proposed algorithm, an SRW algorithm was disseminated slowly over the space in a social network. Their proposed algorithm performed better than other approaches, such as the one in [32]. Iwasaki et al. [50] proposed an algorithm for the estimation of the clustering coefficient in social networks using a sample query. They proposed a non-backtracking random walk (NBRW) [50]. That method is based on the counting of triangles obtained during sampling. They used the NBRW as a public API interface that theoretically displays the information retrieval of a social network. Cohen et al. [51] introduced the concept of reaching highly connected nodes by using random links. A recent study was conducted by H. Shah et al. in [6]. In this study, the authors propose a random walk network growth model using resource constraints. The objective of this model is to be to explain how the real-world network properties were affected by using edge formation like resource constraints. In this model, before starting a random walk, at first, each node that joins the network select a recent node as a seed. The linking of the node is performed based on probability. Later on, it follows the outgoing and the incoming of this seed node and arrived at each node. Every time the new incoming node will decide to link with the same constant linking probability. Then each node either has to decide whether to jump back to the seed node or may follow these incoming and outgoing links. This process is repeated several times. Briefly, this is a local procedure and the linking of a node will be performed without contacting the whole network. The only problem with this method is that they did not discuss the clustering coefficient along with degree distribution. Leskovec et al. [52] discussed the behavior of a graph over a certain time. Their main concern in this paper is to confirm that does the graph changes over a certain time or not. Therefore, they performed a careful analysis using three laws, the densification power law, the community-guided attachment model, and the forest model. In this study, they reported that all of these models behave differently. They observed that most graphs are heavily trailed using in-degree and out degrees. In addition, they have also shrinking by increasing a diameter. Briefly, they discovered a very interesting phenomenon that in a large number of graphs the diameter is changed over the increasing interval of time [53]. Finally, they proposed a new graph generator model based on ‘forest fire’. Their model requires very few parameters such as; the flammability of nodes. They are producing a full range of properties observed in the present and prior studies. Amorim et al. in [2] discussed a scale-free mechanism named No Restart Random walk (NRRW) for the growth of a network using random walk. Initially, their network starts with a single node by using a self-loop. The random walker placed on that node and each walk comprised s number of steps. At each time, new nodes are added to the node, which resides the walker. The walk ends after completing n number of nodes. The proposed model is good but they did not discuss the clustering coefficient in this study. Matsumura et al. [7] discussed a random walk method for estimating the Average path length (APL) in social networks. This crawling-based graph method is suitable for scale-free networks, but in this study, they did not discuss the computation of the clustering coefficient. Saramäki et al. [5], introduced a scale-free network method by adopting PA for local approximation in the network. It is based on BA model; thus, it has three phases: network initialization, growth, and finally, linking. During network initialization, the placement of vertices in the network is performed. In the growth phase, one of the vertices is chosen as a starting point for the walk. Finally, in the linking phase, a new vertex is added to the network, and a link is created between the new vertex and the existing vertices. We observed in this method that when a new node has already been connected to the first chosen node, no triangle is generated. Moreover, we can see that when
In our study, we consider the growth and evolution of networks as a fundamental problem in network science, especially because networks constantly change over time. The random walk process is helpful for the construction and growth of the network. We observed from earlier studies that although triadic closure is helpful for the growth of a network, the incorporation of dynamic triadic closure will produce more powerful and bigger networks. After reviewing several research ideas, our key findings are as follows.
• The scale-free concept and the power law, including directing rules, are helpful in the growth and the construction of an artificial network.
• An algorithm is efficient if it uses its local information. The connections are also important in a local network. The introduction of local immunization strategies is effective for the growth of a network.
In this section, we suggest a random walk model for the growth of a network where the clustering coefficient can be estimated and adjusted dynamically. The proposed model is closely related to the recent studies related to growing networks through random walk models by Amorim et al. [2], Matsumura et al. [7], Saramäki et al. [5] and Katzir et al. [49] and Leskovec et al. [52]. These models allow a random walk to take steps before linking a node. The key difference is that we use certain random walk properties that can control the formation of a triangle in the network.
3.1 Basic Preliminaries and Notations
We denote as
There are three basic steps involved in this model.
• Network initialization: In the first step, network initialization is performed by adding new vertices to the network. One node at a time
Figure 6: Network initialization
• Network growth and scale-free degree distribution: In this step, the probabilities
Figure 7: Imposing the bernoulli distribution
• Linking by random walk: The next step is to select a random node. Thus, node
Figure 8: The proposed model
Hence, in our proposed algorithm we have used the following design parameters:
where
where
4 Experimental Results and Discussion
In this section, we present our experimental results in detail. We have divided this section into two subsections. At first, we have discussed the preliminaries of the power law, and then we have discussed the achieved experimental results.
4.1 Preliminaries: Generating Power Law
First, we need to define the initial seed and
Figure 9: Visualization of a completely connected random graph
Hence, to address this issue, we have designed a ring lattice with
In this section, we have discussed experimental results in terms of degree distribution and triadic closure. We performed a series of experiments using Network X [58]. Network X is a powerful Python package used for the manipulation, creation, and study of the network structure in complex networks. It is used to study large complex networks represented in form of graphs with nodes and edges. Using network X, we can load and store complex networks.
4.2.1 Degree Behavior and the Emergence of Scale-free Structure
The emergence of a scale-free structure during the growing process is discussed in this section. Fig. 10 demonstrates the complementary cumulative distribution function (CCDF) of nodes on a log scale for various values using Saramäki RW (Random walk) [5], No Restart Random Walk (NRRW) [2], and our proposed model. We have calculated this result and got an average of over 100 runs with
Figure 10: Comparison of degree distribution
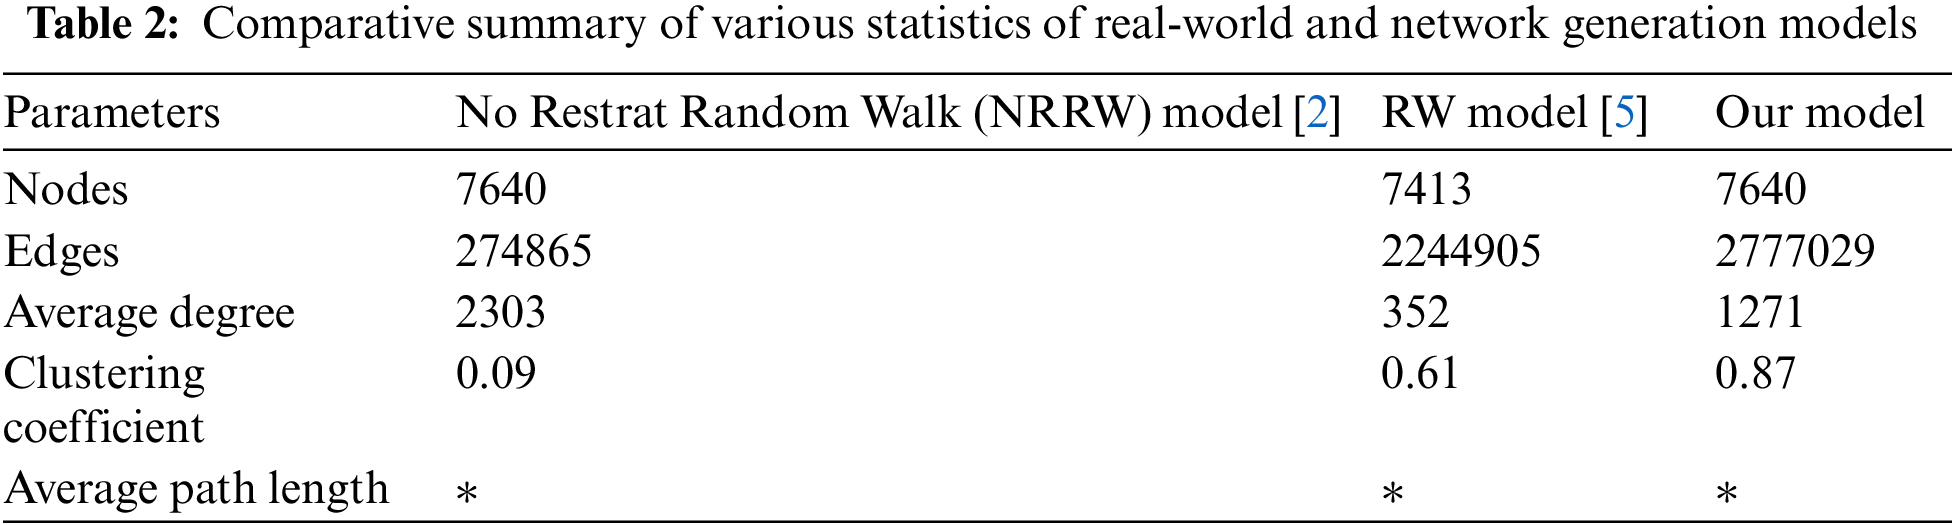
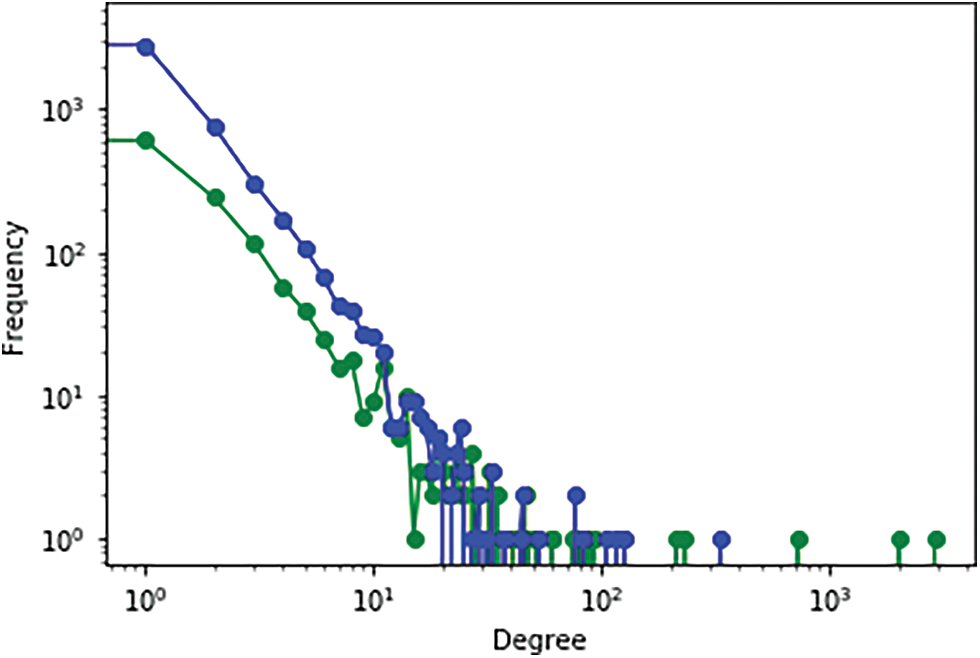
Figure 11: Accuracy of growth models
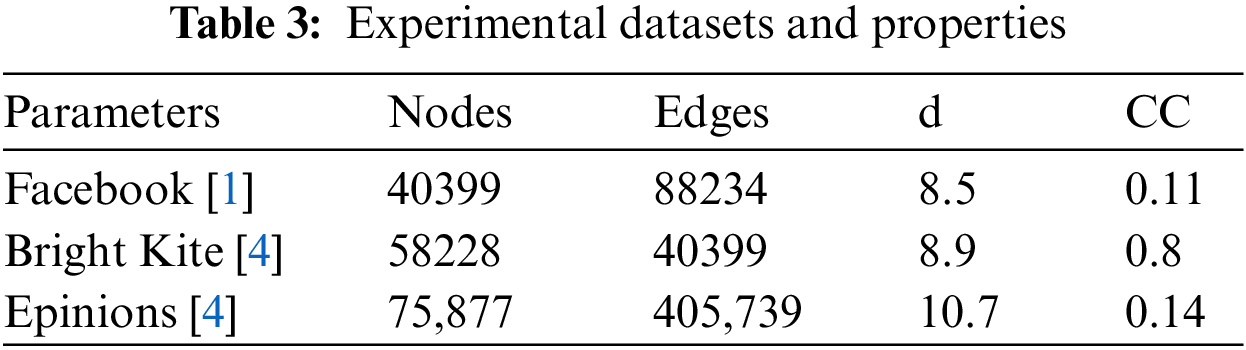
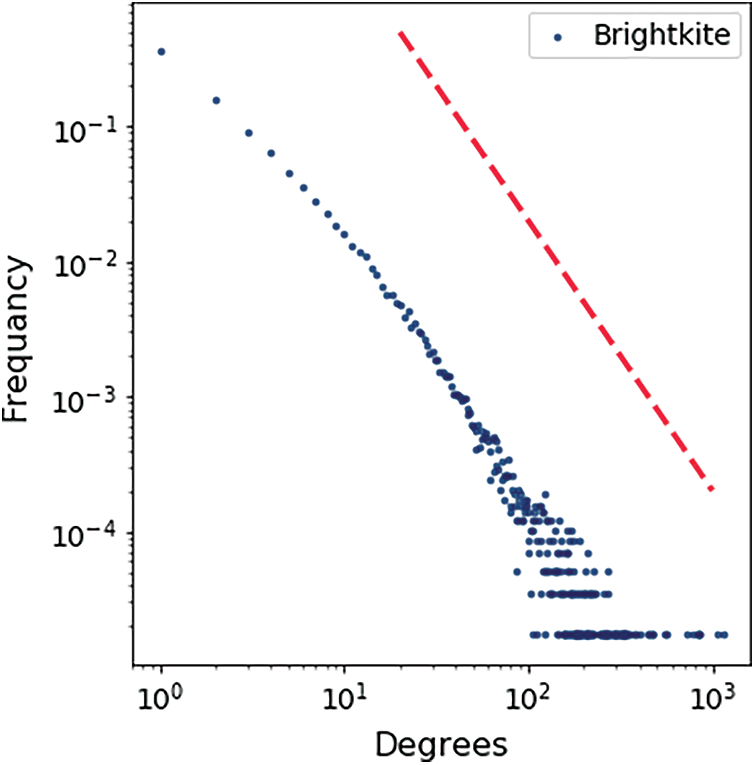
Figure 12: Bright kite
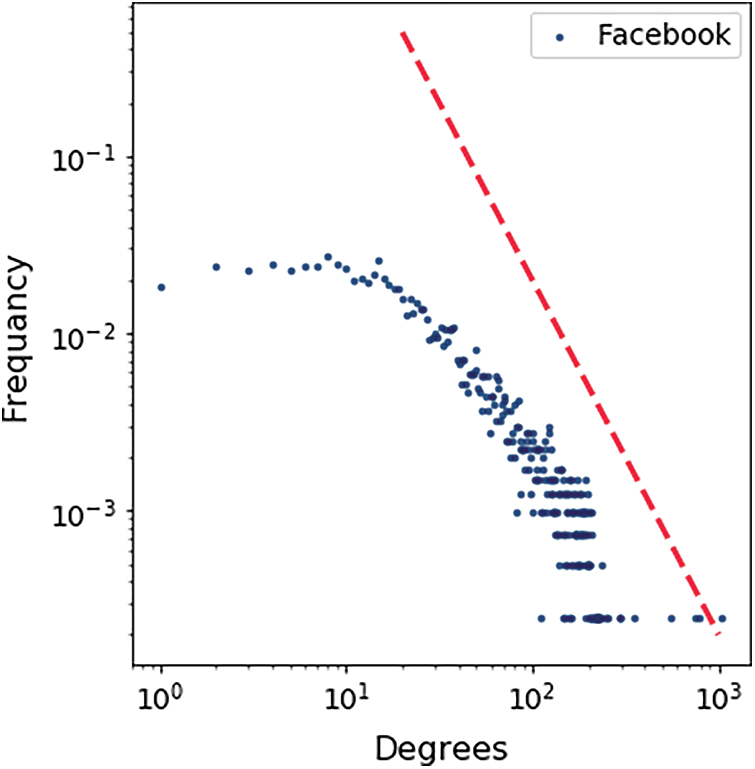
Figure 13: Facebook
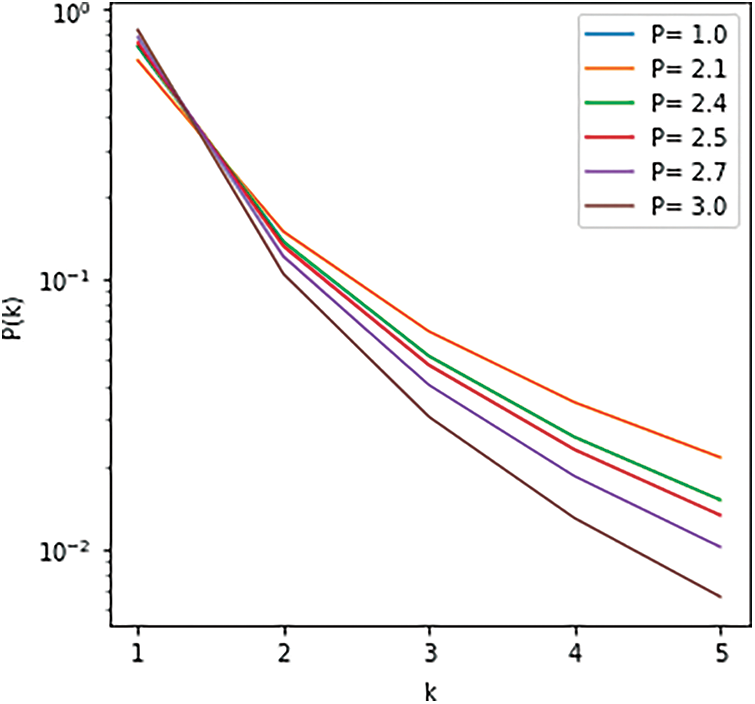
Figure 14: Empirical CCDF
4.2.2 Adjustable Clustering Coefficient Control
We have implemented the clustering coefficient control mechanism by changing the value of probability, i.e., clustering control parameter
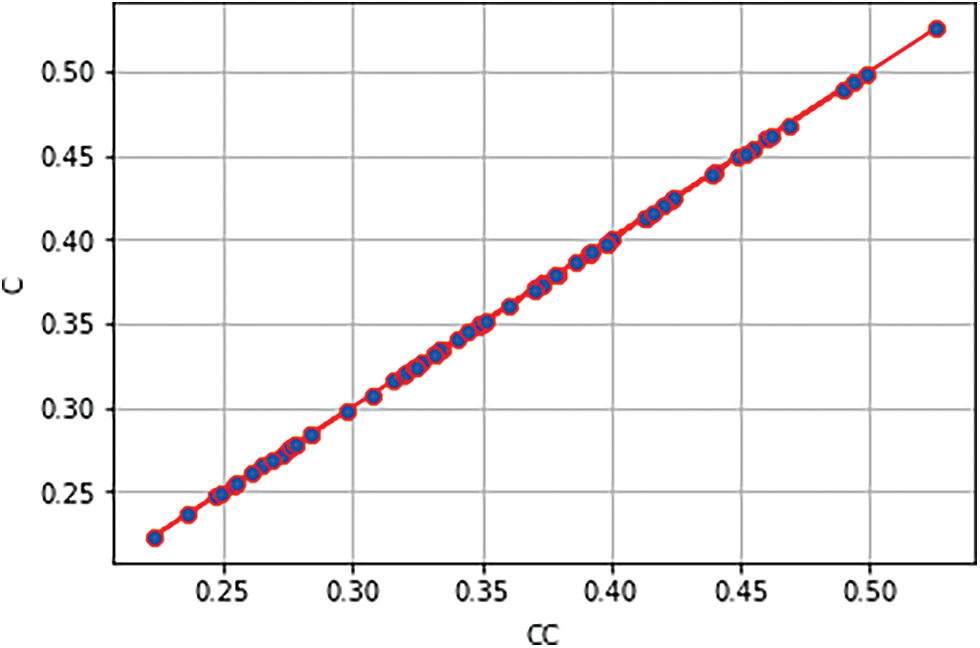
Figure 15: Clustering coefficient control
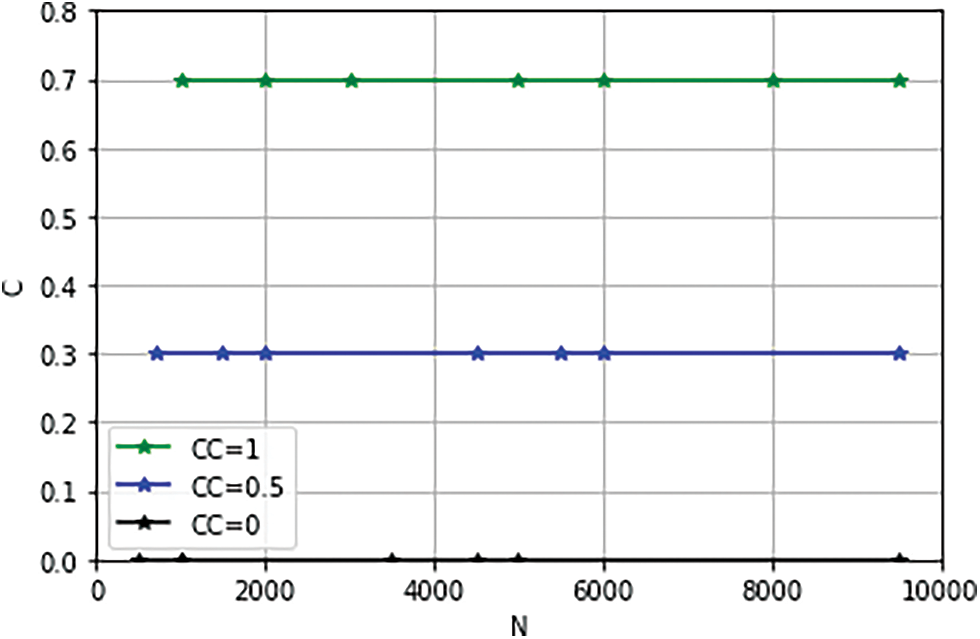
Figure 16: Empirical result of variation in clustering coefficient
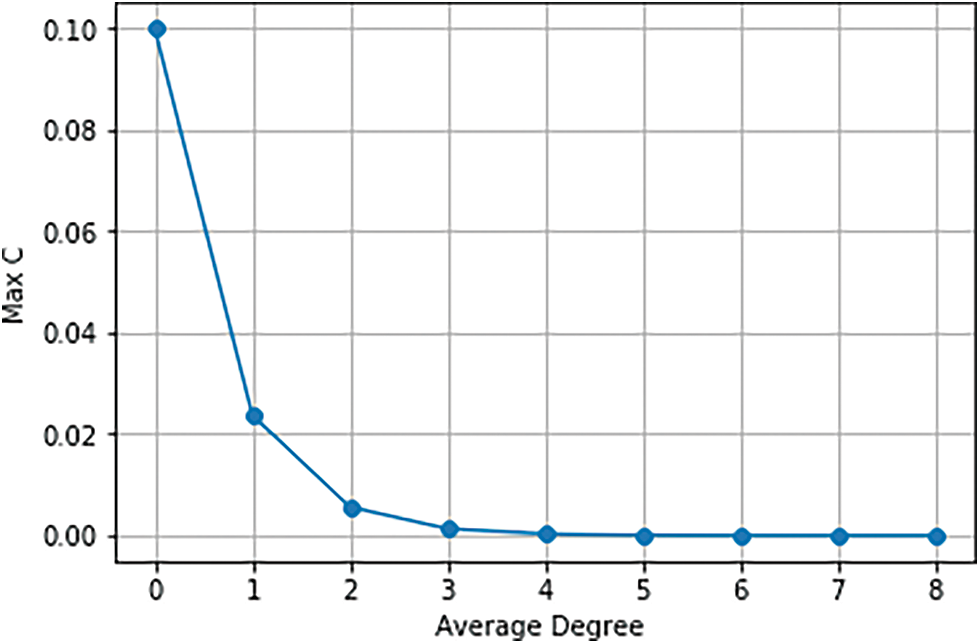
Figure 17: Clustering coefficient decay with average
5 Conclusion and Future Research Directions
We herein define a network growth model that is completely based on the properties of self-organized networks.
Typically, highly clustered and scale-free networks are used. We considered the dependence and growth of networks that are similar to the small-world transition. This phenomenon was observed in many cases of static networks, especially when link rewiring to a regular grid is required. Hence, our study demonstrated a connection between the small-world and scale-free networks. Our proposed random walk model dynamically estimates the clustering coefficient and degree distribution in the network. The proposed random walk model considerably outperformed state-of-the-art methods. We tested our algorithm and concluded that our random walk model is helpful for network growth. Moreover, it is also highly efficient in terms of attaining the node degree and high clustering. Our model is beneficial for several network mining problems including extrapolation, sampling, and model testing. The path length was not discussed, although it is an important property of small-world networks. This will be addressed in future studies.
Acknowledgement: We thank our families and colleagues who provided us with moral support.
Funding Statement: This work was supported in part by the Basic Science Research Program through the National Research Foundation of Korea (NRF) funded by the Ministry of Education under Grant NRF-2019R1A2C1006159 and Grant NRF-2021R1A6A1A03039493, and in part by the 2021 Yeungnam University Research Grant.
Conflicts of Interest: The authors declare they have no conflicts of interest regarding the present study.
References
1. B. Viswanath, A. Mislove, M. Cha and K. P. Gummadi, “On the evolution of user interaction in facebook,” in Proc. of the ACM Workshop on Online Social Networks, New York,United States, pp. 37–42, 2009. [Google Scholar]
2. B. Amorim, D. Figueiredo, G. Iacobelli and G. Neglia, “Growing networks through random walks without restarts,” in Proc. of the 7th Workshop on Complex Networks, Paris, France, pp. 1–13, 2016. [Google Scholar]
3. P. Holme and B. J. Kim, “Growing scale-free networks with tunable clustering,” Physical Review, vol. 65, pp. 1–4, 2002. [Google Scholar]
4. J. Leskovec and A. Krevl, “SNAP datasets: Stanford large network dataset collection,” in Proc. of the IEEE Tencon, New York, United States, pp. 1–10, 2014. [Google Scholar]
5. J. Saramäki and K. Kaski, “Scale-free networks generated by random walkers,” Physica A: Statistical Mechanics and its Applications, vol. 341, no. 24, pp. 80–86, 2004. [Google Scholar]
6. H. Shah, S. Kumar and H. Sundaram, “Modeling network growth under resource constraints,” Computing Research Repository (CoRR), vol. 1, pp. 1–11, 2017. [Google Scholar]
7. T. Matsumura, K. Iwasaki and K. Shudo, “Average path length estimation of social networks by random walk,” in Proc. of the IEEE Int. Conf. on Big Data and Smart Computing (BigComp), Shanghai, China, pp. 611–614, 2018. [Google Scholar]
8. F. Amin, A. Ahmad and G. S. Choi, “Community detection and mining using complex networks tools in social internet of things,” in Proc. of the IEEE Tencon, Jeju, pp. 2086–2091, 2018. [Google Scholar]
9. F. Amin and G. S. Choi, “Hotspots analysis using cyber-physical-social system for a smart city,” IEEE Access, vol. 8, pp. 122197–122209, 2020. [Google Scholar]
10. Z. Yu, G. Kening, L. Feng and Y. Ge, “A new method for link prediction using various features in social networks,” in Proc. of the Web Information System and Application Conf., Tianjin, China, pp. 144–147, 2014. [Google Scholar]
11. L. Yao, L. Wang, L. Pan and K. Yao, “Link prediction based on common-neighbors for dynamic social network,” Procedia Computer Science, vol. 83, no. 1, pp. 82–89, 2016. [Google Scholar]
12. A.-L. S. Baraba´si, “Statistical mechanics of complex networks,” Reviews of modern physics, vol. 74, pp. 47–97, 2002. [Google Scholar]
13. F. Amin, A. Ahmad and G. Sang Choi, “Towards trust and friendliness approaches in the social internet of things,” Applied Sciences, vol. 9, no. 1, pp. 1–25, 2019. [Google Scholar]
14. D. J. Watts and S. H. Strogatz, “Collective dynamics of ‘small-world’ networks,” Nature, vol. 393, no. 6684, pp. 440–442, 1998. [Google Scholar]
15. R. Abdul, A. Paul, M. J. Gul and W.-H. Hong, “Exploiting small world problems in a SIoT environment,” Energies, vol. 11, no. 8, pp. 1–18, 2018. [Google Scholar]
16. J. Kleinberg, “The small-world phenomenon: An algorithmic perspective,” in Proc. of the Thirty-Second Annual ACM Symp. on Theory of Computing, Portland Oregon, USA, pp. 163–170, 2000. [Google Scholar]
17. F. Amin, R. Abbasi, A. Rehman and S. G. Choi, “An advanced algorithm for higher network navigation in social internet of things using small-world networks,” Sensors, vol. 19, no. 9, pp. 1–20, 2019. [Google Scholar]
18. C. Moore and M. E. J. Newman, “Epidemics and percolation in small-world networks,” Physical Review E, vol. 61, no. 5, pp. 5678–5682, 2000. [Google Scholar]
19. L. A. N. Amaral, A. Scala, M. Barthélémy and H. E. Stanley, “Classes of small-world networks,” Proceedings of The National Academy of Sciences of The United States of America, vol. 97, no. 21, pp. 11149, 2000. [Google Scholar]
20. R. Albert, H. Jeong and A.-L. Barabási, “Diameter of the world-wide web,” Nature, vol. 401, no. 6749, pp. 130–131, 1999. [Google Scholar]
21. K. Klemm and V. M. Eguíluz, “Growing scale-free networks with small-world behavior,” Physical Review E, vol. 65, no. 5, pp. 1–4, 2002. [Google Scholar]
22. A.-L. Barabási and R. Albert, “Emergence of scaling in random networks,” Science, vol. 286, no. 5439, pp. 509–512, 1999. [Google Scholar]
23. F. Amin and M. Zubair, “Energy-efficient clustering scheme for multihop wireless sensor network (ECMS),” in Proc. of the IEEE Int. Multi Topic Conf., Karachi, Pakistan, pp. 131–136, 2014. [Google Scholar]
24. F. Amin, J.-G. Choi and G. S. Choi, “Community detection based on social Influence in large scale networks,” in Proc. of the Int. Conf. on Advanced Information Networking and Applications (WAINA-2019), Caserta, Italy, pp. 122–137, 2020. [Google Scholar]
25. F. Amin, A. Ahmad and G. Choi, “To study and analyse human behaviours on social networks,” in Proc. of the 4th Annual Int. Conf. on Network and Information Systems for Computers (ICNISC), Wuhan, China, pp. 233–236, 2018. [Google Scholar]
26. M. Gjoka, M. Kurant, C. T. Butts and A. Markopoulou, “Practical recommendations on crawling online social networks,” IEEE Journal on Selected Areas in Communications, vol. 29, no. 9, pp. 1872–1892, 2011. [Google Scholar]
27. L. Katzir and S. J. Hardiman, “Estimating clustering coefficients and size of social networks via random walk,” ACM Trans. Web, vol. 9, no. 4, pp. 1–20, 2015. [Google Scholar]
28. S. Khan, L. Zhu, Z. Zhang, M. A. Rahim and K. Khan, “Attack-resilient TLS certificate transparency,” IEEE Access, vol. 8, pp. 98958–98973, 2020. [Google Scholar]
29. S. Khan, Z. Zhang, L. Zhu and M. Li, “Accountable and transparent TLS certificate management: An alternate public-key infrastructure with verifiable trusted parties,” Security and Communication Networks, vol. 2018, no. 15, pp. 1–17, 2018. [Google Scholar]
30. L. Zhang, H. Jiang, F. Wang and D. Feng, “2-Hopper: Accurately estimate individual and social attributes of social networks with fewer repeats via random walk,” IEEE Access, vol. 7, pp. 139827–139838, 2019. [Google Scholar]
31. S. Bahadori and P. Moradi, “A local random walk method for identifying communities in social networks,” in Proc. of the Artificial Intelligence and Robotics (IRANOPEN), Qazvin, Iran, pp. 177–181, 2017. [Google Scholar]
32. M. Gjoka, M. Kurant, C. T. Butts and A. Markopoulou, “Walking in facebook: A case study of unbiased sampling of OSNs,” in Proc. of the IEEE INFOCOM, San Diego, CA, USA, pp. 1–9, 2010. [Google Scholar]
33. S. J. Hardiman, P. Richmond and S. Hutzler, “Calculating statistics of complex networks through random walks with an application to the on-line social network bebo,” The European Physical Journal, vol. 71, no. 4, pp. 611, 2009. [Google Scholar]
34. B. Ribeiro and D. Towsley, “Estimating and sampling graphs with multidimensional random walks,” in Proc. of the 10th ACM SIGCOMM Conf. on Internet Measurement, New York, United States, pp. 390–403, 2010. [Google Scholar]
35. L. Katzir, E. Liberty and O. Somekh, “Estimating sizes of social networks via biased sampling,” in Proc. of the 20th Int. Conf. on World Wide Web, Bangalore, India, pp. 597–606, 2011. [Google Scholar]
36. A. L. Barabási, H. Jeong, Z. Néda and E. Ravasz, “Evolution of the social network of scientific collaborations,” Physica A: Statistical Mechanics and its Applications, vol. 311, no. 3–4, pp. 590–614, 2002. [Google Scholar]
37. M. E. Newman, “Finding community structure in networks using the eigenvectors of matrices,” Physical Review E, vol. 74, no. 3, pp. 1–22, 2006. [Google Scholar]
38. M. E. Newman, “Mixing patterns in networks,” Physical Review E, vol. 67, no. 2, pp. 1–14, 2003. [Google Scholar]
39. F. Liljeros, C. R. Edling, L. A. N. Amaral and H. E. Stanley, “The web of human sexual contacts,” Nature, vol. 411, no. 6840, pp. 907–908, 2001. [Google Scholar]
40. P. E. A. A. Rényi, “On the evolution of random graphs,” Publication of the Mathematical Institute Of The Hungarian Academy Of Sciences, vol. 3, pp. 17–61, 1960. [Google Scholar]
41. L. F. X. U. Xin-Ping and L. I. Wei, “Growing small-world networks based on a modified BA model,” Chinese Physics Letters, vol. 23, no. 3, pp. 1–11, 2006. [Google Scholar]
42. S. N. Dorogovtsev and J. F. F. Mendes, “Evolution of networks,” Advances in Physics, vol. 51, no. 4, pp. 1079–1187, 2002. [Google Scholar]
43. A. Vázquez, “Growing network with local rules: Preferential attachment, clustering hierarchy, and degree correlations,” Physical Review E, vol. 67, pp. 1–17, 2003. [Google Scholar]
44. S. P. Cornelius, W. L. Kath and A. E. Motter, “Realistic control of network dynamics,” Nature Communications, vol. 4, no. 1, pp. 1–9, 2013. [Google Scholar]
45. T. S. Evans and J. P. Saramäki, “Scale-free networks from self-organization,” Physical Review E, vol. 72, no. 2, pp. 1–6, 2005. [Google Scholar]
46. J. Jia, B. Wang and N. Z. Gong, “Random walk based fake account detection in online social networks,” in Proc. of the 47th Annual IEEE Int. Conf. on Dependable Systems and Networks (DSN), Denver, USA, pp. 273–284, 2017. [Google Scholar]
47. R. Cheng, J. Pang and Y. Zhang, “Inferring friendship from check-in data of location-based social networks,” in Proc. of the IEEE Int. Conf. on Advances in Social Networks Analysis and Mining (ASONAM), New York, United States, pp. 11–19, 2015. [Google Scholar]
48. R.-H. Li, J. Liu, J. X. Yu and H. Chen, “Co-occurrence prediction in a large location-based social network,” Frontiers of Computer Science, vol. 7, no. 2, pp. 185–194, 2013. [Google Scholar]
49. L. Katzir and S. J. Hardiman, “Estimating clustering coefficients and size of social networks via random walk,” Transactions on the Web (TWEB), vol. 9, no. 4, pp. 1–20, 2015. [Google Scholar]
50. K. Iwasaki and K. Shudo, “Estimating the clustering coefficient of a social network by a non-backtracking random walk,” in IEEE Int. Conf. on Big Data and Smart Computing (BigComp), Shanghai, China, pp. 114–118, 2018. [Google Scholar]
51. R. Cohen, S. Havlin and D. ben-Avraham, “Efficient immunization strategies for computer networks and populations,” Physical Review Letters, vol. 91, no. 24, pp. 1–5, 2003. [Google Scholar]
52. J. Leskovec, J. Kleinberg and C. Faloutsos, “Graphs over time: Densification laws, shrinking diameters and possible explanations,” in Proc. of the Eleventh ACM SIGKDD Int. Conf. on Knowledge Discovery in Data Mining, Chicago, USA, 2005. [Google Scholar]
53. Y.-Y. Ahn, S. Han, H. Kwak and S. Moon, “Analysis of topological characteristics of huge online social networking services,” in Proc. of the 16th Int. Conf. on World Wide Web, Banff Alberta, Canada, 2007. [Google Scholar]
54. C. Herrera and P. J. Zufiria, “Generating scale-free networks with adjustable clustering coefficient via random walks,” in IEEE Network Science Workshop, Washington, DC, United States, pp. 4–13, 2011. [Google Scholar]
55. L. D. F. Costa, F. A. Rodrigues, G. Travieso and P. R. Villas Boas, “Characterization of complex networks: A survey of measurements,” Disordered Systems and Neural Networks, vol. 5, pp. 1–84, 2005. [Google Scholar]
56. S. N. Dorogovtsev, J. F. Mendes and A. N. Samukhin, “Size-dependent degree distribution of a scale-free growing network,” Physical Review, vol. 63, pp. 1–10, 2001. [Google Scholar]
57. W. M. Tam, F. C. M. Lau and C. K. Tse, “Construction of scale-free networks with adjustable clustering,” in Proc. of the Int. Symp. on Nonlinear Theory and its Applications, Budapest, Hungary, pp. 3–20, 2008. [Google Scholar]
58. A. Hagberg, P. Swart and D. S. Chult, “Exploring network structure, dynamics, and function using networkX,” in Proc. of the IEEE Conf. on Big Data, San Diego, USA, pp. 1–10, 2008. [Google Scholar]
59. J. Saramäki and K. Kaski, “Scale-free networks generated by random walkers,” Physica A: Statistical Mechanics and its Applications, vol. 341, no. 24, pp. 80–86, 2004. [Google Scholar]
60. M. A. Serrano and M. Boguná, “Tuning clustering in random networks with arbitrary degree distributions,” Physical Review, vol. 72, pp. 1–20, 2005. [Google Scholar]
 | This work is licensed under a Creative Commons Attribution 4.0 International License, which permits unrestricted use, distribution, and reproduction in any medium, provided the original work is properly cited. |