| Computers, Materials & Continua DOI:10.32604/cmc.2022.030254 | |
| Article |
Cluster Representation of the Structural Description of Images for Effective Classification
1Department of Computer Engineering and Networks, College of Engineering at Wadi Addawasir, Prince Sattam Bin Abdulaziz University, Wadi Addawasir, 11991, Saudi Arabia
2Department of Informatics, Kharkiv National University of Radio Electronics, Kharkiv, 61166, Ukraine
3Electrical Engineering Department, College of Engineering at Wadi Addawasir, Prince Sattam Bin Abdulaziz University, Wadi Addawasir, 11991, Saudi Arabia
4Electronics and Micro-Electronics Laboratory, Faculty of Sciences, University of Monastir, Monastir, 5000, Tunisia
*Corresponding Author: Yousef Ibrahim Daradkeh. Email: y.daradkeh@psau.edu.sa
Received: 22 March 2022; Accepted: 18 May 2022
Abstract: The problem of image recognition in the computer vision systems is being studied. The results of the development of efficient classification methods, given the figure of processing speed, based on the analysis of the segment representation of the structural description in the form of a set of descriptors are provided. We propose three versions of the classifier according to the following principles: “object–etalon”, “object descriptor–etalon” and “vector description of the object–etalon”, which are not similar in level of integration of researched data analysis. The options for constructing clusters over the whole set of descriptions of the etalon database, separately for each of the etalons, as well as the optimal method to compare sets of segment centers for the etalons and object, are implemented. An experimental rating of the efficiency of the created classifiers in terms of productivity, processing time, and classification quality has been realized of the applied. The proposed methods classify the set of etalons without error. We have formed the inference about the efficiency of classification approaches based on segment centers. The time of image processing according to the developed methods is hundreds of times less than according to the traditional one, without reducing the accuracy.
Keywords: Cluster representation; computer vision; description relevance; descriptor; image classification; keypoint; processing speed; vector space
The key tasks of computer vision are related to the formation of useful conclusions and effective management decisions regarding physical objects of the real world based on the analysis of their images [1–9]. The advantage of the structural description for image analysis is the representation of visual objects as the set of structural elements, which makes it possible to make effective decisions in the recognition process and provides the necessary resistance to obstacles on the analyzed image [10–16].
The development of structural recognition is associated with the perfecting of classification mechanisms in the description space in the kind of descriptors of image keypoints, as well as with the evaluation of the recognition efficiency on applied samples.
Achieving high-efficiency indicators for classification methods requires solving problems associated with the multidimensional data [17–20].
During implementation methods of structural classification, descriptions of objects are represented as high-dimensional numerical vectors [21,22].
Descriptions using Oriented FAST and Rotated BRIEF (ORB) [23–25] contain 256 bits, and descriptions using Binary Robust Invariant Scalable Keypoints (BRISK) [26] detectors have 512 bits. The number of descriptors reaches 1500 elements. The transformation of the feature space in the form of a cluster system significantly simplifies their implementation [18,21]. The main tool is the cluster data analysis, based on the metric relations on the set of descriptions and the definition of similar classes of the objects and etalons [18,21,27].
Also, the problem is setting the correlation between the parameters of various descriptions [27–29]. These parameters, for example, include the center of the cluster, which can be determined by some approaches. The approaches are the modifications of the mean value and median [30,31]. All similar research is related to the Content-Based Image Retrieval (CBIR) direction [1,32]. This direction is aimed at improving intelligent recognition algorithms in accordance with the hierarchy of representation of information [18].
The structuring of the data description and a cluster representation are mechanisms of generalization for the deep analysis of intellectual-level applied solutions [33–36].
The advantage of grouping by the set of centers of clusters in comparison with the traditional grouping method directly by description descriptors has counted the fact that the relevance is calculated based on their optimal number of indicators [16,19,37]. When the set of image keypoints varies from 200 to 1000 elements, then the number of centers recommended is from 2 to 10 elements of the defined dimension.
The relevance is calculated based on researching all of the etalons, for example, in some tasks it reaches 1500 values; the proposed transformation 1000 times reduces the number of calculations [27].
Such success necessitates the grouping of the data of the researched object and a reduction in the level of fragmentation. This fact is due to the creation and application of main characteristics, namely the set of description centers. In this case, the segmenting of the etalon data is performed at the preliminary step and does not affect the performance of the grouping [18,20].
The basis of structural recognition is a priori set of descriptions of etalon images (class alphabet), represented by the set of structural features namely descriptors.
The image database is represented by the set of
Let’s split the set E:
Let’s assume that the elements of
Formally we have two models for the classification system on the existing set of features:
• {Ei}–for images.
• {Tf}–for features in the form of cluster representation.
Due to splitting
where
Representation Eq. (1) is the image of the etalon obtained as the result of the cluster representation of the whole base, and the finite set of vectors Eq. (1) of the base forms a matrix
The row of matrix H represents the cluster description of the individual etalon, and the column of matrix shows the content of the cluster as a part of the equivalent elements of different etalons. In the general case, for the most common clustering procedures which use vector data with non-integer components (k-mean, hierarchical classification, etc. [20,21,35]), Euclidean or Manhattan distances can be used.
The purpose of the research is to study and define level the effectiveness of the structural methods of image grouping. The image classification is based on the creation of segmental systems by implementing approaches to finding the relevance of the descriptions using the apparatus of optimal comparison and voting.
The tasks of the given research are:
• To process data representation models to define the relevance of descriptions according to the characteristics of the segment, which is important in terms of increment of data processing speed.
• To study questions on the effectiveness of developing these models using the results of the experimental evaluation of the proposed approaches for the applied image base.
Modern structural methods for analyzing visual information are based on evaluating the similarity of descriptor descriptions of the analyzed and etalon images, represented as the set of descriptors of keypoints [10,21,24–26]. The value of similarity reflects the degree of response of the binary relation of relevance for two information units as descriptions of visual objects.
The set of structural features in the form of the set of numerical vectors is formed using special filters, namely detectors; in this work, the ORB and BRISK methods are used [25,26]. Detectors provide obtaining descriptor vectors that are invariant to geometric transformations of displacement, rotation, scale [10].
The task of the splitting for obtaining the model of etalons as groups of structural elements is solved in different ways [21,27].
One of the way under research is to use clustering on set E. Cluster splitting can be configured on the data structure that is determined by the base [27].
The modern deep learning methods using specialized processing networks aim to identify meaningful differences in the classified data to achieve the most significant performance indicators for fixed datasets [2–5,29,32]. At the same time, methods under development, which due to the combined implementation of the principles of local and global data analysis make it possible to significantly simplify the classification process while ensuring the required level of efficiency [12,18–22].
Recently, methods of fuzzy data clustering [38] have started to be applied; including for image analysis tasks [5]. However, our research [15,18,27] is largely focused on the means of traditional clustering with non-overlapping clusters, because the available description data in the kind of multidimensional descriptor vectors are characterized by the significant similarity between each other for different etalons. And fuzzy clustering does not make it possible to correct this problem and improve the classification indicators.
Currently, the number of promising models for image analysis are being implemented, based on combining the advantages and capabilities of global and local data analysis; it contributes to the better identification of distinguishing features, for example, for complicated problems such as vehicle classification and person identification [39,40]. In these systems, specialized networks are used to generate features. It is clear that such approaches are related to the increase in the amount of calculations.
The indisputable advantage of using the vector model Eq. (1) when calculating the relevance of images in terms of calculations is that this method is much (tens of times) less consuming than comparing the image description with the descriptions of etalon sets Ei [21].
The obtained image Eq. (1) of the object can be considered as some combinatorial configuration [21,30,32,41], which is formed from the elements of the base set, using
4 Model of Cluster Representation of Structural Description
Consider base E of descriptions of images of etalons with dimension
Each descriptor
This condition can be achieved by using components from a larger set.
Let us apply the mechanism mapping data
The cluster is a definite subset of the image description. Images of
For set
Using the cluster structure, we create image
We apply the segment distribution of the set Z using reflection
For segments
Researched the classification of the model “object–etalon” based on the definition of the relevance values of descriptions [18,21,27]. We will use a sped-up segmentation algorithm based on the calculation of centers
The definition of the relevance of the “object–etalon” is formed as an interrelation of the sets of the center’s etalons and of the object with the successive finding of the most relevant candidate.
Let us apply some distance
where function
Let’s calculate
Using the components of set
The improvement for determining the distance is happened by choice of three minimum components of the in advance ranked sample
Distance Eq. (7) has the attributes of integral metrics and both differential. It is received because of the choice of three unique minima.
As an analog to Eq. (7), we will use the opportunity to add the nearest neighbor distances singly for all of the object centers
Distance models Eqs. (7) and (8) do not assure that certain a center of the etalon will belong to a definite center of an object. The finding of a center with certain characteristics is using the Hungarian algorithm for the best definition of the optimal center of the etalon to all centers of the objects [27,32].
Let us use the Hungarian algorithm for the successful definition of correlation between different sets of cluster centers
The result of applying the Hungarian approach is the creation of the optimal matching for the parameters researched sets with the reduction of all costs. It can be evaluated as the sum of the distances between two certain elements in
where
The solution to task Eq. (9) with restrictions on the conformity of characteristics from the researched sets
optimizes the distance Eq. (9) between sets the researched of centers
The number of segment centers in a given task is small (3…5). Optimal approaches can be used with minimal claims for processing speed data.
The offered expressions Eqs. (7) and (8) and distances for researching the sets of vectors apply to formed descriptions
Segmentation of an object based on the defined distances Eqs. (6)–(8) between considered the centers of the data is performed usually by finding the minimum value among the values of the etalon
We showed the scheme of such a classification method in Fig. 1.
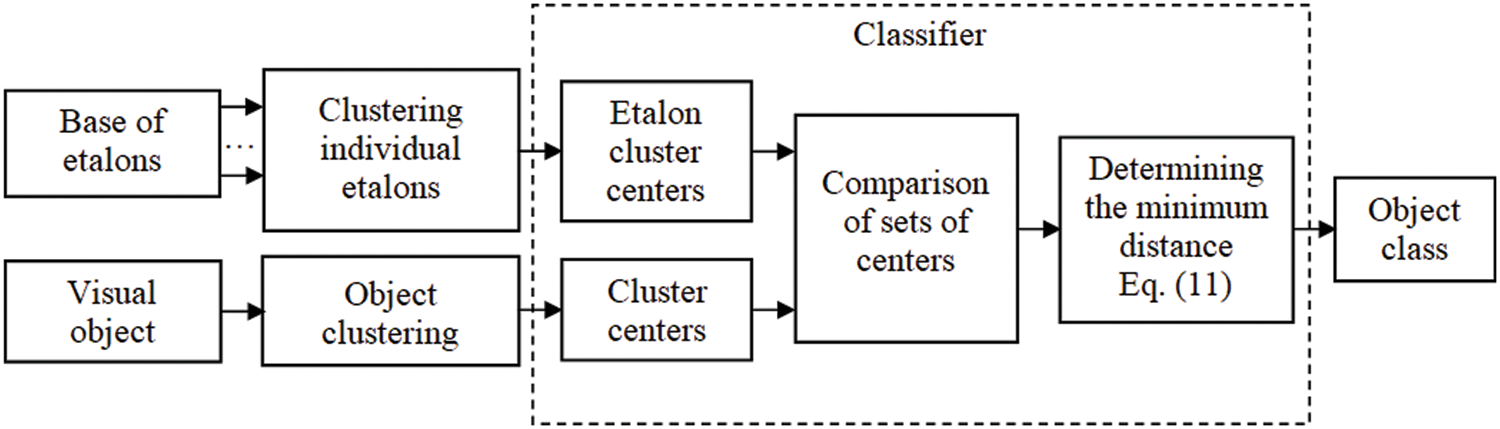
Figure 1: Classification scheme No. 1
An independent segmentation realization for the etalon set simplifies the representation of classification algorithms of the “object descriptor–etalon” variety regarding separate characteristics of the description of the researched object. This method takes into account the possible effects of obstacles on the filtration process or image processing during segmenting and the sudden onset of false keypoints caused by obstacles. In this case, the segmenting of the researched object description is not performed (this considerably minimizes the computational resources).
All object description descriptors have an “individual etalon class” formed in comparison with the calculated set
where
Eq. (12) embodies the multivalued function
Considering the results Eq. (12)
where F is a logical function that provides the hit a certain of the element
The researched object’s image is processed considering the defined values of
According to the classification Eqs. (12)–(14), the researched image will be directed to the etalon that will have the maximum number of votes of keypoint descriptors. Classification scheme No. 2 is shown in Fig. 2.
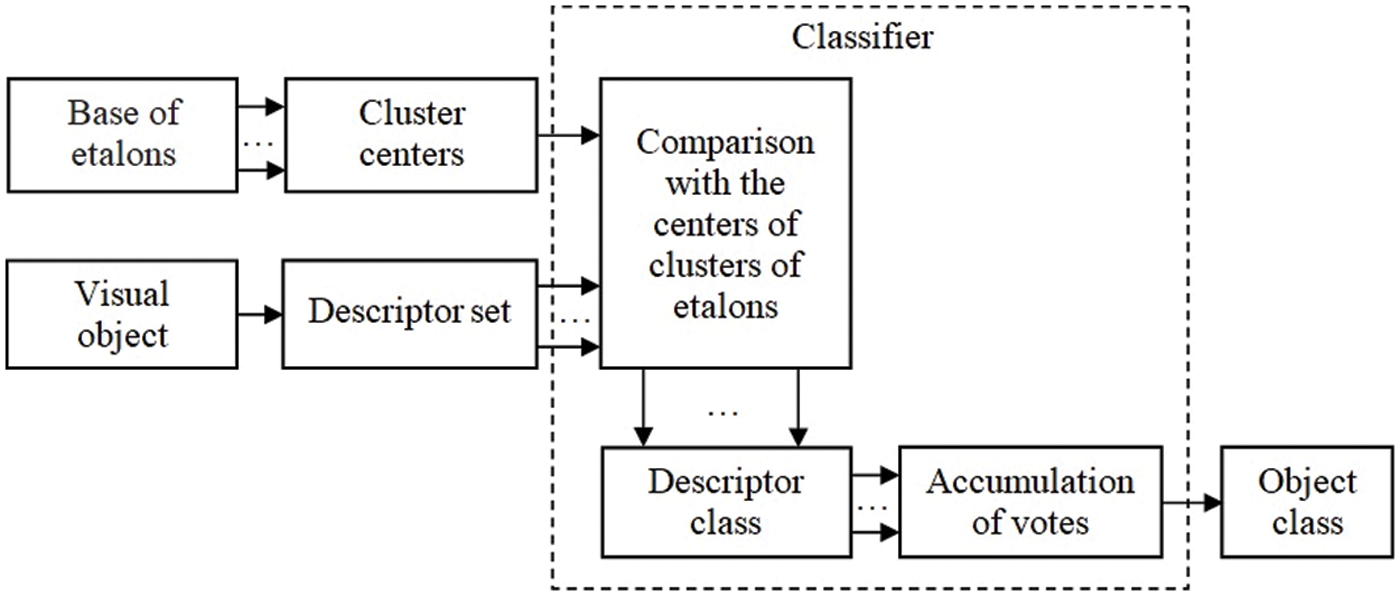
Figure 2: Classification scheme No. 2
Let us now consider model No. 3 of the classifier based on representation Eq. (1). The classification process differs from previous methods in that segmentation is implemented on the full-fledged set of etalon descriptions and centers
We consider the set of object descriptors
Because of the research of the entire set Z, a description of the object
The proposed classification methods based on the cluster representation have undergone detailed experimental verification on various image bases [10,20,27].
The represented schemes of classifiers are used in the samples of images of Pokemon [27,43]. The software tools were applied–the Java programming language, IDLE with the means of the OpenCV library [44], and IntelliJ IDEA 2020 [45].
The researched images are represented in Fig. 3. ORB descriptors are applied (

Figure 3: Examples of analyzed images
The idea of simulation modeling was implemented using the applied development of two species of classifiers:
• Realization voting descriptors considering the Eqs. (12)–(14).
• By the finding of the best correlation between the centers of the segments Eqs. (9)–(11).
The first algorithm embodies the mechanism of classification “object descriptor–etalon”. The second algorithm embodies the mechanism of classification “object–etalon”. They apply principles of an independent segment system developed for all etalons.
The classification was implemented by a method when a set of descriptors (algorithm No. 1) or of centers of the segmental view of certain etalon (algorithm No. 2) were correlated with the set of centers of segments for ten etalons [27,43]. Methods of descriptions of 300 keypoint, 500 keypoint, 1000 keypoint, and 1500 keypoint (with ORB descriptors) were implemented.
The definition of the normalized quantity of votes (in %) for the researched images Fig. 3 on the set of 10 etalons at
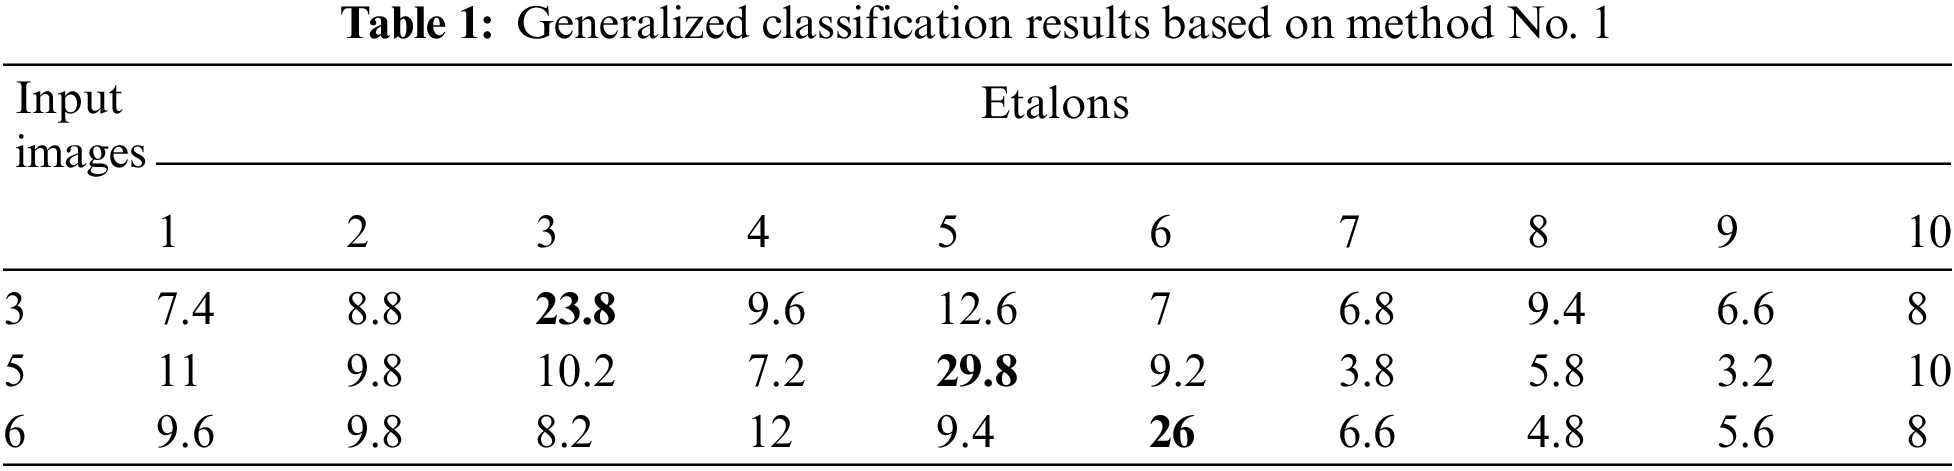
The maximum values are painted with color in Tab. 1.
The first algorithm classifies the researched images, and the superiority of the biggest over the nearby value in the line is confirmed for all considered images. Test results have represented that for the available base of etalons, the quantity of applied descriptors almost does not influence the upshot. All researched variants of keypoints (300, 500, 1000, 1500) received analogous values. The integrated application of the descriptions provides stable sets of segment centers.
The conclusions of classification in the values of the minimal distance with the application the method No. 2 by the Hungarian algorithm to calculate the optimum compliance between the centers of the segments of the researched image Fig. 3 (3 etalons–No. 3, No. 5, No. 6) and an etalon (10 etalons) for 500 keypoints are represented in Tab. 2.
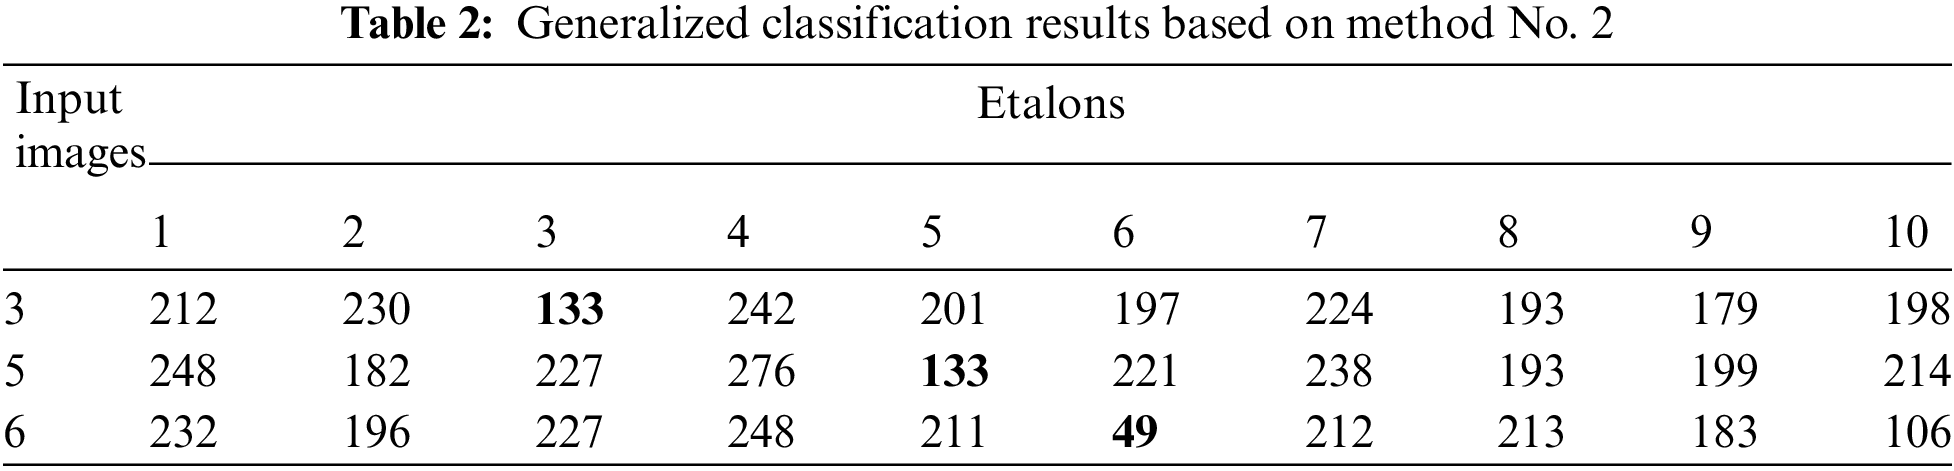
To successfully describe the researched image, segmenting was repeated. The minimum values are painted with color in Tab. 2.
By the modeling conclusions, we observe a successful classification for the researched etalons. The value of the minimum distance defined in keeping with the Hungarian algorithm is much less from all etalons. The etalon No. 6 (row No. 3 of Tab. 2) is detected as the best.
Research of received data (Tabs. 1 and 2) for the processed base of etalons demonstrates much more successful classification based on algorithm No. 1 compared to algorithm No. 2. This fact is substantiated and explained by a particularized research of the data properties in algorithm No. 1. It grounds algorithm No. 2 exclusively on the integral properties of descriptions being the results of segmenting. Testing has proven the ability the successfully using of optimum scientific methods (Hungarian algorithm) for applied tasks where input data are filed in a consolidated segment form. Outright using these algorithms to research hundreds of descriptor vectors does not make sense we observe realization time limitations.
By results of performed modeling, it appreciated the necessary time for using the described approaches. The basic part of the program code implements the finding and description of keypoints based on the ORB detector (using the OpenCV library) [24,25,44].
The number of keypoints does not affect in any way the speed of algorithm No. 2 (its advantage); is taken into account only the number of segments [18,27]. With a magnification in the number of keypoints, the realization time of algorithm No. 1 is not significantly enlarged.
The realization time of classification for algorithms No. 1 and No. 2 fluctuated from 1.1 to 1.5 s for the keypoint scans, the segmenting method, the researched image data, and the equipment applied.
Let us analyze the features of the proposed method No. 3 based on model Eq. (15) using the example of the experimental base of marine mammals (Fig. 4) when presenting their structural descriptions within 10 clusters.
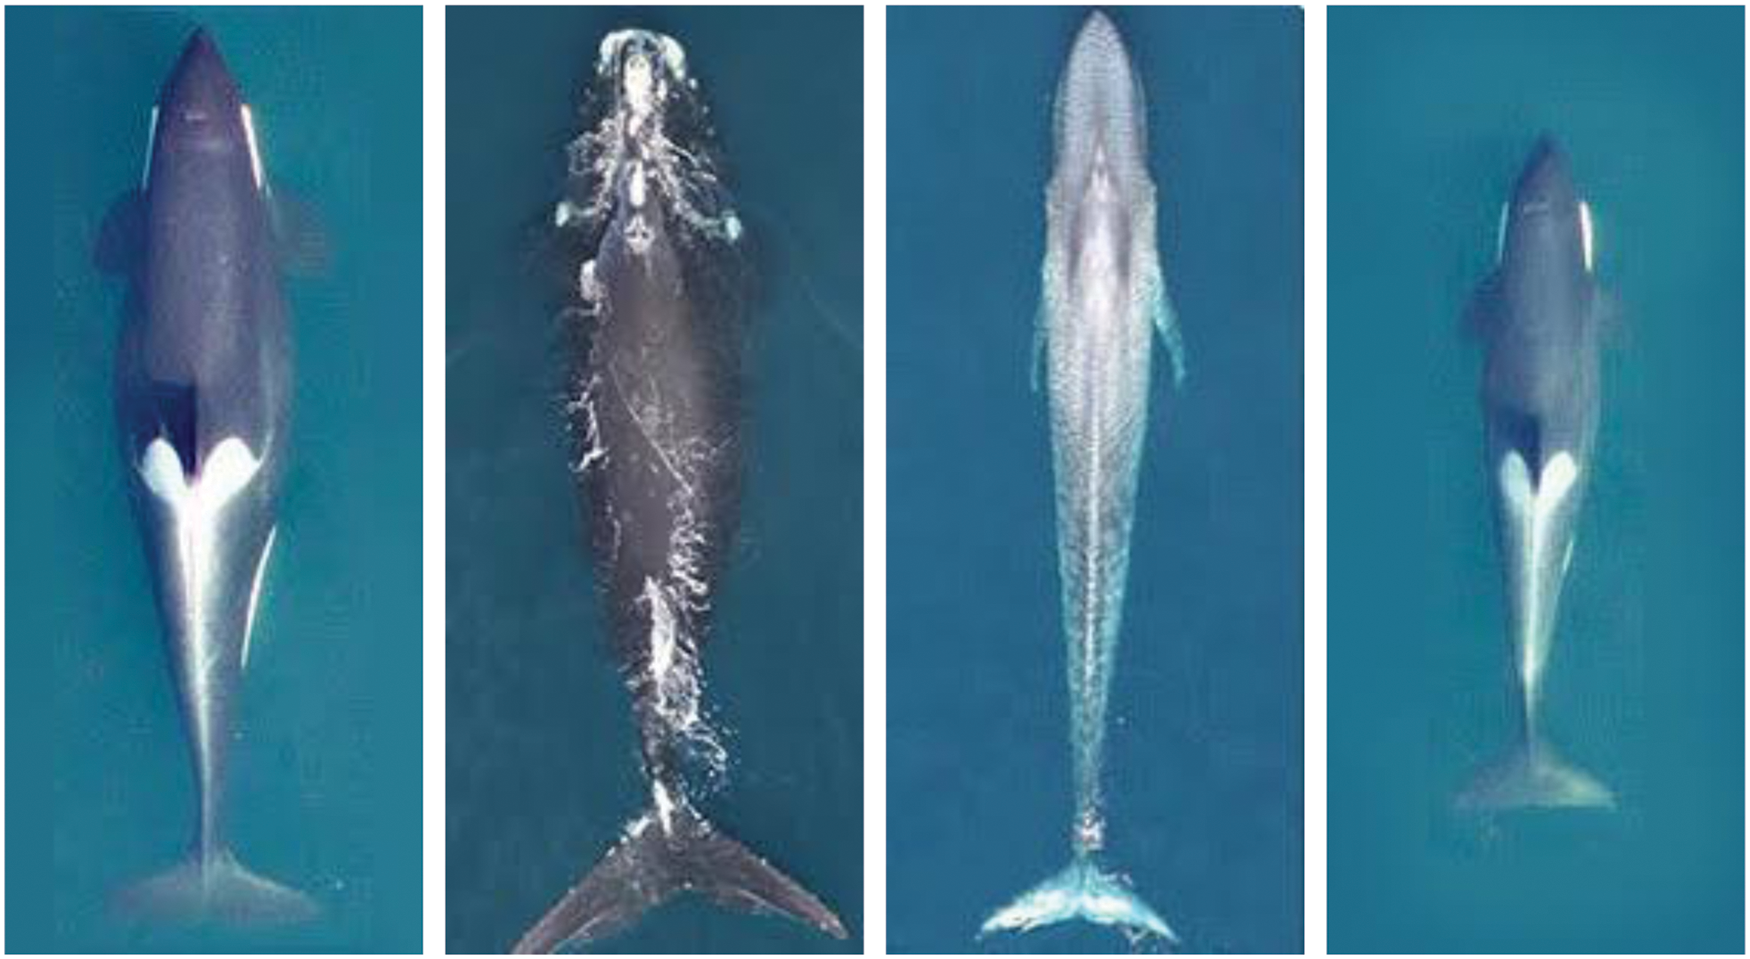
Figure 4: Image of marine mammals
During the research, we identified keypoints for etalon images based on ORB and BRISK (OpenCV and JSFeat libraries), clustering (JavaScript,
Note that the examined images are similar to each other, and in natural conditions of observation, it is difficult to classify them even for a person. Another feature of this database is a significant visual similarity between the 1st and 4th images (whale and baby whale). Image sizes are 139 × 309 pixels. The database descriptions were clustered using the
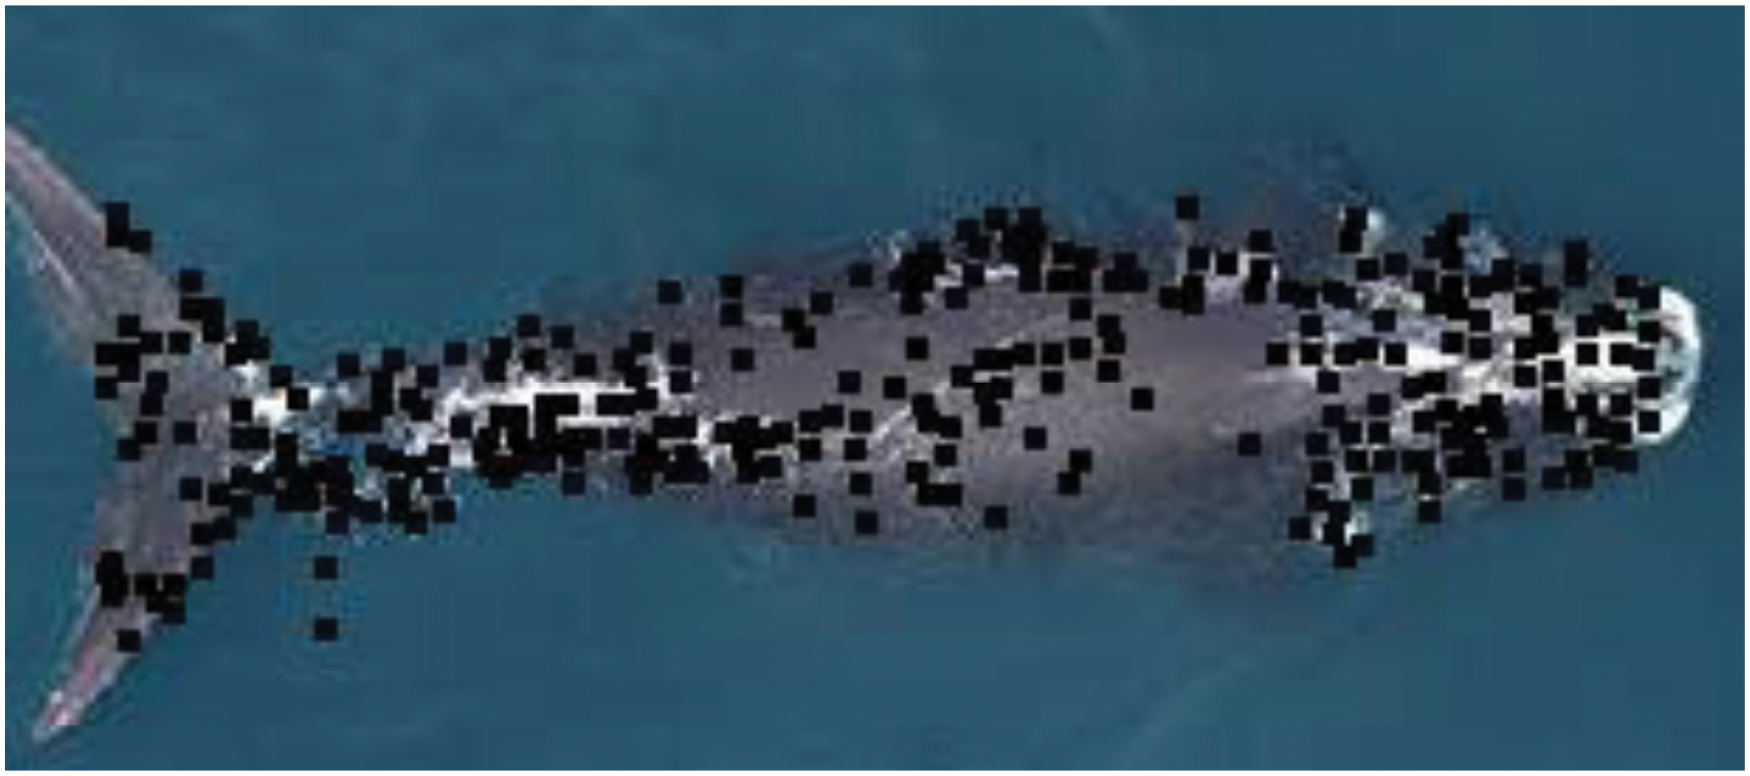
Figure 5: Image of keypoints coordinates
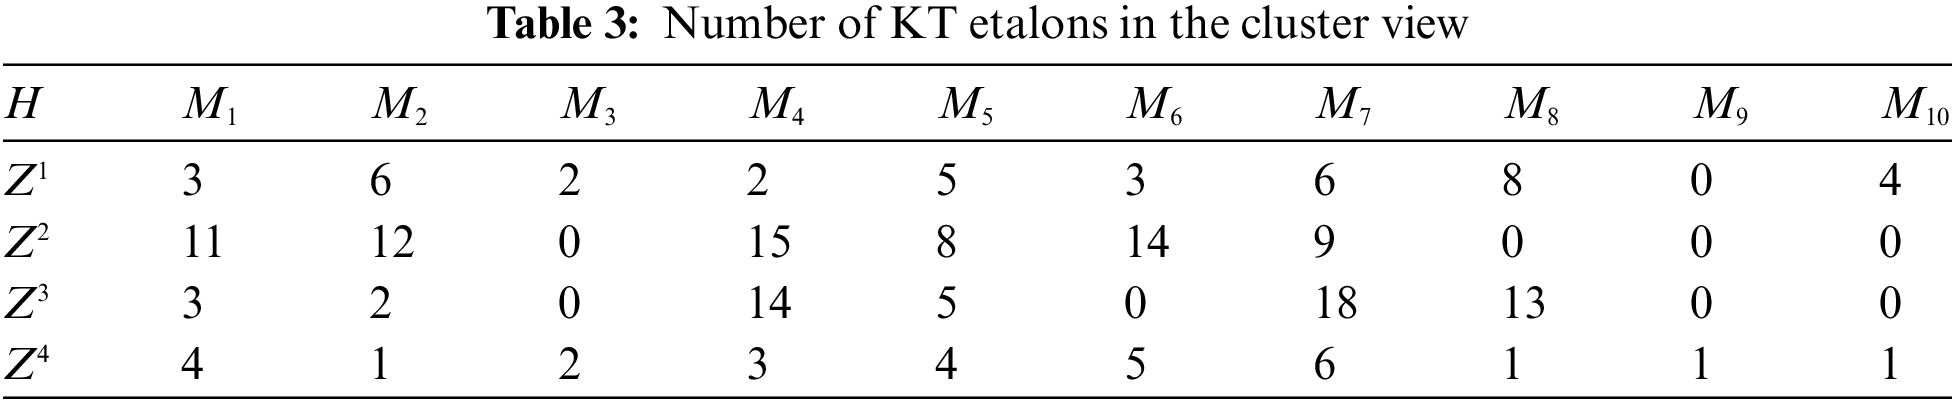
As a result, a description of the base (matrix H of the cluster representation) was obtained in Tab. 3. We showed the normalized matrix of weight coefficients in Tab. 4.
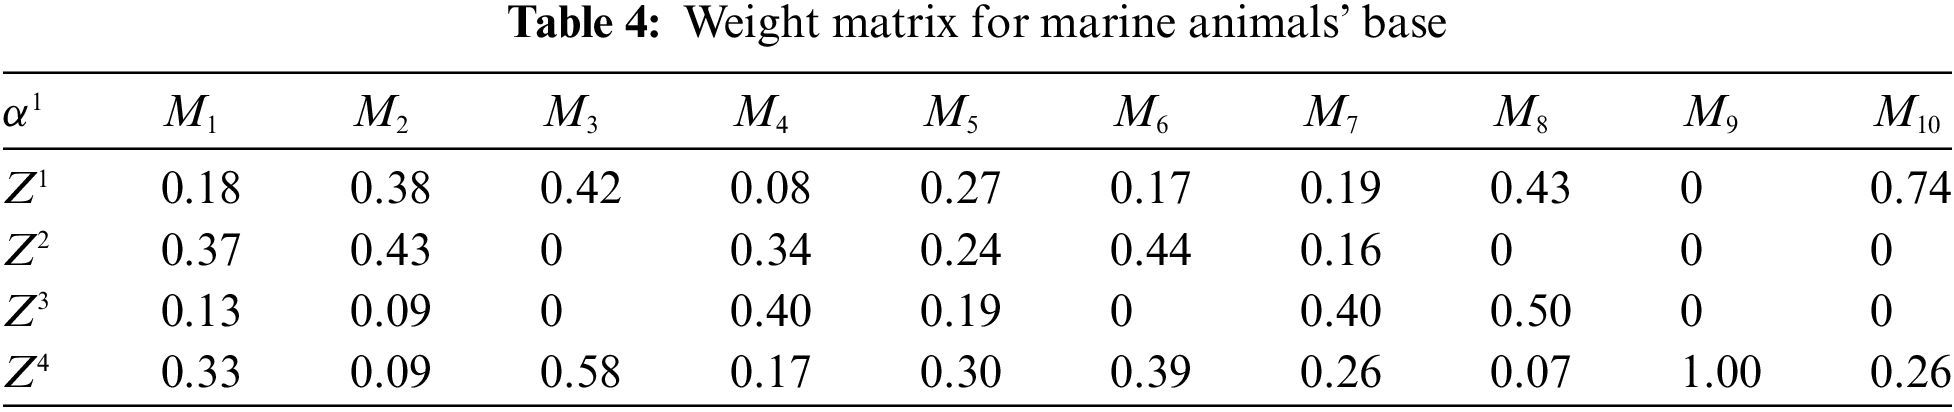
According to Tab. 4, we can build a variety of classification methods, which are based on the accumulation of weights as an analog of the membership function to the corresponding cluster [10,27,34].
As seen, the representation obtained in Tab. 4 looks quite effective. In columns 2, 3, 8, 9, 10, there is a significant predominance of weight coefficients for a few etalons. We can calculate the similarity matrix for the etalon base by multiplying the cluster weight column by the number of structural features of the etalon found in the cluster (Tab. 3).
We presented the distance matrix in Tab. 5.
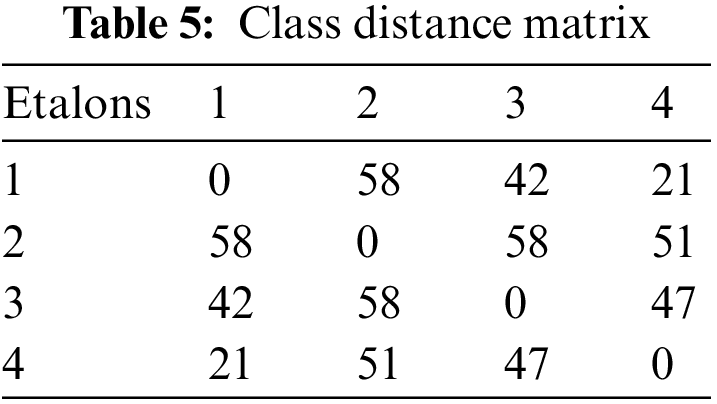
From Tab. 5, we see significant differences in the etalons in the cluster space, while etalons 1 and 4 remain the most similar.
The key parameter of the cluster representation is the number of clusters related to the equivalence threshold for structural features.
The reduction in the size of computations during recognition takes into account the number of clusters and the composition of the considered set.
For comparison, we present the cluster representation matrix within 5 clusters based on the images of Fig. 4 in Tab. 6.
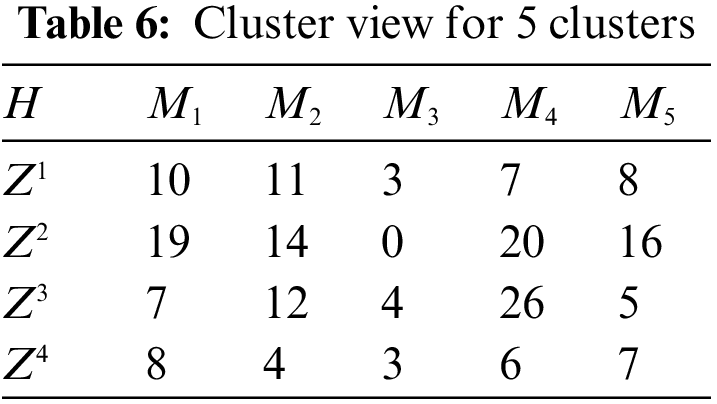
The histogram of the representation of the first image (Fig. 4) in the system of 5 and 10 clusters is shown in Fig. 6. The values of the columns (these are the first rows in Tabs. 3 and 6) indicate the number of image descriptors related to the corresponding cluster.
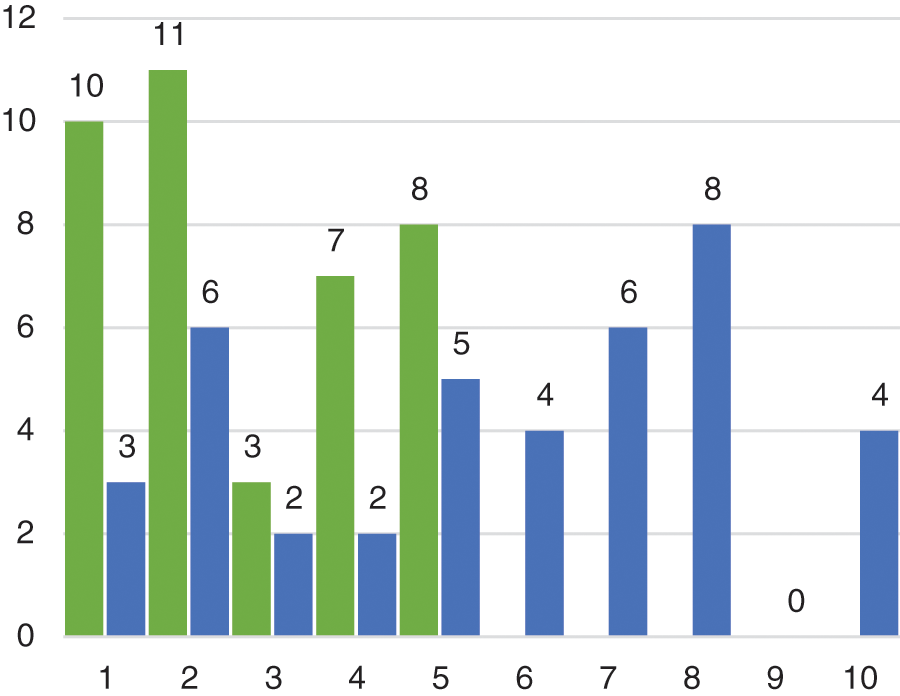
Figure 6: Histogram of image clusters in Fig. 4 (green–5 clusters, blue–10 clusters)
Conducted computer simulation showed error-free recognition of the analyzed visual objects with the number of clusters from 5 to 10, with an increase in clusters (over 8), the accuracy does not improve. The transition to the vector form increases the speed of recognition by simplifying processing. Comparison of classification schemes using different detectors (ORB and BRISK) shows that method No. 3 is more accurate and sensitive; it distinguishes even very similar images.
The described experiments confirmed the effectiveness and efficiency of the researched modifications of algorithms based on segments.
The developed approaches show a significant advantage in the analysis and classification of enormous sets of images with arbitrary sets of vectors, allowing you to speed up the total recognition time by hundreds of times.
The principal preference of the algorithm represented in this research is the essential reduction in computational costs for image classification while providing the sufficiently high efficiency indicator.
Application of the segment representation on the set of descriptors promotes perfecting the temporary indicators of the classification at the expense using of segment centers and provides a sufficient level of productivity.
Research and working of collected data allow the development of the hierarchical model with the variable element of detailing and to reveal characteristics of the image description that are meaning for classification.
The developed methods of classification based on the segment description provide a sufficient level of image resolution. Cluster representation reduces the time spent on recognition by dozens of times.
The effectiveness of cluster recognition significantly depends on the resulting system of clusters in the applied basis of the classes specified by the etalons. At the stage of system training, it is advisable to achieve approximately an equal rendering for the set of structural characteristics of etalons, so that the obtained cluster representation results in an equivalent effect of all structural elements on the result. For similar images (Fig. 4, etalons 1 and 4), it is advisable to create the unified etalon description.
According to the experiments, the recommended number of clusters in applied tasks of computer vision should be between 5…10.
Method parameters such as the threshold for the equivalence of structural features, the threshold for the significance of relevance degree when determining the certain class, as well as the number of clusters are determined in the training process for specific application databases of images.
Perspectives of the further research include the implementation of developed methods for large image databases, and also to the study of their effectiveness by using modern means of fuzzy and multidimensional clustering.
Acknowledgement: The authors extend their appreciation to the Deputyship for Research & Innovation, Ministry of Education in Saudi Arabia for funding this research work through the project number IF-PSAU-2021/01/18487. The authors acknowledge the support of the Department of Informatics, Kharkiv National University of Radio Electronics, Ukraine, in numerous help and support to complete this article. The work was performed within the framework of the state budget research of Kharkiv National University of Radio Electronics “Deep hybrid systems of computational intelligence for data flow analysis and their rapid learning” (No. DR0119U001403).
Funding Statement: The authors received specific funding for this research–Project Number IF-PSAU-2021/01/18487.
Conflicts of Interest: The authors declare that they have no conflicts of interest to report regarding the present research.
References
1. C. Celik and H. S. Bilge, “Content based image retrieval with sparse representations and local feature descriptors: A comparative study,” Pattern Recognition, vol. 68, pp. 1–13, 2017. [Google Scholar]
2. C. B. Murthy, M. F. Hashmi, G. Muhammad and S. A. AlQahtani, “YOLOv2PD: An efficient pedestrian detection algorithm using improved YOLOv2 model,” Computers, Materials & Continua, vol. 69, no. 3, pp. 3015–3031, 2021. [Google Scholar]
3. M. E. Safi and E. I. Abbas, “Robust face recognition algorithm with a minimum datasets,” Diyala Journal of Engineering Sciences, vol. 14, no. 2, pp. 120–128, 2021. [Google Scholar]
4. H. Wu, Q. Liu and X. Liu, “A review on deep learning approaches to image classification and object segmentation,” Computers, Materials & Continua, vol. 60, no. 2, pp. 575–597, 2019. [Google Scholar]
5. Y. Tang, F. Ren and W. Pedrycz, “Fuzzy C-means clustering through SSIM and patch for image segmentation,” Applied Soft Computing, vol. 87, pp. 105928, 2020. [Google Scholar]
6. Y. Xu, Z. Jia, L.-B. Wang, Y. Ai, F. Zhang et al., “Large scale tissue histopathology image classification, segmentation, and visualization via deep convolutional activation features,” BMC Bioinformatics, vol. 18, no. 1, pp. 281, 2017. [Google Scholar]
7. Y. Zheng, J. Fan, J. Zhang and X. Gao, “Exploiting related and unrelated tasks for hierarchical metric learning and image classification,” IEEE Transactions on Image Processing, vol. 29, pp. 883–896, 2019. [Google Scholar]
8. A. Nasirahmadi and S.-H. M. Ashtiani, “Bag-of-feature model for sweet and bitter almond classification,” Biosystems Engineering, vol. 156, pp. 51–60, 2017. [Google Scholar]
9. X. Tang, M. Zhang, P. Yu, W. Liu, N. Cao et al., “A nonuniform clustering routing algorithm based on an improved k-means algorithm,” Computers, Materials & Continua, vol. 64, no. 3, pp. 1725–1739, 2020. [Google Scholar]
10. Y. I. Daradkeh, I. Tvoroshenko, V. Gorokhovatskyi, L. A. Latiff and N. Ahmad, “Development of effective methods for structural image recognition using the principles of data granulation and apparatus of fuzzy logic,” IEEE Access, vol. 9, pp. 13417–13428, 2021. [Google Scholar]
11. V. O. Gorokhovatskyi, I. S. Tvoroshenko and O. O. Peredrii, “Image classification method modification based on model of logic processing of bit description weights vector,” Telecommunications and Radio Engineering, vol. 79, no. 1, pp. 59–69, 2020. [Google Scholar]
12. Y. I. Daradkeh, V. Gorokhovatskyi, I. Tvoroshenko and M. Al-Dhaifallah, “Classification of images based on a system of hierarchical features,” Computers,” Materials & Continua, vol. 72, no. 1, pp. 1785–1797, 2022. [Google Scholar]
13. V. Gorokhovatskyi, N. Rusakova and I. Tvoroshenko, “The application of image analysis methods and predicate logic in applied problems of magnetic monitoring,” Telecommunications and Radio Engineering, vol. 79, no. 20, pp. 1801–1811, 2020. [Google Scholar]
14. Y. I. Daradkeh and I. Tvoroshenko, “Application of an improved formal model of the hybrid development of ontologies in complex information systems,” Applied Sciences, vol. 10, no. 19, pp. 6777, 2020. [Google Scholar]
15. O. Gorokhovatskyi, V. Gorokhovatskyi and O. Peredrii, “Analysis of application of cluster descriptions in space of characteristic image features,” Data, vol. 3, no. 4, pp. 52, 2018. [Google Scholar]
16. C. Dewi, R.-C. Chen, Y.-T. Liu, X. Jiang and K. D. Hartomo, “Yolo V4 for advanced traffic sign recognition with synthetic training data generated by various GAN,” IEEE Access, vol. 9, pp. 97228–97242, 2021. [Google Scholar]
17. I. S. Tvoroshenko and V. O. Gorokhovatsky, “Effective tuning of membership function parameters in fuzzy systems based on multi-valued interval logic,” Telecommunications and Radio Engineering, vol. 79, no. 2, pp. 149–163, 2020. [Google Scholar]
18. V. O. Gorokhovatskyi, I. S. Tvoroshenko and N. V. Vlasenko, “Using fuzzy clustering in structural methods of image classification,” Telecommunications and Radio Engineering, vol. 79, no. 9, pp. 781–791, 2020. [Google Scholar]
19. Q. Bai, S. Li, J. Yang, Q. Song, Z. Li et al., “Object detection recognition and robot grasping based on machine learning: A survey,” IEEE Access, vol. 8, pp. 181855–181879, 2020. [Google Scholar]
20. V. Gorokhovatskyi and I. Tvoroshenko, “Image classification based on the kohonen network and the data space modification,” in CEUR Workshop Proc.: Computer Modeling and Intelligent Systems (CMIS-2020), Zaporizhzhia, Ukraine, vol. 2608, pp. 1013–1026, 2020, [Online]. Available: http://ceur-ws.org/Vol-2608/. [Google Scholar]
21. Y. I. Daradkeh, V. Gorokhovatskyi, I. Tvoroshenko, S. Gadetska and M. Al-Dhaifallah, “Methods of classification of images on the basis of the values of statistical distributions for the composition of structural description components,” IEEE Access, vol. 9, pp. 92964–92973, 2021. [Google Scholar]
22. X. Shen, C. Wang, X. Li, Y. Peng, Z. He et al., “Learning scale awareness in keypoint extraction and description,” Pattern Recognition, vol. 121, pp. 108221, 2022. [Google Scholar]
23. S. Walt, J. L. Schönberger, J. Nunez-Iglesias, F. Boulogne, J. D. Warner et al., “ORB feature detector and binary descriptor,” ( 2022, Feb. 10). [Online]. Available: https://scikit-image.org/docs/dev/auto_examples/features_detection/plot_orb.html. [Google Scholar]
24. E. Karami, S. Prasad and M. Shehata, “Image matching using SIFT, SURF, BRIEF and ORB: Performance comparison for distorted images,” in Proc. of the 2015 Newfoundland Electrical and Computer Engineering Conf., St. John’s, Canada, arXiv preprint arXiv:1710.02726, 2017. [Google Scholar]
25. E. Rublee, V. Rabaud, K. Konolige and G. Bradski, “ORB: An efficient alternative to SIFT or SURF,” in 2011 Int. Conf. on Computer Vision, Barcelona, Spain, pp. 2564–2571, 2011. [Google Scholar]
26. S. Leutenegger, M. Chli and R. Y. Siegwart, “BRISK: Binary robust invariant scalable keypoints,” in 2011 Int. Conf. on Computer Vision, Barcelona, Spain, pp. 2548–2555, 2011. [Google Scholar]
27. M. A. Ahmad, V. Gorokhovatskyi, I. Tvoroshenko, N. Vlasenko and S. K. Mustafa, “The research of image classification methods based on the introducing cluster representation parameters for the structural description,” International Journal of Engineering Trends and Technology, vol. 69, no. 10, pp. 186–192, 2021. [Google Scholar]
28. S. Zhang, J. Wang, X. Tao, Y. Gong and N. Zheng, “Constructing deep sparse coding network for image classification,” Pattern Recognition, vol. 64, pp. 130–140, 2017. [Google Scholar]
29. J. Leskovec, A. Rajaraman and J. D. Ullman, “Clustering,” in Mining of Massive Datasets, New York, NY, USA: Cambridge University Press, pp. 241–276, 2014. [Google Scholar]
30. W. Ma, J. Qin, X. Xiang, Y. Tan, Y. Luo et al., “Adaptive median filtering algorithm based on divide and conquer and its application in CAPTCHA recognition,” Computers, Materials & Continua, vol. 58, no. 3, pp. 665–677, 2019. [Google Scholar]
31. J. Wang and Y. Zhang, “Median filtering forensics scheme for color images based on quaternion magnitude-phase CNN,” Computers, Materials & Continua, vol. 62, no. 1, pp. 99–112, 2020. [Google Scholar]
32. P. Flach, “Features,” in Machine Learning: The Art and Science of Algorithms that Make Sense of Data, New York, NY, USA: Cambridge University Press, pp. 298–329, 2012. [Google Scholar]
33. X. Zhang, F. X. Yu, S. Karaman and S.-F. Chang, “Learning discriminative and transformation covariant local feature detectors,” in 2017 IEEE Conf. on Computer Vision and Pattern Recognition (CVPR), Honolulu, HI, USA, pp. 4923–4931, 2017. [Google Scholar]
34. R. Szeliski, “Recognition,” in Computer Vision: Algorithms and Applications, London, Great Britain: Springer-Verlag, pp. 655–718, 2010. [Google Scholar]
35. L. Xiangxiao, O. Honglin and X. Lijuan, “Kernel-distance-based intuitionistic fuzzy c-means clustering algorithm and its application,” Pattern Recognition and Image Analysis, vol. 29, no. 4, pp. 592–597, 2019. [Google Scholar]
36. M. Ghahremani, Y. Liu and B. Tiddeman, “FFD: Fast feature detector,” IEEE Transactions on Image Processing, vol. 30, pp. 1153–1168, 2021. [Google Scholar]
37. Q. Wu, Y. Li, Y. Lin and R. Zhou, “Weighted sparse image classification based on low rank representation,” Computers, Materials & Continua, vol. 56, no. 1, pp. 91–105, 2018. [Google Scholar]
38. Y. Zhang, X. Bai, R. Fan and Z. Wang, “Deviation-sparse fuzzy c-means with neighbor information constraint,” IEEE Transactions on Fuzzy Systems, vol. 27, no. 1, pp. 185–199, 2019. [Google Scholar]
39. W. Sun, X. Chen, X. Zhang, G. Dai, P. Chang et al., “A Multi-feature learning model with enhanced local attention for vehicle re-identification,” Computers, Materials & Continua, vol. 69, no. 3, pp. 3549–3561, 2021. [Google Scholar]
40. Z. Luo, “Review of GAN-based person re-identification,” Journal of New Media, vol. 3, no. 1, pp. 11–17, 2021. [Google Scholar]
41. D. Zheng, Z. Ran, Z. Liu, L. Li and L. Tian, “An efficient bar code image recognition algorithm for sorting system,” Computers, Materials & Continua, vol. 64, no. 3, pp. 1885–1895, 2020. [Google Scholar]
42. R. Chen, L. Pan, C. Li, Y. Zhou, A. Chen et al., “An improved deep fusion CNN for image recognition,” Computers, Materials & Continua, vol. 65, no. 2, pp. 1691–1706, 2020. [Google Scholar]
43. M. Takahashi, “Pokemon image library,” (2022, Feb. 10). [Online]. Available: https://www.pokemon.com/ru/pokedex/. [Google Scholar]
44. G. Bradski and A. Kaehler, “OpenCV Open Source Computer Vision,” (2022, Feb. 14). [Online]. Available: https://docs.opencv.org/master/index.html. [Google Scholar]
45. T. Grin, B. Noll and N. Chisler, “IntelliJ IDEA,” (2022, Feb. 12). [Online]. Available: https://www.jetbrains.com/idea. [Google Scholar]
 | This work is licensed under a Creative Commons Attribution 4.0 International License, which permits unrestricted use, distribution, and reproduction in any medium, provided the original work is properly cited. |