| Computers, Materials & Continua DOI:10.32604/cmc.2022.030745 | |
| Article |
Automotive Service Quality Investigation Using a Grey-DEMATEL Model
Faculty of Business, FPT University, Hanoi, 100000, Vietnam
*Corresponding Author: Phi-Hung Nguyen. Email: hungnp30@fe.edu.vn
Received: 01 April 2022; Accepted: 23 May 2022
Abstract: In today’s fast-challenging business environment, automobile manufacturers are required to supply customers with high-quality vehicles at competitive prices. However, existing research on factors influencing service quality lacks a detailed and systematic understanding, and there is no consensus study on causal relationship and measuring the weights of service quality factors in the automotive manufacturing industry. This study provides an integrated technique for evaluating the automotive service quality in the context of VinFast-the Vietnamese leading brand. First, the Grey Theory System (GTS) is utilized to estimate the subjective views of the decision maker (DM) and overcome incomplete and vague decision information. Then, a Decision-Making Trial and Evaluation Laboratory approach integrated with GTS (Grey-DEMATEL) is proposed not only to define the cause-effect factors but also to quantify the causal relationship of proposed criteria, which is based on comprehensive analyses of the current service quality literature and experts’ opinions, as well as to capture the criteria weights. The results show that the weights of main criteria can be sorted as follow: Tangibility > Reliability > Assurance > Pricing > Empathy > Responsiveness. Among the proposed sub-criteria, Pricing is the top concern compared to other dimensions, making it a prerequisite for VinFast. The causal relationships of VinFast’s service quality are discovered by the Grey-DEMATEL technique. The findings also indicated a rising need for VinFast to focus on Empathy. Furthermore, the proposed model might be used as a decision support tool to contribute to the literature on service quality, provide recommendations for future study, and assist managers in improving service quality more efficiently.
Keywords: MCDM; grey theory; DEMATEL; SERVQUAL; automobile industry
The automotive industry is becoming an economic driver in many countries, which is still booming, because of the rising transport demand in developing nations, a massive number of vehicles manufactured year after year [1]. Despite an increasingly competitive automotive market across the Association of South East Asian Nations (ASEAN) region, Vietnam has expressed its intention to aggressively develop its own domestic auto sector. Among the primary reasons for this ambition is that the automotive industry has the ability to generate thousands of jobs and a robust system of supporting businesses. Additionally, Vietnamese automakers like as VinFast have begun exporting their first automobile models, indicating a bright future for cars exported from Vietnam [2]. Therefore, this “spearhead industry” of the country has been provided with numerous incentives and experienced certain challenges.
This sector’s policies consist of four main categories: investment policy, protectionist policy, supporting industry, and tax policy [3]. Regarding the investment policy, automobile production is listed among the business line eligible for investment incentives. This allows the manufacturing companies to a lower rate (10%), reduction or exemption of corporate income tax for a certain period (up to 50% reduction in 9 years), or throughout the project execution regarding the specific types of automobiles. A three-year exemption for land rentals, a five-year exemption from the day of import tax on products purchased as fixed assets, on raw materials, and supplies are also applied in the automobile manufacturing industry. For the protectionist policy, Vietnam followed a reduction schedule under World Trade Organization (WTO) commitments to reduce the import tariff on completely built-up (CBU) cars from 90% to around 70% from 2007 to 2015. However, since 2018 under ASEAN Free Trade Area (AFTA) commitments, the import tariffs on CBU between ASEAN countries were all eliminated [3]. Without such protection measures, VinFast and other local manufacturers have confronted stiff competition from CBU imports from ASEAN countries. Regarding the supporting industry policies, noting that local suppliers in Vietnam fell behind other ASEAN nations, the government provides several incentives to encourage local manufacturers. Some of the key incentives are access to government funding for the cost of 75% of technological transfer, up to 50% of production for trial products, funding for human training, reduction of corporate income tax, a zero tariff on imports of auto parts, and further access to investment credit. However, Vietnam has imposed high taxes and fees on cars, which are in sum double to triple the car’s original price and contribute to the market’s limited size. These taxes and fees include a special consumption tax from 40% to 150% depending on cylinder capacity, a 10% value-added tax (VAT), a 12% registration fee, a 10% license plates registration fee, and other minor fees.
Among Vietnamese car assemblers, the success of VinFast company over the past three years in the domestic market is supported by incentive tax policies supporting the industry, Vietnamese people’s patriotism, and most importantly, VinFast’s service quality. Although the vehicle assembling and manufacturing industry has been developing in Vietnam for decades, it still falls far behind in citizen’s awareness and operating spectrum compared to developed countries in the world. The Vietnamese market is disorganized because of the lack of a massive manufacturing scale and the absence of supply chain management. Now the Vietnamese automobile industry has been confronting with worldwide standards of service quality.
After examining the characteristics and existing circumstances of the Vietnamese market, numerous scholars have been conducting relevant studies on quality assessment in various service fields, using different research methods such as statistics, case study, conceptual and literature review. The relationship between the service quality dimensions of VinFast is so complex. Moreover, there is no consensus research on service quality dimensions. Although recent research shows the widespread application of qualitative analysis, there is a dearth of multi-criteria decision-making (MCDM) analysis of the Vietnamese vehicle business. However, such a successful case in the Vietnamese automobile industry, VinFast’s service quality has not yet been investigated. For this reason, studying the critical factors of VinFast’s service quality to help improve VinFast’s sales service towards increasing sales output and revenues is of great necessity. This study’s main motivation is to analyze the influencing factors of service quality, including Tangibility, Assurance, Reliability, Responsiveness, Empathy, and Pricing, which has not been empirically investigated earlier in the Vietnamese automobile sector. To the author’ knowledge, this study proposes the first hybrid MCDM model of Grey Theory and Decision-Making Trial and Evaluation Laboratory (Grey-DEMATEL) to evaluate VinFast’s service quality for several objectives.
This research highlights some contributions: (i) Identify critical service quality dimensions in the automotive sector from the literature review followed by discussions with industrial and academic experts; (ii) Propose a framework to analyze service quality in the Vietnamese automotive industry using the grey DEMATEL tool; (iii) Explain and identify the causal relationships of service quality factors for the Vietnamese automotive manufacturers in the case of VinFast; (iv) Validate these cause-effect factors through feedback from industrial and academic experts. The obtained results are then compared with the existing literature.
The implementation of service quality management has continuously been perceived as a conducive factor in maintaining competitive advantage, excellence, success, stability, and growth among dealers in the automobile manufacturing industry. Service receivers are beneficiaries from a range of service options, which has driven a rise in customer expectations, consequently led to fierce competition in the industry [4]. In an attempt to retain existing ones, attract potential customers, and compete with peer companies, car dealers prioritize improving service quality towards satisfying customers’ expectations to posit in a densely populated market. The study of customer satisfaction has gathered a substantial amount of attention in academic and business circles. As studied by many scholars [5–7], customer satisfaction is undoubtedly a hotly debated topic in both the academic and business context. Service quality is among the essential indications of customer satisfaction. However, owing to service quality’s unquantifiable characteristics [8–11], it is hard to measure it without a conceptualized framework. For this reason, dating back 36 years ago, initiated a theory, which discusses the multi-dimensionality of service quality. The theory of service quality model (SERVQUAL) indicates a linkage between customers’ expectations and their perceived performance, including five dimensions: Tangibility, Reliability, Responsiveness, Assurance, and Empathy. Even though being criticized by academicians for the inadequate assessment of service quality, failure to keep up with dynamic changes in expectations [12], and unstable measuring method due to customer heterogeneity [13], the SERVQUAL framework appears to be a popularly used measure of an organization’s service quality in its wholeness [8]. SERVQUAL model has been broadly applied in the marketing research domain and various industries. For instance, Augustyn et al. [14] inherited the SERVQUAL model to investigate the correlated relationship between service quality and satisfaction. As indicated by [15], Mauritius customer’s satisfaction of public service conveyed by a public department was verified using the SERVQUAL approach. Recently, Luke et al. [16] analyzed the quality of alternative state-owned public transportation modes in South Africa by the SERVQUAL. When it comes to applying the SERVQUAL approach to explore gaps between customers’ satisfaction and the quality of services provided in Iskandar Malaysia’s logistics industry, Roslan et al. [17] identified positive gaps between customers’ expectations and perception towards Iskandar’s logistics sector. On the other hand, a fuzzy SERVQUAL model was proposed by [18] to evaluate a Taiwanese airline company’s service quality, which then discovered that airline passengers perceive assurance and reliability dimensions as the top considerations, while Tangibility being the least important service dimension. Moreover, Liu et al. [19] also applied SERVQUAL to discover a big gap between service expectations and perceived performance in the tangibility aspect in China’s registration and verification industry. Likewise, Chaichinarat et al. [20] empirically examined the automotive industry’s service quality in Thailand. By referring to preceding studies about the SERVQUAL model, they identified positive weight for all five SERVQUAL components. When Farshianabbasi et al. [21] used an integrated SERVQUAL model to assess after-sales service efficiency, they discovered a considerable gap between customers’ perceptions and expectations for service characteristics. Besides, Ko et al. [22] specified drawbacks in Taiwanese Nursing Homes. Based on the results, information and communication technology (ICT) technologies were proposed to alleviate such shortcomings. Kafere et al. [23] offered better blood services at the Zimbabwe National Blood Service Centre in that employee’s code of conduct, compensations, and attitude against work must be improved to convey better services to blood donors. The utilization of the SERVQUAL model might vary across different service sectors. Also, this characteristic is significant in the same industry due to customers’ heterogeneity in the service evaluation process [13]. It is notable that, in the implementation steps of improving service quality, the five SERVQUAL items are flexibly utilized case by case. They proved the effective use of a refined SERVQUAL model by excluding customer heterogeneity and service types from the original SERVQUAL components. It is assumed that SERVQUAL five-point scale is unable to represent customers’ psychometric dimensions, and therefore, adopting a five-item scale across service sectors is unnecessary. Their work’s empirical inference suggested two grand attributes: tangibles and intangibles than the original five components. In the management of quality in service companies, the two permanent components are supported by different cost structures between the physical and human resources. This should be noted that tangibles are related to the physical environment, while non-tangibles closely link to human resources.
2.2 MCDM in Service Quality Assessment
Despite its widespread use, the SERVQUAL paradigm has specific shortfalls, and its philosophical basis and empirical operationalization have been argued in the research sector. Also, there are real disadvantages of questioning respondents both before and after using the service; this is the so-called distance measure. To be more precise, the SERVQUAL scale is an essential but inadequate quality measure in the automotive industry, with clear implications for future research. The automotive industry is one of the main actors in developed and developing countries in today’s dynamic world economy. MCDM methods, such as sampling, prioritizing, ranking, or choosing a range of alternatives, are by far the most practiced and implemented in a wide range of decision situations. MCDM may be implemented where evaluation needs various variables that cannot easily be translated into observable units, and many conflicting parameters are likely to influence the assessment. The service industry is filled with intangible, perishable, inseparable, and varied items, making it even more challenging to quantify service quality. Most of the approaches for determining service quality use the statistics approach to explore the historical data-based research paper. In the past, service quality was most often measured by using the 5–7 point-Likert Scales. To the best of our knowledge, the Grey System Theory (GTS) has recently been applied to operational research [24,25]. Nonetheless, it is rarely used in the field of service quality [26]. For instance, satisfied, reasonable, unsatisfied, and lingual statements are regarded as excellent representations of an opinion or judgement in practice. On the basis of these features, it appears that the GTS might be used to determine the structure of decision makers’ decisions by contrasting the overall complexity of commonly used terms for subjective human assessment. Numerous scholars have used the SERVQUAL model to evaluate the quality of service in a variety of contexts, including as banking [27], retailing [28], supply chain [29]. Although numerous researchers employ MCDM methods in a variety of domains, only a few apply SERVQUAL model in conjunction with the MCDM technique to examine automotive service quality problems. This study attempts to apply the Grey based approach to empirically examine service quality in an automotive context to provide VinFast’s service quality supervisors, industry experts, and scholars to determine customers’ needs, demands and ultimately achieve customer satisfaction. Therefore, this study integrates the GTS and MCDM model-based SERVQUAL to improve the comprehensiveness and reasonableness of analyzing service quality. Consequently, this study aims to address the quality assessment of automotive services by applying the Grey-DEMATEL, which combined qualitative and quantitative methodologies. The Grey-DEMATEL model is applied to obtain the cause-effect relationship and weighting of the proposed criteria.
3.1 Basic Definitions of Grey System Theory
Professor Deng firstly elaborated on a Grey System Theory (GTS) in 1989 because of incomplete information, unquantifiable information, and partial ignorance. The grey theory is commonly applied to solve problems in an uncertain environment. This research presents grey numbers, grey sets in the grey theory [24]. The grey theory can be utilized with any imprecise decision-making process. The grey values can be translated into numbers by converting fuzzy values into crisp scores (CFCS) [30].
Definition 1: A grey system is a set of grey numbers and grey variables, all of which feature varying degrees of uncertainty. The grey number Xg is presented with an upper bound (

Definition 2: Grey number operation is characterized as a set of intervals rather than a set of real numbers. This analysis applied to the basic operating laws of grey numbers. The following Eqs. (2)–(5) are the basic mathematical operations implemented in the theory of grey numbers:
Definition 3: For the two grey numbers
where
If
If
If
If there is an intercrossing part in them when
Where
X is represented with a set
3.2 Proposed Models of Grey-DEMATEL
The DEMATEL approach was constructed by Battelle Memorial Institute of the Geneva Research Center [31]. The advantages of this technique are useful in evaluating the role of the independent criteria involved and describing the degree of impact and interrelationships between the criteria considered and alternatives. Therefore, the Grey-DEMATEL approach is explained as following steps:
Step 1: Considering influencing factors from experts’ opinions and then constructing a direct-relation matrix.
Step 2: A number of K experts evaluate criteria (Ci) with i = 1, 2, 3, n in terms of pairwise relations using a linguistic scale. Five-level of the assessments are defined in Tab. 1.
Normalizing the lower bound and upper bound with the grey values by the following Eq. (7)
Normalization:
Computing the total normalized crisp value using Eq. (8):
Calculating the final crisp values by Eq. (9):
Hence, k direct-relation grey matrices (Z1, Z2, … Zk) are extracted by taking the average grey direct relation matrix, Eq. (10):
Step 3: The normalized matrix S is obtained by Eqs. (11) and (12)
Step 4: (Di) is denoted with the sum of rows, and (Ri) is computed by the sum of columns, respectively:
Step 5: Creating the value of (
Step 6: Structural relationships occur between the analyzed elements, and it is a premise for the use of Grey-DEMATEL in the weighting of criteria. We determine criteria weights using the results of Grey-DEMATEL with Eqs. (15) and (16).
where
VinFast, Vietnam’s first fully integrated automobile manufacturer, plans to transition to all-electric vehicle production by late 2022. VinFast is betting heavily on the US market, where it plans to compete against major manufacturers and startups by delivering affordable electric sport utility vehicle (SUVs) and a battery leasing scheme [32]. Although numerous academics have constructed service quality studies, and different scales have already been developed to measure and investigate service quality, the existing research has been described as fragmented. Therefore, a comprehensive framework is needed to identify the critical dimensions of the automotive industry’s service quality. After combining and synthesizing the existing literature of service quality, perceived service quality, and practical consideration, this study proposes a set of critical factors for VinFast’s service quality, consisting of VinFast’s and customers’ dimensions’ perspectives based on expert opinions. In this study, four Vietnamese experts (three senior managers with at least an master degree, 10-year experience working in the automotive, and one professor from a famous university with numerous researches in Marketing/Sales) have been selected and interviewed. The proposed model comprises six main criteria and 65 sub-criteria. The explanation of these dimensions is explained in appendix Tab. A1
4.1 Results of Cause-Effect Relationships
Encountering a complex decision problem, where factors might affect the others and are affected by the others, is inevitable. It is not the case because of the interdependence of factors; improving one factor might improve the whole system. Accordingly, it is of necessity to identify cause and effect factors upon the whole system’s improvement. This proposed model offers an ordinal perspective on initial considerations and further consideration of them in the future stage. For urgent resource allocation, therefore, influencing factors should be prioritized. After that, effect factors are generally serious issues at later stages and can be addressed. Under this circumstance, cause-effect factors should be established simultaneously. The relationships among evaluation factors are visualized on a causal relationship diagram in Tab. 2, which could be obtained using the dataset of (

Regarding the results from Tab. 2 and Fig. 1, cause-factors including (C3), (C2), and (C4), are demonstrated over the horizontal axis, while effect-factors (C1), (C5) and (C6) are located on the opposite end. The illustration shows that (C3), (C2) and (C4), are the most influential criteria, affecting (C6), (C5) and (C1). Consequently, much attention should be paid forth to improve (C3), (C2), and (C4); the following are later considerations for (C6) (C5), and (C1).
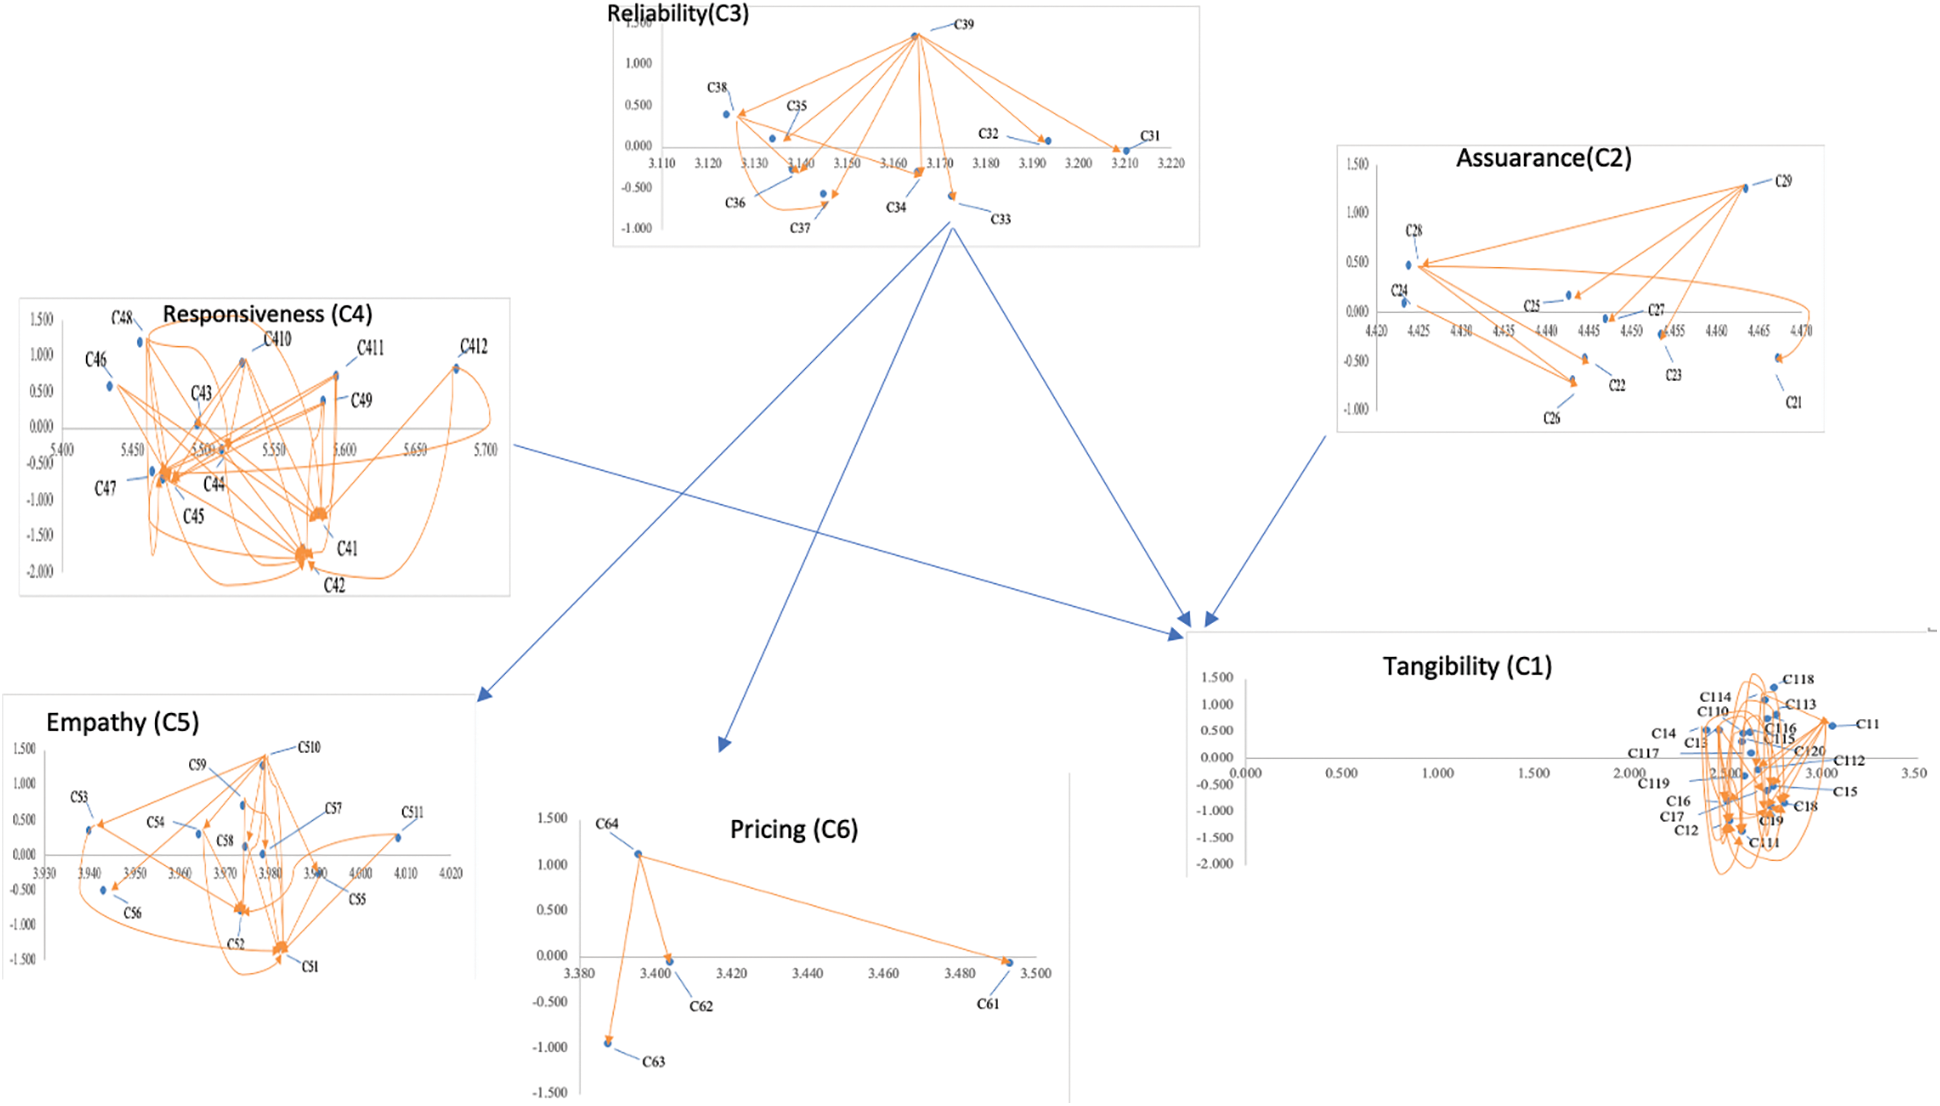
Figure 1: Causal relationship diagram for SERVQUAL criteria
Concerning the causal relationship diagram based on Tab. 3 for (C1). The cause-group in Fig. 1 consists of (C11), (C13), (C14), (C110), (C113), (C114), (C115), (C116), (C117), (C118), (C120). Effect-factors are (C118), (C111), and (C18). In contrast, the mentioned cause-factors, except for (C11), cause minimal impact on the overall Tangibility. The results indicated that there is a rising need for VinFast to focus on (C11), (C118), (C111), (C18), (C114). The better the Formal dress code, the more detailed Organizational chart information and genuine auto components, in conjunction with Certification, the better the Tangibility dimension.

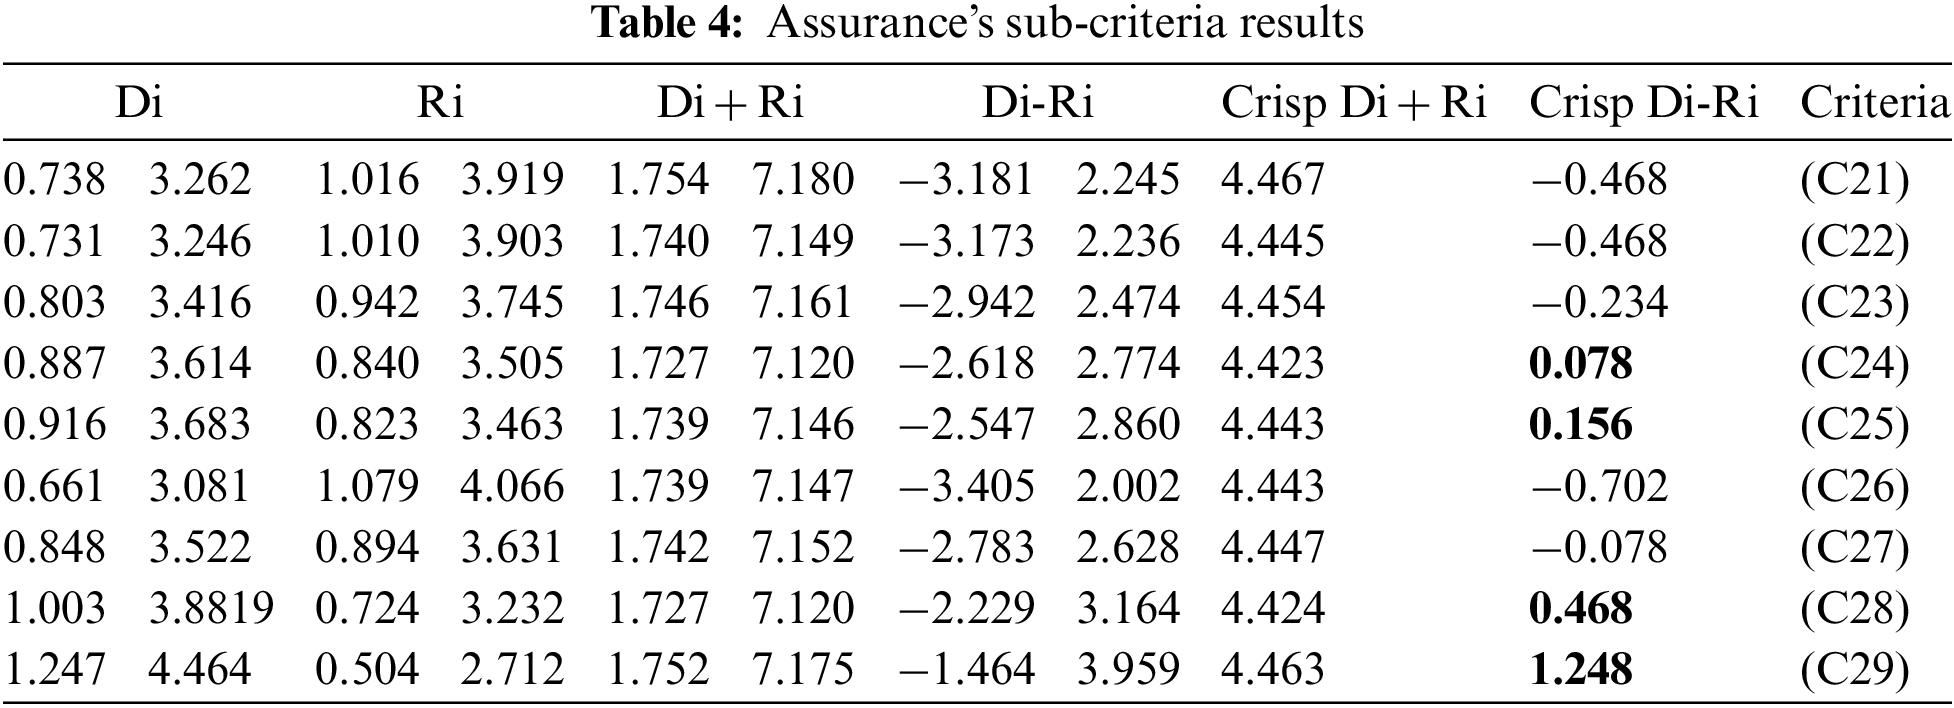
Tab. 4 and Fig. 1 show that the cause sub-criteria are (C29), (C28), (C25), (C24), while the effect group includes (C26), (C22), (C21), (C3), (C7). Among these relationships, the most prominent cause-factor would be (C29) since most sub-criteria are affected by (C29). Therefore, service users are more concerned about VinFast’s capability to fulfil promised service quality.
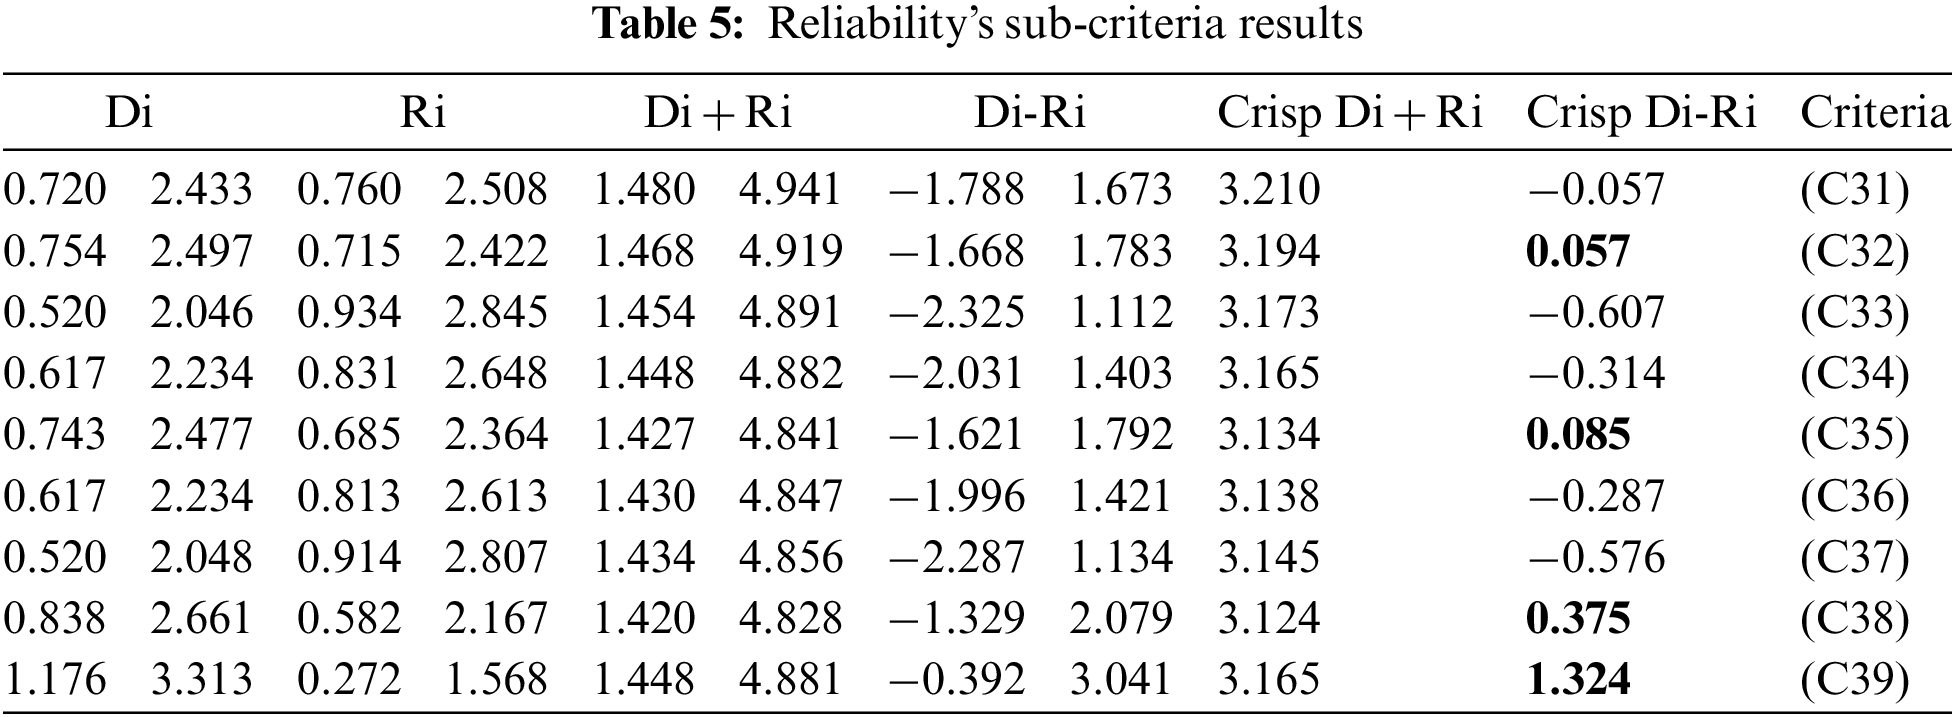
The cause-factors are identified in Tab. 5, as follows: (C39), (C38), (C35), (C32), while the remaining factors are classified into effect group with negative net effect values. As can be seen from Fig. 1, (C39) and (C38) are the most significant cause sub-dimensions because these two factors unilaterally affect the others.
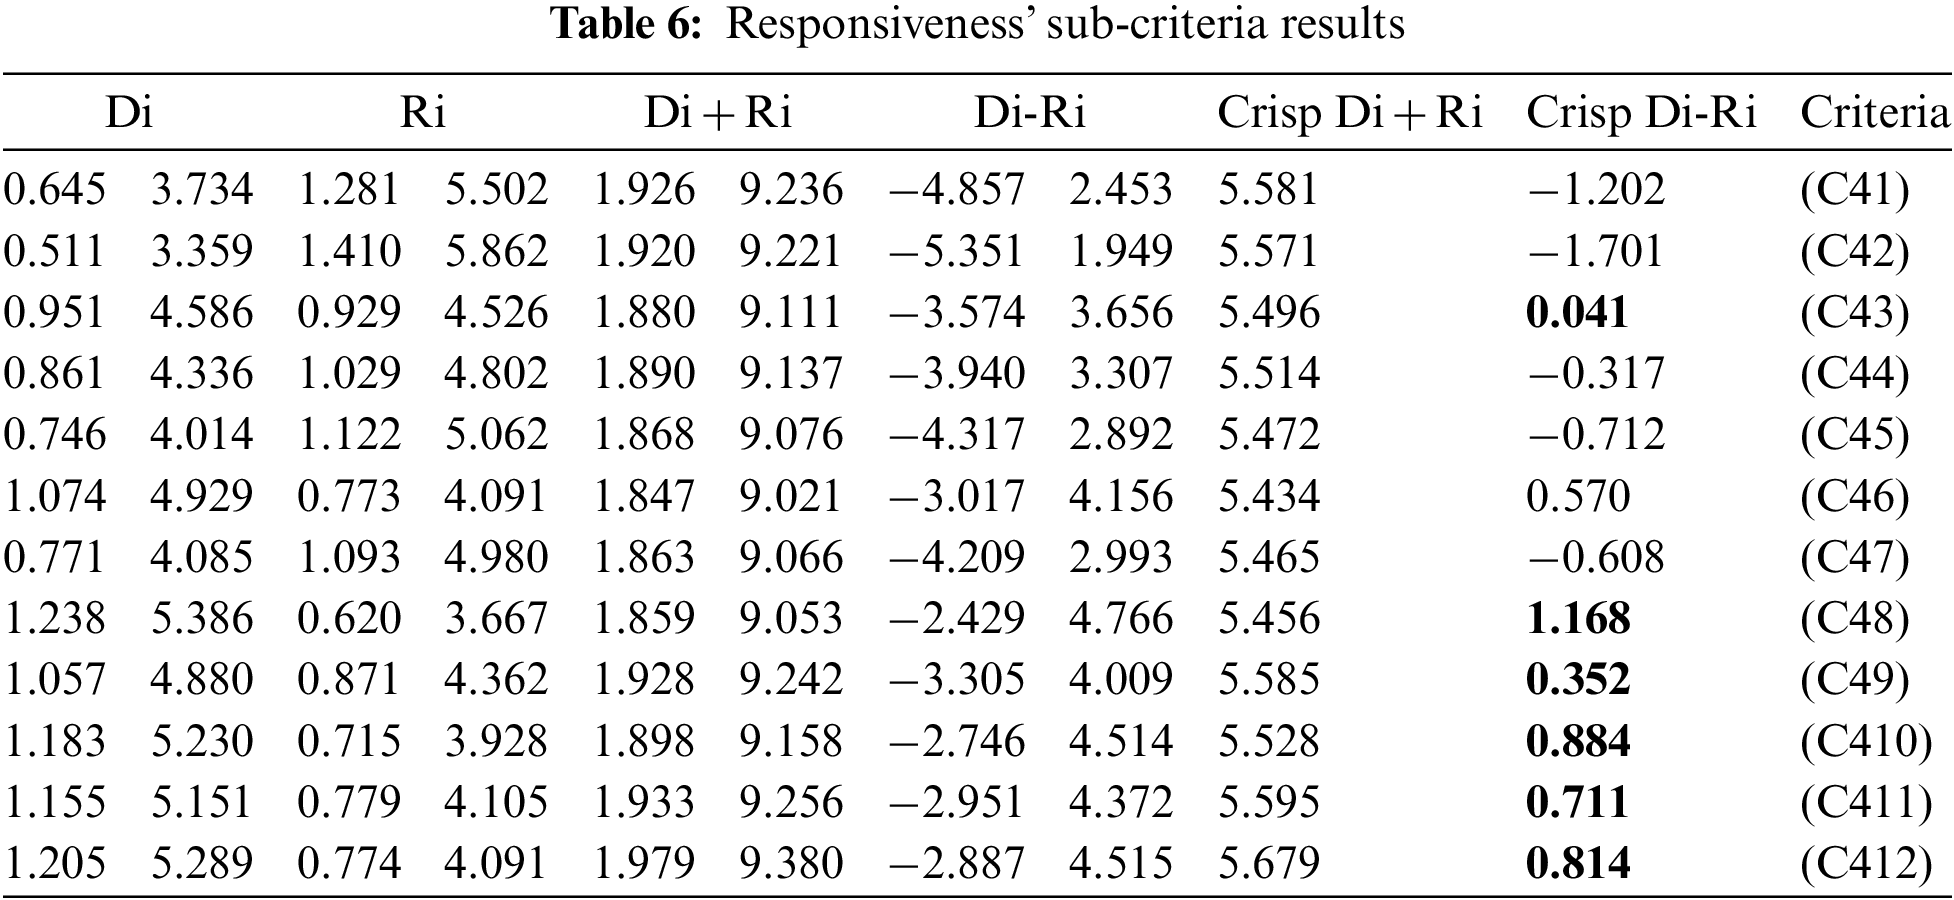
Similarly, for Responsiveness aspect as shown in Tab. 6 and Fig. 1, (C43), (C46), (C48), (C410), (C411), and (C412) are classified as cause-criteria. Meanwhile, the remainder composes of negative effect-criteria: (C42), (C41), (C45), (C47), and (C44). As a consequence, cause-criteria should be the priorities, followed by effect criteria at later stages.
Out of 11 Empathy’s sub-dimensions, the cause-group accounts for the majority with seven factors including: (C510), (C59), (C511), (C57), (C58), (C54), and (C53), while the other factors are subjected to the effect-group as shown in Tab. 7 and Fig. 1. In terms of the cause-effect relationship for Pricing’s sub-criteria as shown in Tab. 8 and Fig. 1, (C64) appears as an influencing factor on other factors comprising (C63), (C61), and (C62).

4.2 Results of Criteria Weights and Rankings
For VinFast’s ranking of main concepts, weight values pointed out that Tangibility > Reliability > Assurance are under customers’ scrutiny, whilst service users are putting backward Pricing > Empathy > Responsiveness in Tab. 9. The results are confirmed by [33], whose research revealed the role of Reliability, and Assurance for the correlation involving service quality dimensions and customer satisfaction. Alternatively, the results are consistent with the findings from a study by [34], which recognized Responsiveness as an integrated element of the service delivery in the health care system.
Regarding local rankings of Tangibility’s sub-criteria, (C11), (C118), and (C111) are ranked the highest. Meanwhile, (C29), (C26), and (C21) are the top three of Assurance’s sub-criteria. Ranked by the local weights, it is inferred that (C39), (C33), and (C31) should be prioritized. When discussing the rankings of Responsiveness’ sub-criteria, it was evident that allocating resources for (C42), (C412), and (C41) is more urgent. On the other hand, (C51), (C510), and (C52) critically serve as the foundational attributes for VinFast’s Empathy; settling down these problems would help set the stepping stone for improving the rest of Empathy’s dimensions. Finally, the top sub-criterion of Pricing is (C64). It means that most customers concern about the reasonable price of service. Along with global weights and rankings (Tab. 9), VinFast’s board of management would prioritize factors for development based on the level of contribution. The highest weight scores indicated that VinFast’s Pricing sub-dimensions are the top 4 of global rankings, which demonstrates its importance amongst other enablers and shows that advancements toward improving these factors should be considered. However, Chang et al. [35] pointed out Assurance’s sub-criteria and Empathy’s sub-criteria as essential indicators of service quality in Taiwan’s automobile industry. Alongside manufacturing vehicles powered by fossil energy, VinFast is targeting to develop a sustainable ecosystem including electric vehicles, which was inspired by Tesla. The research of [36] also highlighted the automobile industry’s substantial contribution to sustainable development on a global scale through electrification and decarbonization schemes. Meanwhile, environmental regulations influence R&D projects, automotive companies need to contemplate sustainability [37]. As a result, VinFast’s investments in electrification are appropriate in corresponding to changes.
5 Conclusions and Implications
This study conducted a comprehensive model of Grey-DEMATEL to investigate the influencing factors for VinFast’s service quality in Vietnam’s automotive industry. Basing on a “deep” and” wide” literature review and expert interviews, the proposed dimensions and sub-dimensions are indicated for VinFast’s service quality supervisors, senior managers. These criteria were analyzed through Grey-DEMATEL, and it provides better support for decision makers to get helpful results with less information. This study was completed with the assistance of a proposed model with its application in a leading automotive manufacturer through feedbacks from their industrial managers and one academic expert. The findings of this research framework could be applied to help high-level managers and practitioners better design more and more effective managerial strategies in service quality. Regarding the decisive dimension of (C1) Tangibility, Tangibility’s most significant causal factor is (C11) Genuine with the highest weight at 0.057. The results imply that VinFast’s customers are more concerned about genuine products and (C11) Genuine. Regarding the (C2) Assurance dimension, global weight values indicated that (C29) Service quality, (C26) Safety, (C21) Professionalism, and (C22) Detail work explanation is far more critical in comparison with other groups’ factors. Dealing with the (C3) Reliability, the most crucial driver of VinFast’s Reliability is (C39) Billing with a weight of 0.119. Based on the global weighting results of (C4) Responsiveness, (C412) Compatible staff is remarked as the most significant sub-criterion, and this criterion is a key point in maintaining responsiveness in particular and overall VinFast’s service quality in general. The main driver of the (C5) Empathy is (C51) Courtesy criterion. This study implied that customers show more concerns over (C6) Pricing dimensions of VinFast. Compared to other sub-dimensions, Pricing’s sub-dimensions are far more important in terms of global weight values, with (C64) Reasonable prices being the second most important on global weight rankings.
As the Vietnamese automotive manufacturing industry develops rapidly, accumulating a substantial market share is challenging due to fierce competition. In this sense, retaining customer satisfaction through the implementation of service quality should be supported by diverse factors. First, from the macroeconomic viewpoint, the government’s policies supporting the industry plays an essential role in protecting the national automobile production. Upon the industry’s development, continuously issuing incentive regulations could help stimulate domestic producers to engage in the industry, eventually laying a firm foundation for the sector’s future development. Business owners, both existing entities and potential ones need to proactively take measures in response to the regulations to advance further. The linkages between business and government have been investigated in a case study by [38], which commented that there is a bidirectional lobbying situation between the automobile industry and the local state government of Michigan. As the decisive point for successes, it is suggested that there should be appropriate applications of the government’s policies. Besides, a study conducted in China about government intervention and the automobile industry concluded that government intervention through Gross domestic product (GDP) incentive might possibly induce tax avoidance for enterprises. The study’s findings have strengthened the thesis that government intervention into business activities stimulates preferential treatment. Second, in an increasingly demanding market, where automobile makers are caught up in intense competition, conformity in industrial and environmental standards is inadequate to move companies fast forward. Service innovation requiring applications of cutting–edge technologies, in conjunction with Research and Development (R&D) activities that often appear in new services, new products, and new business models, could create competitive edges for companies. For this reason, as studied by [39], adopting a data mining process in managing customer data, customer repair data helps improve the quality of the problem-solving system in the automobile industry. A data mining protocol lying in the core of a customer-based problem-solving tool is a creative way to improve VinFast’s service quality.
Acknowledgement: I would like thank reviewers and editors who contributed to the article.
Funding Statement: The authors received no specific funding for this study.
Conflicts of Interest: The authors declare that they have no conflicts of interest to report regarding the present study.
Data Availability Statement: The dataset is available online via the following link: https://data.mendeley.com/drafts/10.17632/j77skr7yc3.1 (accessed on 29 April 2022).
References
1. B. Saberi, “The role of the automobile industry in the economy of developed countries,” International Robotics & Automation Journal, vol. 4, no. 3, pp. 179–180, 2018. https://doi.org/10.15406/iratj.2018.04.00119. [Google Scholar]
2. Vietnam News, “Vietnam’s automobile supporting industry remains underdeveloped.” https://vietnamnews.vn/economy/1036026/viet-nams-automobile-supporting-industry-remains-underdeveloped.html (accessed Mar. 08, 2022) 2021. [Google Scholar]
3. A. Hansen, “Driving development? the problems and promises of the car in Vietnam,” Journal of Contemporary Asia, vol. 46, no. 4, pp. 551–569, 2016. [Google Scholar]
4. H. Oh and K. Kim, “Customer satisfaction, service quality, and customer value: Years 2000–2015,” International Journal of Contemporary Hospitality Management, vol. 29, no. 1, pp. 2–29, 2017. [Google Scholar]
5. W. Wikhamn, “Innovation, sustainable HRM and customer satisfaction,” International Journal of Hospitality Management, vol. 76, pp. 102–110, 2019. [Google Scholar]
6. H. Li, Y. Liu, C. W. Tan and F. Hu, “Comprehending customer satisfaction with hotels: Data analysis of consumer-generated reviews,” International Journal of Contemporary Hospitality Management, vol. 32, no. 5, pp. 1713–1735, 2020. [Google Scholar]
7. F. R. Lucini, L. M. Tonetto, F. S. Fogliatto and M. J. Anzanello, “Text mining approach to explore dimensions of airline customer satisfaction using online customer reviews,” Journal of Air Transport Management, vol. 83, no. 12, pp. 101760–101672, 2020. [Google Scholar]
8. A. Parasuraman, V. A. Zeithaml and L. L. Berry, “A conceptual model of service quality and its implications for future research,” Journal of Marketing, vol. 49, no. 4, pp. 41–50, 1985. [Google Scholar]
9. V. A. Zeithaml, L. L. Berry and A. Parasuraman, “SERVQUAL: A multiple-item scale for measuring consumer perceptions of service quality,” Journal of Retailing, vol. 64, no. 1, pp. 12–40, 1988. [Google Scholar]
10. S. W. Brown and T. A. Swartz, “A gap analysis of professional service quality,” Journal of Marketing, vol. 53, no. 2, pp. 92–98, 1989. [Google Scholar]
11. J. J. Cronin and S. A. Taylor, “Measuring service quality: A reexamination and extension,” Journal of Marketing, vol. 56, no. 3, pp. 55–68, 1992. [Google Scholar]
12. F. Buttle, “SERVQUAL: Review, critique, research agenda,” European Journal of Marketing, vol. 30, no. 1, pp. 8–32, 1996. [Google Scholar]
13. S. J. Park, Y. Yi and Y. R. Lee, “Heterogeneous dimensions of SERVQUAL,” Total Quality Management and Business Excellence, vol. 32, no. 1–2, pp. 92–118, 2021. [Google Scholar]
14. M. Augustyn and S. K. ho, “Service quality and tourism,” Journal of Travel Research, vol. 37, no. 1, pp. 71–75, 1998. [Google Scholar]
15. P. Ramseook-Munhurrun, “Service quality in private sector,” International Journal of Marketing and Marketing Research, vol. 3, no. 1, pp. 37–50, 2010. [Google Scholar]
16. R. Luke and G. J. Heyns, “An analysis of the quality of public transport in Johannesburg, South Africa using an adapted SERVQUAL model,” Transportation Research Procedia, vol. 48, pp. 3562–3576, 2020. [Google Scholar]
17. N. A. A. Roslan, E. Wahab and N. H. Abdullah, “Service quality: A case study of logistics sector in Iskandar Malaysia using SERVQUAL model,” Procedia-Social and Behavioral Sciences, vol. 172, pp. 457–462, 2015. [Google Scholar]
18. C. C. Chou, L. J. Liu, S. F. Huang, J. M. Yih and T. C. Han, “An evaluation of airline service quality using the fuzzy weighted SERVQUAL method,” Applied Soft Computing, vol. 11, no. 2, pp. 2117–2128, 2011. [Google Scholar]
19. R. Liu, L. Cui, G. Zeng, H. Wu, C. Wang et al., “Applying the fuzzy SERVQUAL method to measure the service quality in certification & inspection industry,” Applied Soft Computing, vol. 26, pp. 508–512, 2015. [Google Scholar]
20. P. Chaichinarat, T. Ratanaolarn, K. Kiddee and P. Pimdee, “Thailand’s automotive service quality customer satisfaction: A servqual model cfa of suzuki mo,” Asia-Pacific Social Science Review, vol. 18, no. 2, pp. 99–113, 2018. [Google Scholar]
21. K. Farshianabbasi, S. Golrizgashti and A. R. Hejaz, “Assessing after-sales services quality: Integrated SERVQUAL and fuzzy Kano’s model,” International Journal of Services, Economics and Management, vol. 11, no. 2, pp. 137–166, 2020. [Google Scholar]
22. C. -H. Ko and C. -M. Chou, “Apply the SERVQUAL instrument to measure service quality for the adaptation of ITC technologies: A case study of nursing homes in Taiwan,” Healthcare, vol. 8, no. 2, pp. 108–124, 2020. [Google Scholar]
23. C. Kafere and A. Garad, “Assessment of donor service quality at national blood service Zimbabwe using SERVQUAL instrument,” International Journal for Quality Research, vol. 14, no. 4, pp. 1037–1058, 2020. [Google Scholar]
24. J. Deng, “Introduction to grey mathematical resources,” Journal of Grey System, vol. 20, no. 2, pp. 87–92, 2008. [Google Scholar]
25. P. H. Nguyen, J. F. Tsai, I. E. Kayral and M. H. Lin, “Unemployment rates forecasting with grey-based models in the post-COVID-19 period: A case study from Vietnam,” Sustainability, vol. 13, no. 14, pp. 7879–7906, 2021. [Google Scholar]
26. S. Liu and Y. Lin, “Introduction to grey systems theory,” The Journal of Grey System, vol. 25, no. 2, pp. 1–25, 2010. [Google Scholar]
27. T. T. Tran, T. Q. A. Ngo, T. N. A. Cung, T. G. Nguyen, D. D. Vu et al., “Influencing factors of the international payment service quality at joint stock commercial bank for investment and development of Vietnam,” The Journal of Asian Finance, Economics, and Business, vol. 7, no. 10, pp. 241–254, 2020. [Google Scholar]
28. J. E. Collier and C. C. Bienstock, “Measuring service quality in E-retailing,” Journal of Service Research, vol. 8, no. 3, pp. 260–275, 2006. [Google Scholar]
29. T. -T. Dang, C. -N. Wang and T. L. Nguyen, “Two-stage fuzzy MCDM for green supplier selection in steel industry,” Intelligent Automation and Soft Computing, vol. 33, no. 2, pp. 1245–1260, 2022. [Google Scholar]
30. S. Opricovic and G. H. Tzeng, “Defuzzification within a multicriteria decision model,” International Journal of Uncertainty, Fuzziness and Knowledge-Based Systems, vol. 11, no. 5, pp. 635–652, 2003. [Google Scholar]
31. A. Gabus and E. Fontela, “World problems an invitation to further thought within the framework of DEMATEL,” Geneva, Switzerland: Battelle Geneva Research Center, pp. 1–8, 1972. [Google Scholar]
32. Reuters, “Vietnam’s Vinfast to build $2 bln electric vehicle factory in U.S.,” 2022. https://www.reuters.com/business/autos-transportation/vietnams-vinfast-build-2-bln-electric-vehicle-factory-us-2022-03-29/ (accessed Mar. 08, 2022). [Google Scholar]
33. J. Aiyesehinde and C. Aigbavboa, “Identifying the critical factors driving the quality of After-sales services in the Nigerian automotive industry,” in 2019 IEEE AFRICON. IEEE, pp. 1–5, 2019. [Google Scholar]
34. V. L. Purcărea, I. R. Gheorghe and C. M. Petrescu, “The assessment of perceived service quality of public health care services in Romania using the SERVQUAL scale,” Procedia Economics and Finance, vol. 6, no. 13, pp. 573–585, 2013. https://doi.org/10.1016/s2212-5671(13)00175-5. [Google Scholar]
35. P. C. Chang, C. L. Chuang, W. C. Chuang and W. C. Lin, “An examination of the effects of quality on customer loyalty: The automobile industry in Taiwan,” Total Quality Management and Business Excellence, vol. 26, no. 4, pp. 203–217, 2015. [Google Scholar]
36. S. Lisowski, M. Berger, J. Caspers, K. Mayr-Rauch, G. Bäuml et al., “Criteria-based approach to select relevant environmental sdg indicators for the automobile industry,” Sustainability, vol. 12, no. 21, pp. 1–22, 2020. [Google Scholar]
37. S. Lee, Y. Cho and M. Ko, “Robust optimization model for r&d project selection under uncertainty in the automobile industry,” Sustainability, vol. 12, no. 23, pp. 1–15, 2020. [Google Scholar]
38. B. D. Jones, “Government and business. The automobile industry and the public sector in Michigan,” Political Geography Quarterly, vol. 5, no. 4, pp. 369–384, 1986. [Google Scholar]
39. Z. Xu, Y. Dang and P. Munro, “Knowledge-driven intelligent quality problem-solving system in the automotive industry,” Advanced Engineering Informatics, vol. 38, no. 8, pp. 441–457, 2018. [Google Scholar]
40. E. Peitzika, S. Chatzi and D. Kissa, “Service quality expectations in the fitness center context: A validation of the expectations component of the servqual scale in Greece,” Services Marketing Quarterly, vol. 41, no. 2, pp. 89–104, 2020. [Google Scholar]
41. J. van Iwaarden, T. van der Wiele, L. Ball and R. Millen, “Applying SERVQUAL to web sites: An exploratory study,” International Journal of Quality and Reliability Management, vol. 20, no. 8, pp. 919–935, 2003. https://doi.org/10.1108/02656710310493634. [Google Scholar]
42. B. T. van Zanten, M. J. Koetse and P. H. Verburg, “Economic valuation at all cost? the role of the price attribute in a landscape preference study,” Ecosystem Services, vol. 22, pp. 289–296, 2016. [Google Scholar]
Appendix:
 | This work is licensed under a Creative Commons Attribution 4.0 International License, which permits unrestricted use, distribution, and reproduction in any medium, provided the original work is properly cited. |