| Computers, Materials & Continua DOI:10.32604/cmc.2022.030856 | |
| Article |
A Novel Multiple Dependent State Sampling Plan Based on Time Truncated Life Tests Using Mean Lifetime
1Division of Mathematics, Department of Mathematics and Computer Science, Faculty of Science and Technology, Rajamangala University of Technology Krungthep, Bangkok, 10120, Thailand
2Division of Applied Statistics, Department of Mathematics and Computer Science, Faculty of Science and Technology, Rajamangala University of Technology Thanyaburi, Pathum Thani, 12110, Thailand
3Center of Excellence in Theoretical and Computational Science (TaCS-CoE) & KMUTT Fixed Point Research Laboratory, Room SCL 802 Fixed Point Laboratory, Science Laboratory Building, Departments of Mathematics, Faculty of Science, King Mongkut’s University of Technology Thonburi (KMUTT), Bangkok, 10140, Thailand
*Corresponding Author: Wimonmas Bamrungsetthapong. Email: wimonmas_b@rmutt.ac.th
Received: 04 April 2022; Accepted: 18 May 2022
Abstract: The design of a new adaptive version of the multiple dependent state (AMDS) sampling plan is presented based on the time truncated life test under the Weibull distribution. We achieved the proposed sampling plan by applying the concept of the double sampling plan and existing multiple dependent state sampling plans. A warning sign for acceptance number was proposed to increase the probability of current lot acceptance. The optimal plan parameters were determined simultaneously with nonlinear optimization problems under the producer’s risk and consumer’s risk. A simulation study was presented to support the proposed sampling plan. A comparison between the proposed and existing sampling plans, namely multiple dependent state (MDS) sampling plans and a modified multiple dependent state (MMDS) sampling plan, was considered under the average sampling number and operating characteristic curve values. In addition, the use of two real datasets demonstrated the practicality and usefulness of the proposed sampling plan. The results indicated that the proposed plan is more flexible and efficient in terms of the average sample number compared to the existing MDS and MMDS sampling plans.
Keywords: Adaptive version of multiple dependent state sampling plan; time truncated life test; quality level; weibull distribution; mean lifetime
An essential tool in product control techniques is the Acceptance Sampling Plan (ASP). This technique helps consumers decide to accept or reject a product by sampling items from the lot. At the same time, the manufacturer can select a minimum sample size from the ASP to provide the acceptance or rejection criteria for that lot. In the past, a single sampling plan (SSP) was the most commonly used for various industries, wherein the decision to accept or reject the lot sentencing depended on a single sampling. Although SSP is easy to use, it often results in a more average sampling number (ASN) than other sampling plans. In practice, if the producer and consumer want to make a clear and precise decision concerning acceptance or rejection of a lot, some situations cannot be decided with a single sample. They should use other sampling plans, such as the double sampling plan [1]. Additionally, manufacturers can use more effective sampling plans, such as MDS sampling plans, to reduce sample size and inspection costs as well as make decisions based on current and previous sample data. Baker et al. [2] presented an MDS sampling plan for a continuous manufacturing process and sent the lot to a serial inspection. The MDS reduces the sample size because accepting or rejecting the current lot depends on current and previous lots. Many researchers have presented the MDS sampling plans in various situations. Govindaraju et al. [3] proposed the development of MDS sampling plans to minimize the sum of producer’s and consumer’s risks under the specified acceptable quality level and limiting quality level. Balamurali et al. [4] studied the MDS based on a variable sampling plan under Normal distribution. Balamurali et al. [5] used the Bayesian methodology to investigate the MDS. Some studies [6–10] used the concept of MDS sampling plan in control chart design. Some researchers studied MDS sampling plans for coronavirus disease (COVID-19). Srinivasa et al. [11] applied the MDS sampling plan to COVID-19 outbreak data in China when the lifetime is Exponentiated Weibull Distribution. Aslam et al. [12] developed the MDS sampling plan based on a time truncated sampling plan for the COVID-19 data using gamma distribution under indeterminacy.
Nowadays, many products are highly reliable, such as electronic products. However, it may not be possible to test every item to ensure the mean lifetime of the product. Therefore, using an ASP can be very helpful in deciding lots before exporting to consumers. The item samples are selected and tested for the specified time in the life test. It can then be decided to accept or reject the lot using the number of failures and sample size entries allowed for the test. Many researchers have proposed various lifetime distributions for ASP designs to ensure product lifetime. For instance, Jun et al. [13] studied SSP and DSP plans by considering variable data under the Weibull distribution. They used sudden mortality testing to reduce inspection time and ASN. Rao [14] studied the group ASP to reduce the inspection time under the Weibull distribution and generalized exponential distribution. Lio et al. [15] suggested that the SSP provides a larger sample size to decide whether to accept or reject a lot. They found that larger sample sizes meant more time and expense spent testing life. Rao et al. [16] presented an MDS sampling plan wherein the life of products is truncated under exponentiated half logistic distribution. Balamurali et al. [17] studied the median life of products for the MDS sampling plan under generalized inverted exponential distribution. Nadi et al. [18] suggested a group MDS sampling plan following the Weibull distribution. They found that the actual mean lifetime was longer than the specified mean lifetime of products. Aslam et al. [19] studied the mean lifetime of products for a generalized MDS sampling plan under gamma distribution, Burr type XII distribution, and Birnbaum-Saunders distribution. MDS sampling plans generally reject the current lot immediately if the previous lot is of medium quality. However, the rest of the lot is of good quality. Aslam et al. [20] created an adapted version of the MDS Sampling Plan (MMDS), which they claimed was more flexible and efficient than the existing MDS plan as measured by sample size and inspection cost under a time truncated life. Al-Omari et al. [21] constructed the new ASP for Length-Biased Weighted Lomax distribution based on a truncated life test. Tripathi et al. [22] presented an attribute modified chain sampling inspection plan based on the time truncated life test under the Darna distribution. Abushal et al. [23] presented the acceptance sampling plan under the power inverted Topp–Leone distribution. The median life of products is used in the truncated life test.
From exploring the literature, we found that the existing MDS sampling plan and MMDS sampling plan are used to decide whether to accept or reject a current lot under a single sample. In some cases, decisions using a single sample can be a problem between producers and consumers regarding sample numbers or the acceptable number of defective products. Therefore, it is necessary to introduce an adaptive MDS sampling plan to eliminate the weakness of the MDS sampling plan and MMDS sampling plan. For this reason, we designed an adaptive version of the MDS (AMDS) sampling plan, intending to achieve a reduced sample size and increase the probability of current lot acceptance under the quality level. The concept of the DSP is applied together with the existing MDS and MMDS sampling plans. Suppose the quality of the product selected from the first sample is undecided. In that case, the second sample must be taken for inspection, after which the decision can be made to accept or reject the current lot based on the previous lots. The AMDS sampling plan is expected to be more flexible and efficient than the existing MDS and MMDS sampling plans. In this study, we endeavor to increase the probability of current lot acceptance and thus divide the acceptance quality into three levels: Excellent, good, or moderate. We focus on designing the AMDS sampling plan when the mean lifetime is based on the Weibull distribution under the time truncated life test. The comparison of the proposed sampling plan with existing sampling plans is given in terms of the ASN.
The rest of this paper is organized as follows: Section 2 shows a brief description of the Weibull distribution. Section 3 proposes the operating procedure and the design of the AMD sampling plan under a time truncated life test. The numerical results, comparison between the AMD sampling plan and the existing MDS sampling plan, and application of two real datasets are presented in Section 4. Finally, the concluding remarks and future work are discussed in Section 5.
The Weibull distribution is the most widely used tool to model the lifetime of data because of its closed-form and flexibility. Many engineering works have studied the lifetime of products based on the Weibull distribution, such as ball bearings, automobile components, and electronic devices. Nowadays, the Weibull distribution is well-known for being used to design the ASP: Please see the example [24–28]. This research designs the AMDS sampling plan to approve the mean lifetime of the product under the Weibull distribution. Let t be the lifetime of a product under the Weibull distribution, and the cumulative distribution function is defined by
where the shape parameter is
The failure probability of a product before time trial
The value of
Eq. (4) show the failure probability in term of the experiment termination ratio, shape parameter, and mean lifetime based on the Weibull distribution.
3 Design of the Adaptive Version of a Multiple Dependent State Sampling Plan Based on a Time Truncated Life Test
Worth and Baker [2] constructed an MDS sampling plan as an attribute inspection process. This sampling plan decides to accept or reject the current lot and requires a continuous sample from the current and previous lots. This reason will result in a reduced sample size. Additionally, this sampling plan is usually used when production is ongoing with multiple lots, and each lot is submitted in sequence for inspection. However, the MDS sampling plan considers data from previous lots using a minimum sample size to eliminate a current lot of moderate quality. The MDS sampling plan will reject the current lot if the previous lot is of moderate quality, but all the remaining lots are of good quality. This reason will increase the risk for manufacturers. Regarding sample size and economic perspective, Nadi et al. [18] introduced the MMDS sampling plan to provide more flexibility and efficiency than the existing MDS sampling plan. As a result, both sampling plans provide more opportunities for producers when the current lot is of moderate quality. The difference is that the existing MDS sampling plan will only accept the current lot if the previous lot (
This research aims to apply the concept of DSP together with the MDS and MMDS sampling plans. Suppose the product quality selected from the first sample is undecided. It is necessary to take the second sample for inspection and then decide to accept or reject the model. This sampling plan reduces the sample size over the MDS and MMDS sampling plans, recognizing that it will accept the current lot if they are of excellent, good, or moderate quality. This sampling plan will reduce the risk to the manufacturer. However, it will not affect consumers. Therefore, the proposed sampling plans are more flexible than the existing MDS and MMDS sampling plans concerning the reduced sample size.
Conditions and operating procedure
The AMDS sampling plan has the same conditions and operating procedures as the existing MDS and MMDS sampling plans:
(1) The product inspected consists of serial lots produced by continuous processes.
(2) In general, each lot examined should be of the same quality.
(3) The exact number of samples is chosen from each lot.
(4) The current lot will be the same quality as the previous lot, or it was immediately successful.
(5) Consumers have confidence in the honesty of the manufacturer.
The AMDS sampling plan is based on time truncated life tests under the Weibull distribution. Let the life test terminate at time trial
Step 1. Choose the first random sample size
Step 2. The current lot is accepted if
Step 3. The current lot is accepted if
Step 4. If
We can summarize the above steps in a flow chart, as presented in Fig. 1.
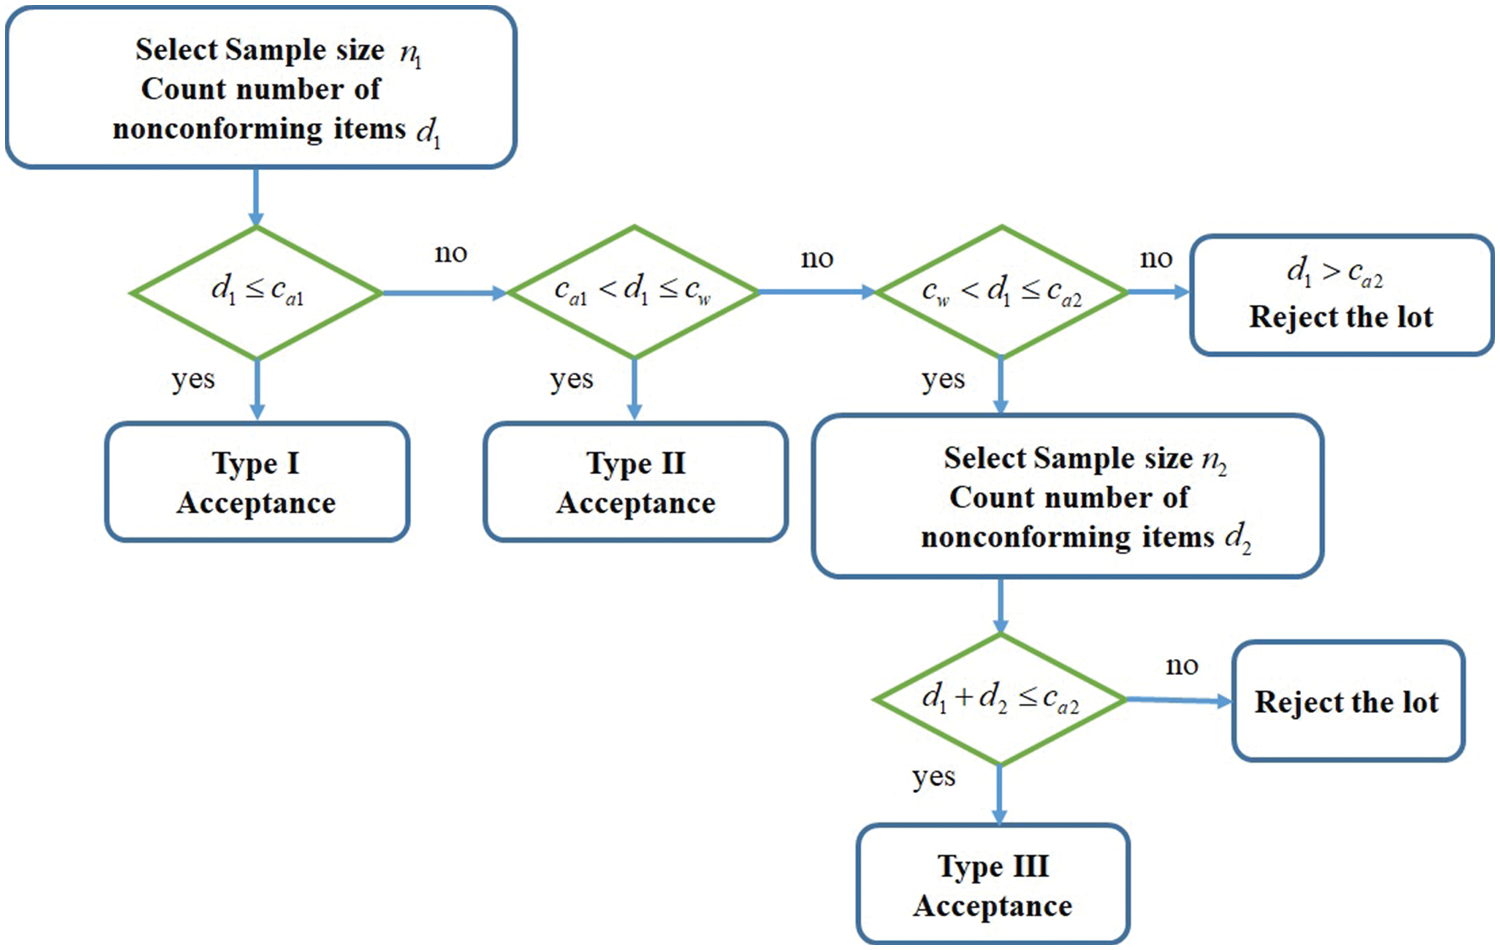
Figure 1: Operating procedure for the AMDS sampling plan
where
This research aims to develop an existing MDS sampling plan to accept the current lot better based on the time truncated life test. Therefore, an acceptable warning number
Type I acceptance
Type II acceptance
Type III acceptance
Thus, the performance of the AMDS sampling plan is interpreted by the operating characteristic (OC) function, which is defined by
In this study, from Eq. (8), the OC function can be determined by the binomial distribution, which is shown as follows.
Another essential point to note is that we can switch the AMDS sampling plan to SSP and DSP by considering the following:
(1) Considering that
(2) Considering that
4 Results, Comparative Study, and Application of Real Datasets
In order to provide good quality electronic products, time and costs are necessary for the inspection process. The ASP that can reduce time and costs for the inspection processes is the economic sampling plan, which minimizes ASN to reduce time and costs. The AMDS sampling plan aims to obtain an ASN lower than the existing MDS and MMDS sampling plans. This sampling plan ensures that the mean lifetime and the ratio between the true mean lifetime and the specified mean lifetime
Objective function:
Subject to:
Let the mean ratio of the producer’s risk be
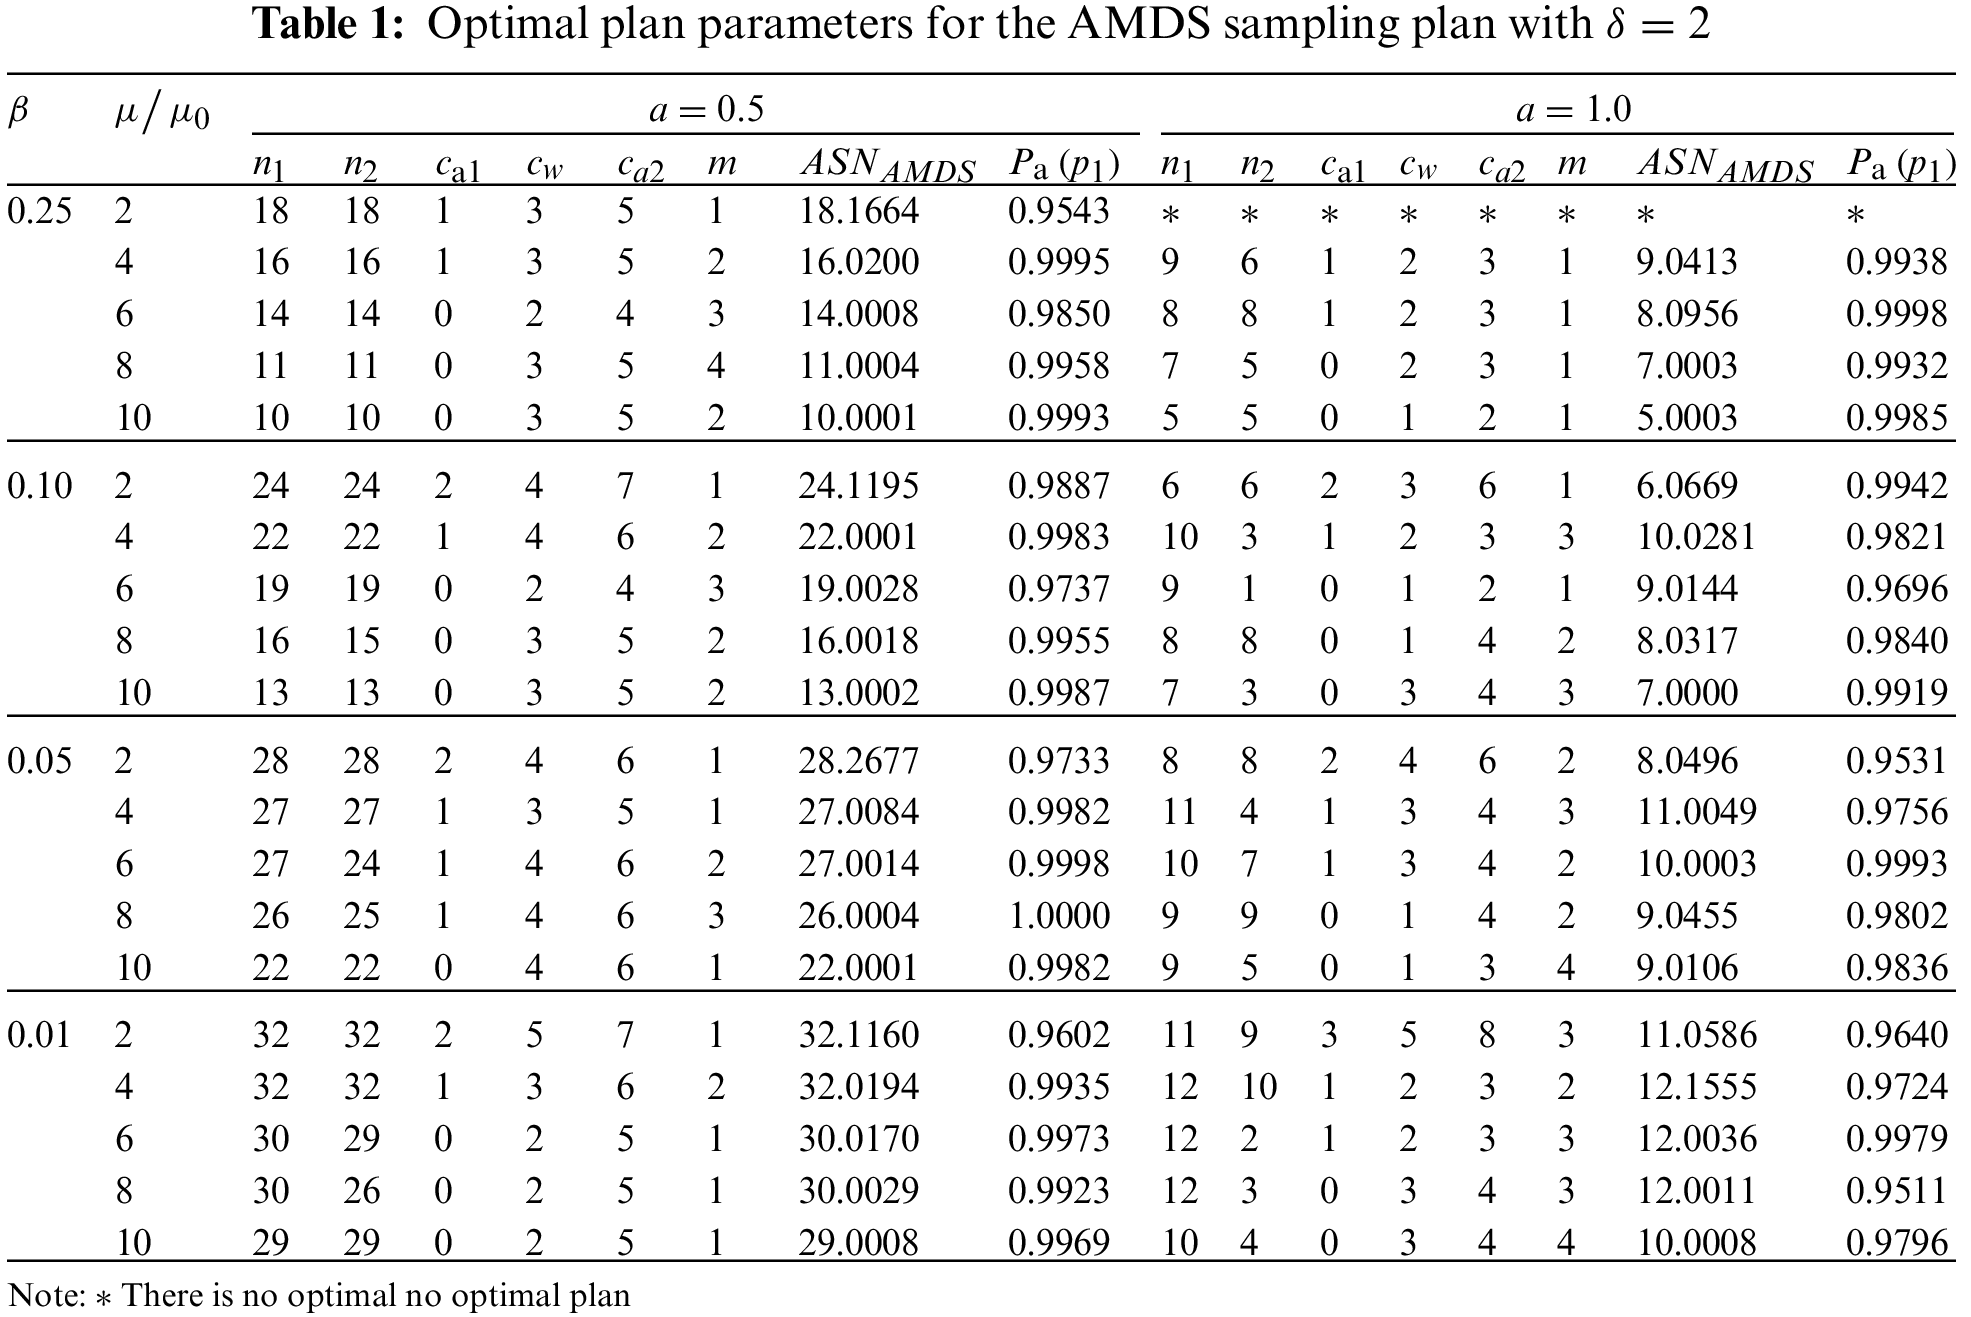
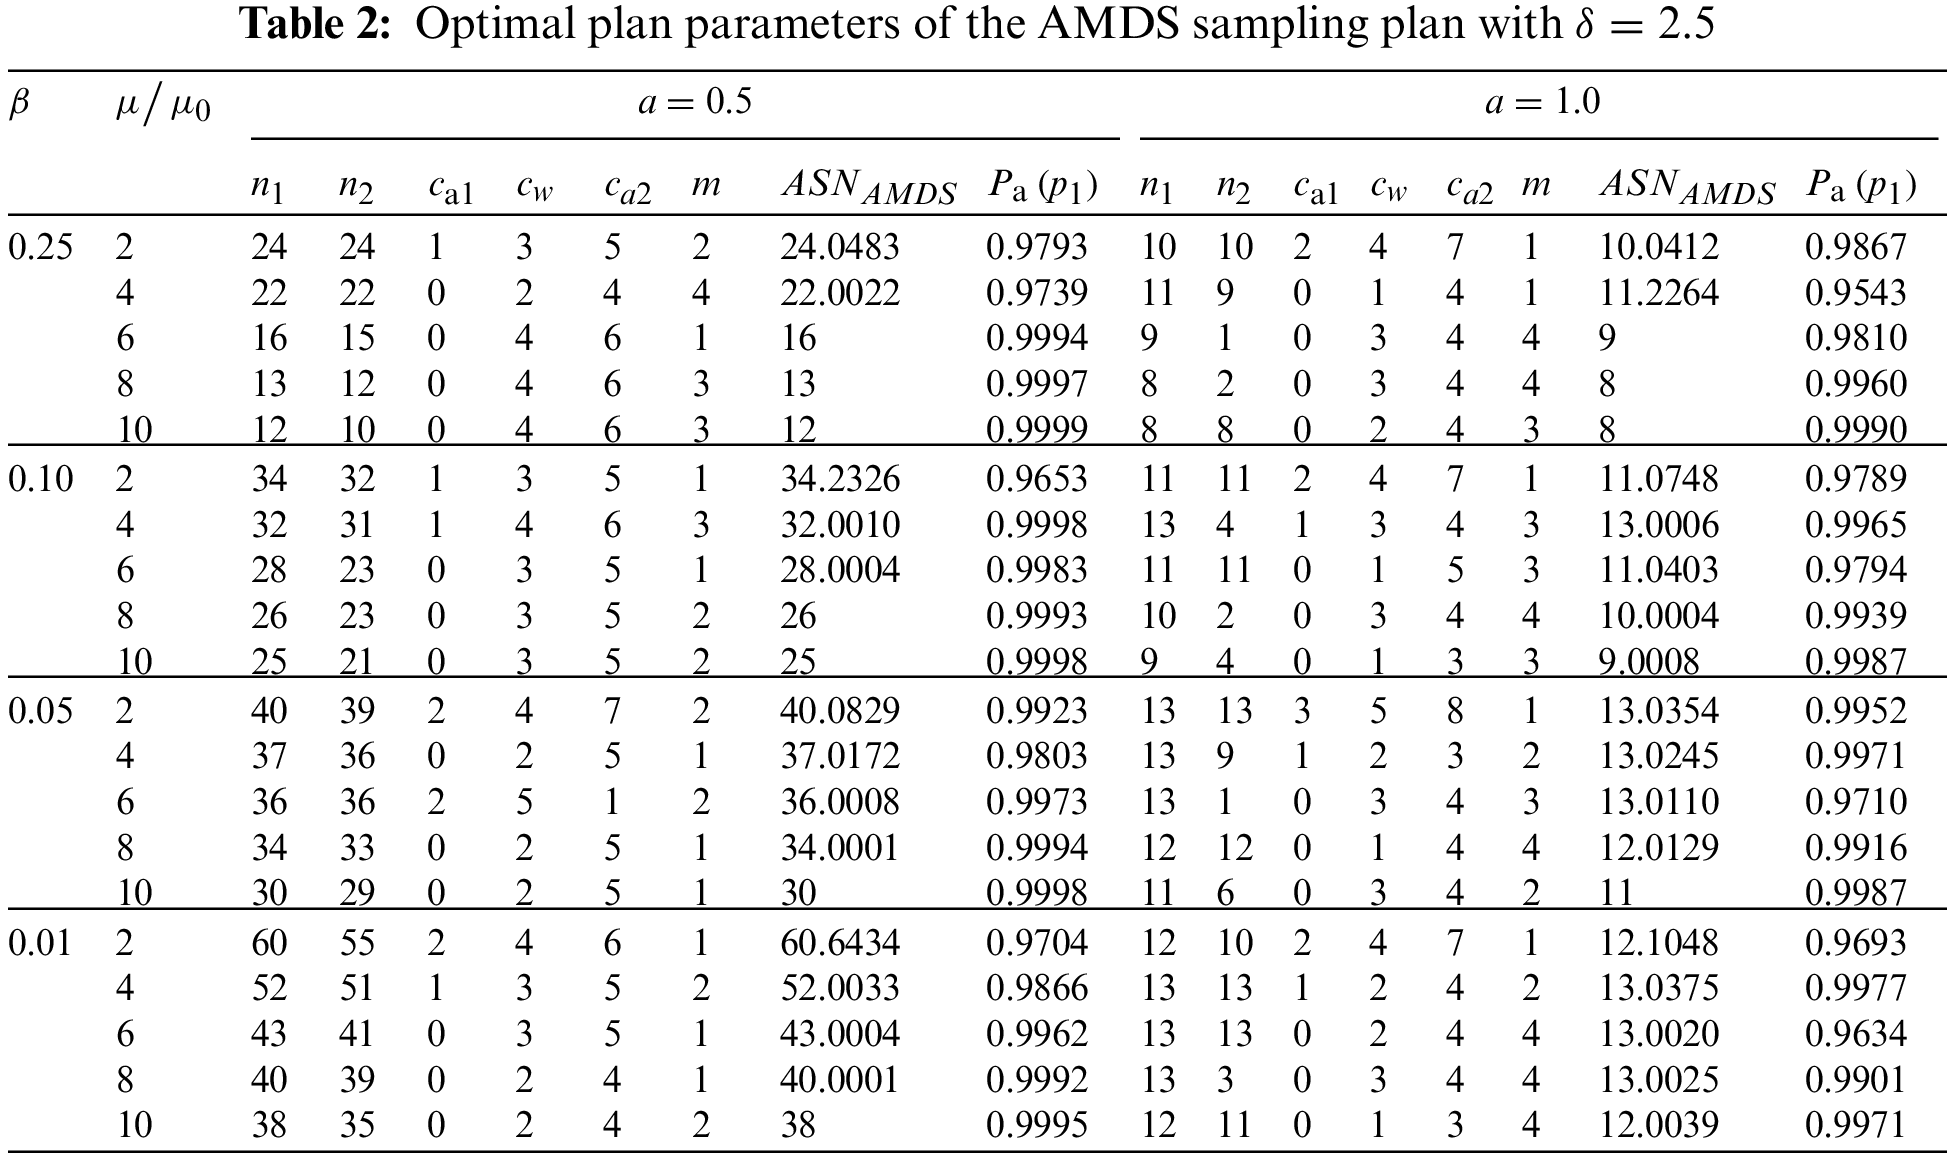
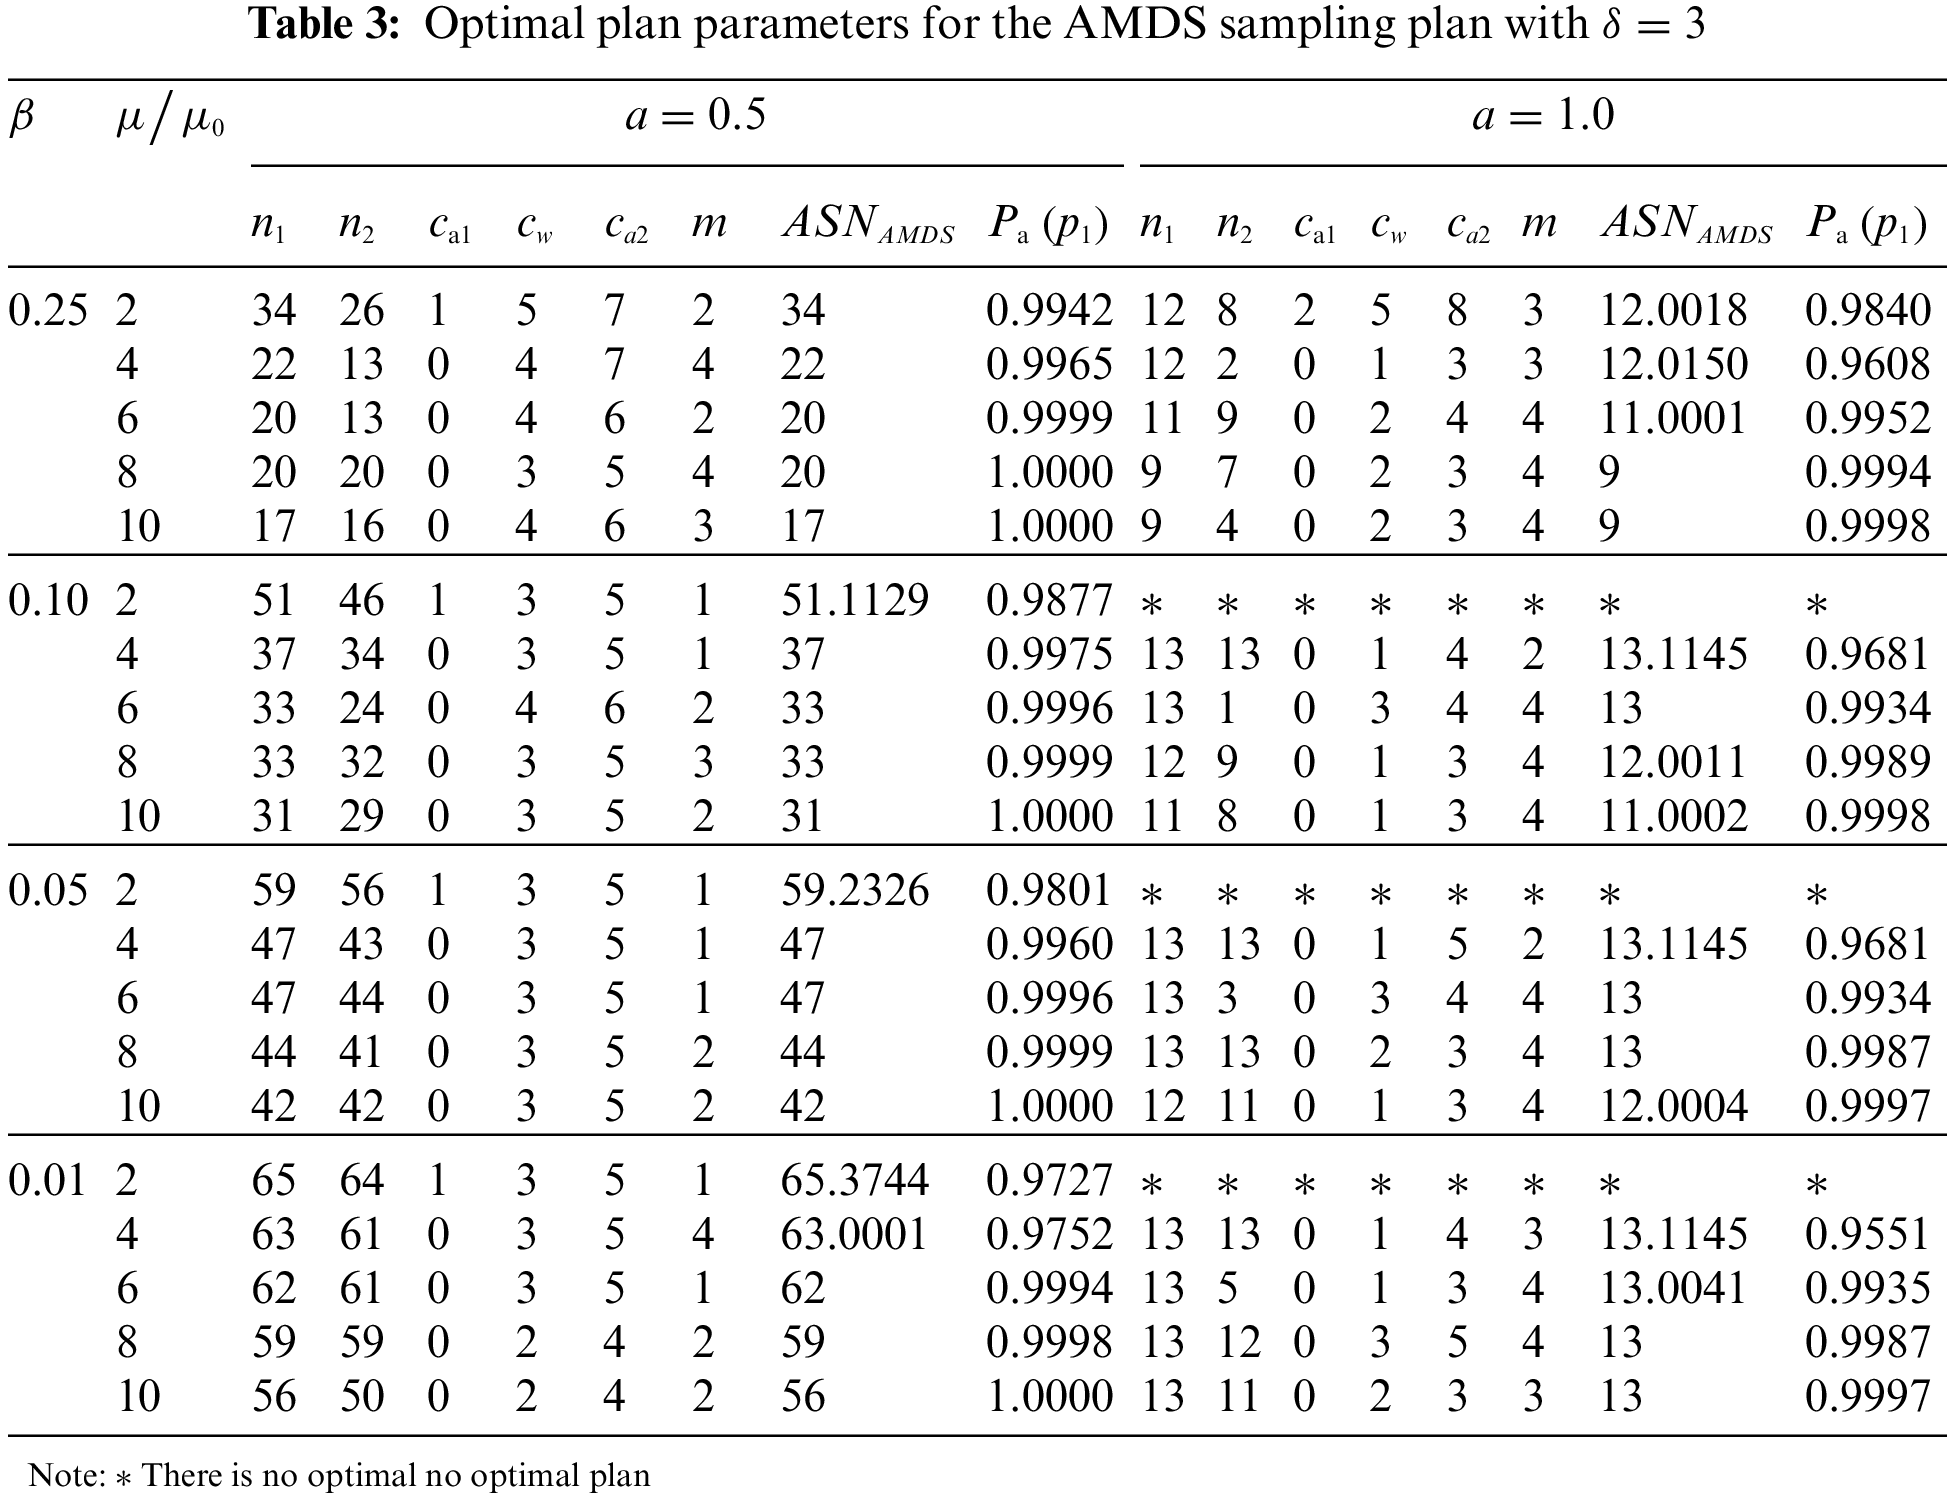
Tabs. 1–3 present the optimal parameters for the AMDS sampling plan under the Weibull distribution. The results show that, for the fixed values of a and
The OC curves present the effect of m values based on the probability of current lot acceptance with different m values, but
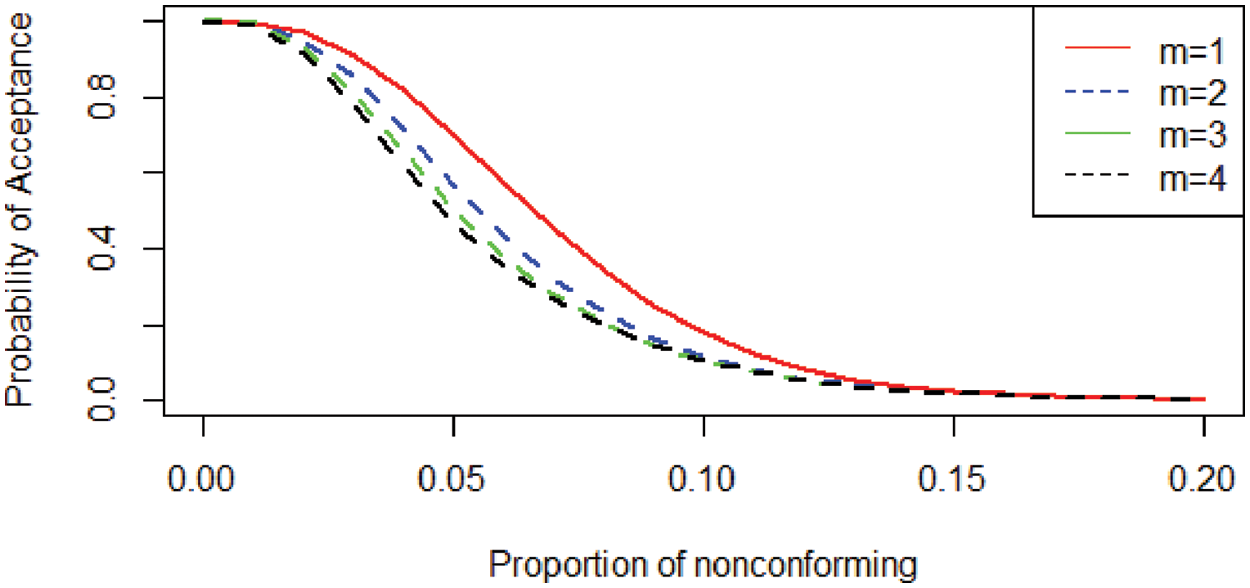
Figure 2: OC curves for the AMDS sampling plan with different m values
Illustrative example: To consider applying the AMDS sampling plan from Tabs. 1–3, we suppose that a manufacturer wants to test the mean lifetime of items where the lifetime is based on the Weibull distribution with shape parameter 2. Let the specified lifetime of the product
Step 1: Choose a first random sample of 18 items from the current lot and put it on the life test. Count the number of nonconforming items
Step 2: If
Step 3: If 1
Step 4: If
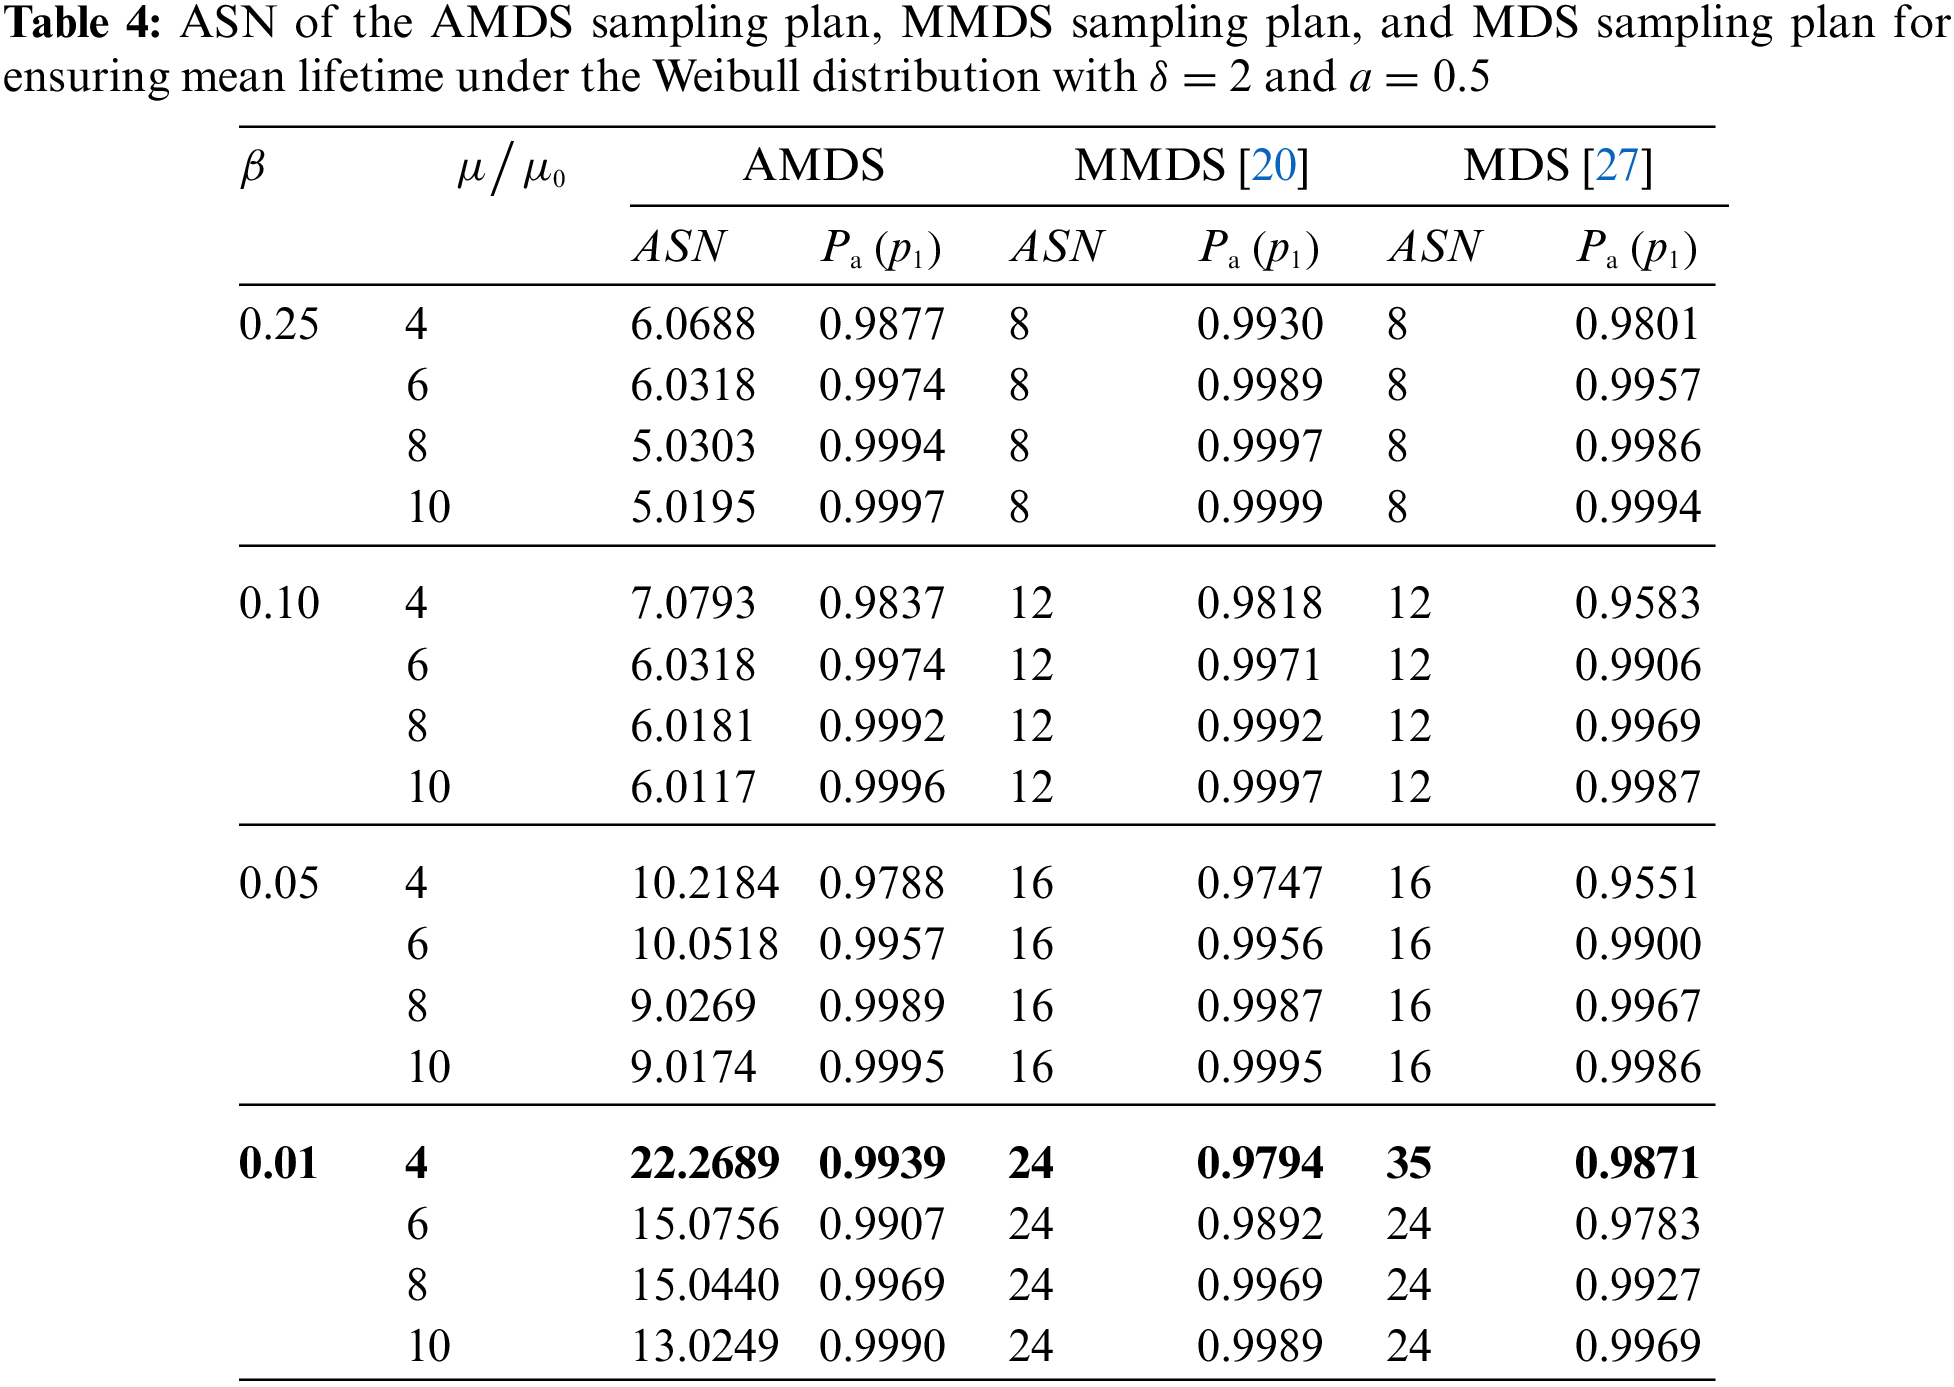
ASN perspective: To demonstrate the efficacy of the AMDS sampling plan in reducing ASN better than the existing MDS and MMDS sampling plans. The ASN of three sampling plans are shown in Tab. 4, in which the concepts and results of ASN under the MMDS and the existing MDS sampling plans are referenced in [20] and [27], respectively. This study compared the ASNs of the three sampling plans using the same parameters. Also, the ASN of the AMDS sampling plan is calculated by substituting
OC curve perspective: This section compares the probability of current lot acceptance between the proposed sampling plans, MMDS and MDS, based on the OC curves of those plans given the same parameters. Suppose
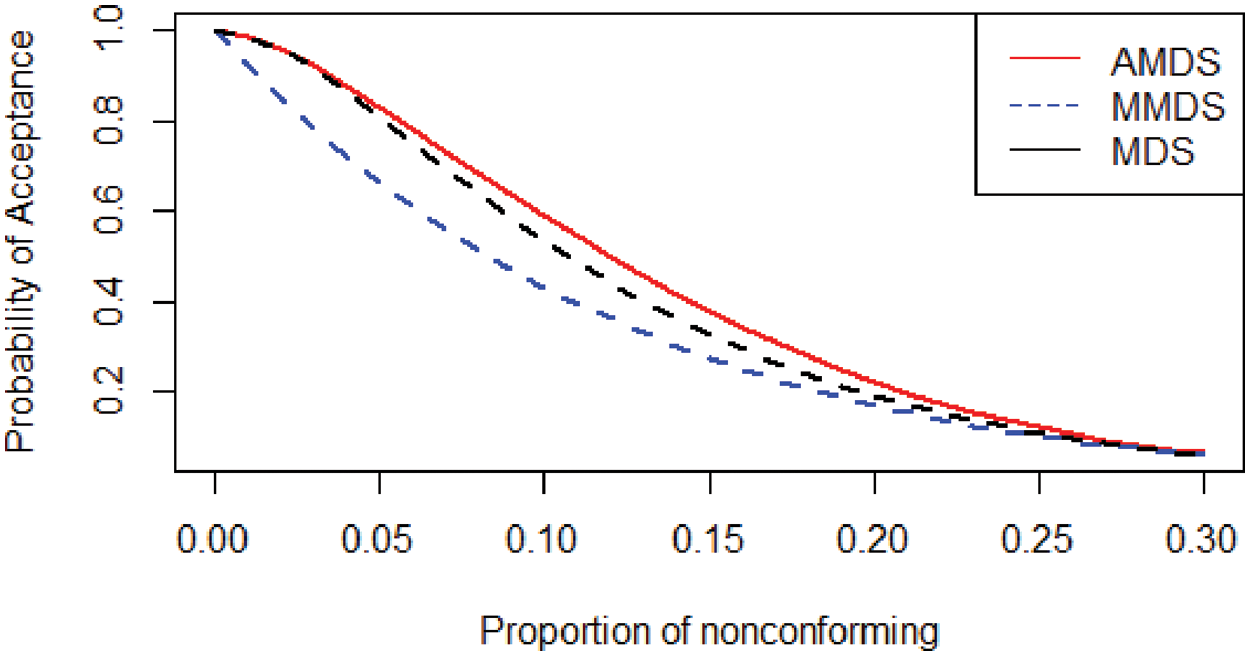
Figure 3: OC curves for AMDS, MMDS, and MDS sampling plan
4.3 Application of Real Datasets
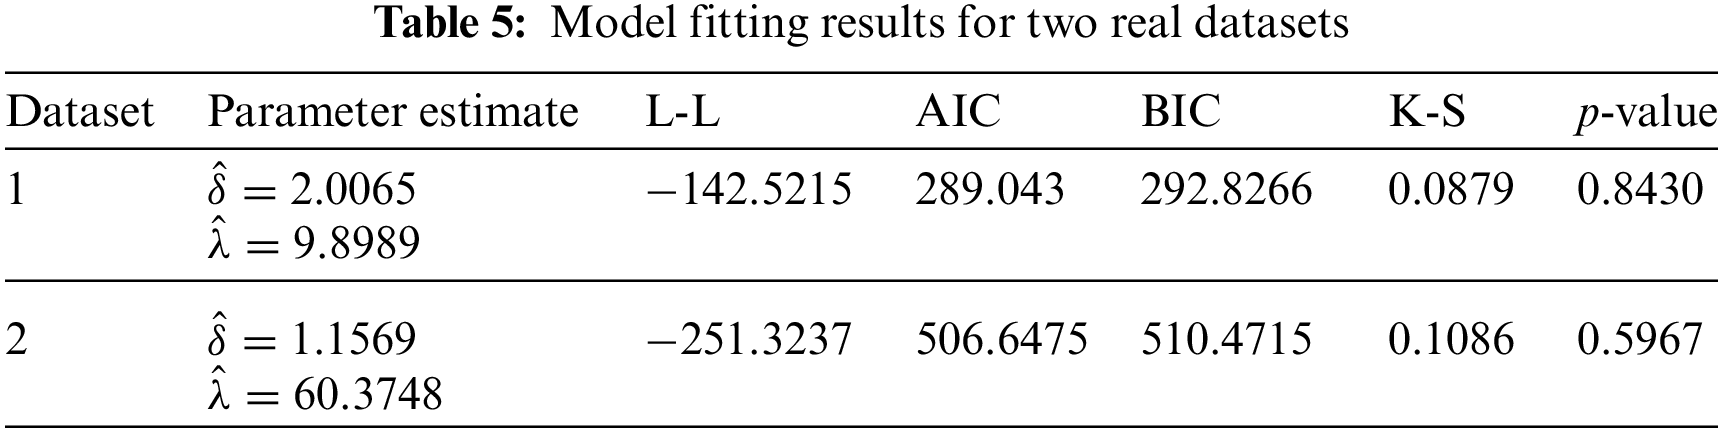
Two real datasets were used to investigate the efficiency of the AMDS sampling plan under the Weibull distribution. First, we needed to check the Weibull distribution fits for both datasets. The unknown parameters were estimated using the maximum likelihood method, and the goodness of the fitness value was judged using the Kolmogorov-Smirnov (K-S) test. The model-fitting results for two real datasets are shown in Tab. 5.
The first dataset: Dataset of the stress-rupture life of Kevlar 49/epoxy strands under constant pressure at 70% stress level until everything fails (in 1, 000 h) is considered, as shown in Cooray et al. [29]. A total of 49 observations are discussed below:
1.051 1.137 1.389 1.921 1.942 2.322 3.629 4.006 4.012 4.063 4.921
5.445 5.620 5.917 5.905 5.956 6.068 6.121 6.473 7.501 7.886 8.108
8.546 8.666 8.831 9.106 9.711 9.806 10.205 10.396 10.861 11.026 11.214
11.362 11.604 11.608 11.745 11.762 11.895 12.044 13.520 13.670 14.110 14.496
15.395 16.179 17.092 17.568 17.568
From Tab. 5, the K-S test is 0.087937 with a p-value of 0.843. Therefore, first dataset is fit for the Weibull distribution. The maximum likelihood estimate of shape parameter
15.395 3.629 14.496 17.568 6.068 4.921 8.546 11.214
5.917 5.905 5.956 4.063 6.121 1.137 7.501 7.886
From 16 items, three failures (
4.006 8.831 5.620 8.108 10.396 11.604 13.670 14.110
8.666 5.445 11.745 9.711 9.806 2.322 10.861 11.026
Under the second inspection, only one failure (
The second dataset: The following dataset represents the failure times for a sample of 50 electronic devices, as shown in Kenett et al. [30]. A total of 50 observations are discussed below:
26.3 78.5 29.8 22.6 113.1 157.4 2.4 51.9 29.3 40.3 216.6 30.5 31.6
57.5 38.1 113.7 1.0 96.8 63.3 72.1 107.4 39.6 29.0 11.0 105.2 36.7
7.1 85.5 24.6 28.0 23.6 14.7 24.3 46.9 56.9 293.4 33.0 47.0 51.9
20.0 20.3 158.9 54.0 14.8 81.2 46.0 42.8 8.9 35.7 32.3
From Tab. 5, The K-S test is 0.0980 with a p-value of 0.5967. Therefore, second dataset is fit for the Weibull distribution. The maximum likelihood estimate of shape parameter
30.5 31.6 57.5 38.1 113.7 1.0 96.8 63.3 29.0 11.0 105.2
From 11 items, we note that two failures (
33.0 47.0 51.9 20.0 20.3 158.9 54.0 14.8
Under the second inspection, three failures (
This paper proposes a new adaptive version of the multiple dependent state (AMDS) sampling plan for a truncated life test based on the Weibull distribution. The concept of DSP is used to apply together with the existing MDS and MMDS sampling plans. The proposed sampling plan will accept the current lot if the quality of the product is of excellent, good, or moderate quality. The nonlinear optimization technique is used to determine the optimal plan parameters to satisfy the consumer’s and producer’s risks simultaneously. Tables for optimal plan parameters are presented under different shape parameter values, manufacturer’s risk, consumer’s risk, and test termination ratio. A comparison between the proposed plan and the existing plan is considered under the ASN and OC curve values. The illustrative example shows the operational process for the proposed plan. In addition, the application of two real datasets demonstrates the usability and usefulness of the proposed plan. Finally, we conclude that the AMDS sampling plan under the Weibull distribution is more flexible and efficient in terms of the average sample number than the existing MDS and MMDS sampling plans. The AMDS sampling plan will be considered under accelerated testing techniques and cost determination in future work.
Acknowledgement: The authors are highly grateful to the reviewers and editors for taking the time to make their comments and suggestions very helpful to the paper.
Funding Statement: This research was supported by Thailand Science Research and Innovation (TSRI) and Rajamangala University of Technology Thanyaburi (RMUTT) under National Science, Research and Innovation Fund (NSRF); Basic Research Fund: Fiscal year 2022 (Contract No. FRB650070/0168 and under Project number FRB65E0634 M.3).
Conflicts of Interest: The author declares that they have no conflicts of interest to report regarding the present study.
References
1. M. Amitava, “Effect of the sample size and the acceptance number,” in Fundamentals of Quality Control and Improvement, 4th ed., New Jersey: John Wiley & Sons, pp. 509–516, 2016. [Google Scholar]
2. A. W. Wortham and R. C. Baker, “Multiple deferred state sampling inspection,” International Journal of Production Research, vol. 14, no. 6, pp. 719–731, 1976. [Google Scholar]
3. K. Govindaraju and K. Subramani, “Selection of multiple deferred (dependent) state sampling plans for given acceptable quality level and limiting quality level,” Journal of Applied Statistics, vol. 20, no. 3, pp. 423–428, 1993. [Google Scholar]
4. S. Balamurali and C. H. Jun, “Multiple dependent state sampling plans for lot acceptance based on measurement data,” European Journal of Operational Research, vol. 180, no. 3, pp. 1221–1230, 2007. [Google Scholar]
5. S. Balamurali, P. Jeyadurga and M. Usha, “Designing of Bayesian multiple deferred state sampling plan based on gamma-poisson distribution,” American Journal of Mathematical and Management Sciences, vol. 35, no. 1, pp. 77–90, 2016. [Google Scholar]
6. M. Aslam, A. Nazir and C. H. Jun, “A new attribute control chart using multiple dependent state sampling,” Transactions of the Institute of Measurement and Control, vol. 37, no. 4, pp. 569–576, 2015. [Google Scholar]
7. W. Zhou, Q. Wan, Y. Zheng and Y. W. Zhou, “A joint-adaptive NP control chart with multiple dependent state sampling scheme,” Communications in Statistics - Theory and Methods, vol. 46, no. 14, pp. 6967–6979, 2017. [Google Scholar]
8. N. Khan and M. Aslam, “Design of an EWMA adaptive control chart using MDS sampling,” Journal of Statistics and Management Systems, vol. 22, no. 3, pp. 535–555, 2019. [Google Scholar]
9. N. Khan, L. Ahmad, G. S. Rao, M. Aslam and A. H. Al-Marshadi, “A new X-bar control chart for multiple dependent state sampling using neutrosophic exponentially weighted moving average statistics with application to monitoring road accidents and road injuries,” International Journal of Computational Intelligence, vol. 14, Article ID 182, pp. 1–11, 2021, https://doi.org/10.1007/s44196-021-00033-w. [Google Scholar]
10. N. Khan and M. Aslam, “Monitoring road accident and injury using indeterminacy based shewhart control chart using multiple dependent state repetitive sampling,” International Journal of Injury Control and Safety Promotion, 2022, https://doi.org/10.1080/17457300.2022.2029911. [Google Scholar]
11. R. G. Srinivasa, K. F. Arnold and K. P. Josephat, “Design of multiple dependent state sampling plan application for COVID-19 data using exponentiated Weibull distribution,” Complexity, vol. 2021, Article ID 2795078, pp. 1–10, 2021, https://doi.org/10.1155/2021/2795078. [Google Scholar]
12. M. Aslam, G. S. Rao and M. Albassam, “Sampling inspection plan to test daily COVID-19 cases using gamma distribution under indeterminacy based on multiple dependent scheme,” International Journal of Environmental Research and Public Health, vol. 19, Article ID 5308, no. 9, 2022, https://doi.org/10.3390/ijerph19095308. [Google Scholar]
13. C. -H. Jun, S. Balamurali and S. -H. Lee, “Variables sampling plans for Weibull distributed lifetimes under sudden death testing,” IEEE Transactions on Reliability, vol. 55, no. 1, pp. 53–58, 2006. [Google Scholar]
14. G. S. Rao, “A group acceptance sampling plans for lifetimes following a generalized exponential distribution,” Economic Quality Control, vol. 24, no. 1, pp. 75–85, 2009. [Google Scholar]
15. Y. L. Lio, T. -R. Tsai and S. -J. Wu, “Acceptance sampling plans from truncated life tests based on the birnbaum-saunders distribution for percentiles,” Communications in Statistics - Simulation and Computation, vol. 39, no. 1, pp. 119–136, 2009. [Google Scholar]
16. G. S. Rao, K. Rosaiah and C. R. Naidu, “Design of multiple-deferred state sampling plans for exponentiated half logistic distribution,” Cogent Mathematics & Statistics, vol. 7, no. 1, pp. 1–14, 2020. [Google Scholar]
17. S. Balamurali, P. Jeyadurga and M. Usha, “Designing of multiple deferred state sampling plan for generalized inverted exponential distribution,” Sequential Analysis, vol. 36, no. 1, pp. 76–86, 2017. [Google Scholar]
18. A. A. Nadi and B. S. Gildeh, “A group multiple dependent state sampling plan using truncated life test for the Weibull distribution,” Quality Engineering, vol. 31, no. 4, pp. 1–11, 2019. [Google Scholar]
19. M. Aslam, G. S. Rao and M. Albassam, “Time truncated life tests using the generalized multiple dependent state sampling plans for various life distributions,” in Statistical Quality Technologies. ICSA Book Series in Statistics, Cham, Switzerland: Springer, pp. 153–182, 2019. [Google Scholar]
20. M. Aslam, P. Jeyadurga, S. Balamurali, M. Azam and A. Al-Marshadi, “Economic determination of modified multiple dependent state sampling plan under some lifetime distributions,” Journal of Mathematics, vol. 2021, Article ID 7470196, pp. 1–13, 2021, https://doi.org/10.1155/2021/7470196. [Google Scholar]
21. A. I. Al-Omari, I. M. Almanjahie and O. Kravchuk, “Acceptance sampling plans with truncated life tests for the length-biased weighted lomax distribution,” Computers, Materials & Continua, vol. 67, no. 1, pp. 285–300, 2021. [Google Scholar]
22. H. Tripathi, A. I. Al-Omari, M. Saha and A. R. A. Alanzi, “Improved attribute chain sampling plan for darna distribution,” Computer Systems Science and Engineering, vol. 38, no. 3, pp. 381–392, 2021. [Google Scholar]
23. T. A. Abushal, A. S. Hassan, A. R. El-Saeed and S. G. Nassr, “Power inverted topp–Leone distribution in acceptance sampling plans,” Computers, Materials & Continua, vol. 67, no. 1, pp. 991–1011, 2021. [Google Scholar]
24. K. W. Fertig and N. R. Mann, “Life-test sampling plans for two-parameter Weibull populations,” Technometrics, vol. 22, no. 2, pp. 165–177, 1980. [Google Scholar]
25. M. Kim and B. J. Yum, “Reliability acceptance sampling plans for the Weibull distribution under accelerated type-I censoring,” Journal of Applied Statistics, vol. 36, no. 1, pp. 11–20, 2009. [Google Scholar]
26. M. Aslam and C. -H. Jun, “A group acceptance sampling plan for truncated life test having Weibull distribution,” Journal of Applied Statistics, vol. 36, no. 9, pp. 1021–1027, 2009. [Google Scholar]
27. S. Balamurali, P. Jeyadurga and M. Usha, “Optimal designing of a multiple deferred state sampling plan for Weibull distributed life time assuring mean life,” American Journal of Mathematical and Management Sciences, vol. 36, no. 2, pp. 150–161, 2017. [Google Scholar]
28. S. Balamurali, P. Jeyadurga and M. Usha, “Optimal designing of multiple deferred state sampling plan for assuring percentile life under Weibull distribution,” The International Journal of Advanced Manufacturing Technology, vol. 93, pp. 3095–3109, 2017. [Google Scholar]
29. M. Coorey and M. M. A. Ananda, “A generalization of the half-normal distribution with applications to lifetime data,” Communications in Statistics - Theory and Methods, vol. 37, no. 9, pp. 1323–1337, 2008. [Google Scholar]
30. R. Kenett and S. Zacks, in Modern industrial statistics: The design and control of quality and reliability, Pacific Grove: Duxbury Press, 1998. [Google Scholar]
 | This work is licensed under a Creative Commons Attribution 4.0 International License, which permits unrestricted use, distribution, and reproduction in any medium, provided the original work is properly cited. |