| Computers, Materials & Continua DOI:10.32604/cmc.2022.031091 | |
| Article |
DISTINÏCT: Data poISoning atTacks dectectIon usiNg optÏmized jaCcard disTance
1Department of IT Convergence Engineering, Gachon University, Seongnam-si, 13120, Korea
2Department of Computer Engineering, Gachon University, Seongnam-si, 13120, Korea
*Corresponding Author: Seong Oun Hwang. Email: sohwang@gachon.ac.kr
Received: 10 April 2022; Accepted: 29 May 2022
Abstract: Machine Learning (ML) systems often involve a re-training process to make better predictions and classifications. This re-training process creates a loophole and poses a security threat for ML systems. Adversaries leverage this loophole and design data poisoning attacks against ML systems. Data poisoning attacks are a type of attack in which an adversary manipulates the training dataset to degrade the ML system’s performance. Data poisoning attacks are challenging to detect, and even more difficult to respond to, particularly in the Internet of Things (IoT) environment. To address this problem, we proposed DISTINÏCT, the first proactive data poisoning attack detection framework using distance measures. We found that Jaccard Distance (JD) can be used in the DISTINÏCT (among other distance measures) and we finally improved the JD to attain an Optimized JD (OJD) with lower time and space complexity. Our security analysis shows that the DISTINÏCT is secure against data poisoning attacks by considering key features of adversarial attacks. We conclude that the proposed OJD-based DISTINÏCT is effective and efficient against data poisoning attacks where in-time detection is critical for IoT applications with large volumes of streaming data.
Keywords: Data poisoning attacks; detection framework; jaccard distance (JD); optimized jaccard distance (OJD); security analysis
As one the modern technologies, ML is also vulnerable against various threats [1]. Thus, there are numerous ways in which an adversary can successfully attack the ML-based system. These attacks are executed in different phases of ML by using different skill sets and levels of knowledge, and they depend mainly on the adversary’s goal.
In this study, we focused on the data poisoning attacks, one of the most severe attacks against ML. Defense against a data poisoning attack is challenging for several reasons. First, this type of attack is easy to execute because high-computational devices are not needed by the adversary due to the attack’s simplicity. Secondly, attackers can carry out such attacks even with a very little information about the data. Moreover, an adversary can easily fool authenticated parties by making subtle statistical changes in the data points. These subtle changes are unidentifiable by the human eye alone and are hard to detect when there is a lot of incoming data at any given time. Lastly, these minor manipulations in data points by an adversary can result in significant damage to ML systems, especially in mission-critical systems.
To address this problem of data poisoning attacks, we proposed DISTINÏCT, the first proactive detection framework based on an optimized distance measure. The main contributions of this study are summarized as follows.
1. We designed DISTINÏCT, the first proactive framework which uses a distance measure for the detection of data poisoning attacks that target ML systems. The proposed framework can effectively secure the system against various key features that are common in data poisoning, including the adversary’s goal, capabilities and knowledge. Compared to the existing state-of-the-art solutions that employ ML to detect data poisoning, our proposed detection framework boasts various features, like a) being independent of training, b) being independent of parameter tuning and additional information, and c) being secure and robust against various adversarial attacks.
2. Our study shows that JD is a promising candidate in the DISTINÏCT to effectively detect a data poisoning attack. To speed up real-time detection of poisoned datasets, we proposed an OJD, which is significantly more efficient and effective than JD and consumes significantly less computation time and space. This contribution is significant in the IoT environment, wherein fast computation of large volumes of streaming data is critical for detecting a data poisoning attack in time.
2 Key Features of Adversarial Attacks
For ML, the following key aspects [2–11] are generally considered by the security analysts to measure the intensity of the attack or to identify the type of attack. Meanwhile, on the other hand, an adversary utilizes them to devise an attack against a ML system.
This aspect determines the aim of an adversary in terms of the level of destruction or the purpose of an attack. This feature is further divided into following three categories.
The second key aspect to attacks is the extent of the attacker’s capabilities. These capabilities include the ability to manipulate data points used by ML systems either for training or testing. To evaluate this aspect, capabilities are divided into following two broad classes.
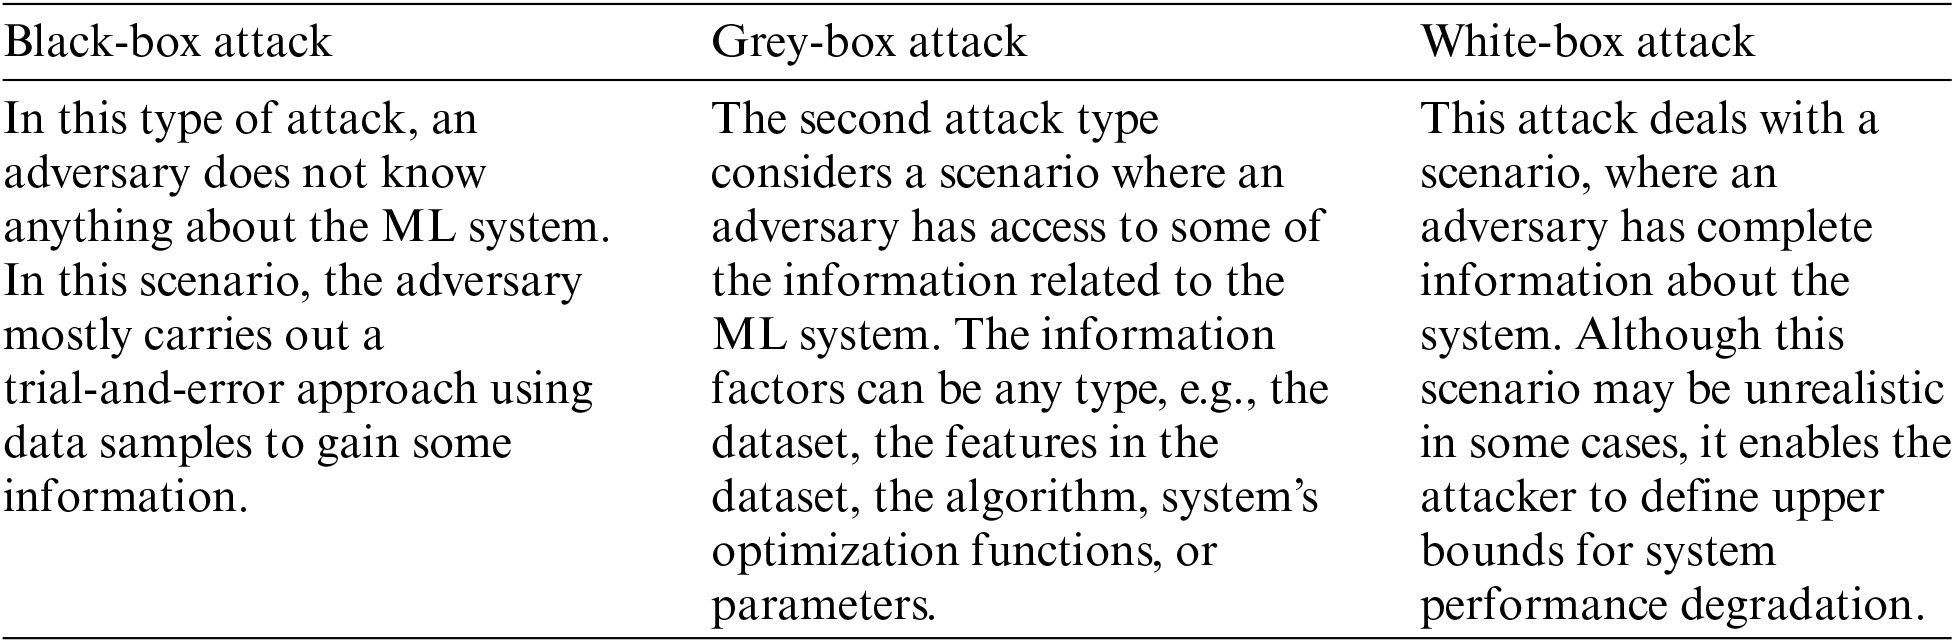
This key feature considers the level of information an adversary already has about the ML system. Usually, the information related to the ML system includes features of the dataset, the ML algorithm, optimization functions, and the system parameters. Knowledge of different parameters in different combinations leads to different types of attack. These attacks are of the following types.


The ML process usually consists of six major different phases, namely data collection, training/testing datasets, feature extraction, learning algorithms, prediction system(s), and re-training. Each phase is susceptible to different attack [2–6]. However, the focus of this study is on the data poisoning attack, one of the many potential attacks.
A data poisoning attack is a causative attack in which an adversary modifies the statistical characteristics of the dataset. Thus, this attack breaks the integrity and availability of an ML system. There are cases where an ML system needs re-training, e.g., a spam email filtering system retrains a model on some new features. The adversary leverages the re-training phase and manipulates the dataset [4,12].
Several studies have shown that an adversary can easily perform data poisoning attacks, even with small perturbations [13]. Therefore, this problem posed a need for a solution which is capable to detect different types of data poisoning attacks effectively and proactively in the ML systems. The literature has also shown that different researchers have proposed various detection solutions against data poisoning attacks.
In [8], the authors have presented a proactive and iterative visual analytics-based framework for exploring adversarial attacks against ML systems. Defense mechanisms against data poisoning attacks include an evaluation of poisoned samples’ positions within the dataset through a multiple spectral clustering aggregation method [9]. In [14], the authors have leveraged uncertainty estimates to detect backdoor data poisoning attacks. In [15], the authors have employed an adaptive combination of classifiers at different learning rates to mitigate data poisoning attacks. To address data poisoning concerns in ML-based IoT systems, various techniques including provenance-based detection and filtration of poisoned data have also been proposed in [16,17].
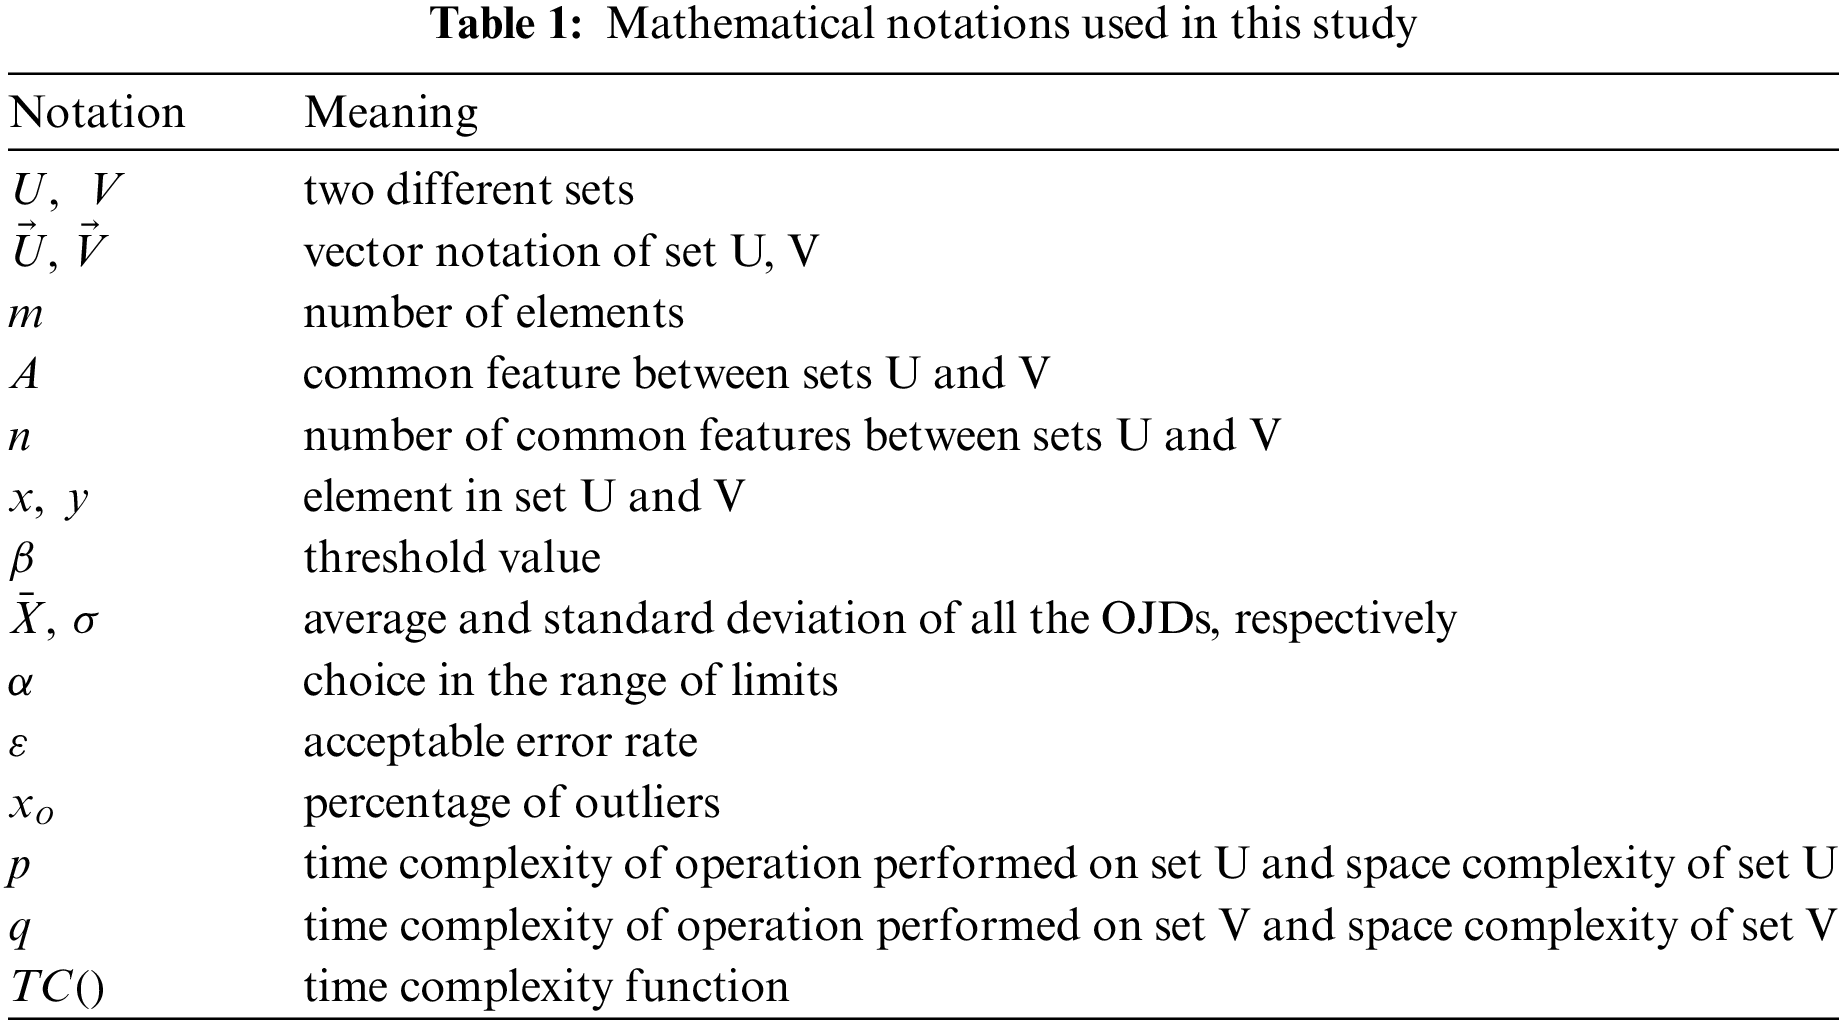
Since the data poisoning is a type of attack that either distorts or modifies the statistical characteristics of the dataset(s). As a result, these perturbations affect the ML system and its accuracy. Therefore, we have proposed DISTINÏCT, the first proactive detection framework based on a distance measure to detect these attacks. The distance measure we employ is the OJD, an optimized variant of JD. Due to JD’s simplicity, it is preferred for various applications [18]. Therefore, in this baseline study, we have also considered JD because JD requires no additional parameter tuning and training. The mathematical notations we have used this study are mentioned in Tab. 1.
JD is a statistical measure which is used to compute and identify the dissimilarity between two sets of data. JD determines dissimilarity for any type of data (i.e., categorical, numeric, binary, etc.). JD is calculated by taking the complement of the Jaccard Coefficient (JC), also known as the Jaccard Index. The value of JD falls within a range of 0%–100%. The preliminary notations for this study are discussed as follows.
Given two sets of data U and V, we represented the JC as the intersection of the features’ values in U and V divided by the union of the features’ values in the two datasets. From a computational standpoint, most work comes from computing the intersection of U and V as
This is because, to compute the union, the size of the features’ values is taken and subtracted the intersection to avoid counting the same features’ values twice.
To compute JD, the complement of the JC is taken, i.e., subtract the JC from 1, as follows:
In this study, we also proposed an OJD for effective proactive detection of data poisoning attacks against ML.
Assume U is an initial trusted dataset, which is always fixed and available, and V is a new incoming dataset. Both U and V are vectors at one time. Suppose U and V consist of a single, but common, feature with m items, i.e.,
Then, the intersection between U and V is computed as
Since U and V have multiple (n) common features (A) with (m) items in each feature, i.e.,
Therefore, the intersection between U and V with multiple common features is computed as
To further compute the OJC for each feature, we then divided each feature’s intersection by m, i.e.,
Our technique of dividing the features’ intersections by m significantly decreases the space and computation cost as compared to JD. Thus, real-time proactive detection of poisoned datasets is possible, i.e., before the data being fed to the ML systems. Hence, with this technique, OJD enabled an effective proactive detection of poisoned datasets, especially, for mission critical systems where in-time detection is required.
Finally, to compute the OJD for each feature, the difference of the OJC from 1 is computed. Mathematically, we can write it as
To define the range of the OJC, we considered both the minimum and maximum.
• Minimum: When there is(are) no common feature(s) or values within feature(s) between the two datasets, i.e.,
• Maximum: When the two datasets are identical, i.e.,
Hence, the respective range lies between 0 and 1, as follows:
Since the OJD is simply a complement of the OJC, it also has the same range as that of OJC:
Since our proposed OJD is an extended and optimized variant of JD. Therefore, our OJD also holds all the statistical properties of a distance measure. Moreover, like JD, our OJD also computes dissimilarity for any type of data.
We proposed DISTINÏCT, the first proactive detection framework which detects poisoned datasets destined for ML systems under data poisoning attacks. Since, the DISTINÏCT employs distance measure (OJD), therefore inherently the DISTINÏCT is also capable of detecting different types of poisoned data. The DISTINÏCT consists of following four main phases.
5.1 Phase 1: Collection of Dataset(s)
To initiate the detection process, this first step involved the collection and formation of a pool of datasets. The DISTINÏCT set the datasets into two main categories.
This is a dataset that is initially used to train the ML system and to generate the initial classifications/predictions. It is always assumed that the initial dataset is authenticated and authorized, i.e., it is provided by an authenticated (trusted) party and has not been exposed to external sources, i.e., no forgery has been committed.
5.1.2 Dataset(s) from N Sources
This category includes all the datasets that are collected from various sources. These datasets are referred to as new, incoming datasets from N different sources that include, but are not limited to, sensors, mobile devices, tablets, etc. For this category, we assumed that these are untrusted datasets that may or may not have come from trusted sources, i.e., the sources may or may not be authorized. Also, these datasets may or may not have been forged, i.e., they may or may not be authentic.
5.2 Phase 2: Feature Extraction and Selection
After obtaining the desired pool of datasets (i.e., a trusted dataset and untrusted datasets), in this phase, we filtered and selected the most relevant features from the datasets. There are few features, among all the features within a dataset, are highly correlated with the target class, i.e., those features contribute or affect the target variable the most. Hence, the selection of those features played a vital role.
Therefore, we considered bi-directional feature elimination, also known as Stepwise Selection [19], which extracted and selected the most relevant features. With the most relevant feature extraction and selection process, the computation complexity in later phases is reduced. Consequently, this phase resulted in a processed and reduced (yet relevant) dataset, including the trusted dataset.
We first took the trusted dataset and applied the Stepwise Selection algorithm on it. The algorithm returned the most significant features extracted from the trusted dataset. Thereafter, we extracted the identical significant features from the untrusted datasets as well. If any of the untrusted datasets do not have all the significant features identical to that of the trusted dataset, then that untrusted dataset is directly discarded either as malicious dataset or as a dataset from any device that is malfunctioned.
This phase returned the processed and reduced datasets, including both trusted and untrusted datasets consist of the most significant features. To select the optimal number of significant features, the Stepwise Selection algorithm is executed for different range of values. To visualize and make final decision about the optimal number of significant features, we further plotted the Stepwise Selection algorithm with various range of values.
In this phase, using the formula in Eq. (1), we computed the OJD for each processed untrusted dataset against the processed trusted dataset. To compute the OJD, we first considered the application area. Different applications (specifically, different scenarios) employ different categories of datasets. Therefore, based on our study of various applications, we categorized the datasets such that they fall into one of two types of OJD computation process.
5.3.1 Case I: Single Feature (SF)-Based Computation
For a dataset comprised of only one feature, we simply computed the OJD of each untrusted dataset against the trusted dataset.
5.3.2 Case II: Multiple Features (MF)-Based Computation
In this category, there are, or can be, datasets which consist of multiple features. In this case, we computed the OJD for each feature. Furthermore, those datasets which are examined through the selection process and discarded (based on previous feature’s range), i.e., are not considered for next feature. Our approach of discarding datasets based on previous features, reduced the computation costs for later steps (e.g., computing OJDs, defining appropriate thresholds).
In this study, the threshold is a magnitude or a value which is used to measure and limit the acceptable level of data dissimilarity between two set. In other words, the threshold is computed to measure the acceptable level of dissimilarity between the trusted dataset and a new incoming dataset. To define an appropriate threshold value,
We leveraged the control charts to determine the percentage of variation between trusted data and new incoming datasets through a Central Limit (CL), an Upper Control Limit (UCL), and a Lower Control Limit (LCL). Since control charts facilitate the choice of limits (i.e.,
5.4 Phase 4: Selection of New Trusted Datasets
Finally, this phase considered the computed OJDs resulted from Phase 3 and selected the new trusted datasets. To select a new trusted dataset, we developed the following hypotheses:
And,
Our hypothesis stated that if the calculated OJD of an untrusted dataset is less than or equal to set threshold value β, then the respective new incoming dataset and the trusted dataset are similar. Otherwise, the untrusted dataset is dissimilar, i.e., the new, incoming dataset is beyond the acceptable level of dissimilarity. In other words, untrusted datasets that are unable to meet the hypotheses criteria are discarded as malicious or forged datasets. Whereas untrusted datasets that are either less than or equal to the defined threshold value are considered as trusted datasets.
Since we categorized datasets based on SF and MF to select a new and trusted dataset. Therefore, we also defined two types of selection processes based on SF and MF datasets.
1. Independent Selection: This process simply compared the threshold value(s) with the computed OJDs of SF-based datasets.
2. Dependent Selection: This process compared the threshold value(s) with the computed OJDs of MF-based datasets, feature by feature. If the OJD of any feature in a dataset exceeded the defined threshold value of the respective feature and is discarded; then the entire dataset is discarded (i.e., the dataset is not compared for the rest of the features).
If all the values of computed OJDs for untrusted datasets are within the defined threshold limit, then those untrusted datasets are considered as trusted datasets. Otherwise, all those untrusted dataset(s) are discarded and are not further used for re-training the ML system.
Furthermore, depending on the application or requirements, among all the newly qualify trusted datasets the one with the lowest OJD is selected as the final, new trusted dataset. This final newly selected trusted dataset is also used to re-train the model to make further predictions or classifications.
Acceptable Error Rate
There are many applications and scenarios where datasets have outliers for various reasons (e.g., enhanced values of features or noise) other than a malicious data injection. Therefore, to take such conditions into account, DISTINÏCT allows up to ɛ outliers as an acceptable error rate. Hence, ɛ outliers can enhance ML systems without causing misclassifications when passed to the system for further predictions or classifications, because ɛ instances in the entire dataset are not enough to cause misclassifications. In other words, if
To demonstrate the application and to evaluate the efficiency of DISTINÏCT, we considered an application of pollution sensors. Pollution sensors are designed specifically to detect and transmit different environmental parameters. In our assumed scenario, we considered ozone, particulate matter, carbon monoxide, sulfur dioxide, and nitrogen dioxide as different environmental parameters.
To demonstrate the applicability of the DISTINÏCT, we considered particularly a smart city scenario. In this scenario, we assumed seven different pollution sensors and a broadcasting station, all of them are installed and set up in different locations. These seven pollution sensors measured the values of five different features, i.e., ozone, particulate matter, carbon monoxide, sulfur dioxide, and nitrogen dioxide at a time. After measuring the values, the pollution sensors converted those values into digital units and transmitted those digitized readings to the broadcasting station.
As shown in Fig. 1, in the first step, the broadcasting station received the pollution readings from all seven sensors. Among all the seven sensors, G is a normal sensor. Whereas A, B, and C are the malfunctioned sensors. While D is a normal sensor, but it is affected with noise. Further, E is also a normal sensor, but it has a compromised communication channel. At last F, it is a physically hijacked sensor. After the pollution readings are collected, in the second step, the broadcasting station initiated the DISTINÏCT and utilized the initial trusted dataset as a basis for computing the OJDs. The DISTINÏCT then resulted in a new trusted dataset. In the next step, the broadcasting station applied the ML system to the new trusted dataset and generated new pollution predictions. Finally, in the last step, the station broadcasted the pollution forecast to the citizens.
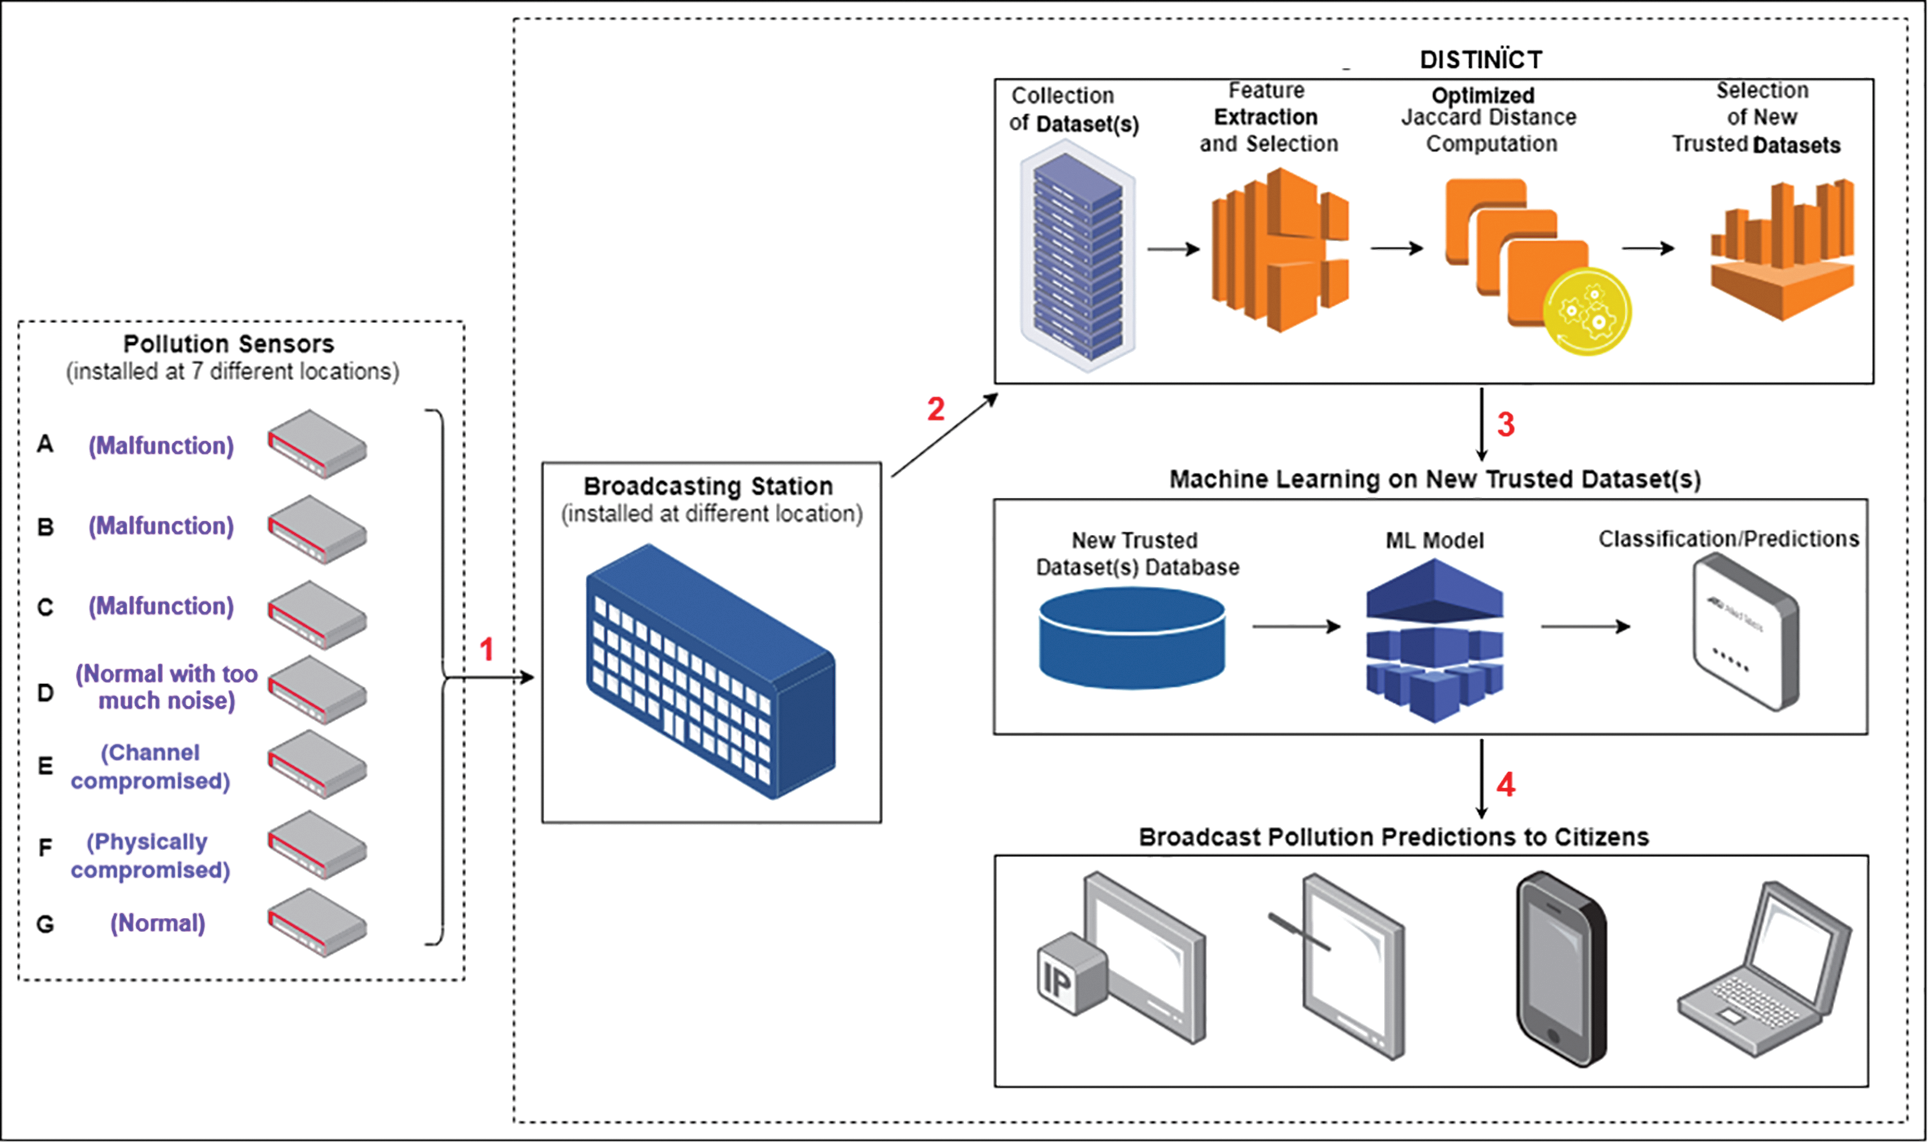
Figure 1: A detailed overview of the smart city scenario
We developed the DISTINÏCT using Python version 3.5.4 under the LINUX Ubuntu 16.04 environment. For significant-features selection, random selection of data points, and introducing normal distribution-based random noise, we employed Python libraries including Pandas, NumPy, mlxtend.feature_selection, SequentialFeatureSelector(), sklearn.linear_model, random() and np.random.randint().
To perform experiment and evaluate the DISTINÏCT, we considered datasets named Pollution Measurements. CityPulse [20] designed and generated these datasets as a real-time IoT stream processing and large-scale data analytics for smart city applications. The founders of the CityPulse project designed pollution sensor datasets for different locations during the period from August to October 2014. Each dataset has around 17,000 data points. CityPulse simulated a pollution sensor for every single traffic sensor at each location. They considered five different features (ozone, particulate matter, carbon monoxide, sulfur dioxide, and nitrogen dioxide) and simulated these feature values listed in [21,22]. Their datasets have data points simulated for every five-minute interval for 24 h.
Furthermore, to simulate and test the DISTINÏCT against poisoned datasets, we divided the respective pollution sensor datasets into 24 subsets each consists of 11 data points recorded at five-minute intervals. To introduce noise and malicious data points in the untrusted dataset, we generated a random (but normal distribution-based) integer outside the range of the trusted dataset’s values. We then randomly selected a data point from an untrusted dataset and replaced it with a newly generated random data point. To avoid overwriting the same data point, we kept a record of the randomly selected indexes where new data points were inserted. In this way, we inserted noise and malicious data points into the untrusted datasets without increasing the number of data points in them.
For the given pollution sensor datasets, we selected three most significant features (among all five features), i.e., ozone, particulate matter, and carbon monoxide. Moreover, for the assumed scenario, the value taken for ɛ is 10% [23]. In addition to this, the time we have chosen for data analysis and selection is the very first hour of the recorded readings in the datasets, i.e., from 00:00 to 01:00.
6.4 Optimization Analysis of OJD
To demonstrate the effectiveness of the DISTINÏCT with the proposed OJD, we have performed a comparative study. We have evaluated OJD against some of the variants of the JD along with the original JD. Some of the existing JD variants we considered for our comparative study are as following:
• In [24], the authors have proposed Average Jaccard Distance (
• In [25], the authors have proposed
• In [26], the authors have proposed Combined Triangle and Jaccard Distances (CTJD):
• In [27], the authors have proposed the modified Jaccard Distance (
For a fair evaluation of our proposed OJD against the original JD and some of the other existing variants of JD, we assumed the same underlying situations and conditions throughout all our experiments. To determine the thresholds for ozone, particulate matter and carbon monoxide, we have computed the CL along with the UCL and LCL with a
As shown in Tab. 2, from the first iteration, the dataset of sensor G is selected as a new trusted dataset for the next iteration, i.e., from 01:00 to 02:00. Hence, the process of selecting a new trusted dataset is kept on iterating in a similar way as demonstrated for the first iteration. Moreover, we have assumed the values of

Through our thorough performance evaluation and experimentation, we have shown that the JD, its selected variants and our proposed OJD all have the same detection accuracies for the poisoned. Therefore, in the following, we have further analyzed our proposed OJD against JD and some of the variants of JD in terms of the time and space complexity as shown in Tab. 3.

In our proposed OJD, for
To effectively detect poisoned datasets, it is important to have equal lengths of the datasets. Otherwise, in the case of unequal lengths, the outliers or malicious data points can be missed (undetected). Thus, this can lead to incorrect selection of dataset (i.e., poisoned dataset can be selected). Therefore, in the experimental analysis, we have considered the same condition (i.e., equal length) for the JD and its variant. Due to which, the JD and its variant have been able to detect poisoned datasets, otherwise they have not been able to detect. Moreover, in the case of unequal length, the data can be divided into equal lengths like our data preparation process as shown in Section 6.3.
To sum up, our experimental and complexity analysis showed that the DISTINÏCT detected and filtered the poisoned datasets effectively and efficiently, especially when it is used with OJD. It is also shown that the DISTINÏCT detected the poisoned datasets consists of outliers greater than 10%.
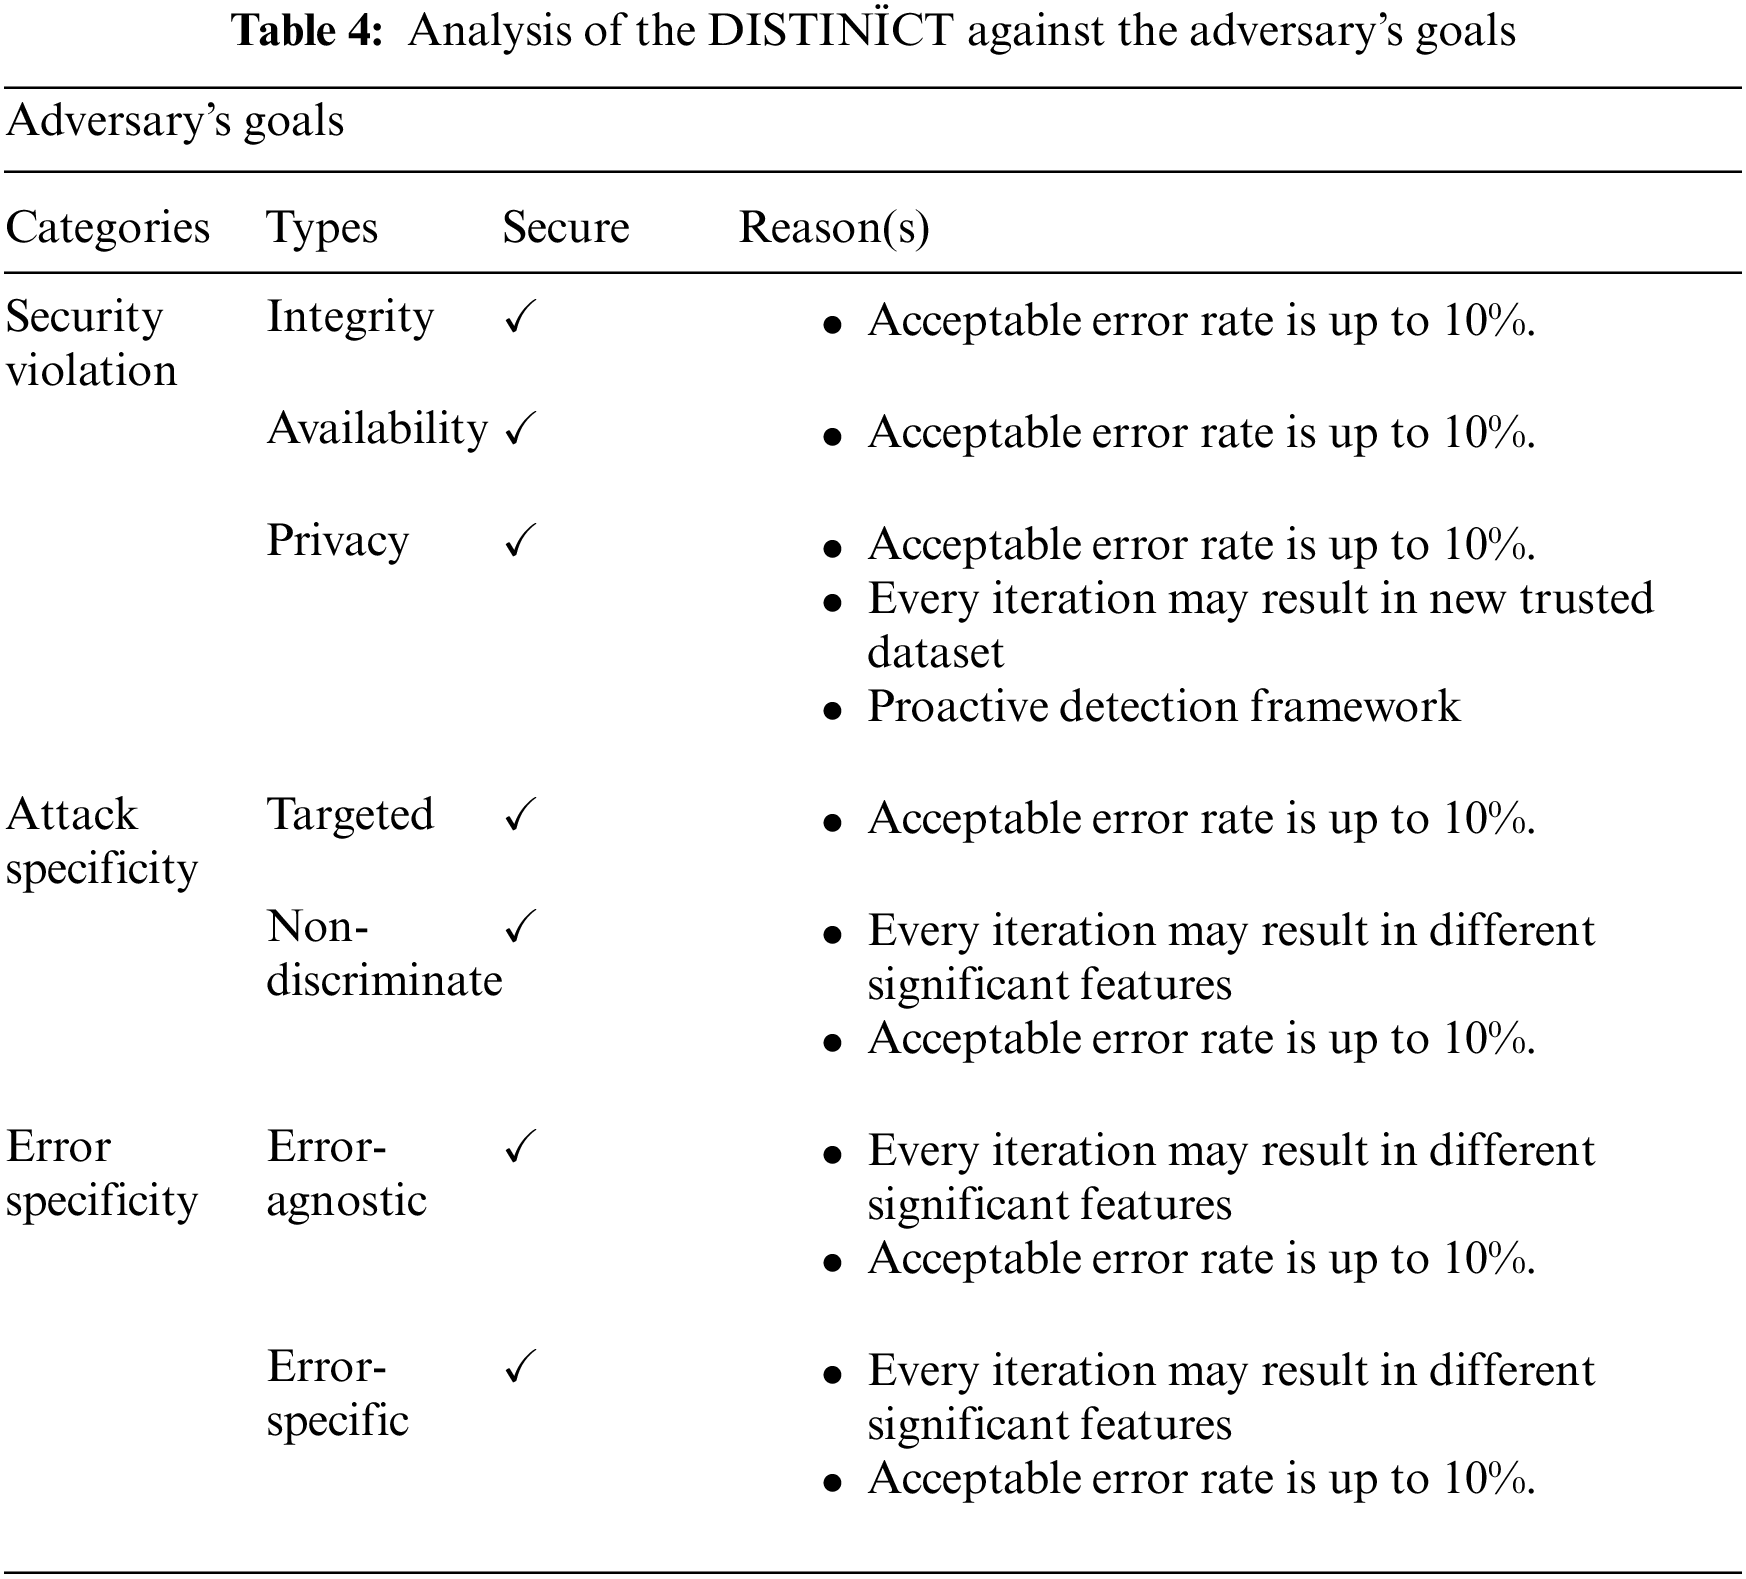
Since the DISTINÏCT is designed for the detection of poisoned datasets in ML systems. Therefore, we have analyzed the DISTINÏCT against the key features mentioned in Section 2.
6.6 Comparison with Existing Data Poisoning Attacks Detection Solutions
We further analyzed and compared the DISTINÏCT against some of the other existing state-of-the-art detection solutions. We compared the DISTINÏCT based on six key aspects, as shown in Tab. 7.
First and foremost, the DISTINÏCT is independent of any ML or deep learning models for detection purposes. Therefore, the DISTINÏCT is independent of any training or re-training phase, and does not need any training samples, unlike of [8,9] and [14–17]. Moreover, the DISTINÏCT is completely secure against any adversarial attack, as shown in Tabs. 4, 5 and 6. Moreover, the DISTINÏCT considers datasets to compute OJD and make selection of datasets based on the thresholds of the given datasets. Thus, no prior or subsequent parameter tuning is required. Furthermore, the DISTINÏCT verifies the poisoned datasets based on computed OJD and thresholds. Hence, the DISTINÏCT does not require any additional information (e.g., provenance information) or training, unlike of [14,16] and [17]. Therefore, we can conclude that the DISTINÏCT is more secure and robust against data poisoning attacks, compared to some of the existing data poisoning attack detection solutions.


7 Conclusion and Future Directions
A data poisoning attack is very challenging to detect because it is easy to mount and hard to respond to. To address this problem, we proposed the DISTINÏCT, the first proactive detection framework based on a distance measure to detect data poisoning attacks against ML systems. To provide a concrete realization of the DISTINÏCT, we proposed our OJD and proved the security of the DISTINÏCT by considering key features of such attacks, which have rarely been studied in the past. The proposed OJD is significantly faster than variants of JD and consumes less space. These contributions make the DISTINÏCT a prominent candidate in detecting data poisoning in IoT environments where data are streaming at high speed, wherein detecting data poisoning in time is critical.
In future work, we plan to investigate other distance measures to enhance the DISTINÏCT. Moreover, we will analyze the DISTINÏCT for different types of data. We will also attempt to formulate an enhanced form of distance measures with hyper-parameters to improve detection performance.
Funding Statement: This work was supported by a National Research Foundation of Korea (NRF) grant funded by the Korea Government (MSIT) under Grant 2020R1A2B5B01002145.
Conflicts of Interest: The authors declare that they have no conflicts of interest to report regarding the present study.
References
1. K. R. Varshney, “Trustworhy machine learning and artificial intelligence,” XRDS: Crossroads, The ACM Magazine for Students, vol. 25, no. 3, pp. 26–29, 2019. [Google Scholar]
2. K. Meenakshi and G. Maragatham. “A review on security attacks and protective strategies of machine learning,” in Int. Conf. on Emerging Current Trends in Computing and Expert Technology, COMET 2019, Proc.: Lecture Notes on Data Engineering and Communications Technologies, Cham, pp. 1076–108, 2019. [Google Scholar]
3. P. Nikolaos, E. Panaousis, T. Giannetsos, E. Anastasiadis and G. Loukas, “A taxonomy and survey of attacks against machine learning,” Computer Science Review, vol. 34, pp. 100199, 2019. [Google Scholar]
4. X. Wang, J. Li, X. Kuang, Y. A. Ta and J. Li, “The security of machine learning in an adversarial setting: A survey,” Journal of Parallel and Distributed Computing, vol. 130, pp. 12–23, 2019. [Google Scholar]
5. L. Muñoz-González and E. C. Lupu, “The Security of machine learning systems,” In: Sikos L. (Eds.) AI in Cybersecurity. Intelligent Systems Reference Library, vol. 151, Cham: Springer, pp. 47–79, 2019, https://doi.org/10.1007/978-3-319-98842-9_3. [Google Scholar]
6. M. Al-Rubaie and J. M. Chang, “Privacy-preserving machine learning: Threats and solutions,” IEEE Security & Privacy, vol. 17, no. 2, pp. 49–58, 2019. [Google Scholar]
7. W. Jiang, H. Li, S. Liu, Y. Ren and M. He, “A flexible poisoning attack against machine learning,” in ICC 2019–2019 IEEE Int. Conf. on Communications (ICC), Shanghai, China, pp. 1–6, 2019. [Google Scholar]
8. Y. Ma, T. Xie, J. Li and R. Maciejewski, “Explaining vulnerabilities to adversarial machine learning through visual analytics,” IEEE Transactions on Visualization and Computer Graphics, vol. 26, no. 1, pp. 1075–1085, 2019. [Google Scholar]
9. W. Zhao, P. Li, C. Zhu, D. Liu and X. Liu, “Defense against poisoning attack via evaluating training samples using multiple spectral clustering aggregation method,” Computers, Materials and Continua, vol. 59, no. 3, pp. 817–832, 2019. [Google Scholar]
10. R. Kannan, S. S. Manohar and M. S. Kumaran, “IoT-based condition monitoring and fault detection for induction motor,” in Proc. of 2nd Int. Conf. on Communication, Computing and Networking, Proc.: Lecture Notes in Networks and Systems, Singapore, pp. 205–215, 2019. [Google Scholar]
11. L. Pajola, L. Pasa and M. Conti, “Threat is in the air: Machine learning for wireless network applications,” in Proc. of the ACM Workshop on Wireless Security and Machine Learning, WiseML 2019, Miami FL, USA, pp. 16–21, 2019. [Google Scholar]
12. M. Goldblum, D. Tsipras, C. Xie, X. Chen, A. Schwarzschild et al., “Dataset security for machine learning: Data poisoning, backdoor attacks, and defenses,” IEEE Transactions on Pattern Analysis and Machine Intelligence (Early Access), pp. 1--1, 2022. https://10.1109/TPAMI.2022.3162397. [Google Scholar]
13. E. Alsuwat, H. Alsuwat, M. Valtorta and C. Farkas, “Adversarial data poisoning attacks against the PC learning algorithm,” International Journal of General Systems, vol. 49, no. 1, pp. 3–31, 2020. [Google Scholar]
14. M. Subedar, N. Ahuja, R. Krishnan, I. J. Ndiour and O. Tickoo, “Deep probabilistic models to detect data poisoning attacks,” arXiv preprint arXiv:1912.01206, 2019. [Google Scholar]
15. G. Collinge, E. Lupu and L. Munoz Gonzalez, “Defending against poisoning attacks in online learning settings,” in Proc. of the 27th European Symp. on Artificial Neural Networks, Computational Intelligence and Machine Learning, ESANN 2019, Bruges, Belgium, pp. 43–48, 2019. [Google Scholar]
16. N. Baracaldo, B. Chen, H. Ludwig and J. A. Safavi, “Mitigating poisoning attacks on machine learning models: A data provenance based approach,” in Proc. of the 10th ACM Workshop on Artificial Intelligence and Security, AISec’17, Dallas Texas USA, pp. 103–110, 2017. [Google Scholar]
17. N. Baracaldo, B. Chen, H. Ludwig, A. Safavi and R. Zhang, “Detecting poisoning attacks on machine learning in IoT environments,” in 2018 IEEE Int. Congress on Internet of Things, ICIOT 2018, San Francisco, CA, USA, pp. 57–64, 2018. [Google Scholar]
18. S. Bag, S. K. Kumar and M. K. Tiwari, “An efficient recommendation generation using relevant Jaccard similarity,” Information Sciences, vol. 483, pp. 53–64, 2019. [Google Scholar]
19. M. A. Efroymson, “Multiple regression analysis,” Mathematical Methods for Digital Computers, vol. 1, pp. 191–203, 1960. [Google Scholar]
20. E. U. CityPulse, “FP7 project,” Accessed in December 2017. [Online]. Available: http://www.ict-citypulse.eu. [Google Scholar]
21. Wikipedia, “Air quality index,” 2019. [Online]. Available: https://en.wikipedia.org/wiki/Air$\delimiter"026E30F$_quality$\delimiter"026E30F$_index. [Google Scholar]
22. “Department for environment food & rural affairs,” 2019. [Online]. Available: https://uk-air.defra.gov.uk/air-pollution/daqi. [Google Scholar]
23. R. Williams, R. Duvall, V. Kilaru, G. Hagler, L. Hassinger et al., “Deliberating performance targets workshop: Potential paths for emerging PM2. 5 and O3 air sensor progress,” Atmospheric Environment, vol. 2, pp. 100031, 2019. [Google Scholar]
24. D. Greene, D. O’Callaghan and P. Cunningham, “How many topics? stability analysis for topic models,” in Joint European Conf. on Machine Learning and Knowledge Discovery in Databases, ECML PKDD 2014, Proc.: Lecture Notes in Computer Science, Berlin, Heidelberg, pp. 498–513, 2014. [Google Scholar]
25. S. S. Jani, J. M. Lamb, B. M. White, M. Dahlbom, C. G. Robinson et al., “Assessing margin expansions of internal target volumes in 3D and 4D PET: A phantom study,” Annals of Nuclear Medicine, vol. 29, no. 1, pp. 100–109, 2015. [Google Scholar]
26. H. Yan and Y. Tang, “Collaborative filtering based on Gaussian mixture model and improved jaccard similarity,” IEEE Access, vol. 7, pp. 118690–118701, 2019. [Google Scholar]
27. J. Kalra, D. Batra, N. Diwan and G. Bagler, “Nutritional profile estimation in cooking recipes,” in 2020 IEEE 36th Int. Conf. on Data Engineering Workshops, ICDEW 2020, Dallas, TX, USA, pp. 82–87, 2020. [Google Scholar]
 | This work is licensed under a Creative Commons Attribution 4.0 International License, which permits unrestricted use, distribution, and reproduction in any medium, provided the original work is properly cited. |