| Computers, Materials & Continua DOI:10.32604/cmc.2022.031156 | |
| Article |
Human Emotions Classification Using EEG via Audiovisual Stimuli and AI
1Radiological Sciences Department, College of Applied Medical Sciences, Najran University, Najran, Saudi Arabia
2Faculty of Computer Science and Engineering, GIK Institute of Engineering Sciences and Technology, Topi, 23460, Pakistan
3Department of Electrical Engineering, University of Engineering and Technology, Mardan, 23200, Pakistan
4Department of Software Engineering, University of Malakand, Dir Lower, Pakistan
5Department of Computer Science and Information Systems, College of Engineering, Najran University Saudi Arabia, Najran, 61441, Saudi Arabia
6Electrical Engineering Department, College of Engineering, Najran University Saudi Arabia, Najran, 61441, Saudi Arabia
7Computer Science Department, College of Computer Science and Information Systems, Najran University, Najran, Saudi Arabia
8Anatomy Department, Medicine College, Najran University, Najran, Saudi Arabia
*Corresponding Author: Fazal Muhammad. Email: fazal.muhammad@uetmardan.edu.pk
Received: 11 April 2022; Accepted: 29 May 2022
Abstract: Electroencephalogram (EEG) is a medical imaging technology that can measure the electrical activity of the scalp produced by the brain, measured and recorded chronologically the surface of the scalp from the brain. The recorded signals from the brain are rich with useful information. The inference of this useful information is a challenging task. This paper aims to process the EEG signals for the recognition of human emotions specifically happiness, anger, fear, sadness, and surprise in response to audiovisual stimuli. The EEG signals are recorded by placing neurosky mindwave headset on the subject’s scalp, in response to audiovisual stimuli for the mentioned emotions. Using a bandpass filter with a bandwidth of 1–100 Hz, recorded raw EEG signals are preprocessed. The preprocessed signals then further analyzed and twelve selected features in different domains are extracted. The Random forest (RF) and multilayer perceptron (MLP) algorithms are then used for the classification of the emotions through extracted features. The proposed audiovisual stimuli based EEG emotion classification system shows an average classification accuracy of 80% and 88% using MLP and RF classifiers respectively on hybrid features for experimental signals of different subjects. The proposed model outperforms in terms of cost and accuracy.
Keywords: Electroencephalography; emotion; classification; signal processing; multilayer perceptron; random forest
In recent decades, human emotions related research studies are given more attention in neuroscience and affective Computing [1]. In our daily life emotions plays a crucial role, we as human can comprehend the emotions of different people yet it is truly inconceivable for computers to do likewise. In earlier decades researchers have investigated emotion detection through text [2], speech [3], facial expressions and gestures [4–7]. However, the disadvantages of using these techniques are that if someone conceals their feelings [8], the results are vague and this turns out to be a question mark on their reliability. Currently, electroencephalography (EEG) signals are the promising way to implement communication between a person and machine. Different studies have been conducted in the literature, so far, on emotion classification based on EEG signals, which yields significant growth in terms of accuracy [9,10]. The main difference lies in terms of signal acquisition, noise reduction, features extraction and classification techniques that are used. In [11,12], the authors investigate processing algorithms and pattern classification of EEG signals respectively which produce better results. In [13] the authors have used different physiological signals along with mobile data to detect human emotion. Results show better detection however, the labeling of the emotion is not done using audio or visual feedback. In [14], the authors describe importance of human emotions recognition. For this purpose, the authors consider pictures to predict human emotions recognition using traditional EEG (13 electrodes). Moreover, six human emotions are classified using neural network classifier. In [15], the authors introduce recognition of eight human emotions, whether these emotion(s) get matched of the required specifications using EEG (3 electrodes). The international affective picture system (IAPS) stimuli is employed in their proposed methodology, and it is observed that K-nearest neighbors (KNN) classifier gives best accuracy rate. In [16], the authors discuss the human emotions recognition by considering three emotions. Music soundtrack is assumed in their study for emotions elicitation and for classification of emotions support vector machine (SVM) is considered. The authors in [17] use multiclass SVM, entropy and higher order autoregressive model for features extraction. In [18], EEG data is recorded through EEG neuroscan with a sampling frequency of 1000 Hz, power spectral density (PSD) technique is employed for features extraction and SVM with a Gaussian kernel for classification. In [19], the authors investigate offline analysis of EEG through SVM with a poly kernel and high order crossings (HOC) for features extraction. The Authors In [20], proposed an emotion recognition system, in which they employed discrete Fourier transform (DFT), wavelet transform (WT) and gabor techniques for dimensionality reduction and probabilistic neural network (PNN) were employed as a classifier. The authors in [21] record signals through Emotiv (2048 Hz) and KNN (k = 4) is used as a classifier. Differential entropy and rational asymmetry are calculated as features and videos is used as a stimuli [22]. In [23], six emotions are classified using music videos (1 min); IAPS (40 s) as stimuli, signals are acquired from five subjects using nervus EEG (256 Hz), band pass frequency filter of 0.2–45 Hz; common average referencing (CAR) is applied to EEG data followed by Daubechies wavelet transform (Db4) and multilayered perceptron neural networks with backpropagation algorithm (MLP-BP) as a classifier. In [24], music clips (30 s each) are used as stimuli, data is acquired from 26 subjects using EEG neuroscan (500 Hz), band pass filter of 1–100 Hz followed by fast fourier transform (FFT) for features extraction on all considered bands i.e., delta δ, theta θ, alpha, α, beta, β, and gamma, γ, of EEG signals and then SVM with radial basis function (RBF) kernel is employed as a classifier. In a recent work Fang et al. in [25] proposed a multi featured emotion classification method based on EEG however the accuracy is very low and also the method does not recognize cross-subject emotions. In [19], the acquisition of the signals is carried out using g.MOBIlab (256 Hz) from 16 subjects, the Ekman’s picture set (5 s) as a stimuli, band pass filter of 8–30 Hz; CAR applied to EEG data followed by higher order crossings (HOC) as a feature is used and SVM with polynomial kernal is considered as a classifier. In [26], a user-independent study is described where signals are acquired using neurosky mindwave headset (512 Hz) from thirty subjects, the authors use music clips as stimuli, band pass filter of 1–50 Hz; down sampling to 300 Hz followed by statistical features, power spectral density (PSD), FFT, and WT as features extraction methods and MLPBP is used as a classifier. Due to high computational cost and lack of accuracy when applied in signals corrupted by colored Gaussian noise, most of the above methods are not robust. Some of the above methods focus on detection of a specific emotion while others are application dependent. Most of these methods are also based on features extracted in one specific domain which are not robust. This research proposes a novel method of human emotions classification based on EEG signals acquired during audiovisual stimuli. EEG is useful tool for emotions classification as it depicts emotions in real-time which can’t be changed deliberately. Furthermore, we used a novel strategy of recording EEG signals and human emotions using audiovisual stimuli. After recording the EEG signals and constructing a new dataset, the EEG signal is then processed and twelve different features are extracted from it in three domains namely time, frequency and wavelet. RF and MLP are then used as classifiers for classifying human emotions. Our contributions of this works are summarized as follows:
1) A new dataset of EEG signal and the labeled human emotion is developed using a novel approach. The EEG signals and human emotions are recorded in response to audiovisual stimuli using neurosky mindwave headset (NMH) device. In other studies the researcher have either used audio or visual stimuli but both stimuli are not used simultaneously while recording the EEG and human emotion.
2) Features are extracted from EEG signals in three different domains namely time, frequency and wavelet domains to get a hybrid set of features for robustness of the classification. In some previous studies this approach is used however they used redundant features. In this study we avoided the use of redundant features to boost the computational power of the classifier without affecting the classification accuracy.
3) The emotion of the subject is labeled by playing the audio and visual to the subject with emotional contents.
4) RF is used as the main classifier in this study which is not used by other researchers. Its performance is also compared with other state of the art available classifiers.
The remainder of this paper is organized as follows: In Section 2, Materials and methods is briefly presented. In Section 3, we present the results and discussion. Finally, the concluding remarks with futuristic directions are provided in Section 4.
The EEG based emotions classification approach is shown in Fig. 1, the steps are described as;
1) The subject (participant) is exposed to the stimulus and voltage differences of the subject mind are recorded,
2) Artifacts and noises from the recorded signals are filtered out,
3) Relevant features are extracted by analyzing the preprocessed signals,
4) Classifiers are trained based on the selected features.
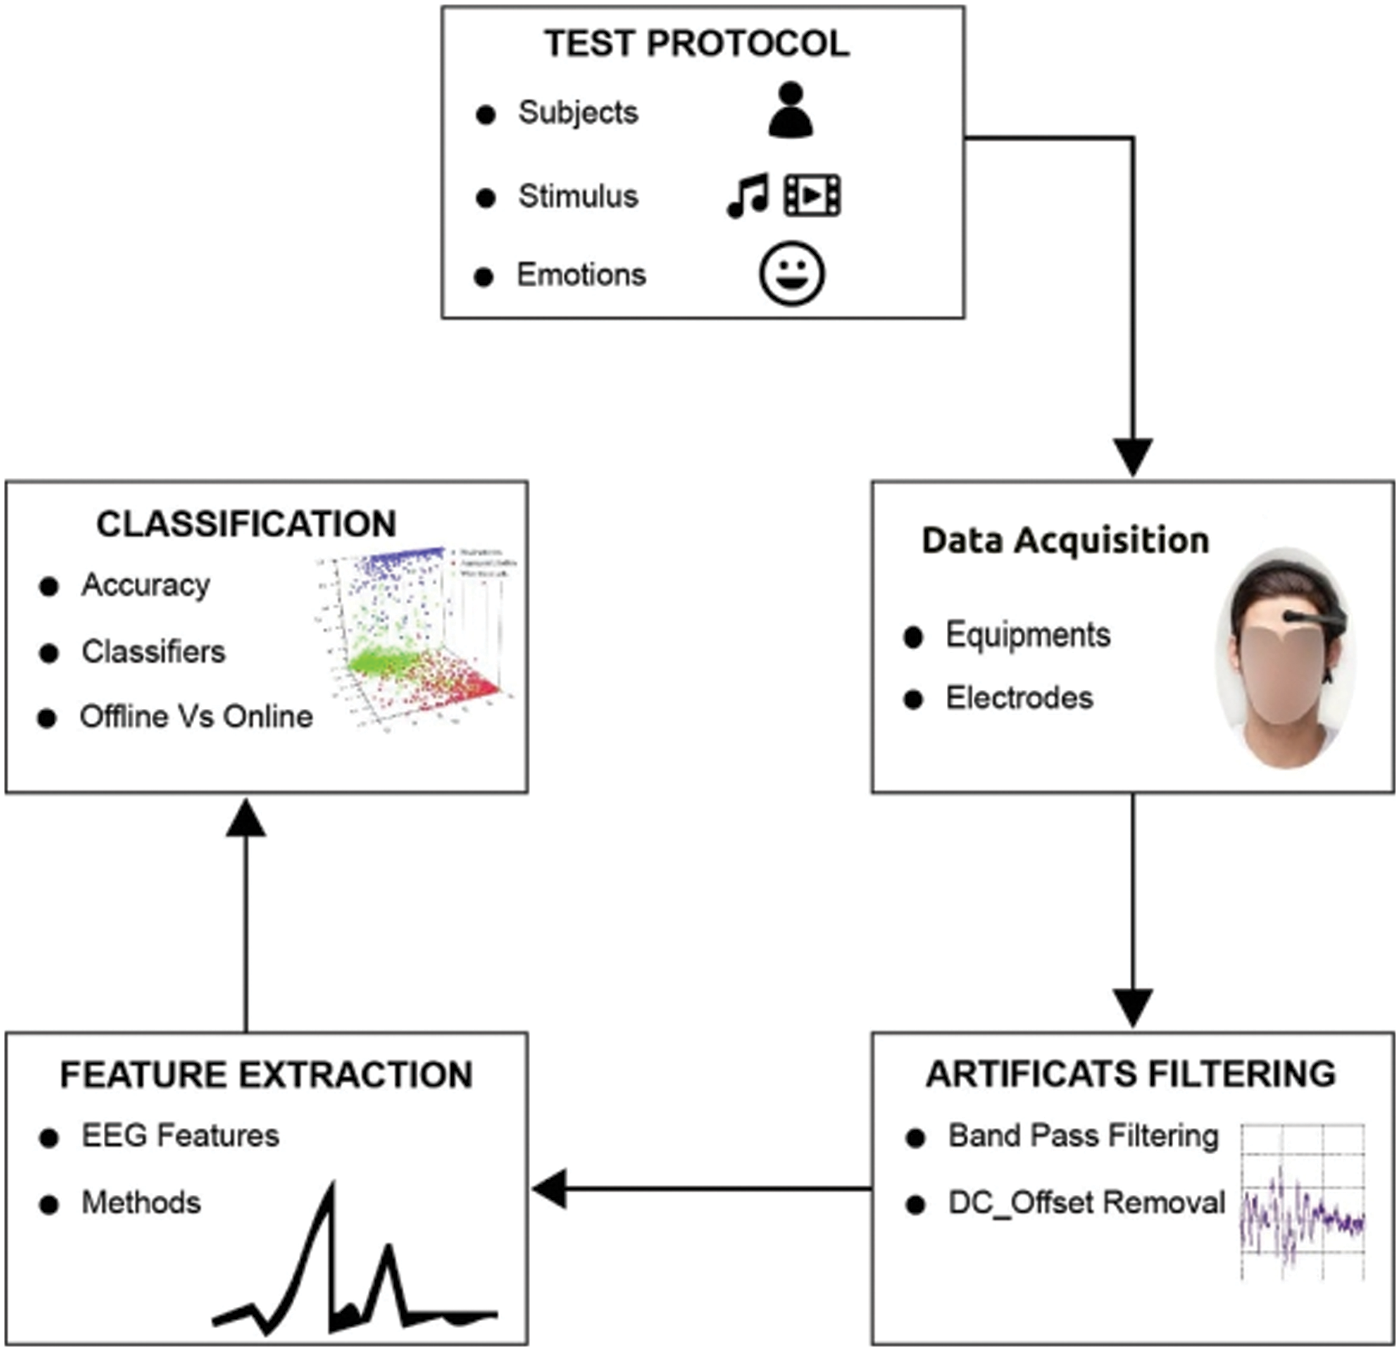
Figure 1: Layout of the proposed system
All these steps are briefly discussed in the following subsections.
A sound-attenuated and electrical room was used where the EEG signals were recorded while the participants were accommodated serenely on the chairs. In due course, 12 females and 28 males, aged between 18 to 23 years were designated as a subject in our research experiment. When the assent structures were topped off, the subjects were provided a straightforward presentation regarding examination of work and test phases. The layout of the proposed system and EEG recording protocol illustrated in Figs. 1 and 2 respectively. Stimuli were introduced on a PC display situated before the members away off of almost 60 cm. The time of relaxation is a mix of hearing calming music and profound breathing. Here, the breathing procedure is utilized to evade the psychological weakness of the subjects and to prepare them for the trial. In the experiment we used NMH, a simple and inexpensive device like a headset, with two dry electrodes. One electrode is placed at the left side of forehead like FP1 in 10–20 system as shown in Fig. 3, while the second one is a reference electrode, attached to the left ear lobe. Between these two dry electrodes, a potential difference is acquired which is known as EEG signal. This difference is monitored by NMH that captures brain signals using sampling frequency of 512 Hz [27]. The acquired signal is then digitized through a built-in analog to digital converter of 12 bits resolution. The digital signal is then sent to the personal computer (PC) for recording, through a built-in bluetooth device which comes along with the NMH. The signals are then recorded in the PC with the help of Think gear software which is a part of the NMH package. The recorded brain signals are stored every second in a file by a third party application puzzle box synapse (PBS) [27,28] in CSV format. The data stored in CSV file contains relative values, these relative values are converted to EEG amplitude. Between each enthusiastic video clips, under self-evaluation area, the subjects were educated to respond the emotions they encountered. In this segment, we presented four inquiries regarding each matter.
1) Label the emotion that you encountered from this video cut?
2) Intensify the emotions using 6 points rating.
3) Any other emotion did you encounter at the same or higher intensity than the already stated emotion, and if experienced, label?
4) Did you watch this video cut for the first time?
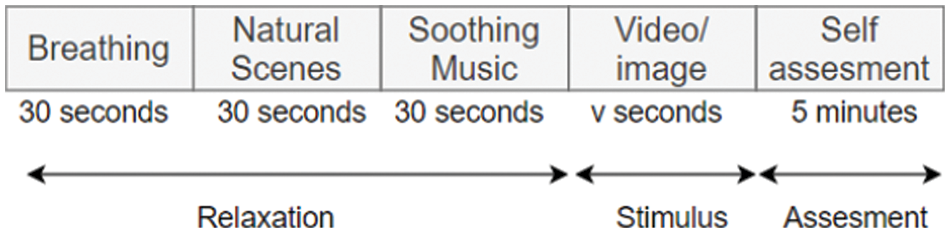
Figure 2: EEG recording protocol
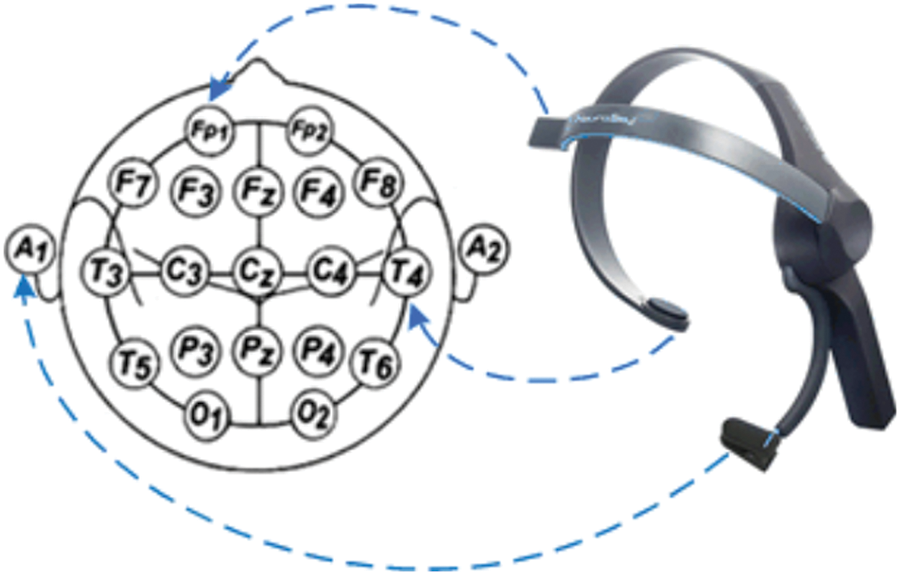
Figure 3: Position of mind wave mobile headset
For elicitation of five emotions namely happiness, sadness, anger, fear, and surprise in our work, we efficiently utilized two business video cuts among ten for every specific emotion. Likewise, an initiation board study has been led on ten non-participating subjects in the trial. In continuation to this, they were opted to intentionally choose two video cuts. In this article, the chosen clips are not of the steady timeframe for properly recording the EEG data. In Fig. 2, the v mean the time-spans of video clips.
EEG signals are contaminated by several sources of noise. As the EEG amplitude is very small i.e., in microvolts, thus these noises limit its usefulness. These are eliminated from the signals after converting to digital form. As the EEG signal is acquired with metallic electrodes, which adds a constant arbitrary voltage called DC-offset to the signal [29]. The DC-offset is first computed by finding the mean of the signal and it is then removed by subtracting it from the signal. Another source of noise is power line interference which add 50 Hz noise and its harmonics to the signal. These noises are removed by applying notch filter tuned to the frequency of noise. Other sources which contaminate the EEG signal are muscles movement, eye blink and other external factors. As most of the noises are of higher frequency hence these are removed by applying a low pass filter of cutoff frequency of 100 Hz to the EEG signals.
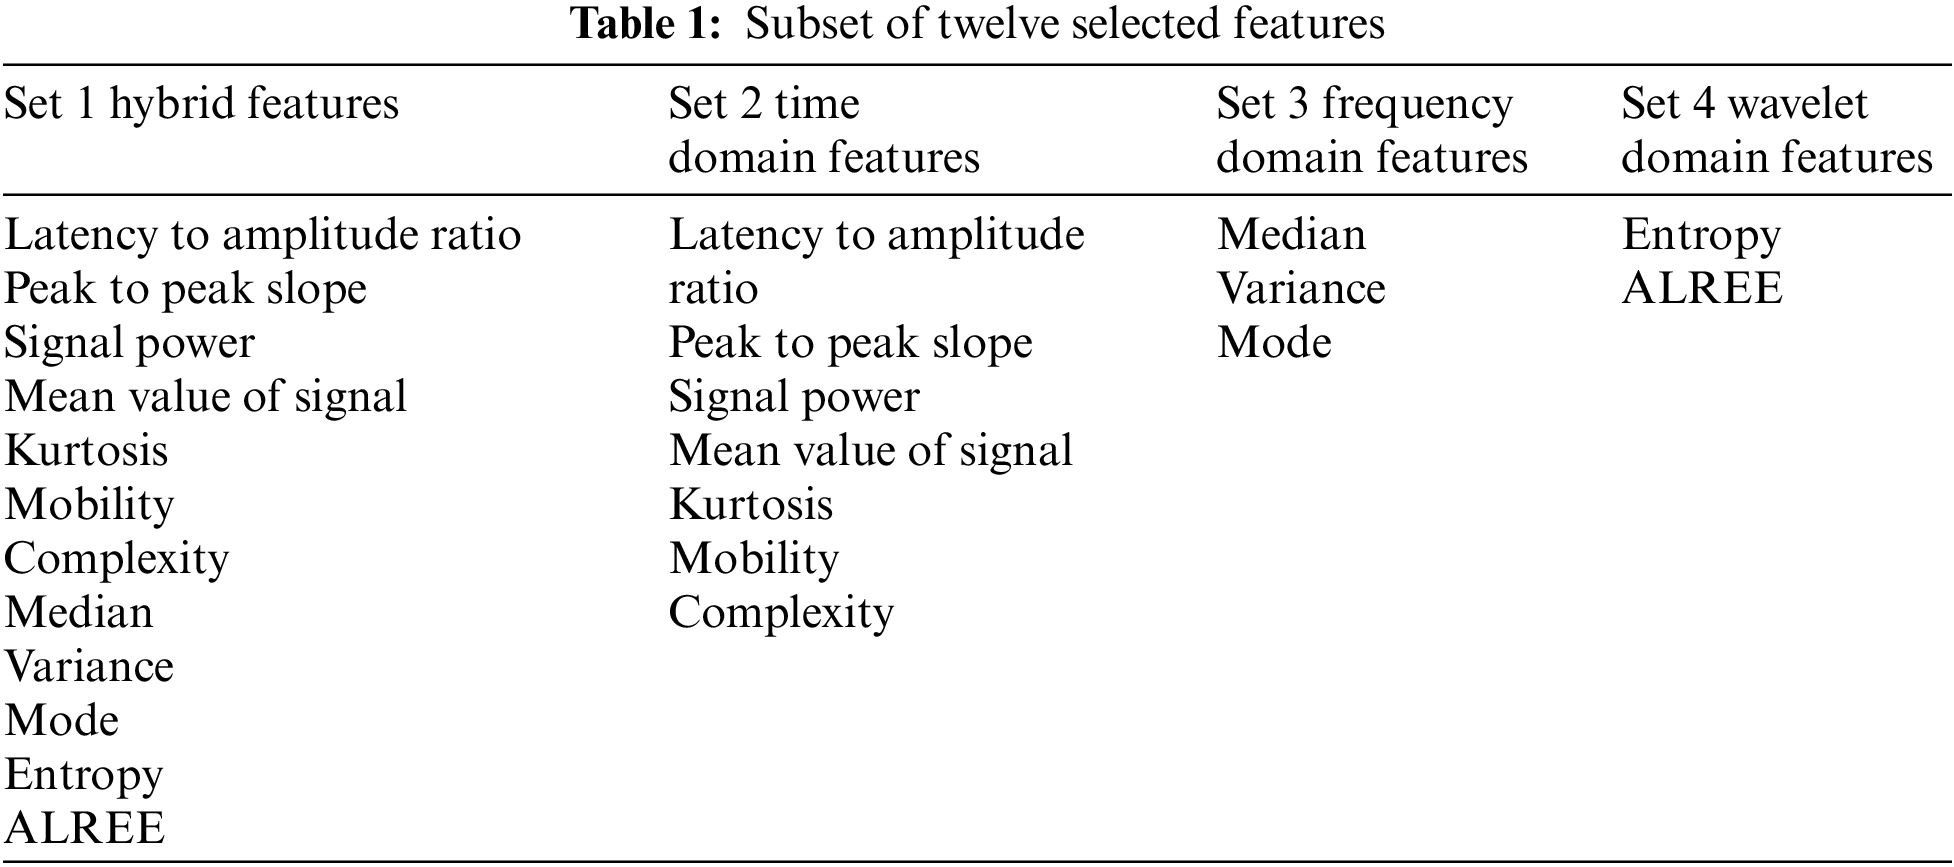
Features are defined as inherent properties of data which can be extracted from an EEG signals. It is vital to select them which reduces the processing costs and increase the reliability of classification. Observable features of the signal are extracted while watching video clips to extract information about subject’s mind. These features include statistical time, frequency and wavelet domains features of the signals. Different states of mind are associated with different frequency rhythms such as delta δ, theta θ, alpha α, beta, β and gamma γ. In this paper twelve selected features from three domains are extracted from the EEG signals, the details are as follow.
1) Time-domain features: The first set of extracted features from the EEG signals consists of statistical parameters computed in time-domain. These features depend on the amplitude variations of EEG signals with respect to time.
Latency to amplitude ratio: Latency-amplitude ratio (LAR), L, is the ratio between the times instant of the signal correspond to the peak value. If latency time of a signal is
Peak to peak slope: It is the ratio of EEG amplitude, Ξpp, to the peak to peak time, tΞpp, and is shown as
Here Ξpp describes the peak to peak value of EEG, which is an amplitude indicator of the signal s(t) and is computed as
where smax and smin are the maximum and minimum values of the signal amplitude, respectively. Where,
and
peak to peak time is denoted as tΞpp and is described as the time interval between minimum and maximum value of the signal and is computed as
Mean value of EEG signal: It is another statistical value and is defined as the average value of EEG signal and is shown as
where
Signal power: The power of signal during time interval, T, is shown as
Several other statistical features used in this paper depend on the first and second derivatives of the signals. These features include mobility and complexity.
Mobility: Mobility, M, of the signal is the ratio of the variance of the derivative of signal to the variance of signal and is given as
Complexity: Complexity coefficient, C, is another feature to characterize signal and is defined as the ratio of the mobility coefficient of the derivative of the signal to the mobility coefficient of the signal and is given as
Kurtosis: Kurtosis, K, shows the degree of peakness in the distribution of EEG signal and calculated as
where M4 and M2 are the fourth moment and variance of signal, respectively.
2) Frequency domain features: Different methods have been developed to minimize information loss in the time domain one of them is the Fast Fourier Transform (FFT), which has been extensively used in biological signal processing [30]. In this paper, median, mode, and variance are extracted as features in frequency domain. The FFT of the EEG signal s(t) is shown as
where k, ns, and ne represent the harmonic number of frequency components, starting and ending points respectively. Which transform time domain data to frequency domain data.
3) Wavelet domain features: Wavelet transform is a widely used for extraction of features from biomedical signals like EMG and EEG. The discrete wavelet transform, w(a; t), of the preprocessed EEG signal is computed first in this study. Using the computed wavelet transform, The Absolute logarithmic resourcing energy efficiency (ALREE) [31], and Entropy are calculated respectively as (14) and (16). Energy in each band is calculated as:
where c is the total number of wavelet coefficients and w(a; t) is the wavelet transform of EEG for scaling factor a at time instant t.
Absolute logarithmic resourcing energy efficiency (ALREE): ALREE is calculated using the wavelet transform of the signal as
where Ei is calculated from (13) and Etotal denote the total energy in all bands of EEG signal as shown in Fig. 4 and calculated as
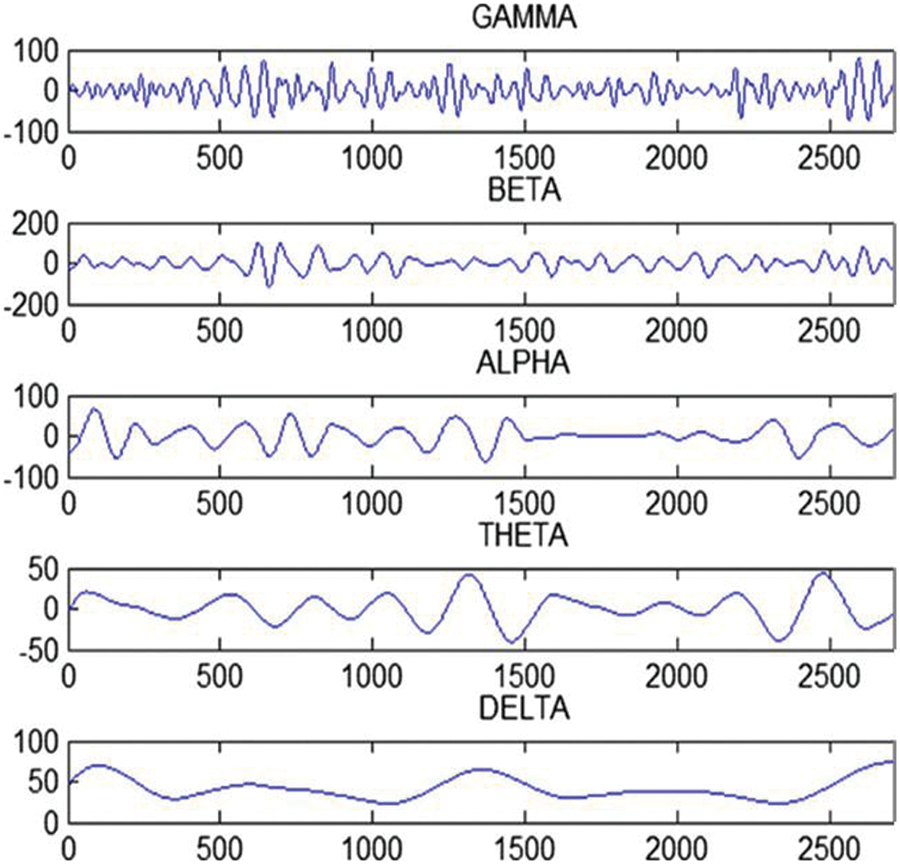
Figure 4: The five frequency bands of EEG signal
Entropy: The entropy of wavelet, w(a; t), is calculated as
where
For classification, cross validation is applied on data to make the system robust against over fitting. All the data is divided into training and test sets based on 10-fold cross validation rule. To classify data MLP and RF are applied on the features extracted as discussed in the previous section and compare the result of actual vs. predicted output to check the accuracy of proposed work.
Multilayer perceptron (MLP): MLP is a neural network with one or more hidden layers with an undetermined number of neurons. The hidden layer has this name because it cannot predict the desired output on the intermediate layers [32]. To train the MLP network, the commonly used algorithm is Backpropagation. Fig. 5 displays the structure of MLP classifier. The MLP has an input Layer, two hidden Layers and an output layer. The learning rate was set to 0.6 and momentum was 0.3.
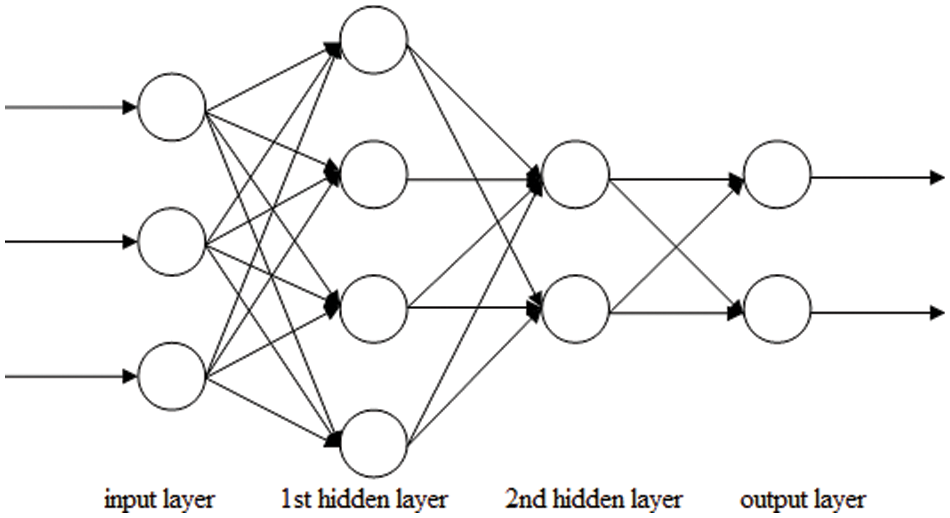
Figure 5: Multilayer perceptron diagram
Random forest (RF): RF has become popular due to its high generalization capacity and can be used in classification and regression tasks. In [33], the RF algorithm is used for the classification of emotions using flexible analytic wavelet transform. In general, RF algorithm is a combination of decision trees, where each tree generated depends on a subset of data independently sampled and showing the same distribution for all trees that form the forest. The number of trees (nTrees) was set to 600. The MLP took a longer training time of about 23.5 s while the Random Forest took on average 6.3 s for training all the emotion classes.
An offline analysis of EEG based emotions classification has been explored in this paper. EEG signals are captured for 40 subjects. All signals are recorded with the help of simple and low cost single channel NMH with a sampling frequency of 512 Hz. Zero DC-offset signals are attained by mean subtraction method. Twelve features of pre-processed signals are assumed. The features are further divided into four groups; group first consists of hybrid features, group second contains time domain features, group third consists of frequency domain features and group four consists of wavelet domain features as shown in Tab. 1.
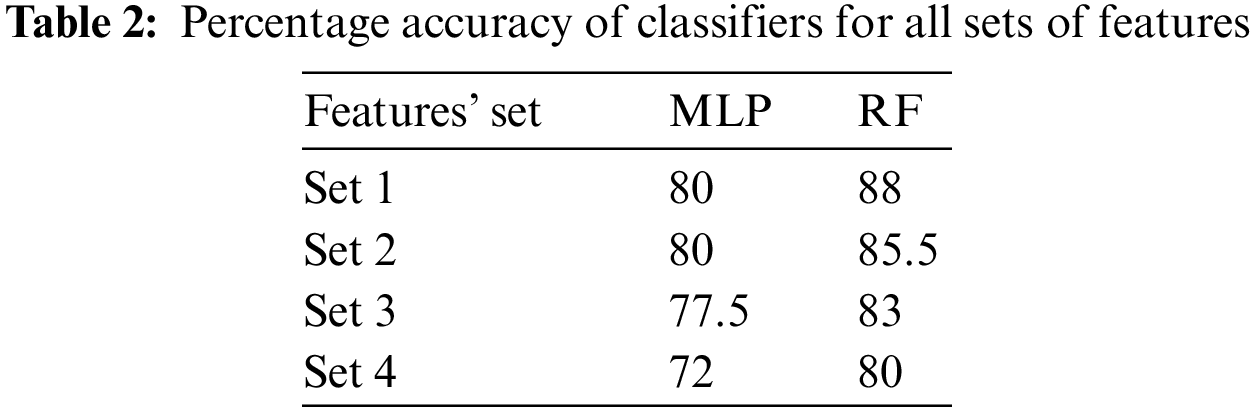
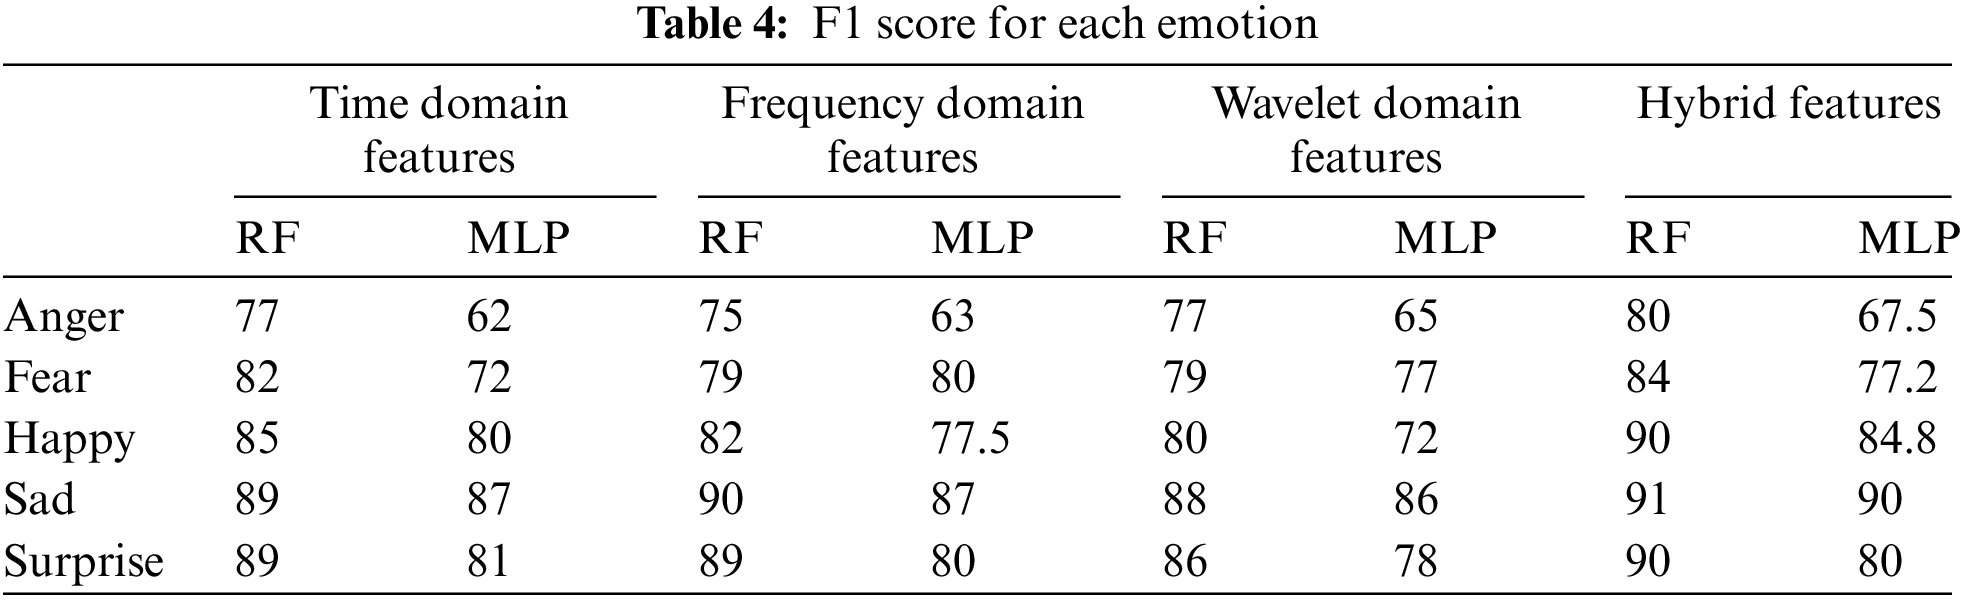
The MLP and RF classifiers are then trained using 10-fold cross validation on each group. the classification accuracy on each group of the features set is computed. as shown in Tab. 2. After the comparison of classifiers output for all four feature sets, it is concluded that features in Set 1 are the best features for the proposed work. RF is contributing best results for Set 1. The performance factors in our work are avg. accuracy rate, F-measure, Mean absolute error and kappa statistic are shown in Tab. 3. Accuracy means ratio of truly classified to the total samples. The F-measure or F − 1 is harmonic mean of the precision and recall which is a measure of a test’s accuracy, F1 score for each emotion is shown in Tab. 4. Mean absolute error is the average of absolute errors, can better reflect the actual situation of the prediction error.
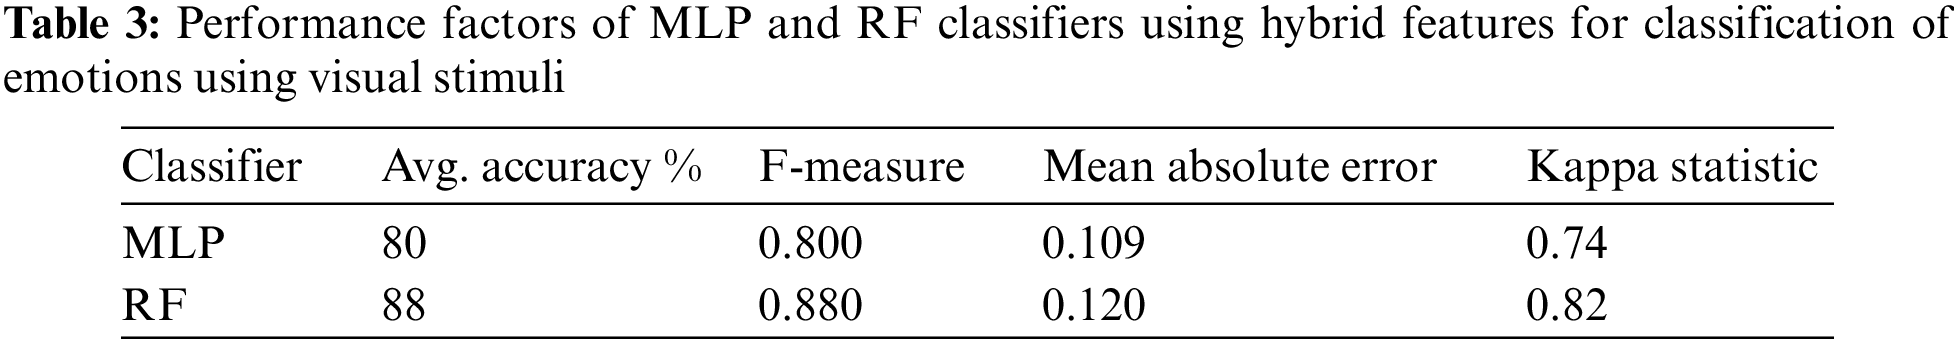
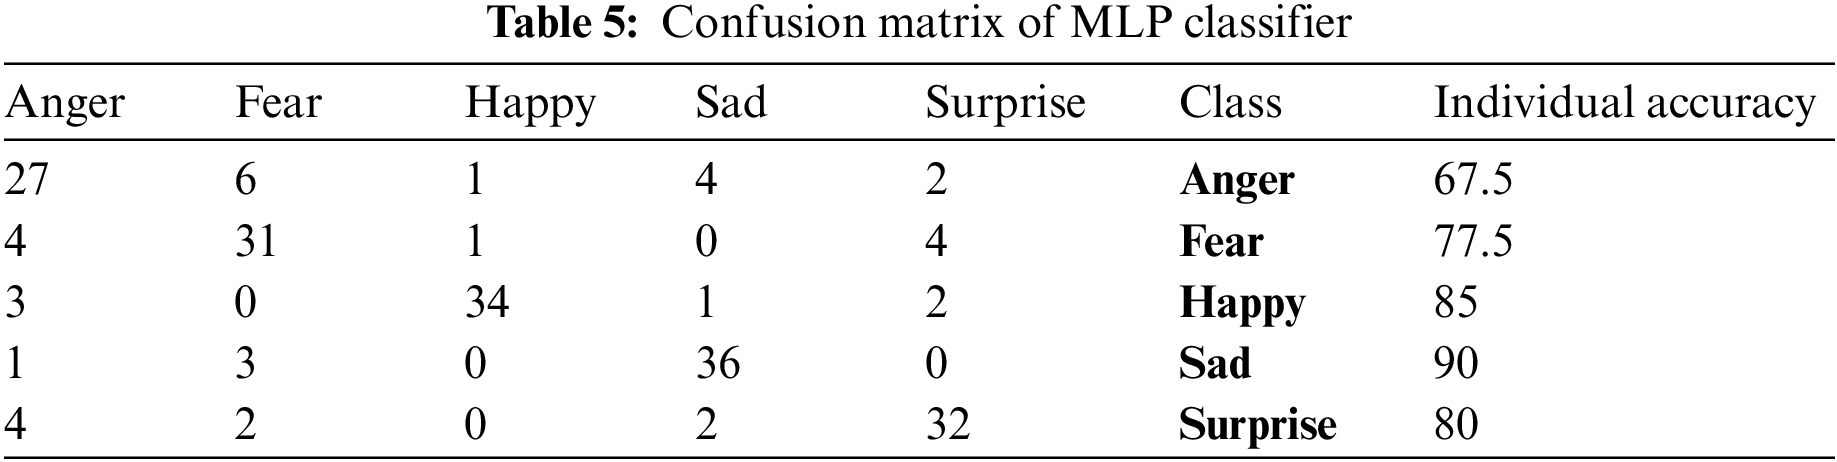
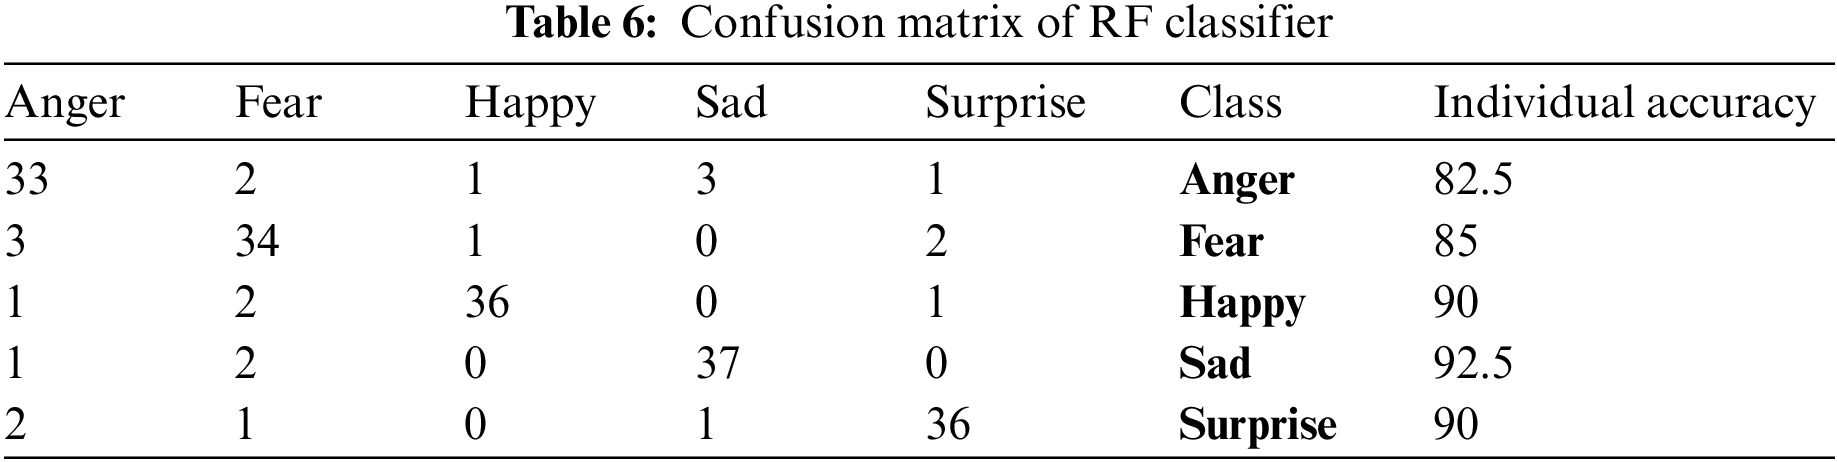
Kappa coefficient measure classification accuracy, the calculation of the kappa coefficient is based on the confusion matrix. The kappa calculation result is [−1, 1], but usually kappa falls between [0, 1], which can be divided into five groups to represent different levels of consistency: [0.0, 0.20] very low consistency (slight), [0.21, 0.40] Fair, [0.41, 0.60] moderate, [0.61, 0.80], and [0.81, 1] are almost perfect.
The confusion matrices of MLP and RF are shown in Tabs. 5 and 6 respectively. From the results of the proposed method it is evident that the sad and happy emotions are successfully classified with high accuracy. However, the accuracy of anger, fear and surprise emotions are not much as. To sum up, as compared to other emotions happy and sad are easy to recognize while watching video clips.
Tab. 7 provides the summary of the EEG signals used in this study for human emotions classification. The signals acquired from different subjects are used to evaluate the performance of the classification system, which is based on stimuli used, emotions, equipment (frequency) type, method for feature extractions, and type of classifier. Comparative analysis of MLP and RF classifiers using time, frequency, wavelet and hybrid features are illustrated in Fig. 6.
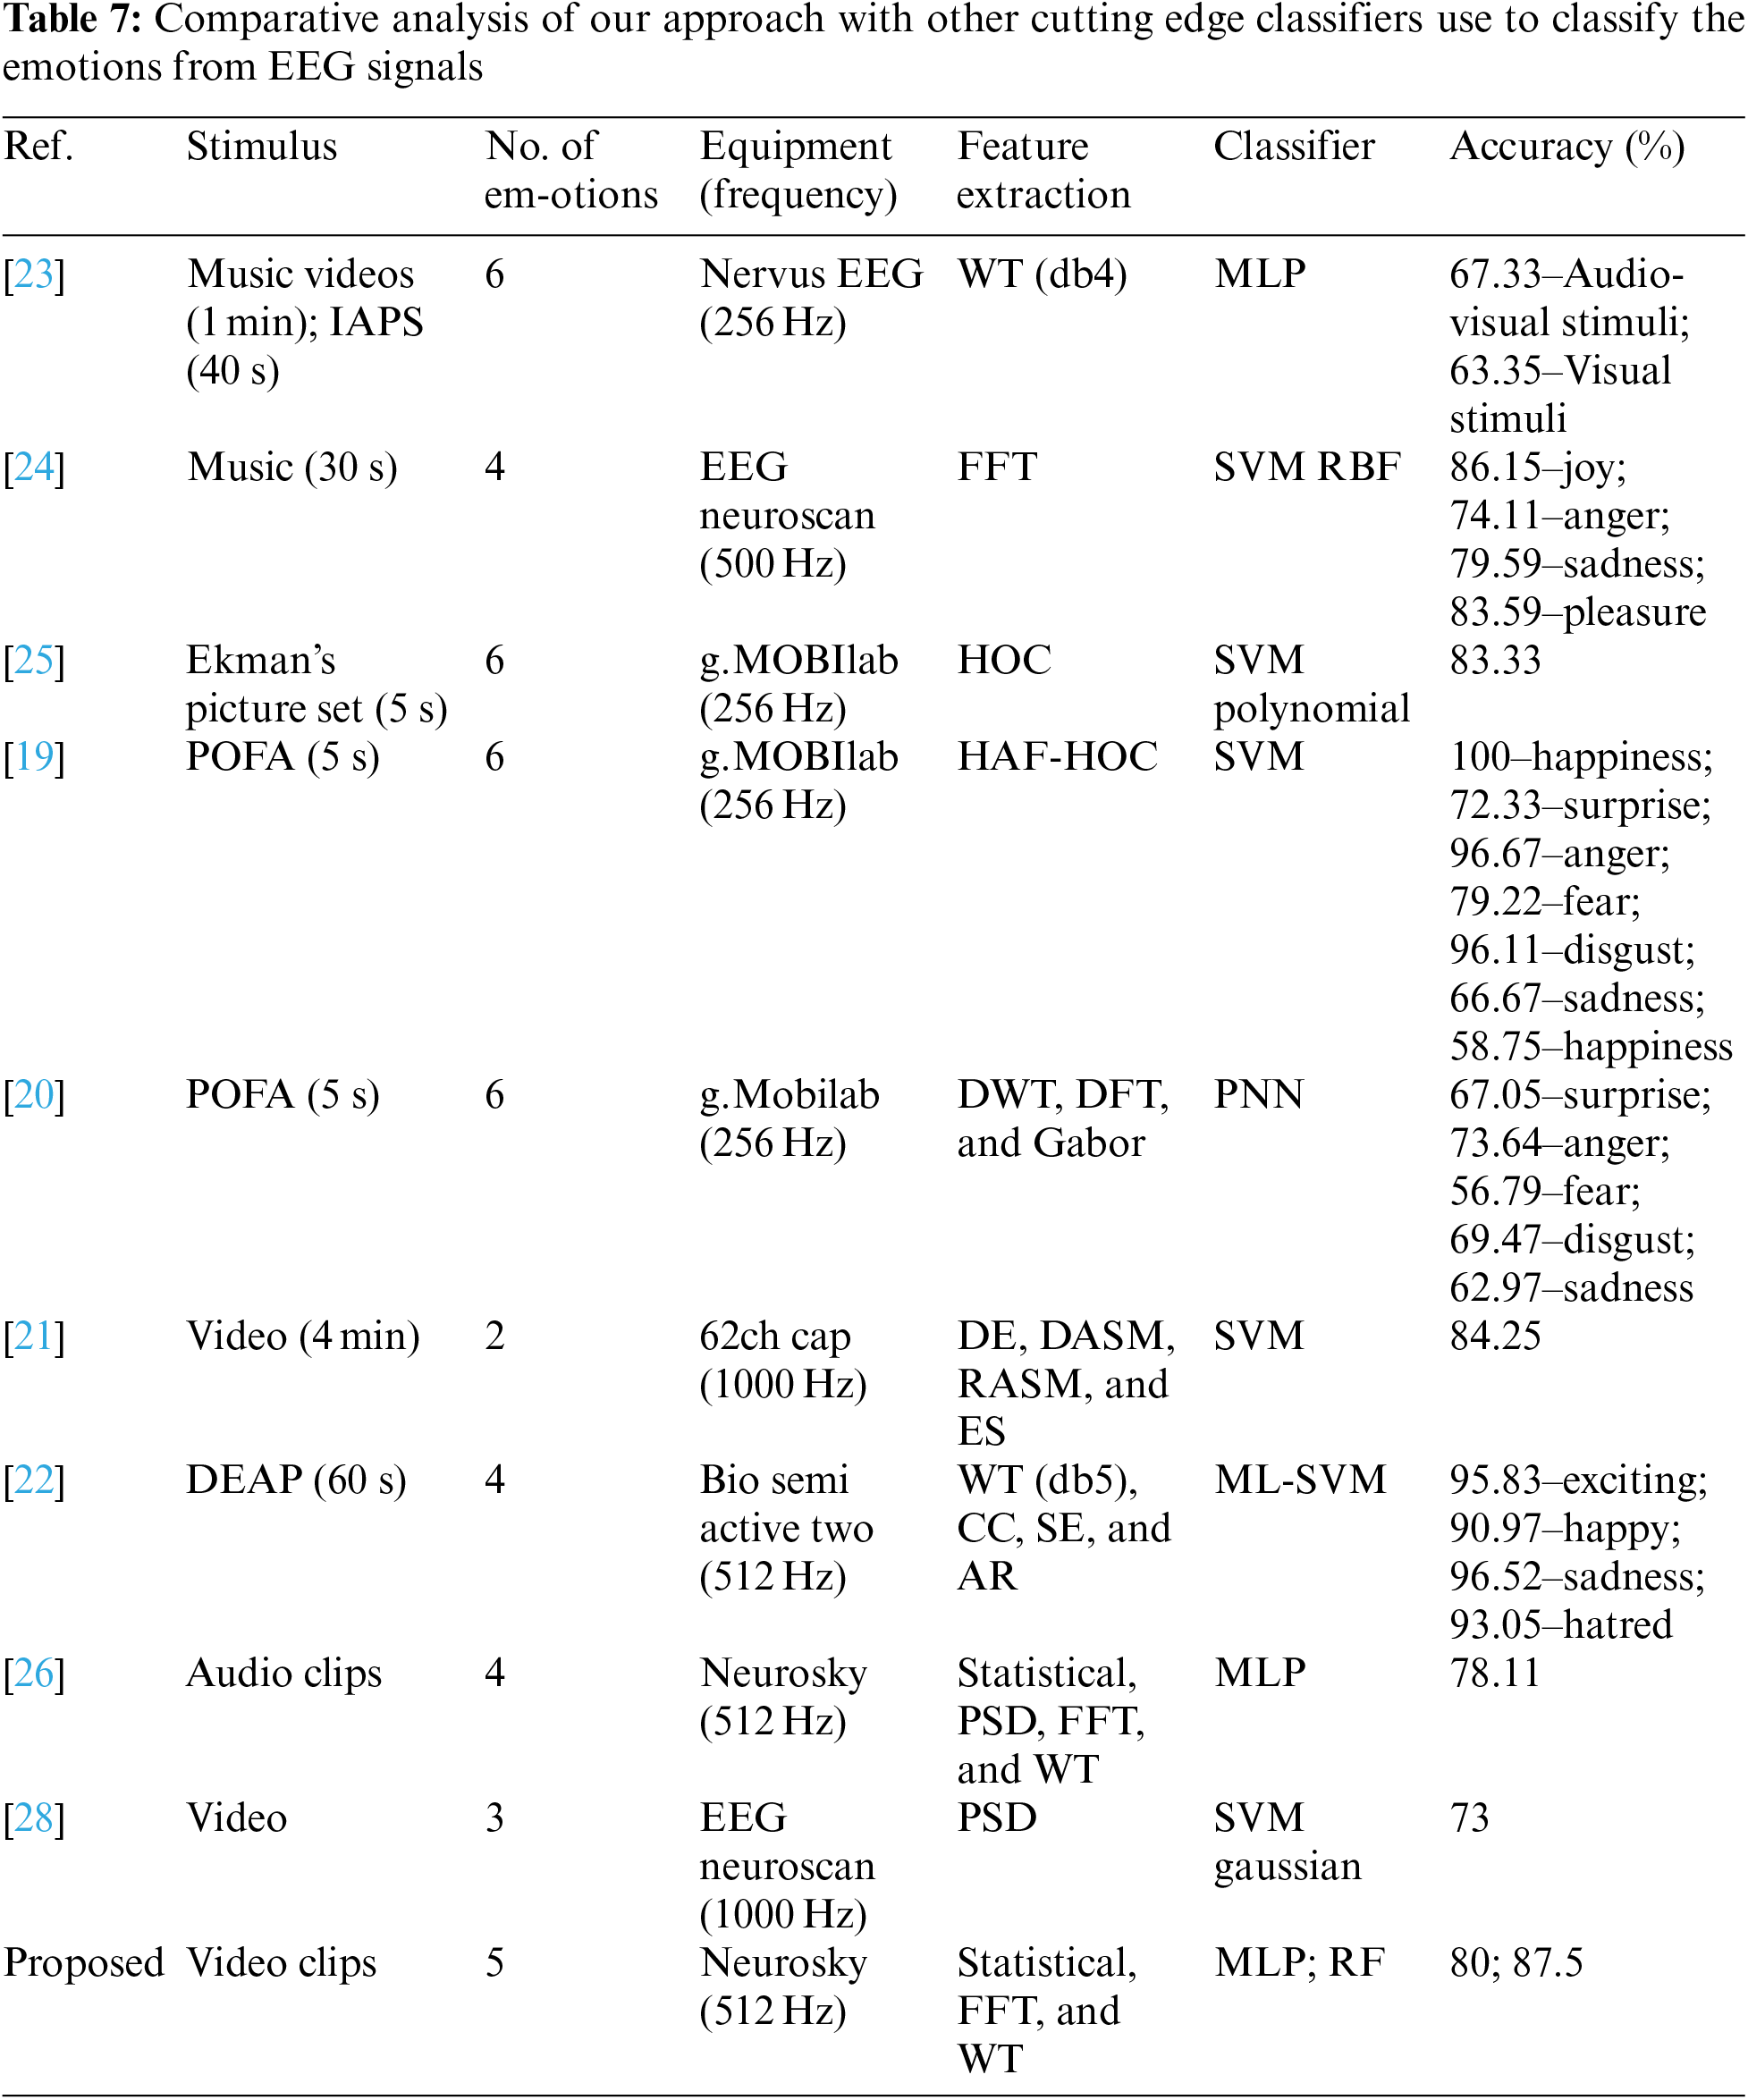
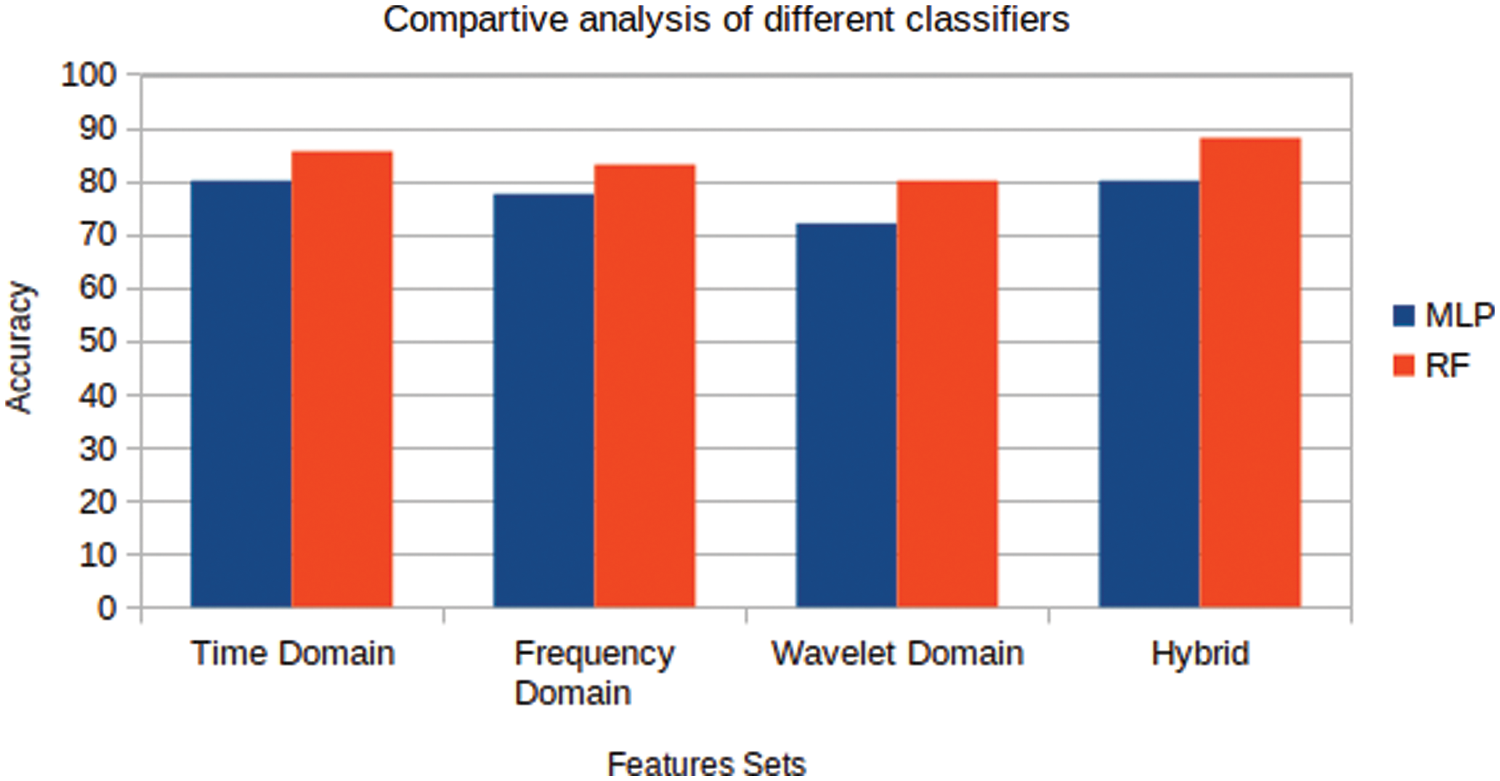
Figure 6: Comparative analysis of MLP and RF classifiers
In this paper, we analyzed recognition of human’s emotions based on EEG signals using visual stimuli. Twelve selected features in time, frequency and wavelet domains are extracted and then used as input to the classifier. Five emotions namely anger, fear, happy, sad and surprise are classified using RF and MLP classifiers. From the results obtained for several subjects data, it is evident that the RF classifies emotions with highest accuracy.
Although the proposed model produced better results but improvement can still be made. One of the strands relates directly to the hardware such as multi-channel EEG device can be used for obtaining more accurate results. However, the acquisition of new equipment entails an increase in cost. The emotional induction is one of the most influential criteria in the emotional behavior of the subject and in the respective responses provided at the biological level, so that the improvement of multimedia content is one of the considerations to be taken into account for possible future work.
Funding Statement: Authors would like to acknowledge the support of the Deputy for Research and Innovation-Ministry of Education, Kingdom of Saudi Arabia for this research through a Grant (NU/IFC/ENT/01/014) under the institutional Funding Committee at Najran University, Kingdom of Saudi Arabia.
Conflicts of Interest: The authors declare that they have no conflicts of interest to report regarding the present study.
References
1. A. Costa, A. Rincon, C. Carrascosa, V. Julian and P. Novais, “Emotions detection on an ambient intelligent 240 system using wearable devices,” Future Generation Computer Systems, vol. 92, no. 1, pp. 479–489, 2019. [Google Scholar]
2. N. Sharma and T. Gedeon, “Objective measures, sensors and computational techniques for stress recognition and classification: A survey,” Computer Methods and Programs in Biomedicine, vol. 108, no. 1, pp. 1287–1301, 2012. [Google Scholar]
3. M. B. Akcay and K. Oguz, “Speech emotion recognition: Emotional models, databases, features, preprocessing methods, supporting modalities, and classifiers,” Speech Communication, vol. 116, no. 1, pp. 56–66, 2020. [Google Scholar]
4. S. Li and W. Deng, “Deep facial expression recognition: A survey,” IEEE Transactions on Affective Computing, vol. 31, pp. 1–20, 2020. [Google Scholar]
5. J. Hofmann, T. Platt and W. Ruch, “Laughter and smiling in 16 positive emotions,” IEEE Transactions on Affective Computing, vol. 8, no. 1, pp. 495–507, 2017. [Google Scholar]
6. L. Shao, L. Zhang, A. N. Belkacem, Y. Zhang, X. Chen et al., “EEG-controlled wall-crawling cleaning robot using SSVEP-based brain-computer interface,” Journal of Healthcare Engineering, vol. 1, pp. 1–12, 2020. [Google Scholar]
7. P. Babajee, G. Suddul, S. Armoogum and R. Foogooa, “Identifying human emotions from facial expressions with deep learning,” in Zooming Innovation in Consumer Technologies Conf. (ZINC), Novi Sad, Serbia, pp. 36–39, 2020. [Google Scholar]
8. A. Khosla, P. Khandnor and T. Chand, “A comparative analysis of signal processing and classification methods for different applications based on EEG signals,” Biocybernetics and Biomedical Engineering, vol. 40, no. 2, pp. 649–690, 2020. [Google Scholar]
9. K. P. Wagh and K. Vasanth, “Electroencephalograph (EEG) based emotion recognition system: A review,” Innovations in Electronics and Communication Engineering, vol. 1, pp. 37–59, 2019. [Google Scholar]
10. K. Vora, S. Shah, H. Harsoda, J. Sheth, S. Agarwal et al., “Emotion recognition from sensory and bio-signals: A survey,” in Proc. of the 2nd Int. Conf. on Data Engineering and Communication Technology, Pune, India, pp. 345–355, 2019. [Google Scholar]
11. S. M. Alarcao and M. J. Fonseca, “Emotions recognition using EEG signals: A survey,” IEEE Transactions on Affective Computing, vol. 10, no. 3, pp. 374–393, 2017. [Google Scholar]
12. D. Nie, X. W. Wang, L. C. Shi and B. L. Lu, “EEG-Based emotion recognition during watching movies,” in 5th Int. IEEE/EMBS Conf. on Neural Engineering, Cancun, Mexico, pp. 667–670, 2011. [Google Scholar]
13. N. Jaques, N. S. Taylor, A. Azaria, A. Ghandeharioun, A. Sano et al., “Predicting students happiness from physiology phone mobility and behavioral data,” in Int. Conf. on Affective Computing and Intelligent Interaction (ACII), Xi'an, China, IEEE, pp. 222–228, 2015. [Google Scholar]
14. A. Choppin, “EEG-based human interface for disabled individuals: Emotion expression with neural networks,” Master’s thesis, Tokyo Institute of Technology, 2000. [Google Scholar]
15. A. Heraz, R. Razaki and C. Frasson, “Using machine learning to predict learner emotional state from brainwaves,” in Seventh IEEE Int. Conf. on Advanced Learning Technologies (ICALT) IEEE, Niigata, Japan, pp. 853–857, 2007. [Google Scholar]
16. H. Shahabi and S. Moghimi, “Toward automatic detection of brain responses to emotional music through analysis of EEG effective connectivity,” Computers in Human Behavior, vol. 58, no. 1, pp. 231–239, 2016. [Google Scholar]
17. A. E. Vijayan, D. Sen and A. Sudheer, “EEG-based emotion recognition using statistical measures and auto-regressive modeling,” in IEEE Int. Conf. on Computational Intelligence & Communication Technology, Ghaziabad, U.P., India, pp. 587–591, 2015. [Google Scholar]
18. S. Liu, J. Tong, M. Xu, J. Yang, H. Qi et al., “Improve the generalization of emotional classifiers across time by using training samples from different days,” in 38th Annual Int. Conf. of the IEEE Engineering in Medicine and Biology Society (EMBC), Orlando, FL, USA, pp. 841–844, 2016. [Google Scholar]
19. P. C. Petrantonakis and L. J. Hadjileontiadis, “Emotion recognition from EEG using higher order crossings,” IEEE Transactions on Information Technology in Biomedicine, vol. 14, no. 2, pp. 186–197, 2010. [Google Scholar]
20. S. Nasehi, H. Pourghassem and I. Isfahan, “An optimal EEG-based emotion recognition algorithm using gabor,” WSEAS Transactions on Signal Processing, vol. 3, no. 8, pp. 87–99, 2012. [Google Scholar]
21. S. K. Hadjidimitriou and L. J. Hadjileontiadis, “Toward an EEG-based recognition of music liking using time-frequency analysis,” IEEE Transactions on Biomedical Engineering, vol. 59, no. 12, pp. 3498–3510, 2012. [Google Scholar]
22. R. N. Duan, J. Y. Zhu and B. L. Lu, “Differential entropy feature for EEG-based emotion classification,” in 6th Int. IEEE/EMBS Conf. on Neural Engineering (NER), San Diego, California, USA, pp. 81–84, 2013. [Google Scholar]
23. M. Murugappan, M. R. B. M. Juhari, R. Nagarajan and S. Yaacob, “An investigation on visual and audiovisual stimulus based emotion recognition using EEG,” International Journal of Medical Engineering and Informatics, vol. 1, no. 3, pp. 342–356, 2009. [Google Scholar]
24. Y. P. Lin, C. H. Wang, T. P. Jung, T. L. Wu, S. K. Jeng et al., “EEG-based emotion recognition in music listening,” IEEE Transactions on Biomedical Engineering, vol. 57, no. 7, pp. 1798–1806, 2010. [Google Scholar]
25. Y. Fang, H. Yang, X. Zhang, H. Liu and B. Tao, “Multi-feature input deep forest for EEG-based emotion recognition,” Front. Neurorobot, vol. 14, pp. 617531, 2021. https://doi.org/10.3389/fnbot.2020.617531. [Google Scholar]
26. A. M. Bhatti, M. Majid, S. M. Anwar and B. Khan, “Human emotion recognition and analysis in response to audio music using brain signals,” Computers in Human Behavior, vol. 65, no. 1, pp. 267–275, 2016. [Google Scholar]
27. https://store.neurosky.com/pages/mindwave, Accessed: 2019. [Google Scholar]
28. https://store.neurosky.com/products/puzzlebox-synapse, Accessed: 2019. [Google Scholar]
29. K. Lee and S. Yang, “Method and apparatus for quantitatively evaluating mental states based on brain wave signal processing system,” US Patent App, 11/656, 828, 2008. [Google Scholar]
30. H. Zamanian and H. Farsi, “A new feature extraction method to improve emotion detection using EEG signals,” ELCVIA Electronic Letters on Computer Vision and Image Analysis, vol. 17, no. 1, pp. 29–44, 2018. [Google Scholar]
31. M. Murugappan, N. Ramachandran and Y. Sazali, “Classification of human emotion from EEG using discrete wavelet transform,” Journal of Biomedical Science and Engineering, vol. 3, no. 4, pp. 390–396, 2010. [Google Scholar]
32. B. Khan, R. Naseem, F. Muhammad, G. Abbas and S. Kim, “An empirical evaluation of machine learning techniques for chronic kidney disease prophecy,” IEEE Access, vol. 8, no. 1, pp. 55012–55022, 2020. [Google Scholar]
33. V. Gupta, M. D. Chopda and R. B. Pachori, “Cross-subject emotion recognition using flexible analytic wavelet transform from EEG signals,” IEEE Sensors Journal, vol. 19, no. 6, pp. 2266–2274, 2019. [Google Scholar]
 | This work is licensed under a Creative Commons Attribution 4.0 International License, which permits unrestricted use, distribution, and reproduction in any medium, provided the original work is properly cited. |