| Computers, Materials & Continua DOI:10.32604/cmc.2022.031162 | |
| Article |
A Multi-Mode Public Transportation System Using Vehicular to Network Architecture
1School of Telecommunication Engineering, Suranaree University of Technology, Nakhon Ratchasima, 30000, Thailand
2Office of Graduate Studies, Navaminda Kasatriyadhiraj Royal Air Force Academy, Bangkok, 10220, Thailand
3School of Mechanical Engineering, Suranaree University of Technology, Nakhon Ratchasima, 30000, Thailand
4School of Manufacturing Engineering, Suranaree University of Technology, Nakhon Ratchasima, 30000, Thailand
5Thaicom Public Company Limited, Patumthani, 12140, Thailand
*Corresponding Author: Settawit Poochaya. Email: settawit@sut.ac.th
Received: 11 April 2022; Accepted: 23 May 2022
Abstract: The number of accidents in the campus of Suranaree University of Technology (SUT) has increased due to increasing number of personal vehicles. In this paper, we focus on the development of public transportation system using Intelligent Transportation System (ITS) along with the limitation of personal vehicles using sharing economy model. The SUT Smart Transit is utilized as a major public transportation system, while MoreSai@SUT (electric motorcycle services) is a minor public transportation system in this work. They are called Multi-Mode Transportation system as a combination. Moreover, a Vehicle to Network (V2N) is used for developing the Multi-Mode Transportation system in the campus. Due to equipping vehicles with On Board Unit (OBU) and 4G LTE modules, the real time speed and locations are transmitted to the cloud. The data is then applied in the proposed mathematical model for the estimation of Estimated Time of Arrival (ETA). In terms of vehicle classifications and counts, we deployed CCTV cameras, and the recorded videos are analyzed by using You Only Look Once (YOLO) algorithm. The simulation and measurement results of SUT Smart Transit and MoreSai@SUT before the covid-19 pandemic are discussed. Contrary to the existing researches, the proposed system is implemented in the real environment. The final results unveil the attractiveness and satisfaction of users. Also, due to the proposed system, the CO2 gas gets reduced when Multi-Mode Transportation is implemented practically in the campus.
Keywords: Smart transit; intelligent transportation system (ITS); dedicated short range communication (DSRC); vehicle to network (V2N); vehicle to everything (V2X); electric vehicle (EV); you only look once (YOLO)
The Suranaree University of Technology (SUT) is located on the northeastern part of Thailand. Moreover, SUT divide the areas inside its campus into different zones as per the master plan of SUT. The dormitories of students locate far from the academic zone, and 8,550 students live inside the campus area, especially the first-year students, as they mostly occupy the campus dormitories. Thus, it is required to have a proper transportation system. The public mass transportation plays a big role in large urban communities. Most students use personal motorcycles and campus bus service for commuting from the dormitory area to academic areas as depicted in Fig. 1. The chances of accidents occur due to large number of personal motorcycles during the rush hours. The statistical data related to the increment in the number of accidents from 2017 to 2019 are also shown in Fig. 1. Moreover, the delay of the campus bus in terms of approaching to bus stop is the major factor, which reduces the attractiveness of users. Hence, an inconvenient public transportation system contributes in increasing the number of personal motorcycles. According to the Fig. 1, more personal motorcycles lead to the congestion in traffic during the rush hours along with increasing the chances of accidents.
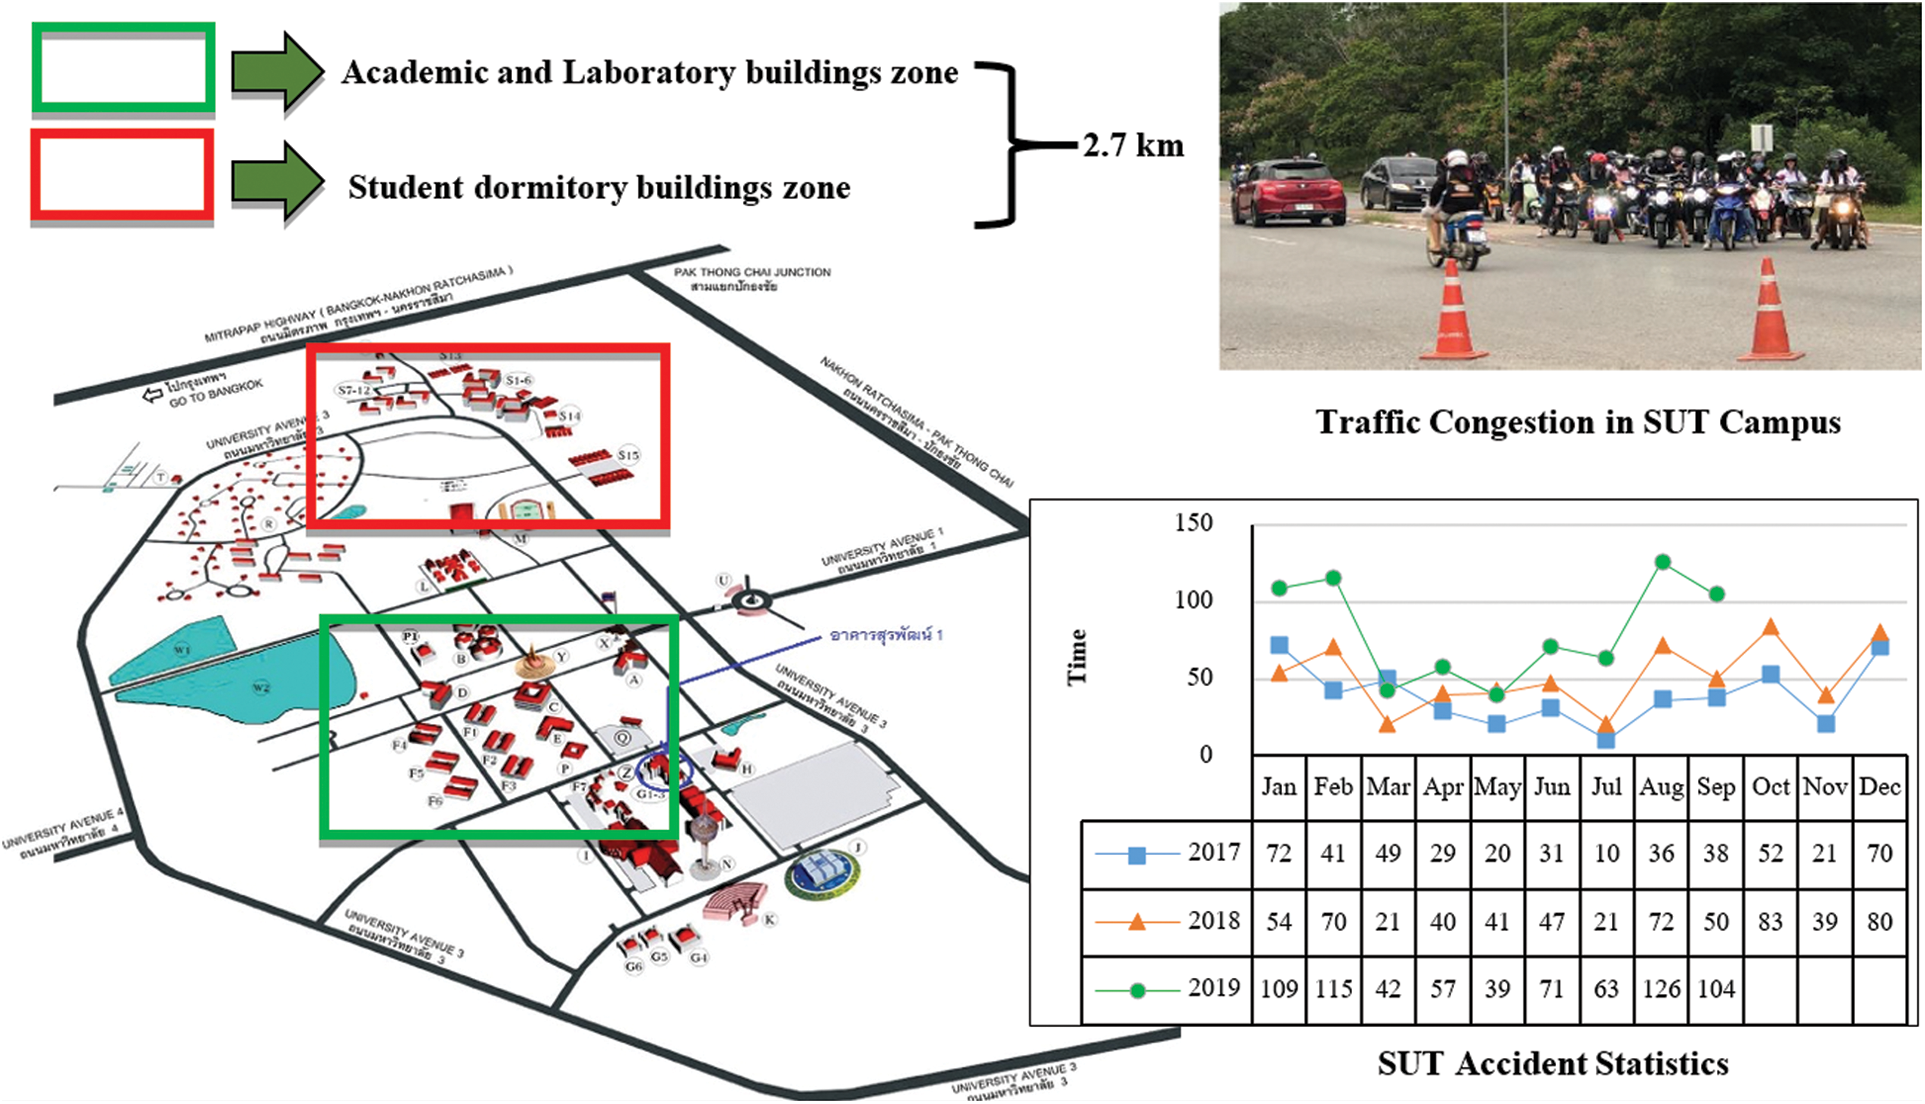
Figure 1: Mapand accidents statistics (before Covid-19 pandemics) of Suranaree university of technology, Thailand
The accidental statistics reported by the hospital of university hospital unveil that the inconvenient public transportation system is the root cause of accidents in the campus. Thus, the Intelligent Transportation System (ITS) is selected as a tool for reducing the number of accidents. Moreover, integration of ITS with the campus bus service as a new system is called the SUT Smart Transit system. The ITS uses an appropriate communication technology for the dissemination of messages (safety and non-safety) to drivers. Moreover, the ITS separates communication formats as Vehicle to Vehicle (V2V), Vehicle to Infrastructure (V2I), Vehicle to Pedestrian (V2P) and Vehicle to Network (V2N). The main goals of ITS are to improve the capability of road traffic, enhancing the safety of humans along with limiting the construction of new roads. The V2N was selected for developing the Multi-Mode Transportation system between the public transportation and electric motorcycle services in campus. Actually, the V2N is equipped with On Board Unit (OBU) along with the communication devices. Also, the 4G Long Term Evolution (LTE) modules are selected to utilize in the V2N. The real time location and real time speed are transmitted to the cloud, and then the Estimated Time of Arrival (ETA) can be computed from these data. Also, the ETA appears in both server and on user applications. Utilizing ITS on the campus bus service seems to provide more attractiveness to users along with having the potential to help in reducing the number of personal vehicles in the campus area.
Most of personal motorcycles in the campus are fueled by the fossil fuels, such as gasoline or other alternatives like gasohol. Hence, they also emit CO2 as the result of combustion from their engines, which increases the emission of CO2 by 115 g/km/person [1]. Actually, all over the world, researchers are aiming to reduce the foot prints of carbon from different technologies, such as internet technologies [2–6], construction, electronics, power generation technologies etc. Furthermore, an electric motor cycle service is introduced in the campus, named as MoreSai@SUT, with mobile phone application having the same name. By using this electric motorcycle services, we can help reduce CO2 because electric motorcycles do not emit any CO2 gas from the vehicle, which reduces the air pollution. This electric motorcycle service is a type of sharing economy model. Actually, the sharing economy is one of the most famous and interesting topics these days. Moreover, users scan QR code on their bicycles and then can ride bicycle around the service area. However, the model still has some drawbacks, such as requiring more management system in terms of gathering all the bicycles back to its station. The operational teams have to travel around the service area for moving all bicycles back to their assembly points. These activities require more operation time. With the help of the latest electronic devices [7,8] to reduce the size of batteries, electric motorcycles can be used with small batteries along with the high efficiency. They can be used around 40–60 km per one fully charge. Moreover, electric motorcycles have lower maintenance cost and do not require frequent maintenance comparing to conventional motorcycles, as they have less components. According to these reasons, the electric motorcycles are more attractive to be used. The communication devices can be installed on the electric motorcycles. So, the services providers can control, manage, setting up services area, motorcycle speed via communication modules [9,10]. Thus, V2N technology influents the operation of electric motorcycle service conveniently. The Fig. 2 unveils the Multi-Mode Transportation tools and applications for SUT Smart Transit and MoreSai@SUT.
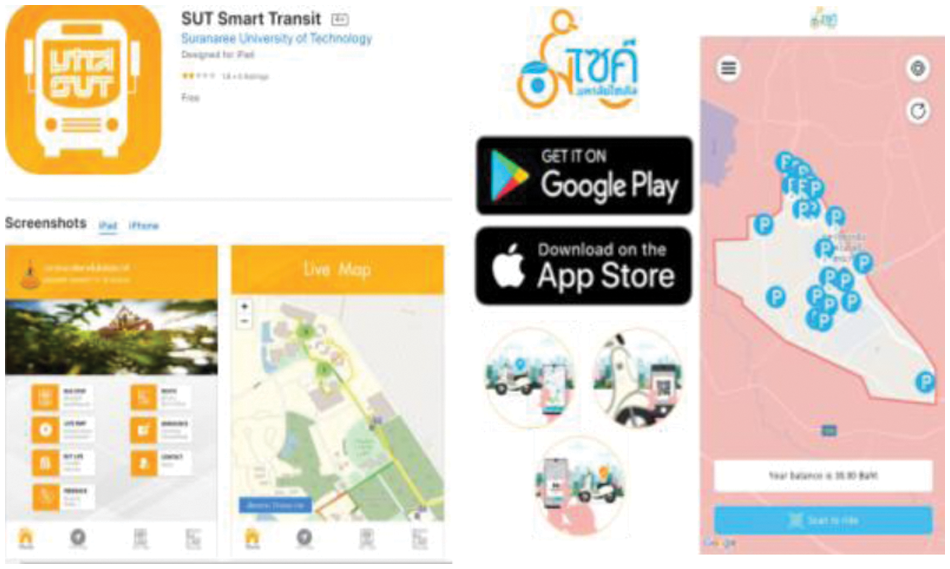
Figure 2: SUT smart transit and Moresai@SUT applications
In this work, the Multi-Mode transportation system via SUT mass transportation system (SUT Smart Transit) and smart electric motorcycle-sharing (MoreSai@SUT) are presented. The contributions and novelties in this paper are summarized as follows:
1) We applied multi-mode transportation system by using public mass transportation system via campus bus service and smart electric motorcycle sharing by using the V2N technology. The CCVT cameras are deployed in the main service routes with the aim of classifying vehicles by using the You Only Live Once (YOLO) algorithm. Furthermore, the 4G LTE modules and OBU are used in V2N to send the real time speed and location to the cloud. The received data is then applied in the proposed mathematical model to compute the Estimated Time of Arrival (ETA). Also, the ETA appears in both server and on user applications. Utilizing ITS on the campus bus service seems to provide more attractiveness to users along with having the potential to help in reducing the number of personal vehicles in the campus area, as unveiled in the final experimental result.
2) The Multi-Mode Transportation was applied in the real-world scenarios for comparison and passenger statistics in terms of reduction in CO2.
3) The introduced Multi-Mode Transportation model helps to reduce the number of accidents in large urban communityin the future.
The remainder of this paper is organized as follows: Therelated works in ITS and multi-mode transportation system are discussed in Section 2. System infrastructures are introduced in Section 3. The proposed multi-mode transportation system is described in Section 4. The statistical data of real-world implementation and experimental results and discussions are described in Section 5, and the conclusions are summarized in Section 6.
The public transportation system in large urban communities is an important issue for governments in many countries. However, in some areas, people found the way to improve the transportation issues by using the Intelligent Transportation System (ITS). ITS is equipped with new communication technologies, such as transmitting significant information from roadside devices to vehicles or transmitting information from vehicles to servers. It can improve road traffic capability, enhance road safety, convenience, and limit new road constructions [11]. The service time of public transportation system is a major factor that introduces the attractiveness or unattractiveness to users [12]. The Estimated Time of Arrival (ETA) is a performance parameter of public transportation system [13] that shows the expected arrival time of the transportation system, and it can be computed from real-time data by using Global Positioning System (GPS) modules [14]. The average delay per person, delay due to traffic, number of intersection and weather situation and other unexpected factors are the main causes of ETA error, and the ETA calculation depends on the distance between bus stops. The accurate latitude and longitude of bus stop location can improve the accuracy of ETA computation [15]. We used the haversine formula according to [16] to identify the ETA in this work. Also, the real-time data is utilized with this calculation, which leads to the increase in the attractiveness of public transportation system in the SUT campus [17]. However, if users do not want to wait for the next service bus, they can choose another choice of transportation service from the campus such as sharing electric motorcycle service. This scenario calls as “Multi-Mode transportation system”. The sharing economy in particular area is introduced as a bike sharing system [18]. In this system, it consists of operation area, bicycle model, communication devices and the operation staffs [19,20]. However, bike sharing model is not an appropriate system for SUT campus since the campus has many small and long hills. Most students do not want the bicycle service due to this problem, and they need more convenient service. Hence, the electric motorcycle might be a key technology for the campus [21]. The electric motorcycle sharing services are implemented in small cities of many countries, such as Germany, USA and China. The electric motorcycles have the capability to travel through small and long hills in the campus. Thus, by using these two combined services between the public mass transportation (bus service) and the sharing electrical motorcycles, we can improve the ETA computation for users along with proposing new sharing economy with more environmental-friendly vehicles. Actually, the accidental statistics reduces, when passengers decrease the usage of personal vehicles. Moreover, CO2 reduction is another goal of this Multi-Mode Transportation system [22,23]. The combustion of gasoline fuel used in medium-size car emits about 173 g per passenger-kilometer, while gasoline-fueled motorcycle emits 115 gram of CO2 per passenger-kilometer. Using electric motorcycle, we can reduce this level of CO2 footprint. Hence, the implementation of this Multi-Mode Transportation system can help reducing accident statistics, improving the convenience of users along with reducing the amount CO2 emitting in a large urban community. In [24–30], the authors explain the recent work on internet of vehicles.
The public mass transportation system consists of bus stop location, service format, service routes, type of bus and the schedule timing of departure and arrival. The bus type in the campus was voted by students. In the past, electric bus served the students in the campus, but as the SUT terrain has small and long hills, the electric bus could not provide the convenience and satisfaction. The zhongtong low floor diesel bus is used for the bus service nowadays. Also, the fix service routes and bus schedules are also re-established. The bus stop locations are collected through GPS, such as the Latitude and Longitude of each service route. Actually, the development of public mass transportation system in SUT campus started with the ARCGIS simulation. The location of bus stops and service routes are taken to investigate, and the six bus service routes separated by bus color are also used in ARCGIS simulation. These have been adopted practically in the real world after the simulation was done.
Another transportation service in the campus is the sharing electric motorcycles, which are Deco Sofia Direct Current (DC) Motor 1 kw @60 V 20 Ah voted by SUT students. The speed of motorcycle is limited at 45 km/h, and the battery levels are always kept more than 50% due to safety reasons. However, users are requested for the driving license before accessing to this sharing electric motorcycle service. These motorcycles are monitored and serviced by staffs. So, the users do not need to worry about the maintenance. The cost of the service will be clarified in the next section. Moreover, the service provider also provides the accident insurance to all users in the system.
The multi-mode transportation system between the bus service and the sharing electric motorcycles is presented in Fig. 3. The simulation accuracy from ARCGIS is contributed by the collected data with the help of service route surveys. The number of intersections, road infrastructures, traffic congestion in rush hour increase the delay of public mass transportation service. Thus, the bus schedule and stops of each service route are the significant parameters to observe. The survey of service route in real locations provides the accurate bus stop GPS positions, and the bus schedule in each route are set to be the major service standard. The bus drivers drives follow the standard schedule time, and the delay of service time is reduced as a result. The standard bus time is then selected for the observation of difference between the ETA model and the real-world measurement, and the Proof of Concept (POC) period of the standard bus time is operated for four months. The passenger satisfaction scores from SUT dormitory students, which are the main group of users, increase to 4.3 out of 5. The campus bus service with six routes and the fix bus schedule increase the attractiveness of public transportation system for SUT students in the campus. The development of POC then moves to the next step. The proved concept of the bus schedule is now set as the standard time in the Smart Transit creation. The smart transit with ITS utilization is created and named as SUT Smart Transit. SUT Smart Transit system has three major components according to Fig. 6:
1. The eight low floor buses with 4G/LTE communication devices and GPS module installed.
2. Mobile phone applications for users that present Estimated Time of Arrival (ETA) according to the proved standard time. The ETA is presented in the bus stop menu. The live map introduces the real time position of buses, and the feedback menu will allow the users to request or complain the service (Fig. 5).
3. Smart bus stops are equipped with smart TVs and the installed 4G/LTE devices. The ETA is also presented on the screen of smart TVs at bus stops.
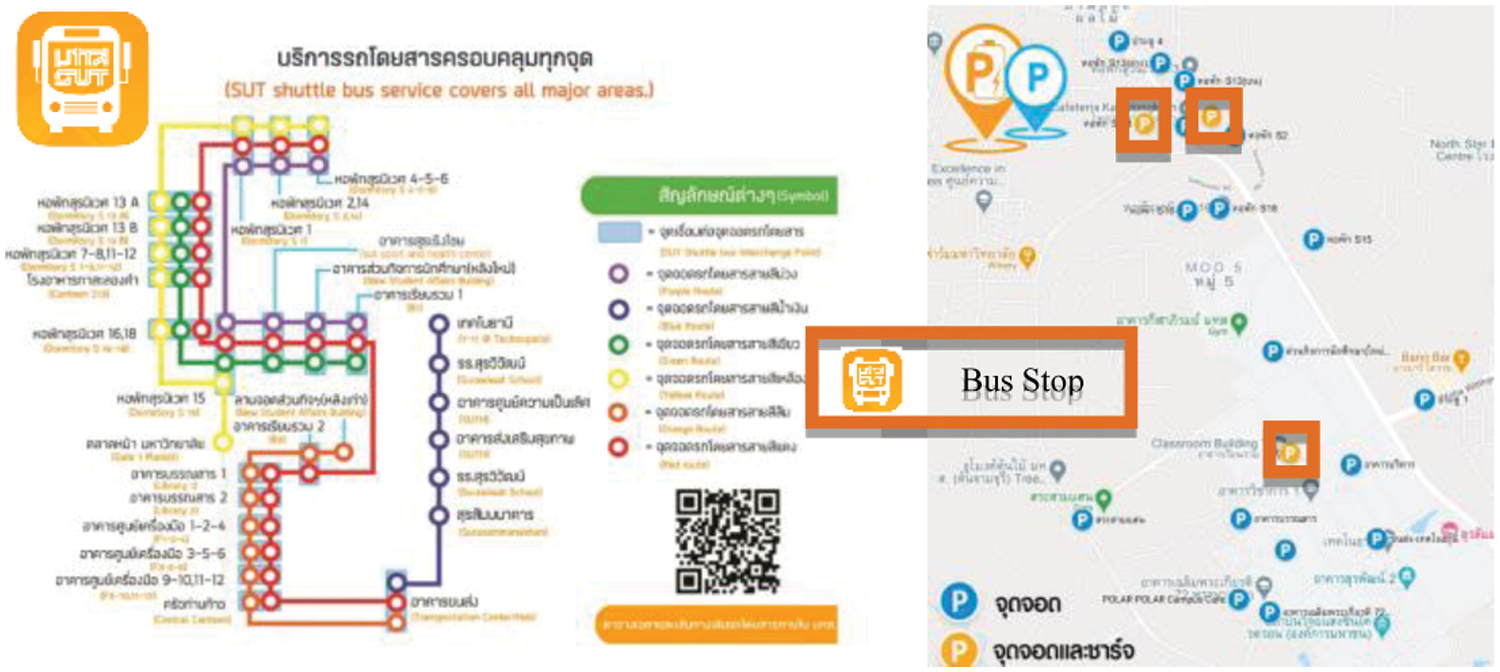
Figure 3: SUT smart transit routes and parking point and charging station of Moresai@SUT
The ETA computation is presented in Eq. (1) and the commuted time is represented as
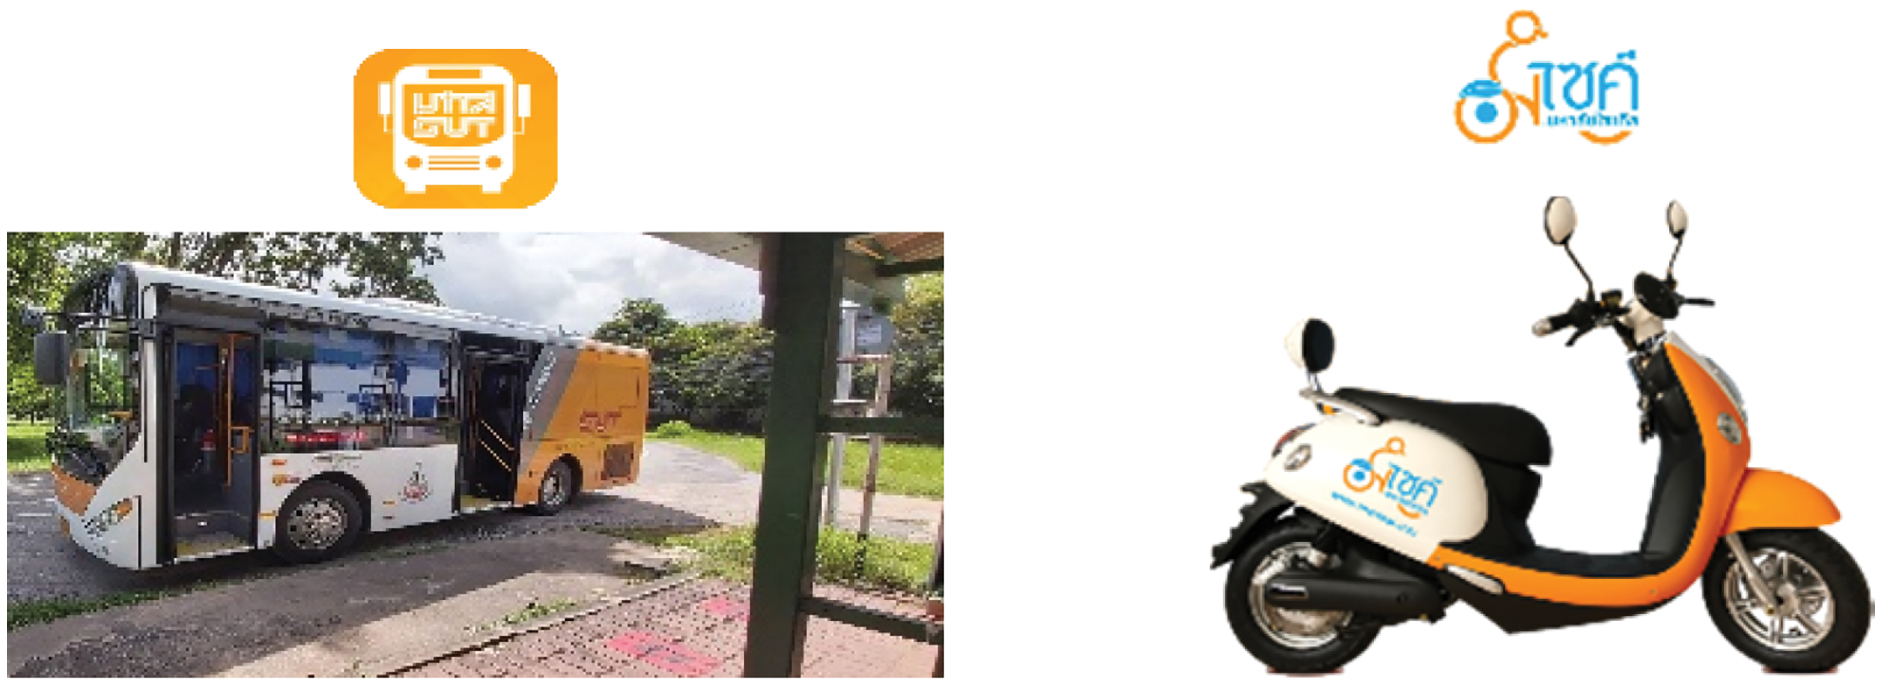
Figure 4: Bus and electric motorcycle models
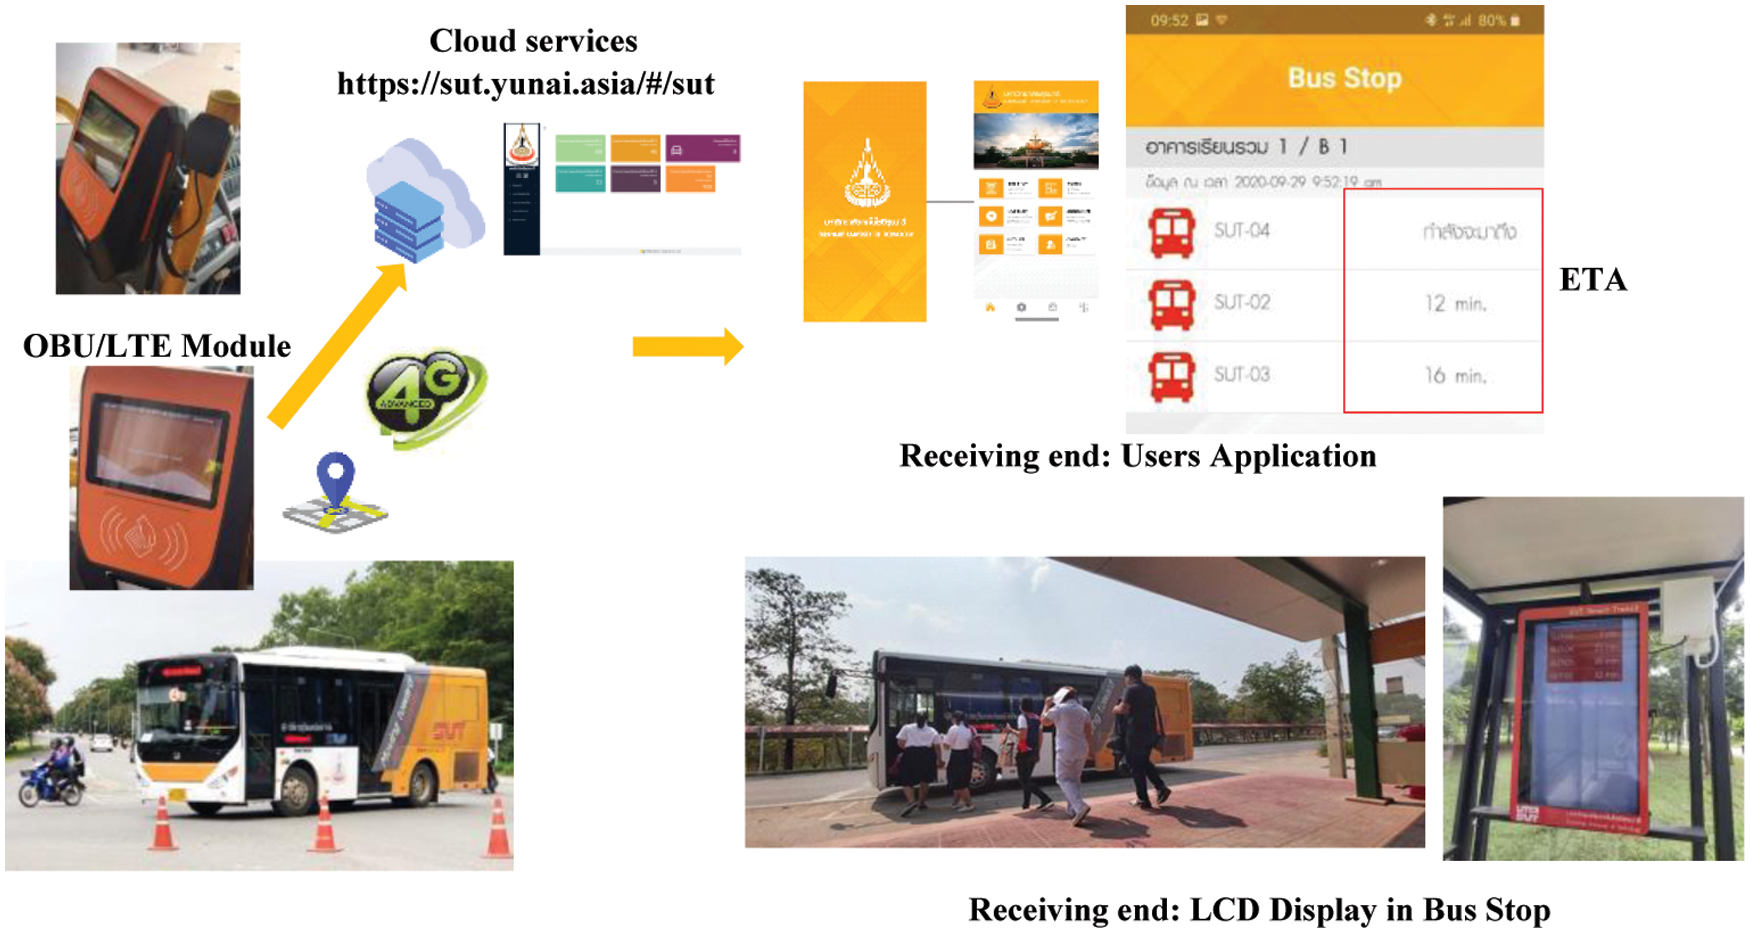
Figure 5: SUT smart transit system infrastructures
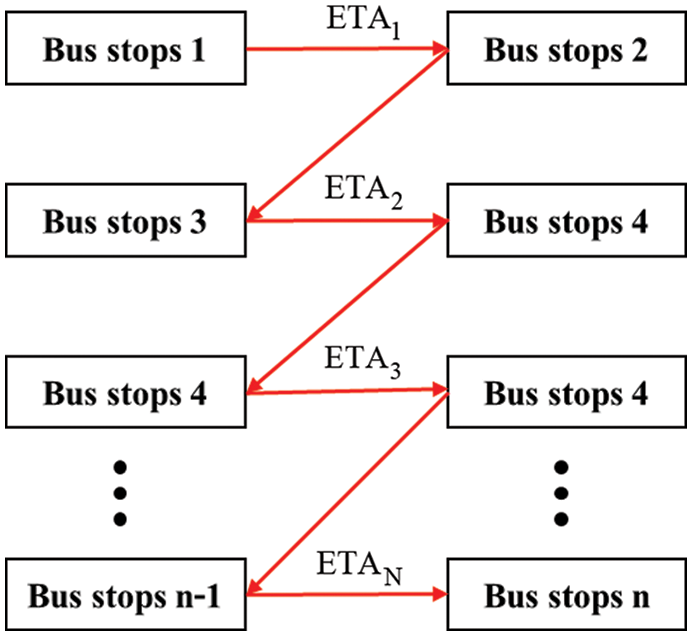
Figure 6: Total ETA concept
Moresai@SUT consists of three parts:
3.1 Charging and Stopping Stations
The significance issue is the locations of charging and stopping stations, which are required to be convenient in terms of the need of students. The Moresai@SUT team surveys the campus area, especially the area that is in close proximate to SUT Smart Transit bus stops. The possible area was proposed and voted by SUT students. In Fig. 3, the charging stations are depicted as orange color symbols on the map, while the blue color represents stopping points. The twenty-two stopping points and four charging stations are established.
Deco Sofia DC Motor 1 kw @60 V 20 Ah is selected by SUT student volunteers. Motorcycle speed is limited at 45 km/hr, and the battery level are always kept being more than 50% due to safety reasons. The driving license is requested before accessing the service.
The default number of the electric motorcycle are configured according to the students proximity. During every morning, Moresai@SUT staffs will place more electric motorcycles at the main areas of both male and female student dormitories, which are called S7 and S4, respectively. This is due to the fact that students have to travel to study buildings in an academic area during the morning rush hour. The parking station at each study building is also a charging station. The users can charge the electric motorcycles by plugging to charging ports. The percentage of battery is configured to be more than 50% to avoid the user complaints about the low battery level of the sharing electric motorcycle services.
The communication devices and GPS modules are also installed inside these electric motorcycle, and the real-time speed, real-time position of the electric motorcycle are transmitted to the center server. The staff members of Moresai@SUT monitor the parameters of service status, such as battery percentage, current position, real time speed. Also, the geo-fencing technology is also applied to prevent theft and other accidents outside the campus, as the Moresai@SUT backend system will notify users when a motorcycle travels outside the geofences.
4 Implementation and the Measurement Setup
The practical implementation in the SUT campus depends on many parameters. SUT Smart Transit can service on time, when bus drivers arrive at the bus stop according to the POC standard bus schedule.
As a result, the passenger satisfaction score gets increased due to timely services. The convenient and on time services attract more students to use this public transportation. As a result, the number of personal motorcycles will be reduced. The accident statistics in campus will also be decreased. The other option, such as sharing electric motorcycle platform, is another key for the reduction of personal vehicle policy. Additionally, personal vehicles cost more maintenance service and more fuel consumption. The sharing service can eliminate these issues, since students do not have to buy any motorcycle in this service. However, student must possess riding license. Students with riding license can access the pool of sharing electric motorcycles by using the Moresai@SUT application. The user’s riding license is requested to be approved from the service provider.
Since the location of the bus stop and parking station of sharing electric motorcycle is near to each other, the students who use SUT Smart transit service can access to Moresai@SUT service, when they cannot wait for the next service bus. With this accessible Multi-Mode Transportation, the accidents in the SUT campus statistically show the trend of reduction, which is the main purpose of utilizing Multi-Mode Transportation system.
The POC bus schedule with the service routes is separated by its color, and seven buses serve the students in the dormitory area during the rush hour period. The service bus No.8 is configured as blue route services that will go to the university hospital and will be in service from 07.10 am. to 06.30 pm. The rush hour period started from 07.10 am. to 09.00 am. The Six services buses are separated into two service routes: green routes for male student dormitory zone and purple route for female student dormitory zone. The time interval between the current service bus and the next service bus is about seven minutes during the rush hours. The green and the purple routes stop at the study buildings 1 (B1) and then go back to the student dormitory. The service bus No.7 or the orange route is created for transferring student from the B1 study building to laboratory buildings and then stop at the bus station. Moreover, students from the dormitory can change from orange route to blue route at the bus station for travelling to the university hospital. The normal service period starts at 09.00 am. and ends at 09.00 pm. During this period, the SUT Smart Transit system will change green, purple and orange routes to red route with seven service buses. The red routes will be in main service with 15 min of service bus interval and takes 45 min for one trip. The blue route will be in service from 07.10 am. to 06.30 pm.
Electric motorcycles are located around the male and female dormitory zone. Ten electric motorcycles with fully charged are located at male dormitory zone (S7-S8) and three for the female dormitory zone. The students with the riding license can access Moresai@SUT service. Actually, users need to open Moresai@SUT mobile phone application to register and confirm the payment, and the registration approval method is approved by Moresai@SUT administration team. Student will be allowed to ride the electric motorcycles after finishing the registration process. The payment method uses electronic QR-code, which can be paid through mobile banking services. The cost of Moresai@SUT for students are 5 Baht for starting, 1.5 Baht per kilometer and 0.5 Baht for pausing. Fleet management is studied for the reduction of Operating Expenses (OPEX) issues according to [22].
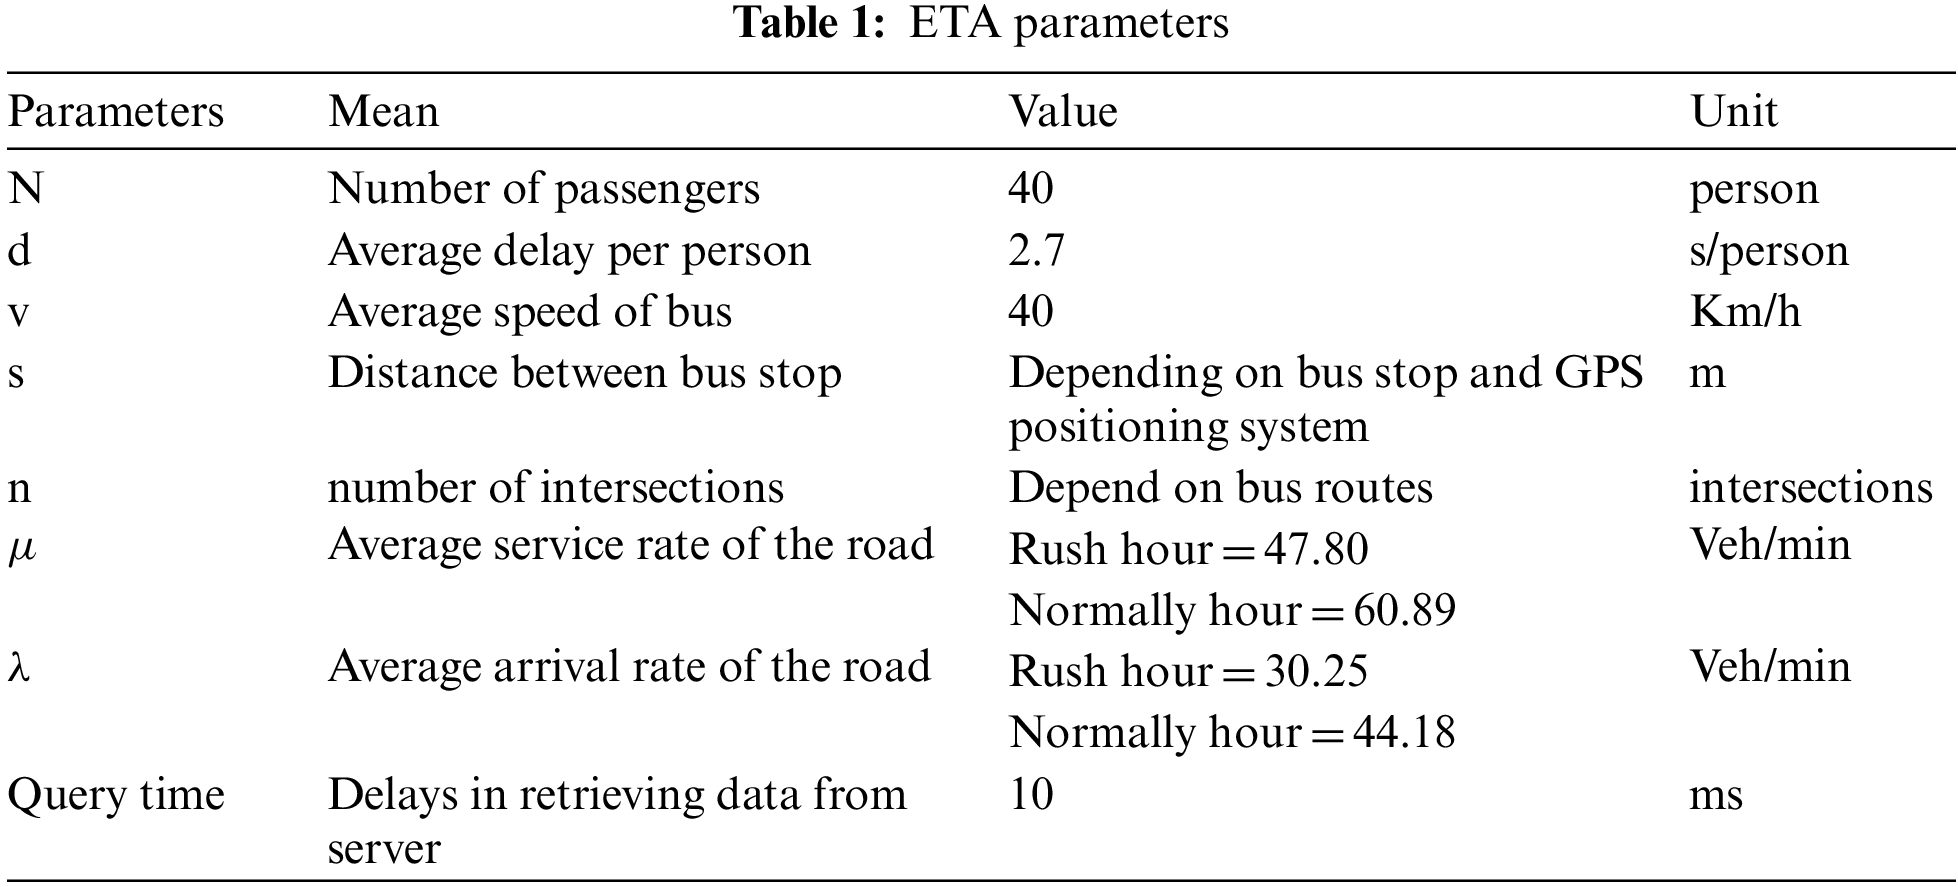
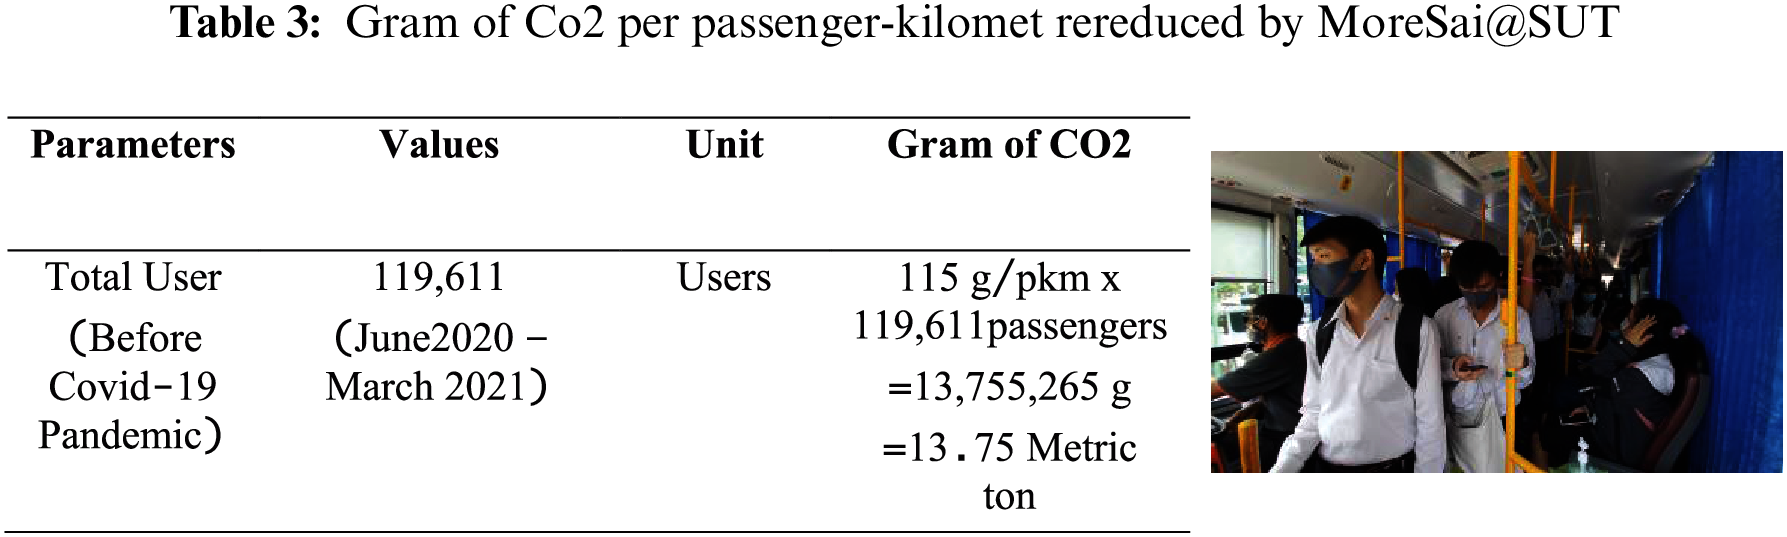
The performance measurement of SUT Smart Transit is conducted. The measurers are located according to Fig. 7. The first measurer will record the average delay per person, and the second measurer will measure the ETA and compare the result between SUT Smart Transit application and POC standard bus schedule. The third measurer will log the number of passengers on the bus. The measured data are compared with the proposed mathematical model according to Eqs. (1)–(3). Moreover, this work presents the difference between the measurement and proposed mathematical model with tuned ETA parameters according to the Tab.1. The CCTVs are installed at the main route for the determination of average service rate of the road along with the average arrival rate of the road. The average delay per person are measured and resulted in 2.7 s/person. Hence, the maximum capacity of 40 passengers produces 108 s of delay or ETA error. The Root Mean Square Error (RMSE) is selected for the declaration of the proposed model and measurement values. The SUT Smart Transit service has already served 119,611 passengers (not include special service 30,000 passengers in commencement day ceremony) from June 2020 to March 2021 before the Covid-19 pandemic when the university was locked down.
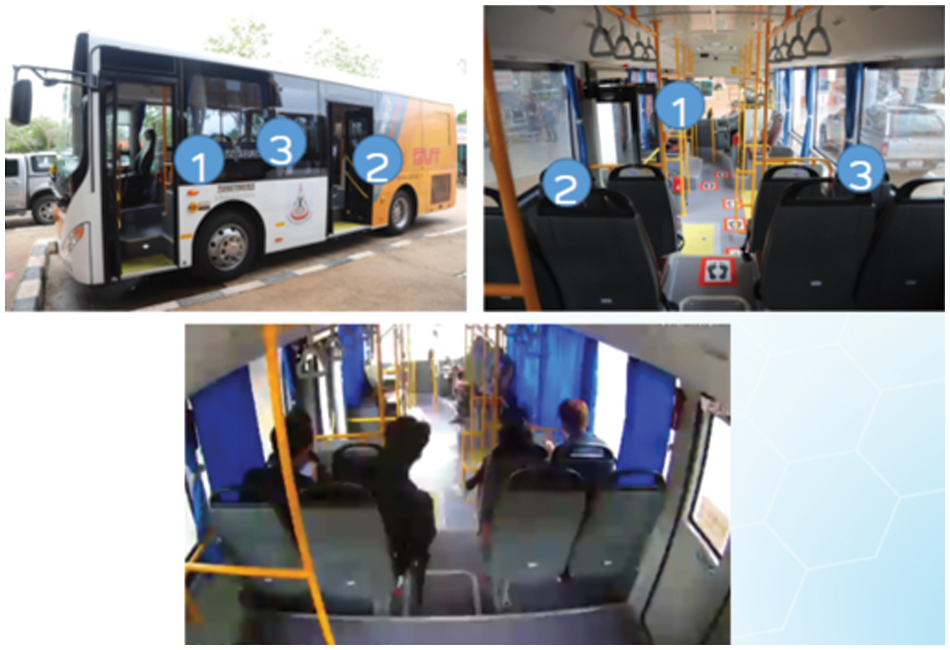
Figure 7: Measurement setup of SUT smart transmit
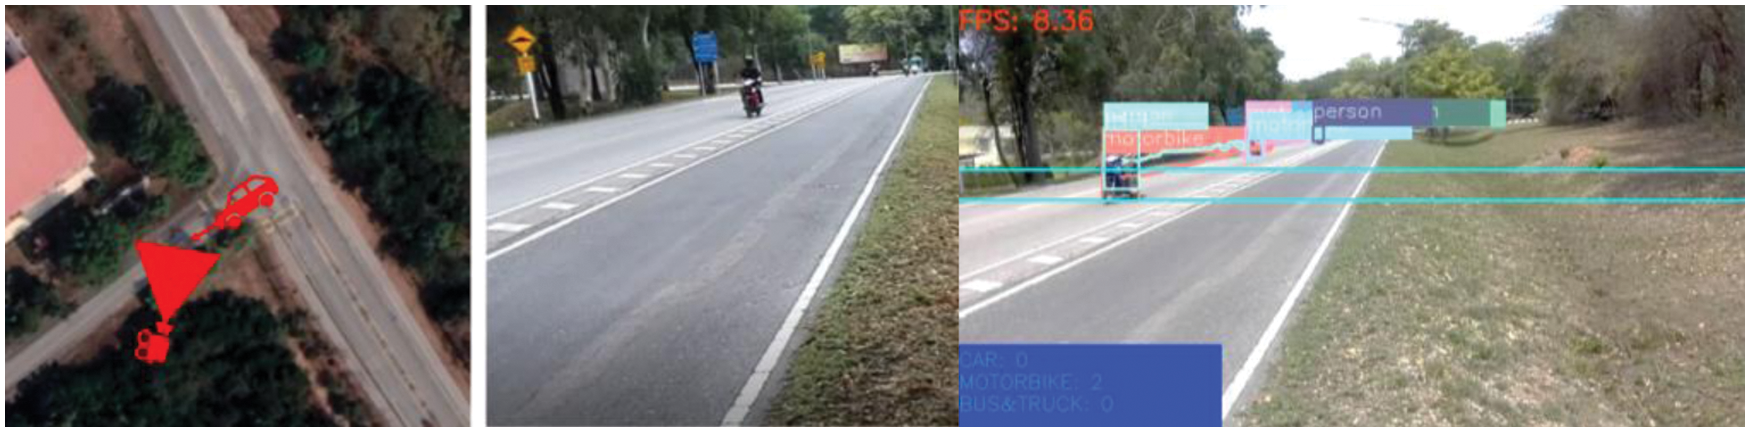
Figure 8: Vehicle count and vehicle type classification using YOLO
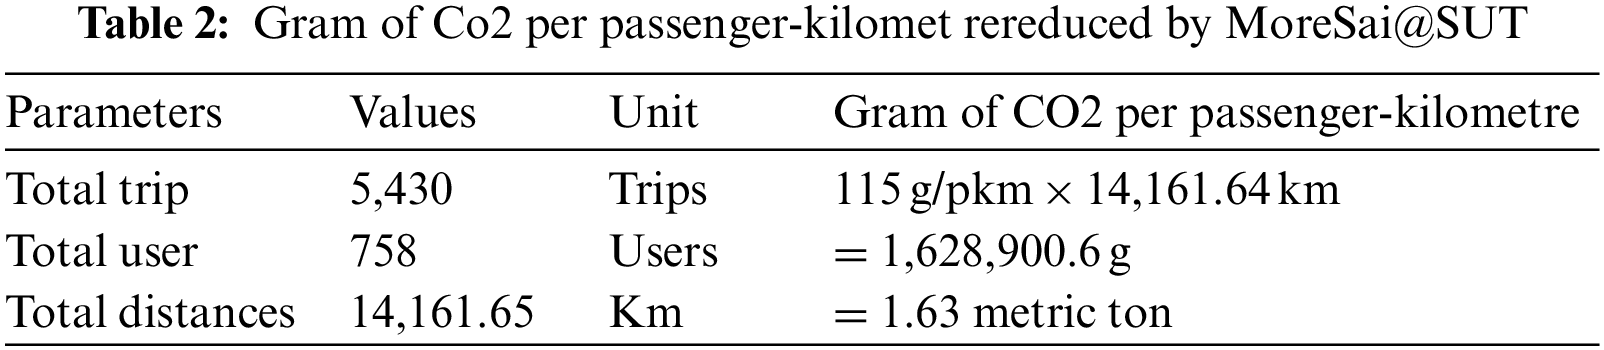
The Moresai@SUT service started in June 2020 with 796 approved users, 4,254 trips and 14,161.65 km of total travelled distance. During the service period, from June 2020–March 2021, the statistic of user number gets increased. The travelling heat maps are applied for recording the travelling trip, and the high proximity in heat maps of electric motorcycles presents the most frequently used route, which actually is the route that students travel from the dormitory area to study buildings. The measurement of fleet management is collected by Moresai@SUT staffs. The numbers of electric motorcycles that are on move in terms of their status from one station to another station are collected. Also, the battery usage and charging data are collected and are monitored via Moresai@SUT system database. The real time positions, percentage of battery and real time speed are recorded. Also, the heat maps of electric motorcycles travelling around SUT campus are plotted. The real environment dataset depends on student and the government policy. Thus, collecting fleet management dataset is the group of parameters which needs to be improved and updated after every service period.
5 Experimental Results and Discussions
The experimental results and discussions are explained in this section. The total time trips are shown in the Fig. 9 and results indicate about 2.99 min as the difference between the measured and proposed model. This is due to delays because of traffic, such as the number of vehicles on the road during the service period vary according to the timetable of students. Some bus drivers might take unexpected longer time since they waited for students who were running into the service bus at the bus stop. The delay might also come from other situations, such as traffic guards were on duty to control the traffic situation on the service route. The maximum RMSE between the measured and proposed mathematical model is the yellow route. The students from the dormitory area take service bus to market in front of the university.
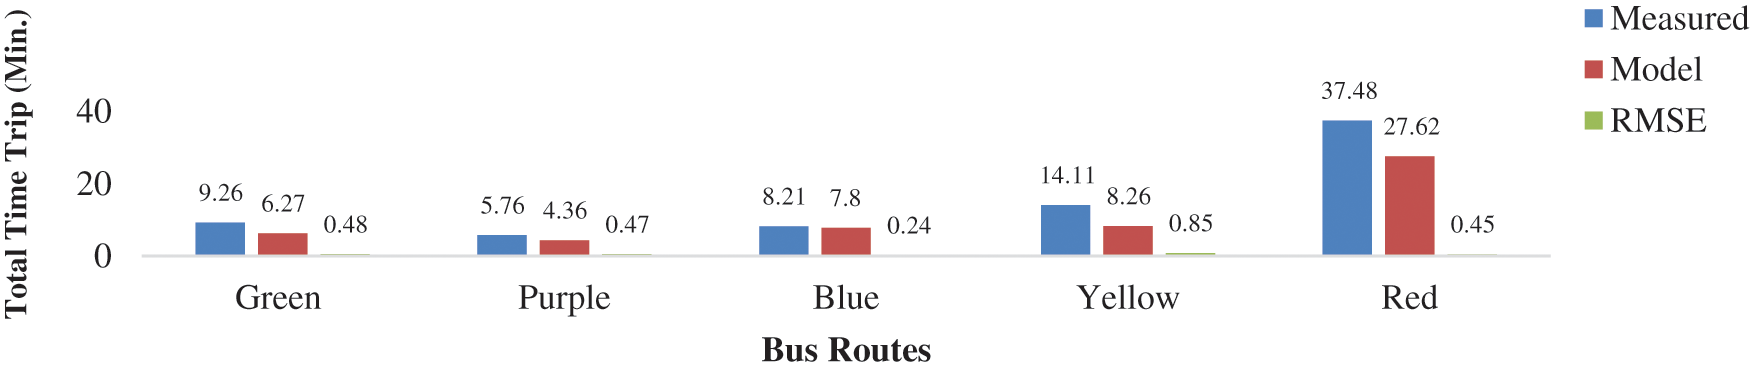
Figure 9: Total time trip
The bus driver also waited for the passengers who took a yellow route services bus when going back to the dormitory. Also, the waiting of passenger introduces more ETA error. However, the orange services route data does not appear in these results due to Covid-19 pandemic. Most students use personal vehicles for travelling to the laboratory zone. In the Fig. 10, the time between bus stops of green service route is also presented. The maximum RMSE occurred at the final hop (Sport Complex-B1 Building) because the bus stop is far from the sport complex. Then, bus driver must wait for the passengers approaching to the bus stop. As result, ETA error is occurred due to such problems. The purple service route is presented in Fig. 11. The passengers took a service bus with longer period and introduced more ETA error. The Fig. 12 shows the data from the blue service route. The Surawiwat-S17 measured value is less than the model due to the fact that low number of students lives in the S17 dormitory. The yellow service route data is depicted in Fig. 13. The S16-S1 produces maximum RMSE due to the bus stops that are far from the dormitory building. The bus drivers waited for the passenger when passengers were running to the bus. Moreover, the delay due to the traffic is another issue in these hops. This route is in the main traffic of the campus. As a result, the yellow route bus drivers will be more aware by considering the safety issue, when the bus crosses the main traffic. Also, the measured result is higher than the proposed model due to the real situation on the service route. The red service route is shown according to the Fig. 14, and the seven buses serve from 09.00 am. to 09.00 pm. The service interval time is 15 min between the current and next service bus. The red service route is a long distance with 45 min to end the trips. The difference between the measured and proposed model is 0.45 min. The comparison of red service route is significant due to the long service period. Another parameter which affects the ETA is the average delay per person, which is collected by measurers on the bus. The average delay per person of purple service route is more than green service route because purple service route serves for female students from the female dormitory zone. The male students have more flexibility for self-preparation and travelling by the bus than female students due to their uniforms. The blue service route produces maximum average delay per person due to the passengers being sick or have some abnormal symptoms and need to travel to the university hospital. Moreover, a long service period in red service route produces the delay of 2.7 sec per person (Fig. 15). Also, the maximum capacity of passenger is 40 passengers. Then, the total maximum delay is 108 s which affect the ETA error and on time bus services. However, smart transit can reduce average delay per person with new passenger counting method, such as passenger counting with CCTVs on the bus. Finally, the measurement results and the proposed system results introduce ETA error depending on the delay due to real environment traffic, number of intersections in service routes, average service rate of the road, average arrival rate of the road and passengers’ behavior with average delay per person. The measurement results of Moresai@SUT as shown in Fig. 16 afer the three months of the project. The top five parking positions are B1 study building, S4 dormitory, S7 dormitory, Gate4 market and the Gate1 market. Also, the heat map data in January 2021 shows high usage rate at the SUT reservoir running park. The orange color increases in the SUT Technopolis zone, which is near to the university bus station. The Moresai@SUT usage is presented in the Fig. 17. However, the government made lock down policy in Covid-19 pandemic, and most of the students went back to their hometown. As a result, the statistic of new users get reduced. The high usage Moresai@SUT is shown in orange color compared to the early state of this MoreSai@SUT project. This work proposes Multi-Mode Transportation system in SUT campus. The sharing economy is presented as a minor transportation system. Major transportation system, the campus bus service is still running on time. Moreover, the causes of ETA error are introduced in this work. The utilization of ITS technology, new electronics device and electric vehicles increase the convenience of passengers with more choices of transportations. Moreover, the reduction of CO2 per passenger-kilometer with the help of the proposed system is shown in the Tabs. 2 and 3.
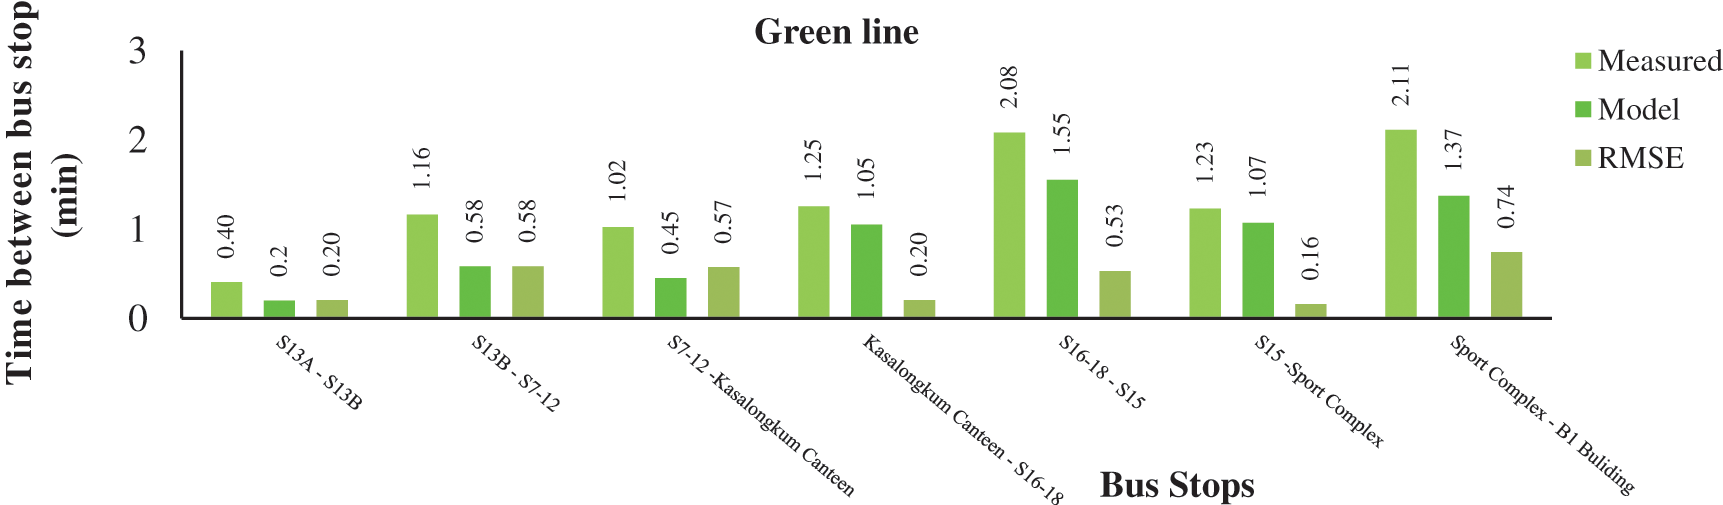
Figure 10: Comparison of green line ETA between measurement and proposed model
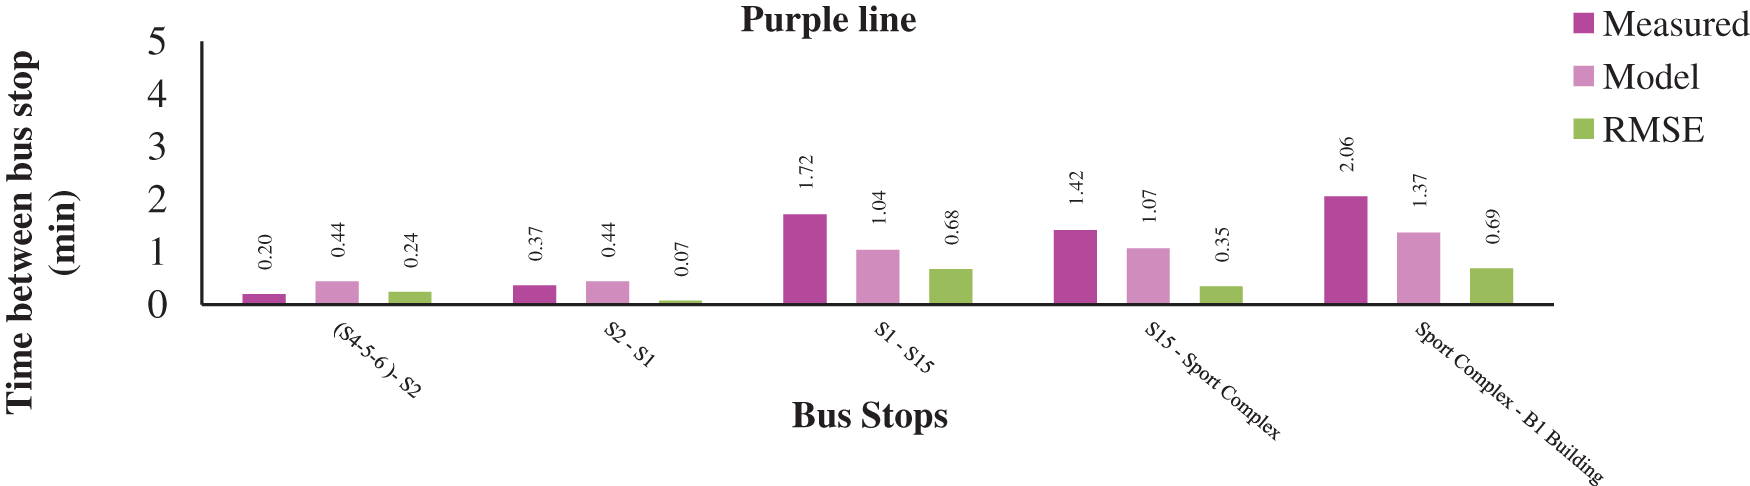
Figure 11: Comparison of purple line ETA between measurement and proposed model
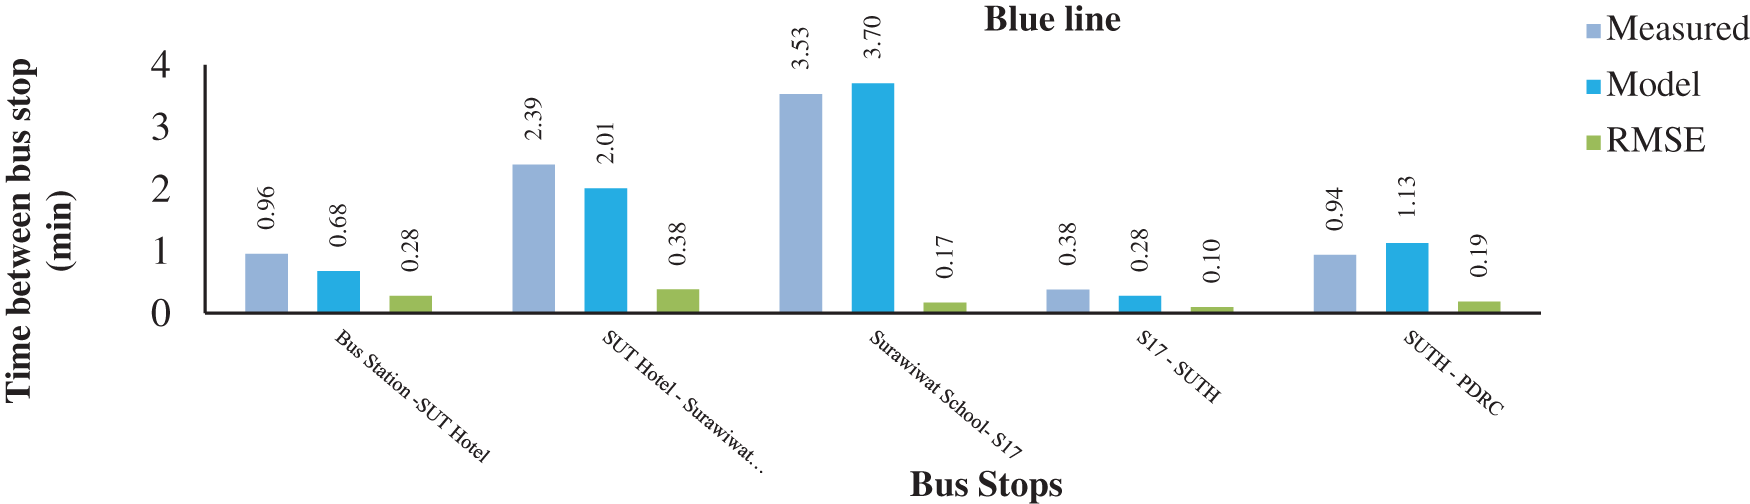
Figure 12: Comparison of blue line ETA between measurement and proposed model
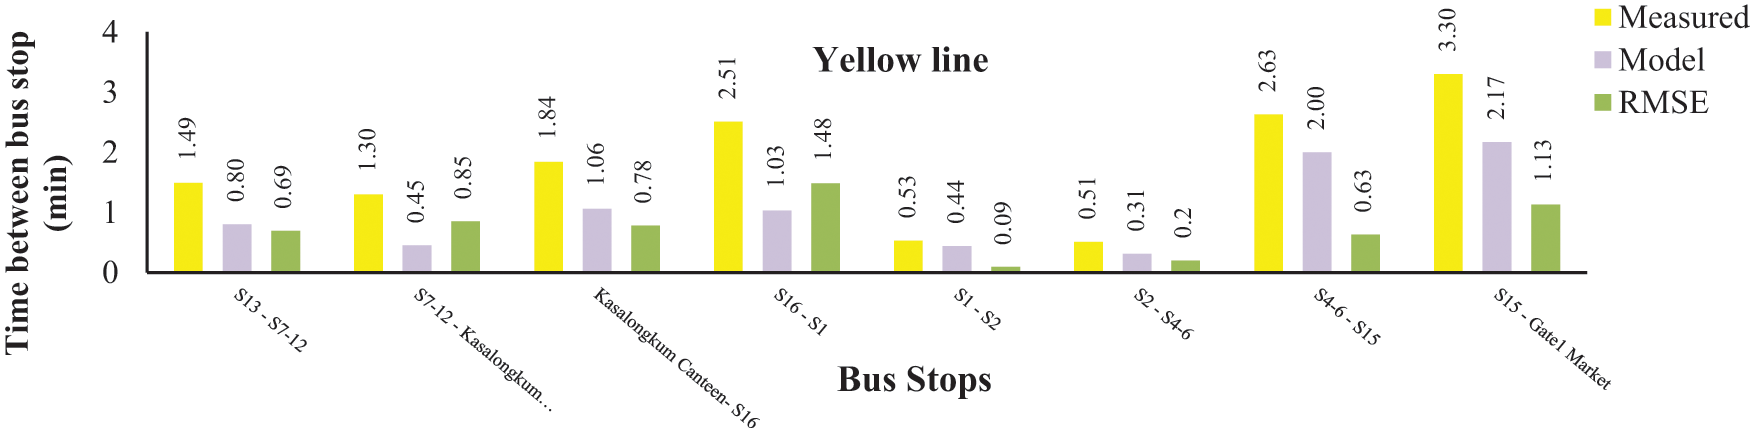
Figure 13: Comparison of yellow line ETA between measurement and proposed model
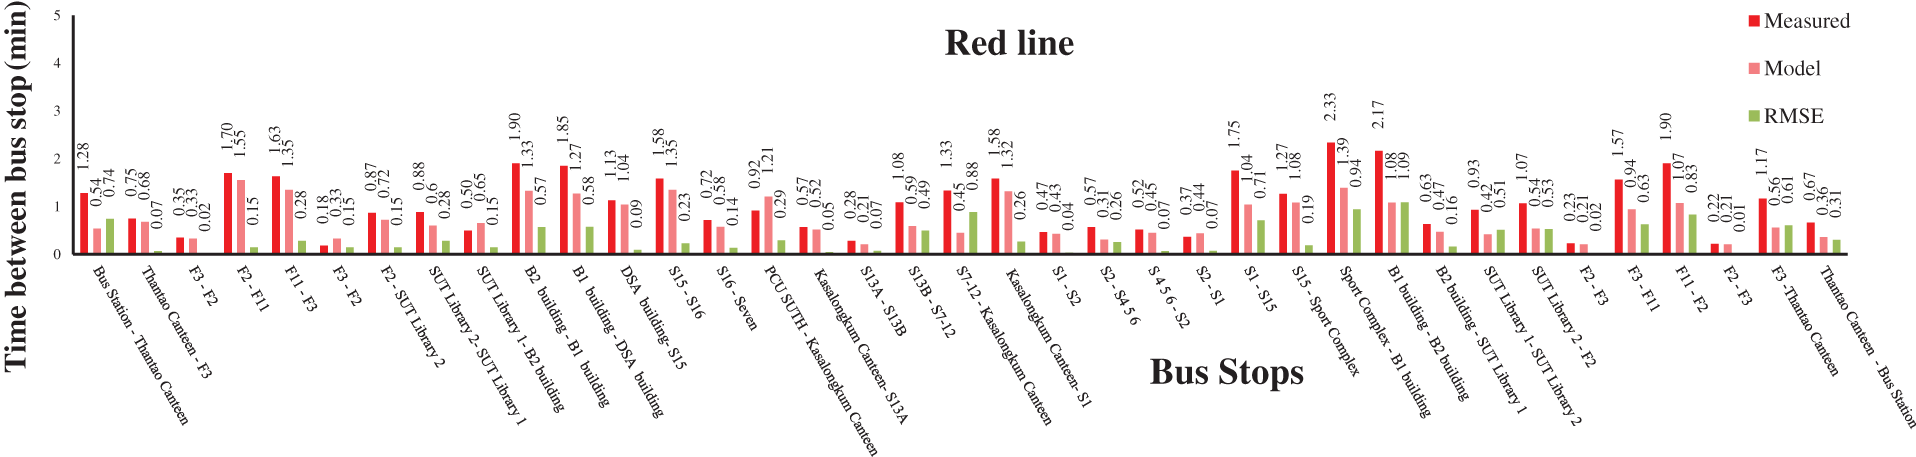
Figure 14: Comparison of red line ETA between measurement and proposed model
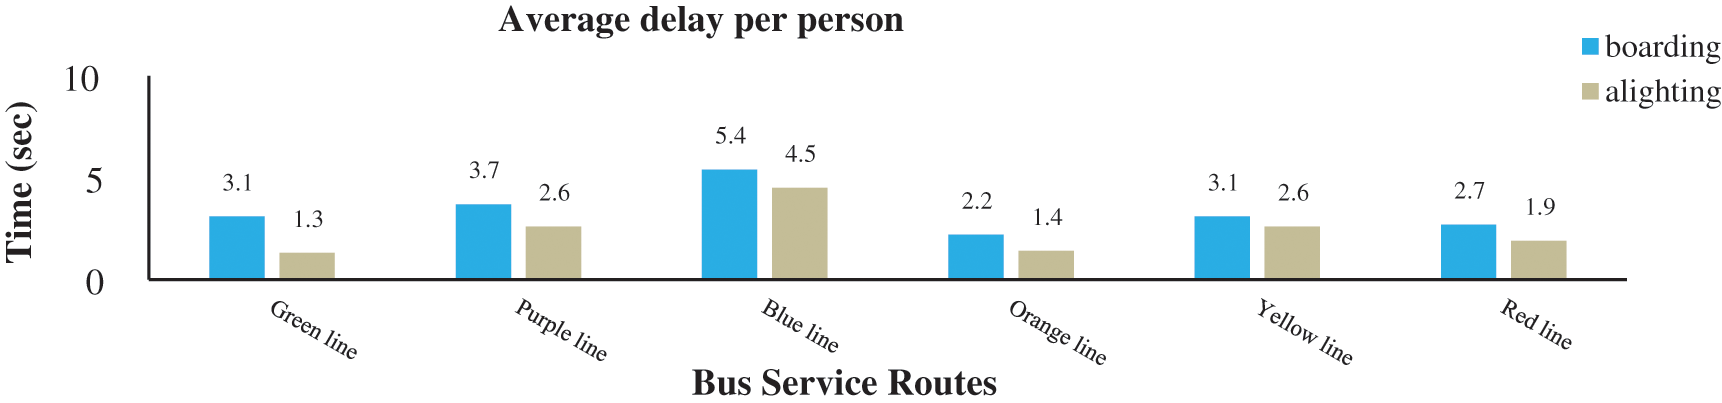
Figure 15: Average delay per person
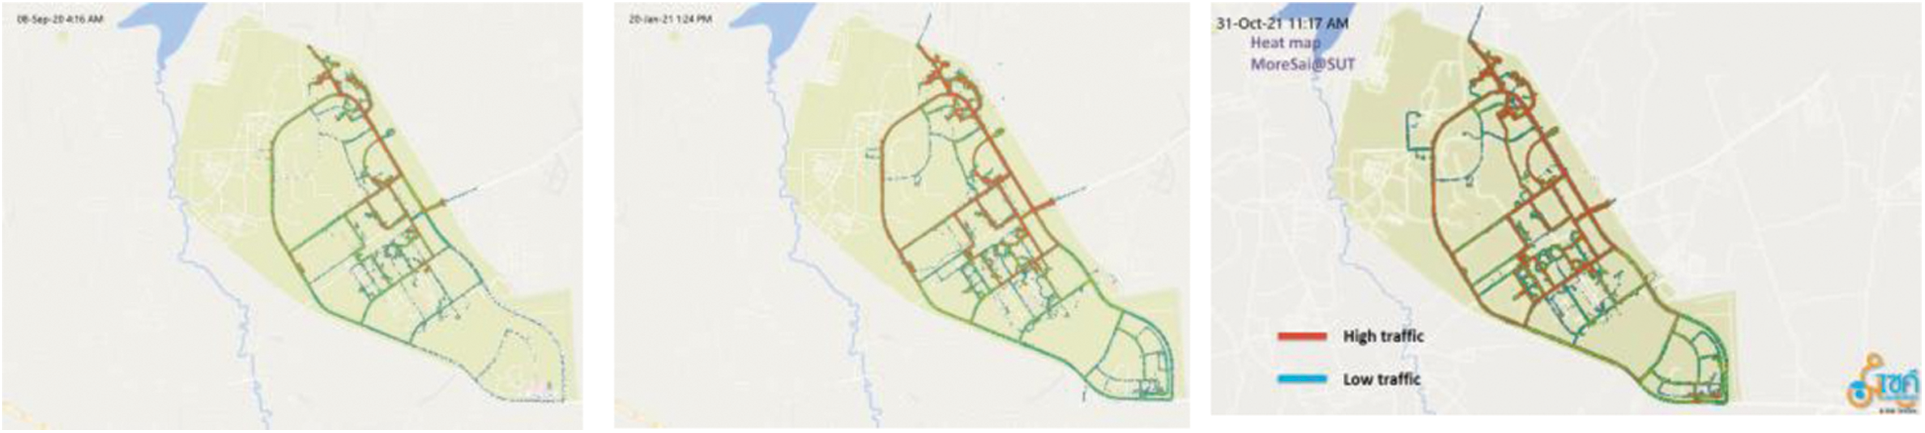
Figure 16: Moresai@SUT heat maps
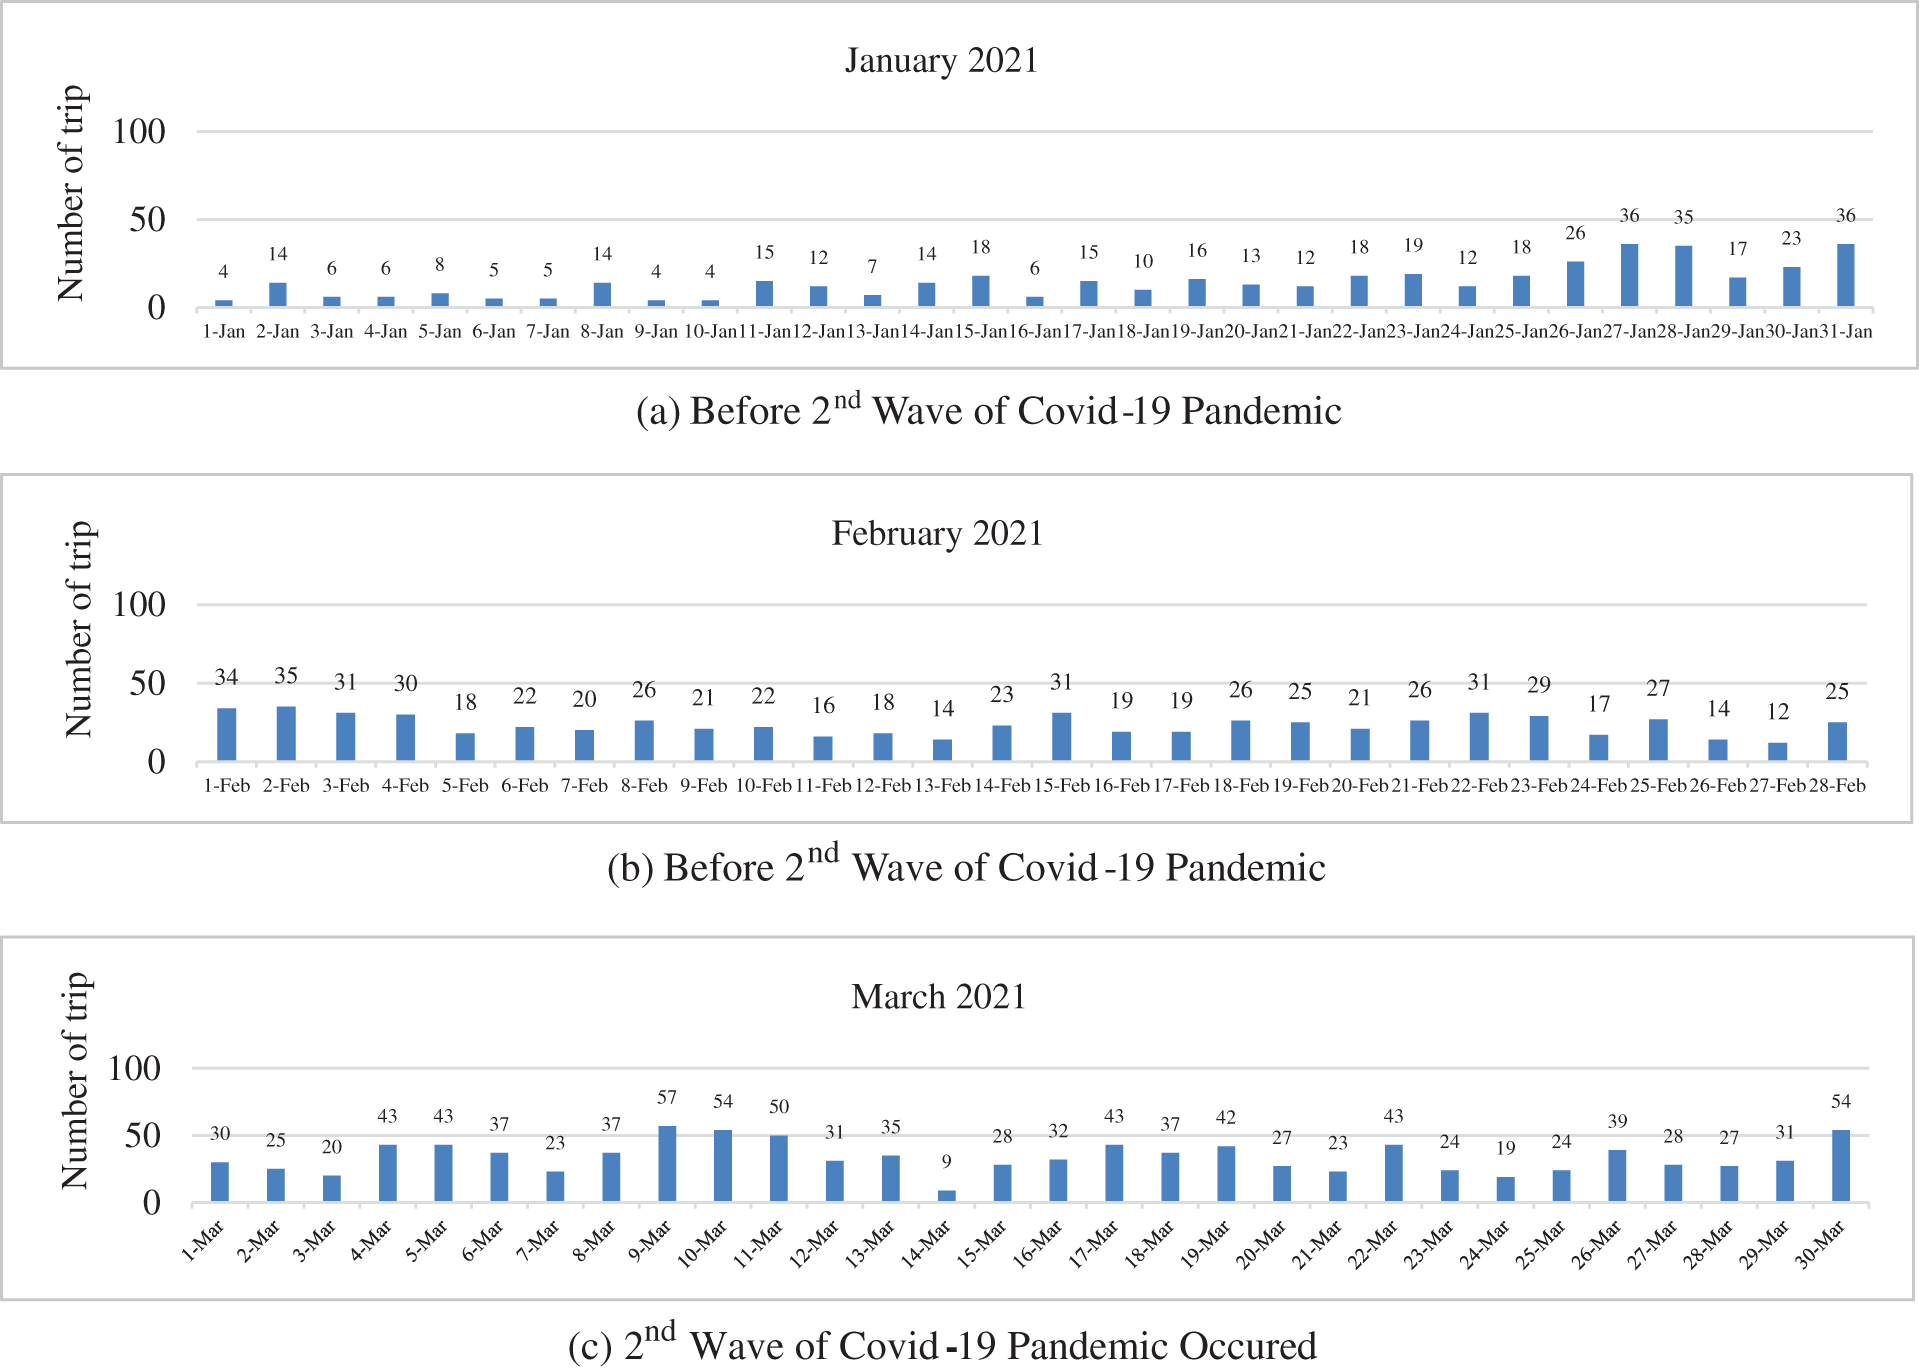
Figure 17: Number of trip
This work proposed Multi-Mode Transportation system with the ITS technology. Actually, we effectively applied multi-mode transportation system by using public mass transportation system via campus bus service and smart electric motorcycle sharing by using the V2N technology. Also, the CCVT cameras were deployed in the main service routes with the aim of classifying and counting vehicles by using the YOLO algorithm. Moreover, the 4G LTE modules and OBU were used in V2N to send the real time speed and location to the cloud. The received data was then applied in the proposed mathematical model to compute the Estimated Time of Arrival (ETA). Using ITS on the campus bus service provided more attractiveness to users along with having the potential to reduce the number of personal vehicles in the campus area, as unveiled in the final experimental result.
Moreover, the real environment implementation of SUT Smart Transit and Moresai@SUT model were presented. The Multi-Mode Transportation system provided more choices of transportation service. The experimental results showed that the reduction in CO2 of about 13.75 metrix ton before the Covid-19 pandemic. The statistical data showed that the number of accidents in the campus got decreased, when this Multi-Mode Transportation was used, as the usage of personal vehicles got reduced. Hence, this transportation system has more attractiveness to users compared to the conventional transportation system. However, reducing of ETA error, passenger feedbacks improvement and API development between SUT Smart Transit and MoreSai@SUT application will be created. An accurate ETA introduces on time services, which increased the number of passengers. Moreover, with the recent developments in AI [31–34], the performance of the system will be further improved.
Funding Statement: This work was supported by Suranaree University of Technology (SUT). The authors would also like to thank SUT Smart Transit and Thai AI for supporting the experimental and datasets.
Conflicts of Interest: The authors declare that they have no conflicts of interest to report regarding the present study.
References
1. A. A. Khan, “Energy efficient design of 5G massive MIMO,” Ph.D. dissertation, Suranaree University of Technology, Thailand, 2018. [Google Scholar]
2. A. A. Khan, P. Uthansakul, P. Duangmanee and M. Uthansakul, “Energy efficient design of massive MIMO by considering the effects of nonlinear amplifiers,” Energies, vol. 11, pp. 1045, 2018. [Google Scholar]
3. P. Uthansakul and A. A. Khan, “Enhancing the energy efficiency of mmWave massive MIMO by modifying the RF circuit configuration,” Energies, vol. 12, pp. 4356, 2019. [Google Scholar]
4. P. Uthansakul and A. A. Khan, “On the energy efficiency of millimeter wave massive MIMO based on hybrid architecture,” Energies, vol. 12, pp. 2227, 2019. [Google Scholar]
5. A. A. Khan, P. Uthansakul and M. Uthansakul, “Energy efficient design of massive MIMO by incorporating with mutual coupling,” International Journal on Communication Antenna and Propagation, vol. 7, pp. 198–207, 2017. [Google Scholar]
6. P. Uthansakul, A. A. Khan, M. Uthansakul and M. Duangmanee, “Energy efficient design of massive MIMO based on closely spaced antennas: Mutual coupling effect,” Energies, vol. 11, pp. 2029, 2018. [Google Scholar]
7. A. A. Khan, C. Wechtaisong, F. A. Khan and N. Ahmad, “A cost-efficient environment monitoring robotic vehicle for smart industries,” Computers, Materials & Continua, vol. 71, pp. 473–487, 2022. [Google Scholar]
8. A. A. Khan and F. A. Khan, “A cost-efficient radiation monitoring system for nuclear sites: Designing and implementation,” Intelligent Automation & Soft Computing, vol. 32, pp. 1357–1367, 2022. [Google Scholar]
9. P. Uthansakul, P. Anchuen, M. Uthansakul and A. A. Khan, “QoE-aware self-tuning of service priority factor for resource allocation optimization in LTE network,” IEEE Transactions on Vehicular Technology, vol. 69, pp. 887–900, 2020. [Google Scholar]
10. P. Uthansakul, P. Anchuen, M. Uthansakul and A. A. Khan, “Estimating and synthesizing QoE based on QoS measurement for improving multimedia services on cellular networks using ANN method,” IEEE Transactions on Network and Service Management, vol. 17, pp. 389–402, 2020. [Google Scholar]
11. Y. C. Chen, P. Y. Chen and C. Y. Wen, “Distributed bus information management for mobile weather monitoring,” in 15th Int. Conf. on ITS Telecommunications (ITST), Tehran, Iran, pp. 1–6, 2017. [Google Scholar]
12. C. T. Lam, B. Ng and S. H. Leong, “Prediction of bus arrival time using real-time on-line bus locations,” in 19th Int. Conf. on Communication Technology (ICCT), Xian, China, pp. 473–478, 2019. [Google Scholar]
13. R. P. S. Padmanaban, K. Divakar, L. Vanajakshi and S. C. Subramanian, “Development of a real-time bus arrival prediction system for Indian traffic conditions,” IET Intelligent Transport Systems, vol. 4, no. 3, pp. 189–200, 2010. [Google Scholar]
14. W. H. Lin and R. L. Bertini, “Modeling schedule recovery processes in transit operations for bus arrival time prediction,”Journal of Advanced Transportation, vol. 38, no. 3, pp. 347–365, 2004. [Google Scholar]
15. C. Dagmar and N. Horňáková, “Mobility Internet of Things 2018: Mobility IoT” (EAI/SpringerInnovations in Communication and ComputingCagáňová, Dagmar, Horňáková, Natália:9783030309107: Books (amazon.com). [Google Scholar]
16. E. Suryani, R. A. Hendrawan, P. F. EAdipraja, A. Wibisono and L. P. Dewi, “Modelling reliability of transportation systems to reduce traffic congestion,” Journal of Physics: Conference Series, vol. 1196, no. 1, pp. 1–7, 2019. [Google Scholar]
17. R. Nair and E. Miller-Hooks, “Fleet management for vehicle sharing operations,”Transportation Science, vol. 45, no. 4, pp. 524–540, 2011. [Google Scholar]
18. P. DeMaio, “Bike-sharing: History, impacts, models of provision, and future,”Journal of Public Transportation, vol. 12, no. 4, pp. 41–56, 2009. [Google Scholar]
19. E. Fishman, “Bikeshare: A review of recent literature,”Transport Reviews, vol. 36, no. 1, pp. 92–113, 2016. [Google Scholar]
20. I. Méndez-Manjón, P. Plasencia-Lozano and E. Pantiga-Facal, “A GIS-based evaluation of the motorcycle sharing systems in Spain,”Transportation Research Procedia, vol. 58, pp. 487–494, 2021. [Google Scholar]
21. T. Hodges, “Public transportation’s role in responding to climate change,”Diane Publishing, 2010. http://www.dianepublishing.net/ProductDetails.asp?ProductCode=1437933610. [Google Scholar]
22. P. Anchuen, P. Uthansakul, M. Uthansakul and S. Poochaya, “Fleet optimization of smart electric motorcycle system using deep reinforcement learning,” Computers, Materials & Continua, vol. 71, no. 1, pp. 1925–1943, 2022. [Google Scholar]
23. Z. Xu, W. Liang, K. C. Li, J. Xu and H. Jin, “A blockchain-based roadside unit-assisted authentication and key agreement protocol for internet of vehicles,” Journal of Parallel and Distributed Computing, vol. 149, pp. 29–39, 2021. [Google Scholar]
24. B. Yin and X. T. Wei, “Communication-efficient data aggregation tree construction for complex queries in IoT applications,” IEEE Internet of Things Journal, vol. 6, no. 2, pp. 3352–3363, 2018. [Google Scholar]
25. S. M. He, K. Xie, K. X. Xie, C. Xu and J. Wang, “Interference-aware multisource transmission in multiradio and multichannel wireless network,” IEEE Systems Journal, vol. 13, no. 3, pp. 2507–2518, 2019. [Google Scholar]
26. Y. S. Luo, K. Yang, Q. Tang, J. Zhang and B. Xiong, “A multi-criteria network-aware service composition algorithm in wireless environments,” Computer Communications, vol. 35, no. 15, pp. 1882–1892, 2012. [Google Scholar]
27. Z. F. Liao, J. B. Liang and C. C. Feng, “Mobile relay deployment in multihop relay networks,” Computer Communications, vol. 112, no. 1, pp. 14–21, 2017. [Google Scholar]
28. B. Yin and J. Lu, “A cost-efficient framework for crowd sourced data collection in vehicular networks,” IEEE Internet of Things Journal, vol. 8, no. 17, pp. 13567–13581, 2021. [Google Scholar]
29. D. Cao, B. Zheng, B. Ji, Z. Lei and C. Feng, “A robust distance-based relay selection for message dissemination in vehicular network,” Wireless Networks, vol. 26, no. 3, pp. 1755–1771, 2020. [Google Scholar]
30. K. Lakshmanna, R. Kaluri, N. Gundluru, Z. S. Alzamil, D. S. Rajput et al., “A review on deep learning techniques for IoT data,” Electronics, vol. 11, no. 10, pp. 1604, 2022. [Google Scholar]
31. S. Vinson Joshua, A. S. M. Priyadharson, R. Kannadasan, A. A. Khan, W. Lawanont et al., “Crop yield prediction using machine learning approaches on a wide spectrum,” Computers, Materials & Continua, vol. 72, no. 3, pp. 5663–5679, 2022. [Google Scholar]
32. M. B. Kamal, A. A. Khan, F. A. Khan, M. M. Ali Shahid, C. Wechtaisong et al., “An innovative approach utilizing binary-view transformer for speech recognition task,” Computers, Materials & Continua, vol. 72, no. 3, pp. 5547–5562, 2022. [Google Scholar]
33. N. Mushtaq, A. A. Khan, F. A. Khan, M. J. Ali, M. M. Ali Shahid et al., “Brain tumor segmentation using multi-view attention based ensemble network,” Computers, Materials & Continua, vol. 72, no. 3, pp. 5793–5806, 2022. [Google Scholar]
34. S. Prajam, C. Wechtaisong and A. A. Khan, “Applying machine learning approaches for network traffic forecasting,” Indian Journal of Computer Science and Engineering, vol. 13, no. 2, pp. 324–335, 2022. [Google Scholar]
 | This work is licensed under a Creative Commons Attribution 4.0 International License, which permits unrestricted use, distribution, and reproduction in any medium, provided the original work is properly cited. |