| Computers, Materials & Continua DOI:10.32604/cmc.2022.031255 | |
| Article |
Intelligent Medical Diagnostic System for Hepatitis B
1Lovely Professional University, Punjab, 144402, India
2College of Computing, Khon Kaen University, Khon Kaen, 40000, Thailand
3College of Computer Science and Engineering, Taibah University, Medina, 41477, Saudi Arabia
4Information System Department, Sheba Region University, Marib, 14400, Yemen
*Corresponding Author: Mohammed Al-Sarem. Email: msarem@taibahu.edu.sa
Received: 13 April 2022; Accepted: 10 June 2022
Abstract: The hepatitis B virus is the most deadly virus, which significantly affects the human liver. The termination of the hepatitis B virus is mandatory and can be done by taking precautions as well as a suitable cure in its introductory stage; otherwise, it will become a severe problem and make a human liver suffer from the most dangerous diseases, such as liver cancer. In this paper, two medical diagnostic systems are developed for the diagnosis of this life-threatening virus. The methodologies used to develop these models are fuzzy logic and the neuro-fuzzy technique. The diverse parameters that assist in the evaluation of performance are also determined by using the observed values from the proposed system for both developed models. The classification accuracy of a multilayered fuzzy inference system is 94%. The accuracy with which the developed medical diagnostic system by using Adaptive Network based Fuzzy Interference System (ANFIS) classifies the result corresponding to the given input is 95.55%. The comparison of both developed models on the basis of their performance parameters has been made. It is observed that the neuro-fuzzy technique-based diagnostic system has better accuracy in classifying the infected and non-infected patients as compared to the fuzzy diagnostic system. Furthermore, the performance evaluation concluded that the outcome given by the developed medical diagnostic system by using ANFIS is accurate and correct as compared to the developed fuzzy inference system and also can be used in hospitals for the diagnosis of Hepatitis B disease. In other words, the adaptive neuro-fuzzy inference system has more capability to classify the provided inputs adequately than the fuzzy inference system.
Keywords: Artificial intelligence; fuzzy logic; hepatitis B; hybrid system; medical diagnostic system; neural network; neuro-fuzzy technique
The hepatitis B is the most deadly and dangerous infection, which affects the liver of the human body [1]. Hepatitis B virus can be spread from an individual to another person by exchange of blood or any kind of body fluid. The several phases, as well as symptoms of this infection, will assist in the diagnosis by doing classification [2]. The hepatitis b disease becomes a significant issue across the world. If it is not treated in a proper way, then the death rate will rapidly increase due to cirrhosis or liver cancer [3]. At this time, there are 240 million patients with hepatitis B disease; therefore, it is vital to treat and diagnose this disease [4].
After knowing the importance of the detection of hepatitis B virus, many researchers did the research and developed brilliant as well as effective ideas for the diagnosis of this disease. The biomarkers are recognized by researchers and then used to identify the disease in its initial phase [5–7]. Different classifiers are also utilized by the researchers, such as K-star, Naïve Bayes, k-means and J48, which assists the researchers to develop a model to classify different phases of hepatitis B disease [8–10]. Several models have been developed by using data mining techniques, such as classification as well as clustering [11]. The pre-processing of the acquired dataset of hepatitis B patients is also done by using data mining approaches effectively [12].
The risk factors are predicted by using the random forest approach along with Bayesian, which assists in the identification of reactivation of this virus [13]. To improve the accuracy of already existed models, the decision tree is utilized to detect the symptoms of the hepatitis B virus [14,15]. Machine learning algorithms [16–20], such as neural network, support vector machine, fuzzy logic and hybrid networks, are also utilized for the diagnosis of hepatitis b virus [21,22]. However, all this research work lacks rationale in its performance parameters. Hence, this study is conducted to figure out the performance of an intelligent diagnostic system for hepatitis B virus in terms of better performance.
The several input variables used in the development of an intelligent diagnostic system for hepatitis B virus in layer 1 and layer 2 are given below: Layer 1: Clinical symptoms, Jaundice: Jaundice is an ailment in which the mucous membrane, skin as well as whiteness of eyes turns into a yellow color. This happens due to the high level of bilirubin. Bilirubin is a bile pigment having yellow-orange color. In this research work, there are two inputs or linguistic variables for jaundice, i.e., yes and no with different ranges, Dark Urine: The main reason for dark urine is dehydration. The dark urine represents that there are dangerous, unusual as well as excess waste products that are flowing in an individual's body. It is the main symptoms of liver diseases. The input variables used for this clinical symptom in this research work are depicting whether the patient's urine is dark or not, Abdominal Pain: Abdominal pain is a pain that arises in either the outer muscle wall or inside of the abdomen. This pain can be a normal pain or severe, and if severe, then in that condition, the patient might needs emergency care. The input variables used in the research work for this clinical symptom are different levels of pain, such as whether the pain is low, moderate or high, Vomiting: When a patient suffering from hepatitis B virus, then this disease also causes vomiting. Hence, this clinical symptom can also be considered for the detection of hepatitis B disease. In case of vomiting, the body of an individual forcefully throws out the harmful content of the stomach through the mouth of that particular patient. In this current research work, the input variables that are taken under consideration include whether the patient has the symptom of vomiting or not.
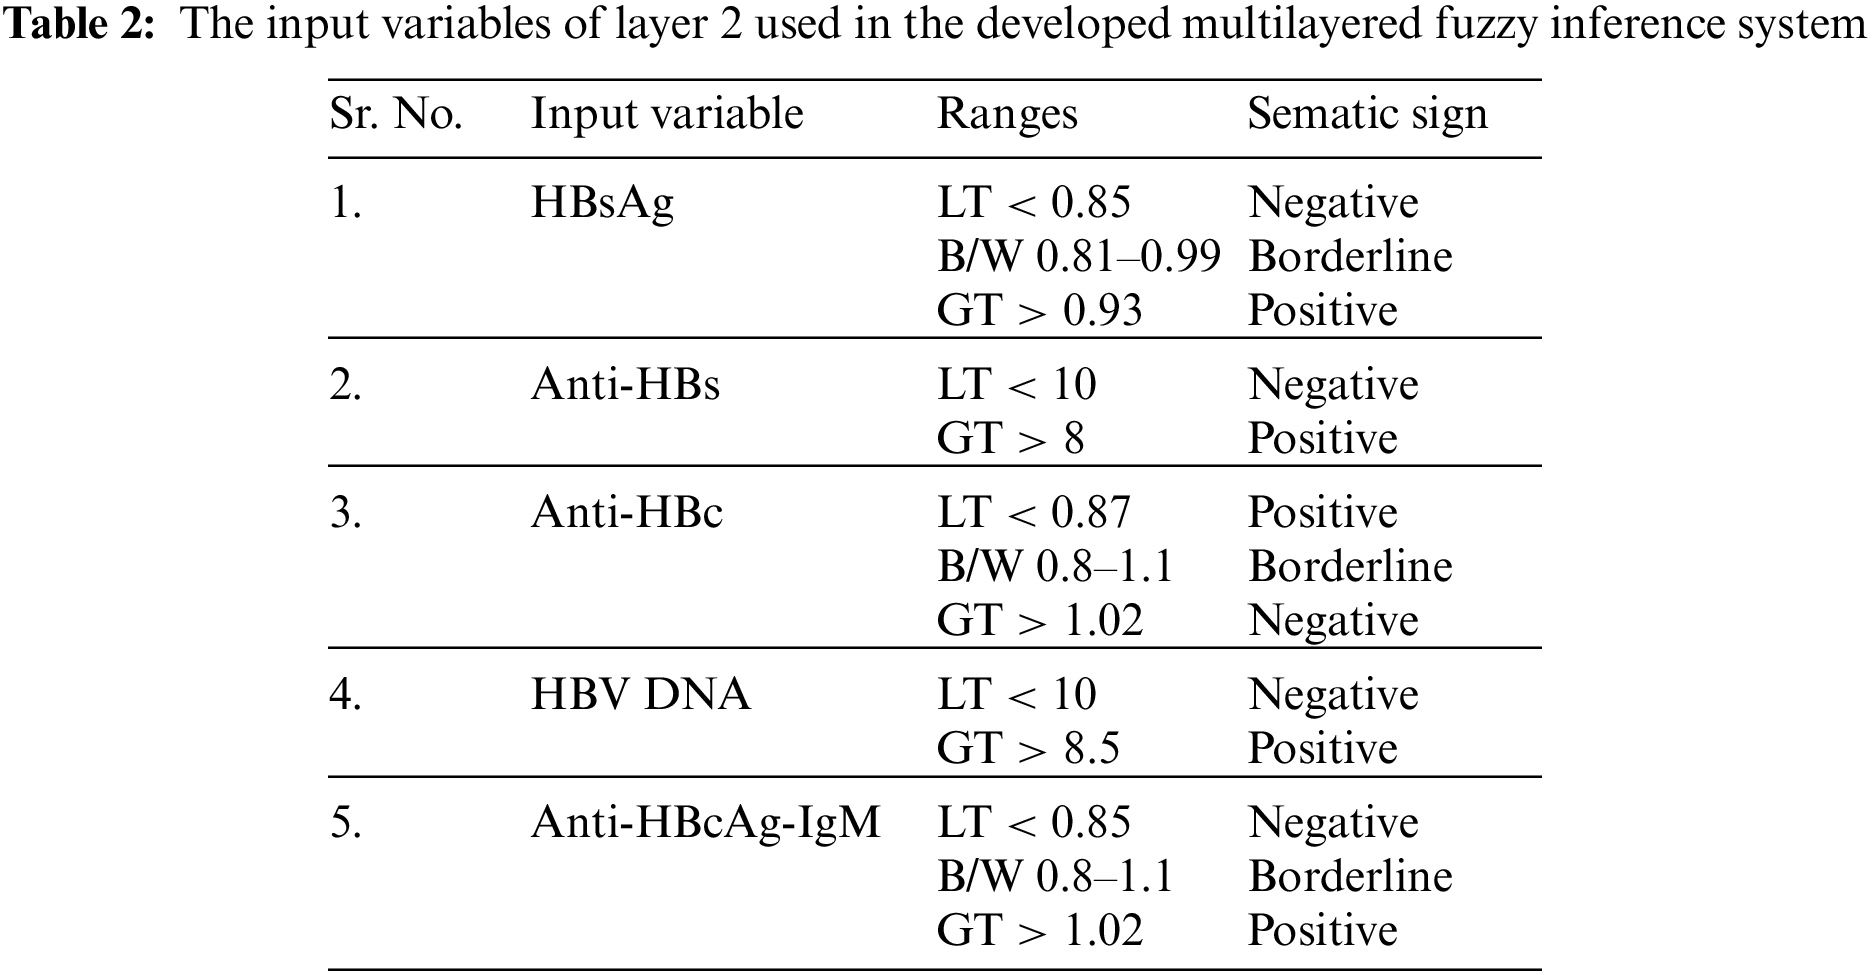
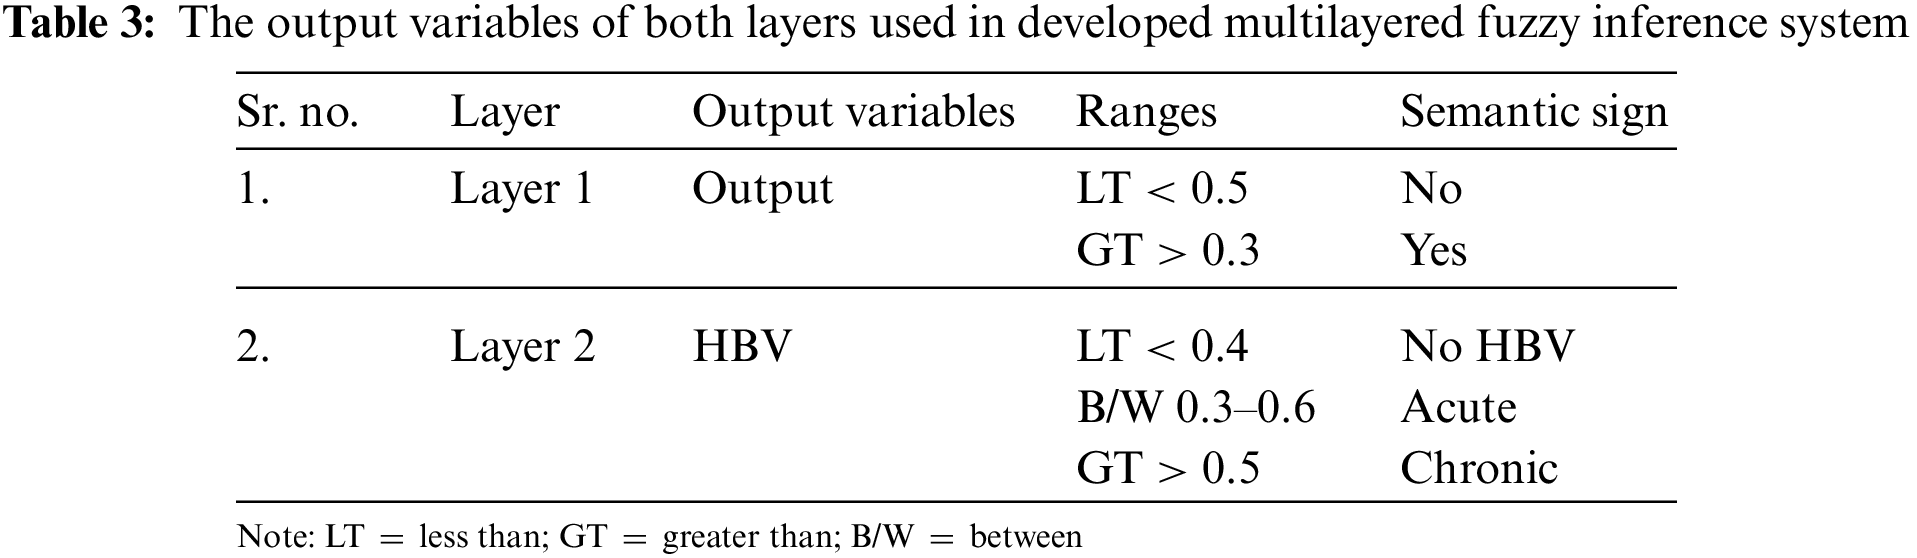
Layer 1 depicts whether the patient has hepatitis b infection or not and gives output either yes or not, Layer 2: Laboratory test, HBsAg: HBsAg is Hepatitis B Surface Antigen. It is basically a blood test in order to identify whether an individual is infected with the hepatitis B virus or not. The variable name “negative” means there is no antigen found in the patient's body. The “borderline” variable means that some antigens are observed. Similarly, the variable name “positive” means that the patient is infected and antigens are found in his or her body along with the virus, Anti-HBs: Anti-HBs is an antigen that is present in the body of an individual who takes a vaccine successfully against HBV. If the test result gives output as “positive” Anti-HBs, then it indicates that the particular person is immune enough to beat the hepatitis B virus. Similarly, if the result of an individual observed as “negative” anti-HBs, then the patient does not have enough immunity to protect his or her body from this life-threatening disease. Anti-HBc or HBcAb: The HBsAb is Hepatitis B Core Antibody. The presence of this antibody in a particular body represented the ongoing or previous infection that occurs due to the hepatitis B virus within an ambiguous time period. If the test result of a patient is “positive”, then it represents the presence of this antibody in the body of that specific patient and has an acute infection. Similarly, the “borderline” variable indicates the presence of these antibodies is acceptable, but there is a huge need to take care of it, so that the antibodies will not get increased in the future. Further, the “negative” variable shows the absence of the core antibodies of the hepatitis B virus in an individual's body, HBV DNA: HBV Deoxyribonucleic Acid (DNA) is a blood test in which the hepatitis B virus is investigated in the DNA of a patient. The “positive” HBV DNA indicates the presence of a deadly virus in the DNA of an individual. Similarly, the “negative” variable represents the absence of the hepatitis B virus in the DNA of an individual, Anti-HBcAg-IgM: The Anti-HBcAg-IgM is the initial response of a particular body to the infection spread by the hepatitis B virus. The positive result of this laboratory test depicts the recent infection of hepatitis B virus from which a patient is suffering. Similarly, a negative variable indicates that the infection is not present in the person's body.
The output of layer 2 will be either no HBV or acute or chronic, which represents the stage of the infection in a human body.
The idea of the artificial neural network was inspired by the refined functionality of the brain of human being, which contains several neurons that are interconnected with each other to process the data in parallel [23–25]. The artificial neural network is used to deal with various complicated mathematical tasks as well as large signal processing [26,27]. Through the training phase or process, the neural networks are prepared to solve a specific problem or an issue. The neurons are interconnected with each other with weights. During the training process, the weights are adjusted to reduce the chances of errors. The formula to calculate the error is subtracting the obtained value from the actual value. The artificial neural network consists of three layers that are one input layer, one or more hidden layers and, at last, an output layer. The architecture of the artificial neural network is demonstrated in Fig. 1.
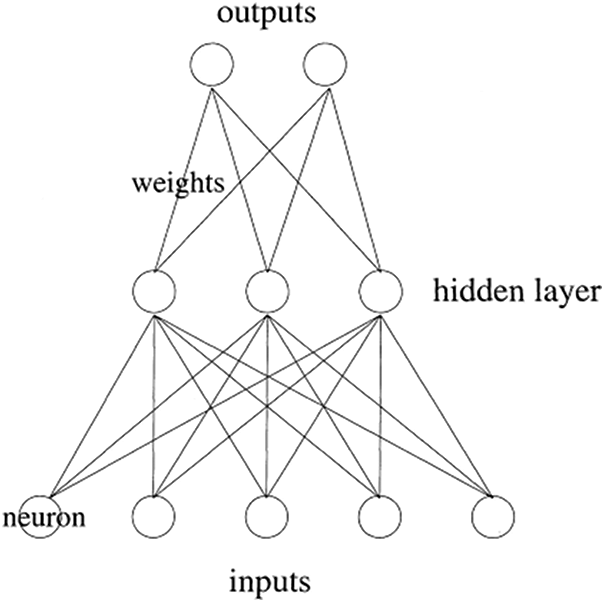
Figure 1: Artificial neural network [18]
Fuzzy logic is a methodology with the main objective of doing reasoning and making rational decisions as a human being in an uncertain as well as imprecise environment [28]. It is also considered as Multivalued logic, as it gives results between 0 and 1 or between true or false [29]. A fuzzy inference system is a machine that can make rational decisions as accurate as a human with imprecise data by using the fuzzy logic methodology. There are four components of fuzzy logic as given by [30] and also shown in Fig. 2:
• Fuzzifier: In this component, the transformation of crisp sets into fuzzy values will be done. The input provided to the system is in the form of non-fuzzy values; hence, the fuzzification process converts that input into the fuzzy set.
• Knowledge base: The knowledge base basically works as a store of information. The facts that are initially available to solve a problem and the rules that are created with the gathered data from an expert are stored in this component. The inference engine also uses the knowledge base to map the rules.
• Inference Engine: The inference engine is completely responsible for the generation of the final outcome. It maps the stored rules as well facts with respect to the provided input in the system. The outcome generated by the inference engine is in the form of fuzzy values.
• Defuzzifier: In the process of defuzzification, the transformation of fuzzy values into the crisp set has been done. The output given by the inference engine is in the form of fuzzy values, and then it passes to this component. After that, the defuzzifier converts the output into the crisp set, and this set is considered as the final outcome or final solution to a specific problem.
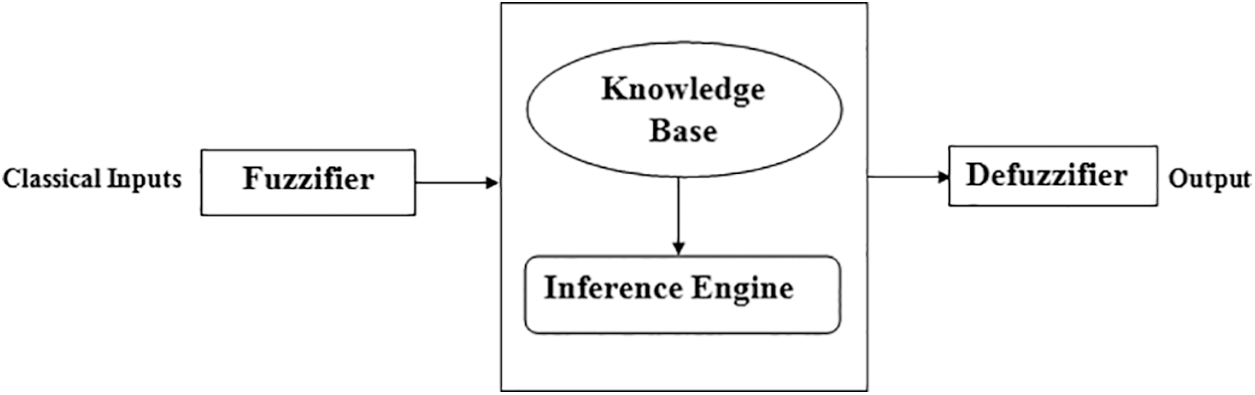
Figure 2: Architecture of fuzzy inference system
1.3 Adaptive Neuro-Fuzzy Interence System (ANFIS)
The collection of both neural network and fuzzy logic will result in a hybrid system, which is known as an adaptive neuro-fuzzy inference system [31]. To overcome those limitations of both techniques, the multilayered feed-forward neural network and Sugeno model of fuzzy logic are merged together [32,33]. This hybrid system utilises the IF-THEN rules for the classification of the provided inputs into the correct class by doing learning from a neural network [34]. The five different layers of adaptive neuro-fuzzy inference system are the Fuzzification layer, rule layer, normalization layer, defuzzification layer and summation layer [35]. The architecture of ANFIS is demonstrated in Fig. 3.
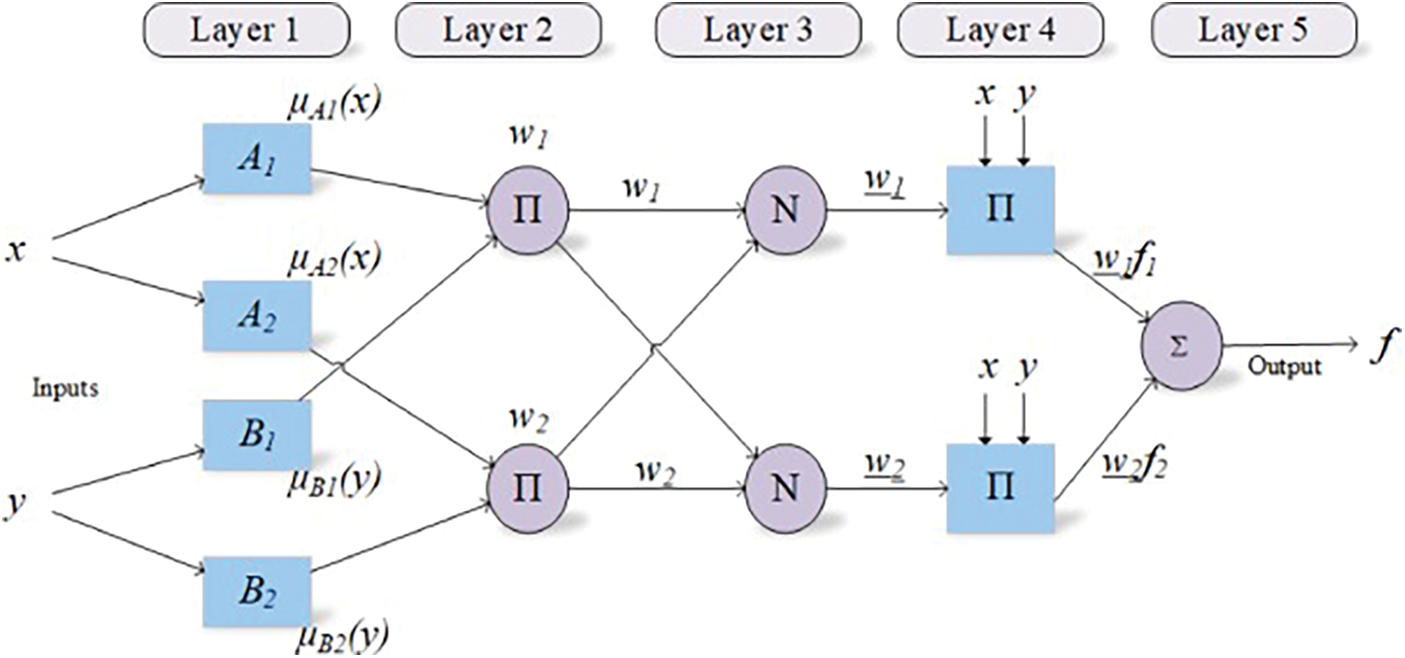
Figure 3: Architecture of ANFIS
Emon (2019) used data mining techniques to classify hepatitis B disease into different classes. The detection of Hepatitis disease is done by using relevant tests, symptoms of the disease as well as the mode of transmission. The used techniques are K-star, Naïve Bayes as well as J48 classifier with 10 fold cross-validation. Therefore, this paper suggested that the J48 classifier has the maximum accuracy i.e., 98.6% among these three methods used in this research paper.
Cheng et al. (2011) discovered several clinical symptoms which causes Hepatitis B disease at the chronic stage. This investigation has been done by using the covariance network with a mining mutation hotspot. This study found that several individuals are consistently affected by the hepatitis B virus, and also the host immune response, as well as the serum viral load, is also diversifying from one individual to another.
Leung et al. (2011) classified the hepatitis B DNA by using data mining techniques by identifying the most difficult makers that are genomic markers in HBV, which are correlated with liver cancer. In this research work, the author introduced various data mining techniques, such as classifier learning, molecular evolution analysis, classification, feature selection and clustering. By using the proposed methodology, the authors were succeeded to classify the patients and non-infected patients with 70% accuracy and 80% sensitivity.
Mahmudy (2019) used the Hierarchical k-Mean clustering to enhance the efficiency of the classical approach of clustering by using K-means. The methodology used by the author in his research work assisted in determining the initial cluster centre on the basis of the mean result provided by the hierarchical clustering method. The experiment result of this research work observed that the efficiency of hierarchical K-means clustering is better than the traditional k-means.
Wang & Liu (2017) developed a system that assists in identifying the various Hepatitis B's risk factors, which reactivates even after the radiotherapy of liver cancer of a patient. This system is proposed with the help of random forest and Bayesian classification. The accuracy with which the developed model performed classification with 5 fold cross-validation is 85.15%. In contrast, if the model uses 10 fold cross-validation, then this classification accuracy gets 84.57 percent. Similarly, if the value of k in k cross-validation is considered as 3, then the measured classification accuracy gets 83.83 percent.
Chen (2012) constructed a discriminant diagnosis model. The development of this model has been done by first selecting the attributes, decision tree C5.0 algorithms as well as then discrimination analysis. The classification accuracy was also compared by the researcher with different methodologies and by using the different inputs to the proposed system. It is observed that the accuracies, due to which the decision tree and discriminant analysis classified the disease, are 96.94% and 94.4%, respectively. These accuracies were considered as roughly the same by the researcher.
Rouhani (2009) diagnosed Hepatitis B by using the Support Vector machine as well as neural networks. The proposed network in this research work assists in classifying diseased patients into six diverse classes. These different classes are two phases of hepatitis B, two phases of hepatitis C, non-viral hepatitis and no hepatitis. It is observed that the radial basis function generates more accurate results as compared to Support Vector Macine (SVM), General Regression Neural Network (GRNN), Probabilistic Neural Network (PNN) and Least Vector Quantization (LVQ). The accuracy for the RBF network is 96.4% for testing as well as training of the dataset.
Uttreshwar (2009) presented a predicted model by using the logical inference with the GRNN (Generalized Regression Neural Networks) to identify the Hepatitis B disease. An expert system is proposed on the basis of logical inference. An effective graphical user interface is also developed by the author, which makes the efficient use of this expert system more easy. The author also presented that the developed expert system for the diagnosis of HBV has high accuracy in classifying the infected as well as non-infected patients.
Uhmn, Kim, & Kim (2007) utilized the machine techniques such as support vector machine, decision tree and decision rule to predict the harm done by liver diseases, chronic hepatitis from Single Nucleotide Polymorphism (SNP). These techniques are used to predict liver disease, i.e., chronic stage of hepatitis. The paper also showed that the decision rule, as well as the decision tree, are powerful tools that can be used for the prediction of susceptibility from SNP data to chronic hepatitis.
Mahesh et al. (2014) [36] proposed an expert system to diagnose the Hepatitis B by using the Generalized Regression Neural Network. This expert system did the classification of the patients who are suffering from this deadly disease and those who are not. In this paper, the author enlightened that the transmission modes of the hepatitis B virus are identical to HIV. Additionally, this virus can also survive for at least a week, even if it is outside the human body. In this time period, the virus can also infect individuals who are not properly vaccinated. The graphical user interface also constructed by the researcher for the developed expert system.
Areghan et al. (2019) [37] designed a system to diagnose hepatitis B disease by using genetic neural network methodology. The clinical symptoms were used by the researchers as input in the developed diagnostic system. The performance of the designed diagnostic system to diagnose the Hepatitis B disease has been measured on the basis of classification accuracy, and the observed accuracy is 99.14%.
Thakur (2018) [38] developed an expert system to diagnose the Hepatitis B virus by using fuzzy base IF-THEN rules. The various symptoms of this disease, such as HBsAb, HBsAg and HBcAb, are used as the input variables to the system and corresponding to these inputs, the system will give the output. The output variables used in the system are immune, susceptible and currently infected.
Chen et al. (2017) [39] developed a system that assisted in making a decision by using four different classical classifiers. The implemented system helps to enhance the performance for the diagnosis of hepatitis B. The classifiers that have been utilised by the researchers in this work are Random Forest, SVM, K-Nearest Neighbour and Naïve Bayes. The input fed to the system was RTE pictures of the liver. Moreover, all the classifiers are compared with each other, and according to the obtained result, the accuracy of the random forest classifier is more as compared to other classifiers.
After figuring out the limitations in the prediction of cirrhosis as well as hepatic fibrosis, Wei et al. (2018) [40] used ML techniques such as gradient boosting (GB), decision tree (DT) and radial basis (RB) for its detection. After comparing all models, it is observed that the GB model has more accurate as well as adequate result than other models. This research work also assisted in enhancing the specificity and sensitivity of the classification methods used in the existing system.
Akbari (2018) [41] used the non-linear iterative partial least square method to make the reduction of data, and the clustering task has been done by using the self-organizing map and a hybrid system, i.e., neuro-fuzzy inference system for the detection of HBV disease. The comparison of the developed methodology is also made with the existing techniques. The accuracy of the proposed model was 93.06%, and this was calculated by using Receiver Operating Characteristic (ROC).
Khan et al. (2018) [42] presented the investigation of hepatitis B virus disease in the blood serum of the human body by using the combination of pattern recognition technique and Raman spectroscopy. The classification of infected as well as non-infected patients has been done by using a support vector machine. The two distinct kernels used with SVM are Gaussian RBF and Polynomial function. The accuracy, precision, sensitivity and specificity for the diagnosis of hepatitis B disease of the developed model are 98%, 97%, 100% and 95%, respectively.
Ye et al. (2003) [43] constructed a molecular signature for the very first time by using the machine learning algorithm. It assisted in the classification of patients suffering from metastatic hepatocellular carcinoma and also helped in the identification of relevant genes to metastasis. . The Treeview and cluster software was used by the researchers to do unsupervised hierarchical clustering analysis. The researchers figured out that there is no any major difference between the matched metastatic lesion and primary HCCs.
A comprehensive survey is presented by Alan et al. (2019) [44] in which the diversity of hepatitis B virus in the population of Asia and Europe is explained in the most effective manner. Also, the development of a model is being done by using the machine learning approach. The respective work fails to make the inference about the methodology as what the developed system means corresponding to the outcome of patients. Additionally, this system only works for the respective dataset that is used for training as well as testing of the model. However, the system classifies the dataset with high accuracy. Moreover, in [45–55], the authors use the theory of deep learning for various applications such as data mining and deep learning.
3 Methodology Used for the Development of a Multilayered Fuzzy Inference System
The methodology used for the development of a multilayered fuzzy inference system for the diagnosis of hepatitis B disease is shown in Fig. 4.
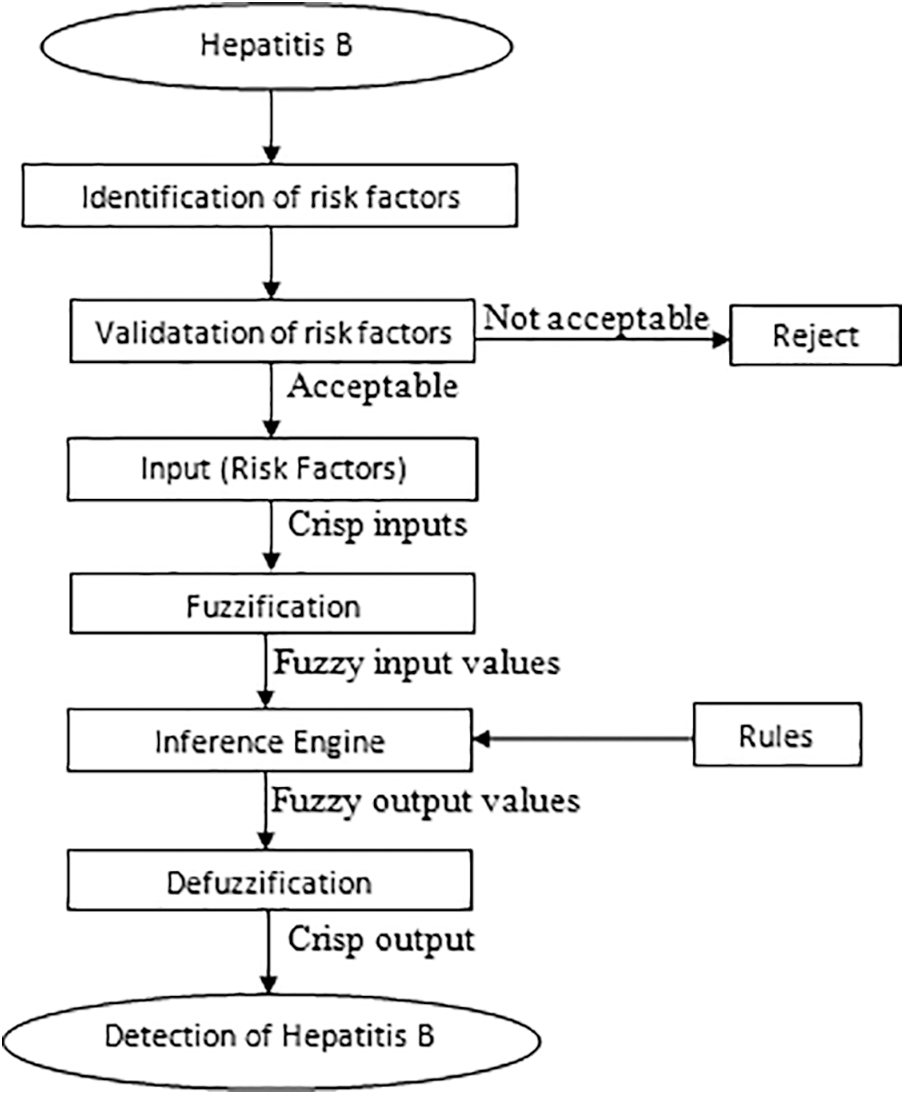
Figure 4: Methodology for the development of a multilayered fuzzy inference system
The Mamdani fuzzy model is being used in the development of a multilayered fuzzy inference system, and the software which assisted in doing this research work is MATLAB. The various input variables that are considered for layer 1 of the developed model are jaundice (J), dark urine (DU), abdominal pain (AP) and vomiting (V). Likewise, the considered input variables for layer 2 are HBsAg, Anti-HBs or HBsAb, Anti-HBc or HBcAb, HBV DNA and Anti-HBcAg-IgM.
The further explanation about these input variables of layer 1, input variable of layer 2 and output variables of both layers is shown in Tabs. 1–3, respectively. The ranges considered in the research work are according to the ranges of laboratory test of respective input variables.
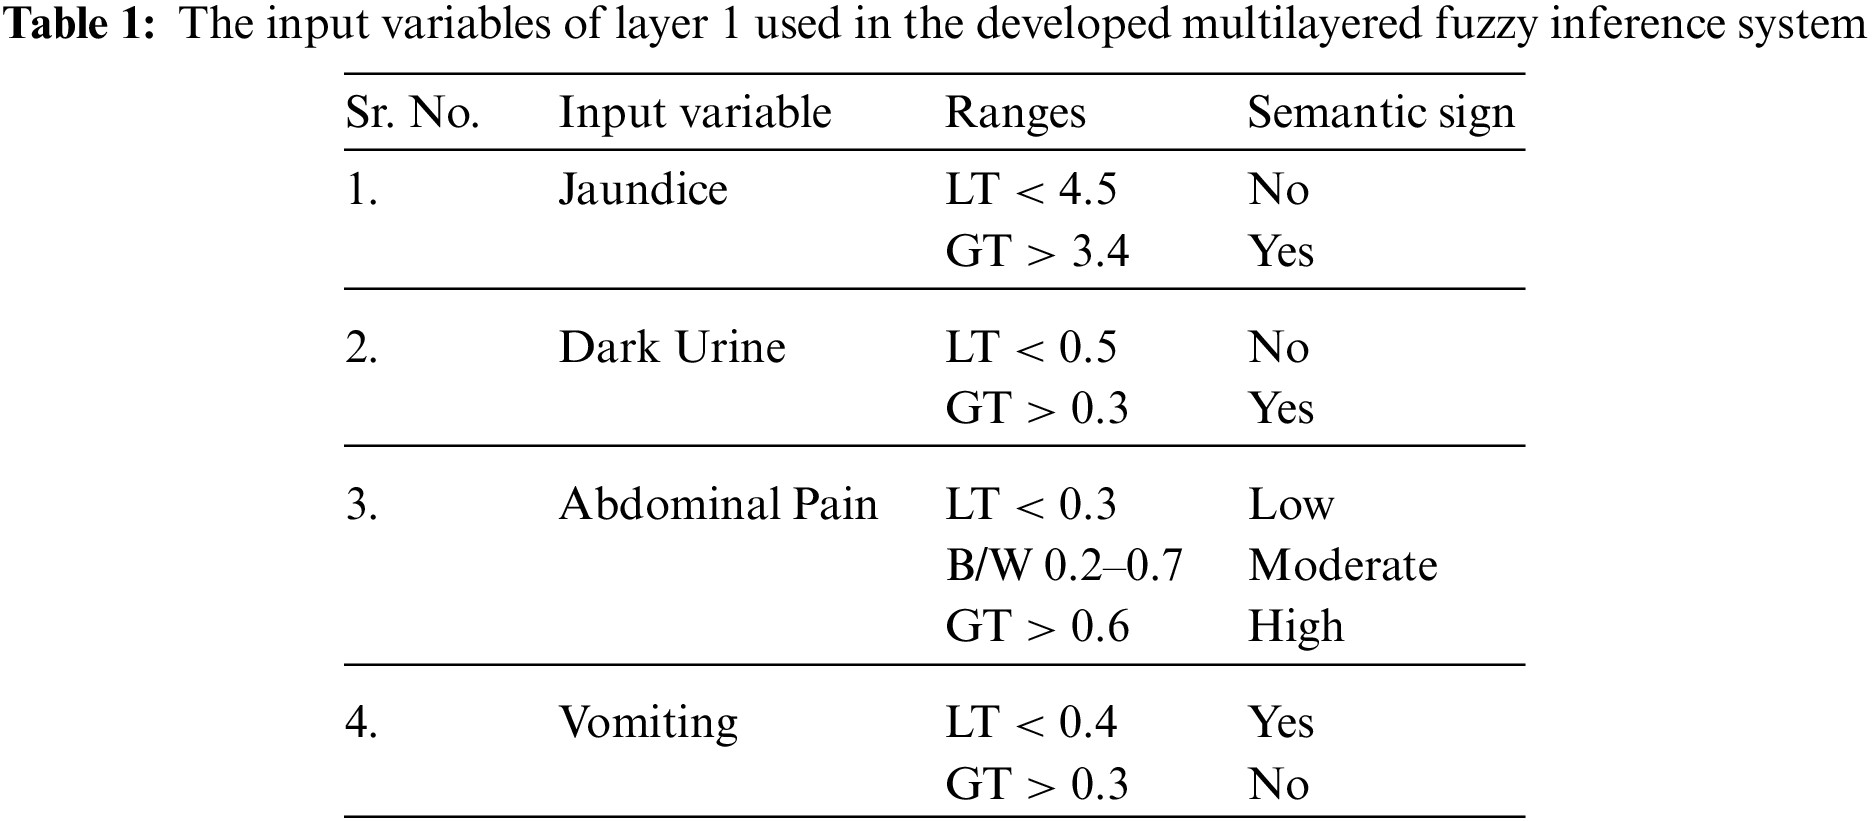
To indicate the degree of truth, the membership functions are utilized. The membership function can be defined as a statistical value that is provided to the variables of the developed model to solve a particular problem. In this research work, the trapezoidal membership functions are used for both inputs as well as output variables.
The generated rules and facts have an essential role in the development of the medical diagnostic system. The accuracy of the classification and other performance parameters directly depends on these generated input-output rules. Hence, the knowledge should be acquired accurately from the expert in order to make correct, appropriate as well as adequate input-output rules and facts. The form of the generated rules is the IF-THEN form in the case of the Mamdani system of fuzzy logic. Figs. 5 and 6 shows the frameworks of rules for layer 1 as well as layer 2.
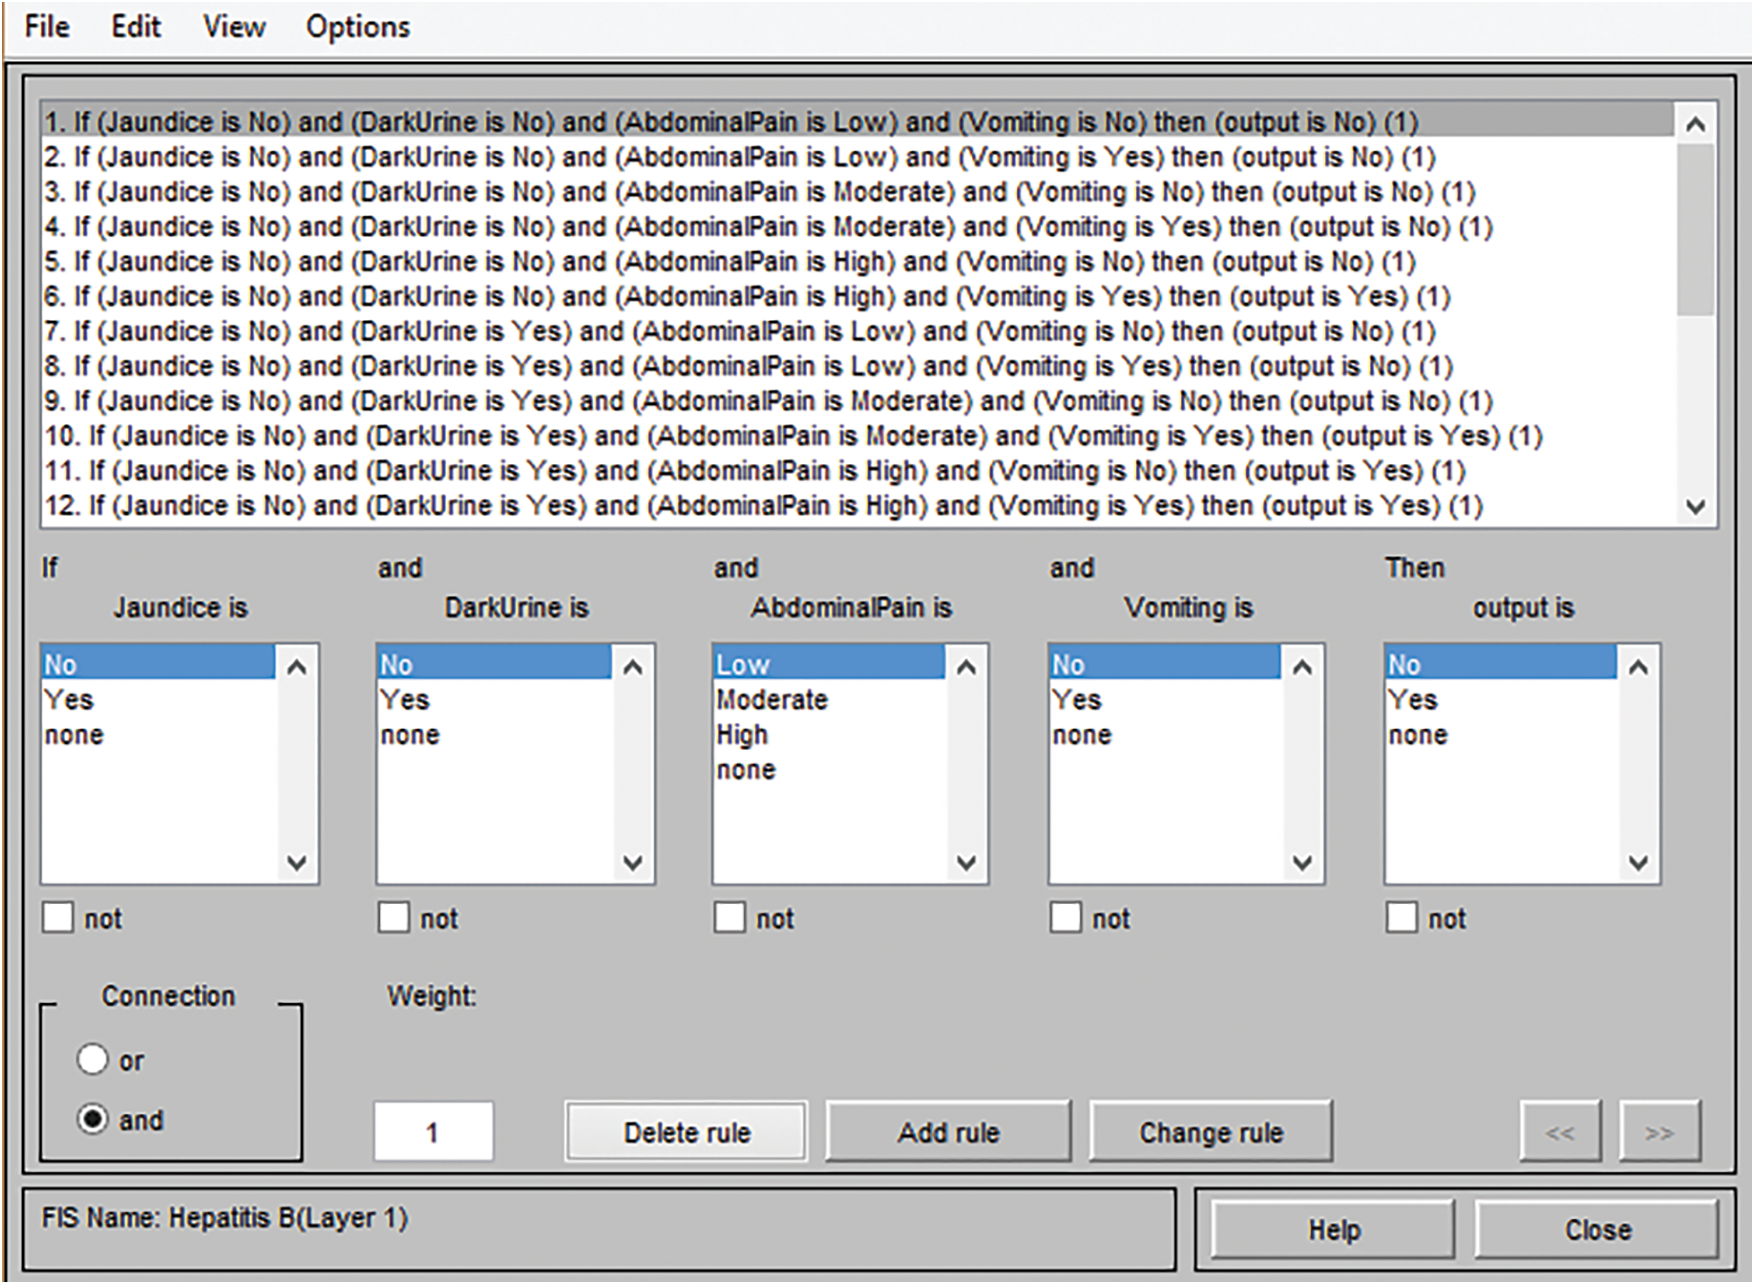
Figure 5: Framework of rules for layer 1
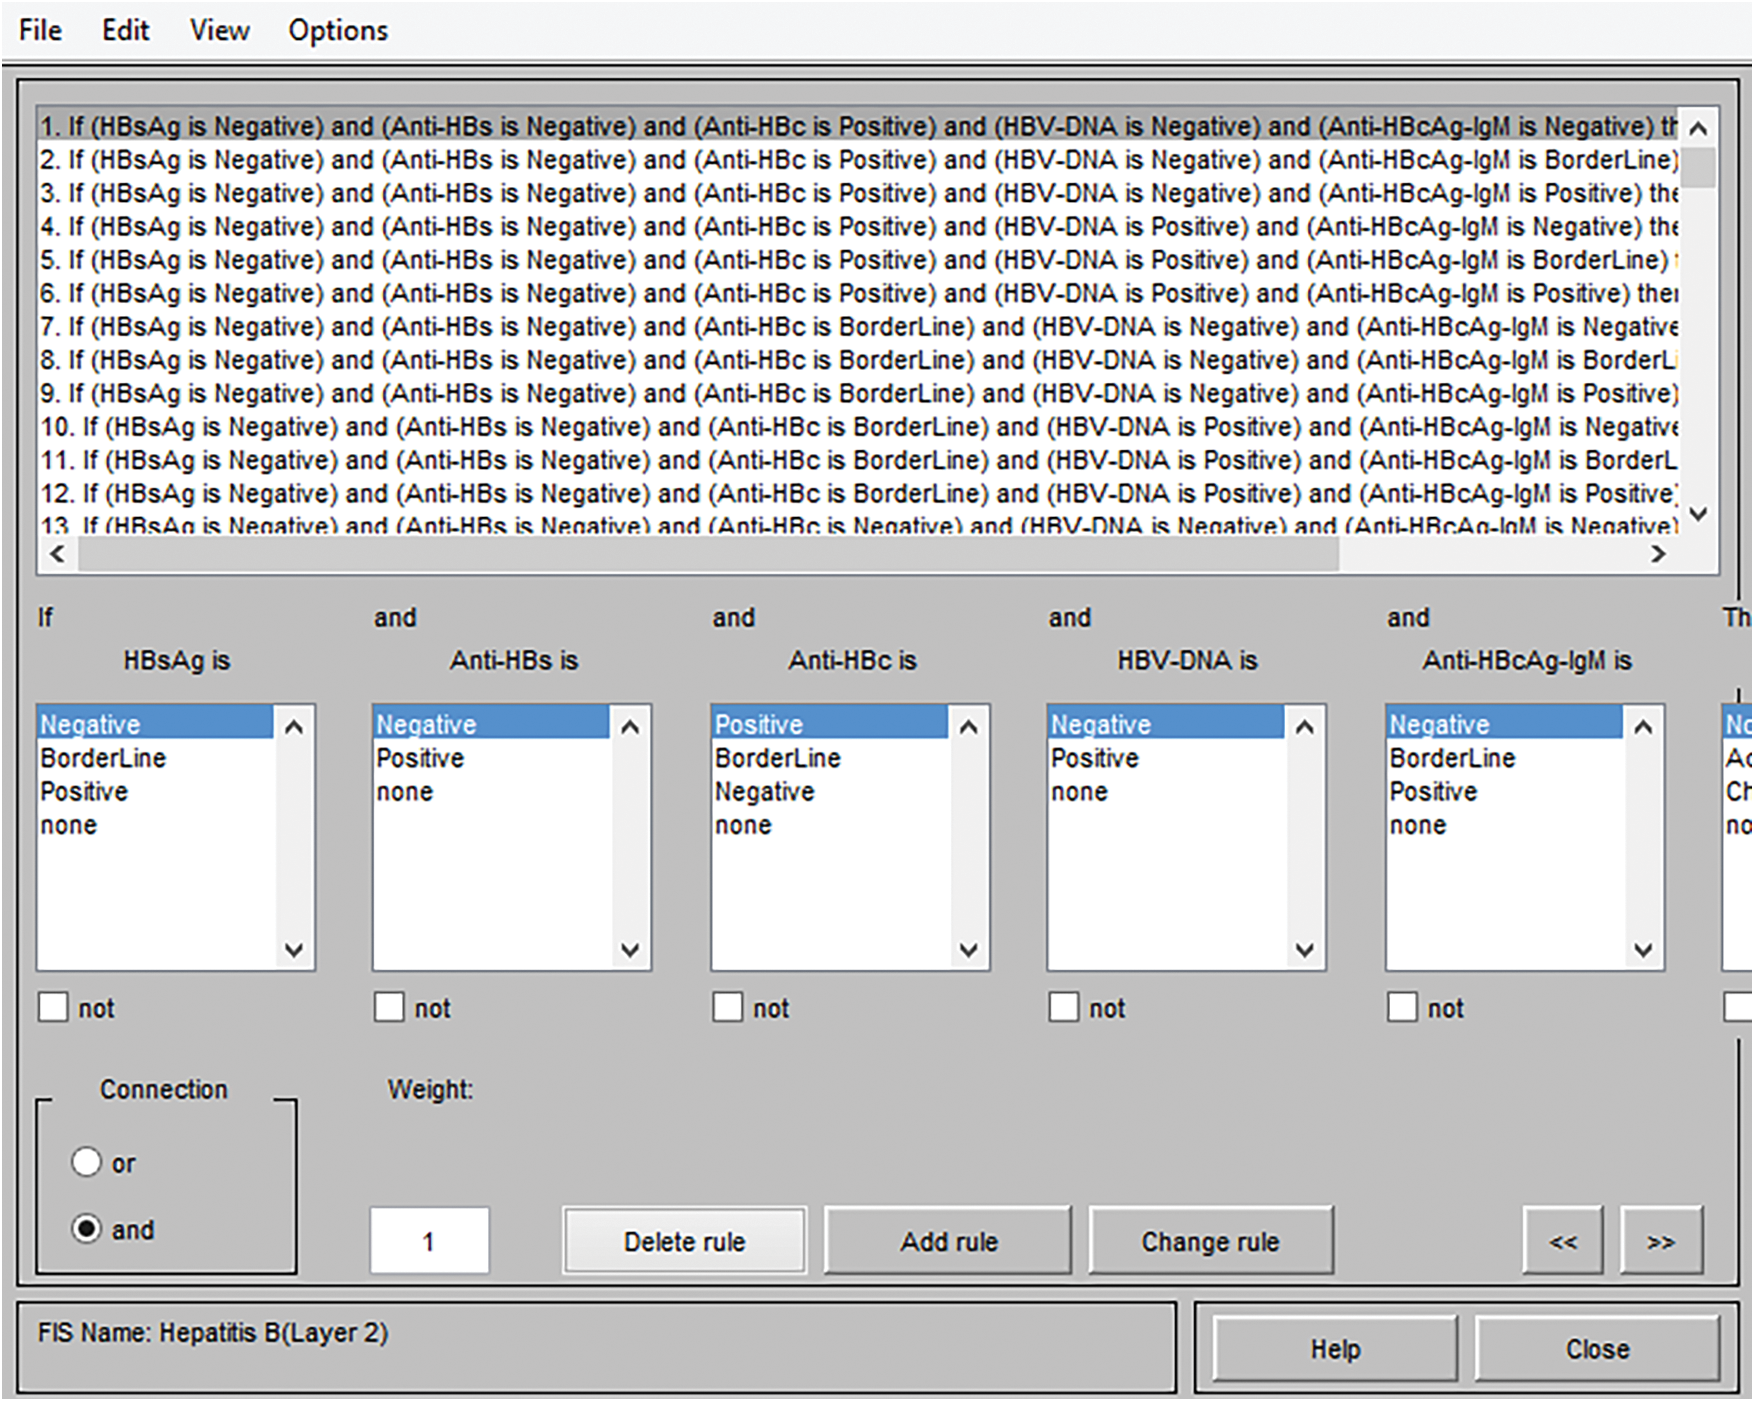
Figure 6: Framework of rules for layer 2
The instances of generated and stored rules for layer 1 are given by:
Instance 1: Inference Rule no. 5
If Jaundice is No
And Dark Urine is No
And Abdominal Pain is High
And Vomiting is No
Then Output is No (Means hepatitis B virus is absent)
The instances of generated and stored rules for layer 2 are given by:
Instance 1: Inference rule no. 2
If HBsAg is Negative
And Anti-HBs is Negative
And Anti-HBc is Positive
And HBV DNA is Negative
And Anti-HBcAg-IgM is Borderline
Then HBV is No HBV
The number of rules of an inference system depends upon the number of linguistic variables taken in the input variables and output variables in that particular inference model.
For layer 1 of this developed model, the number of inputs is 4, and each input variables are either two membership functions or three membership functions. Therefore, the number of rules that can be generated is calculated as follow:
Total number of rules = Jaundice (2) * Dark Urine (2) * Abdominal Pain (3) * Vomiting (2) = 2 * 2 * 3 * 2 = 24 rules
Similarly, for layer 2 of the developed model, the number of inputs are 5, and each input variables are either having two membership functions or three membership functions. Hence, the number of rules that must be generated can be calculated as follow:
Total number of rules = HBsAg (3) * Anti-HBs (2) * Anti-HBc (3) * HBV DNA (2) * Anti-HBcAg-IgM (3) = 3 * 2 * 3 * 2 * 3 = 108 rules
4 Methodology Used in the Development of a Model by Using Neuro-Fuzzy Technique
In the neuro-fuzzy technique, the two widely used technologies, i.e., neural network and fuzzy logic, are merged with each other to overcome the limitations of one another in order to build a solid methodology. This methodology is used to develop a model which is intelligent enough to diagnose hepatitis B disease. The various input variables used in the development of the system are HBsAg, Anti-HBs or HBsAb, Anti-HBc or HBcAb, HBV DNA, and Anti-HBcAg-IgM. The variables assigned to the input variables of the developed system are input1, input2, input3, input4 and input 5. Likewise, the output of the proposed system has been presented by the output variable. The flow of the entire methodology is shown in Fig. 7, and the structure of the constructed model is explained in Tab. 4.
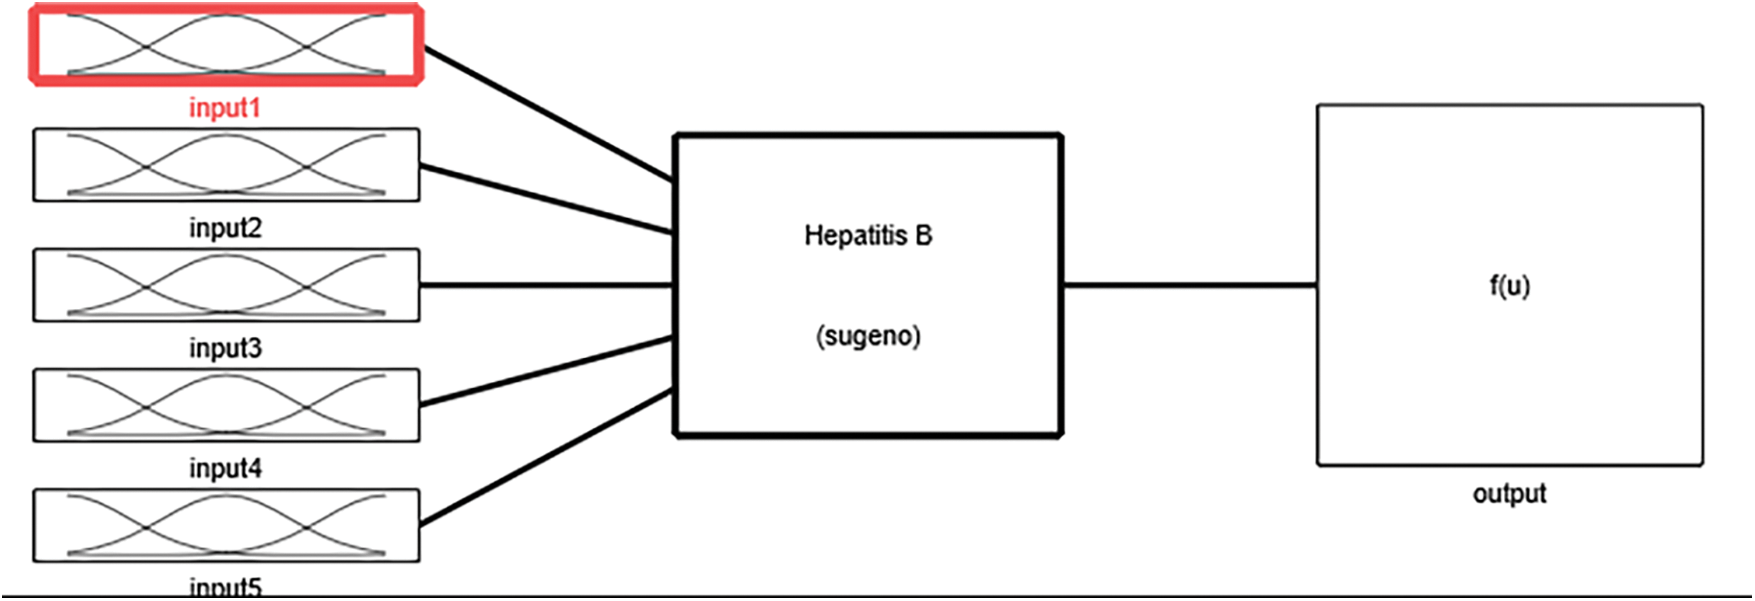
Figure 7: Flow of developed ANFIS model
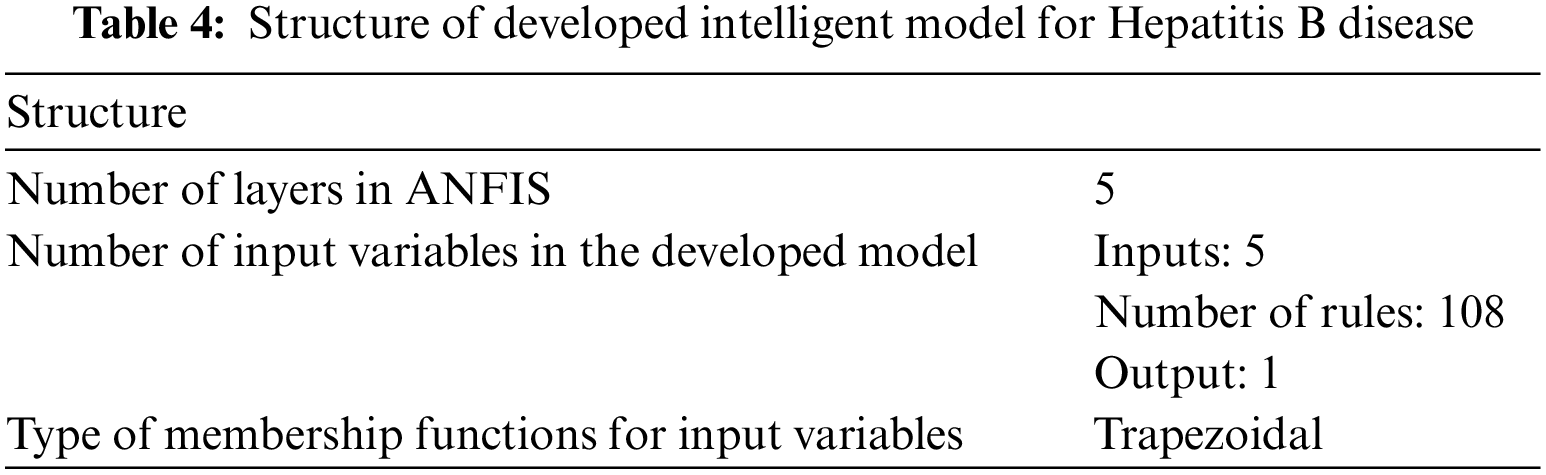
The type of membership function used in the development of an adaptive neuro-fuzzy inference system is the trapezoidal membership function. Every input variable has a distinct number of linguistic variables. Therefore, membership functions Input1, input3 and input 5 have three trapezoidal membership functions, and input 2 and input 4 have two trapezoidal membership functions. The rules, as well as membership functions, are automatically assigned by the ANFIS by gathering information during the training phase. Figs. 8 to 10 show the graphical representation of input variable's membership functions generated by adaptive neuro-fuzzy inference system.
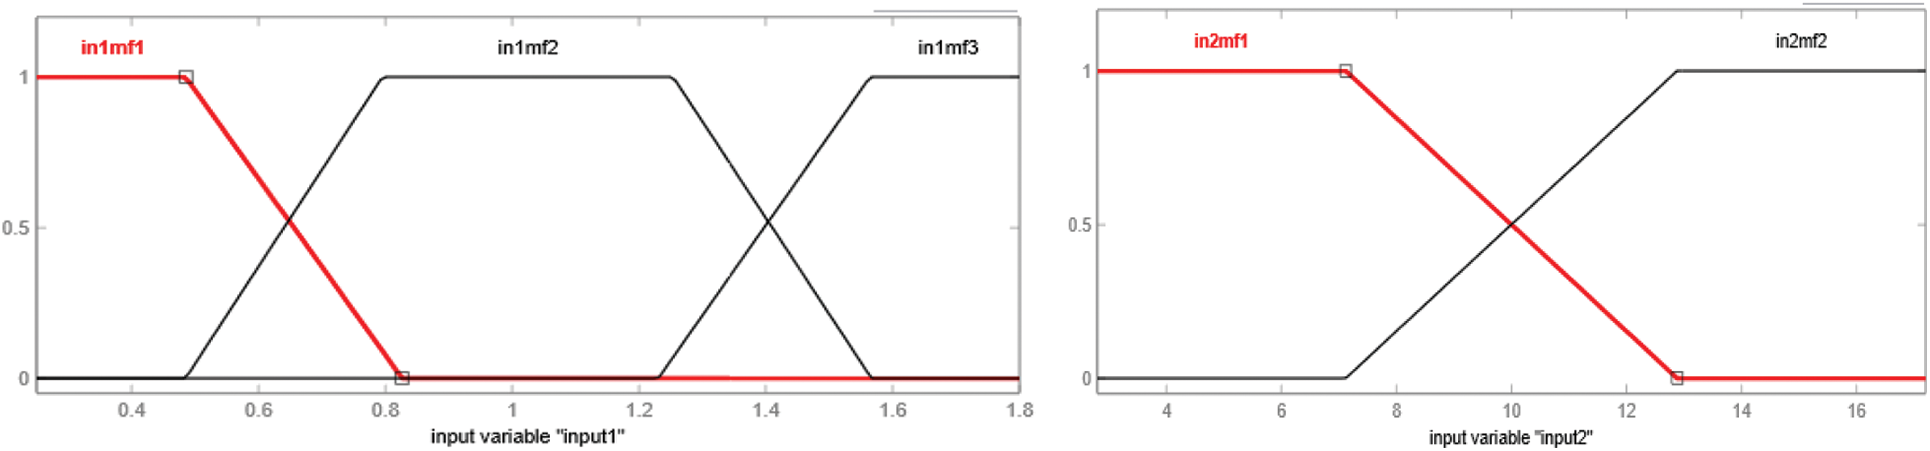
Figure 8: Membership function of input1, i.e., HBsAg and input2, i.e., Anti-HBs or HBsAb
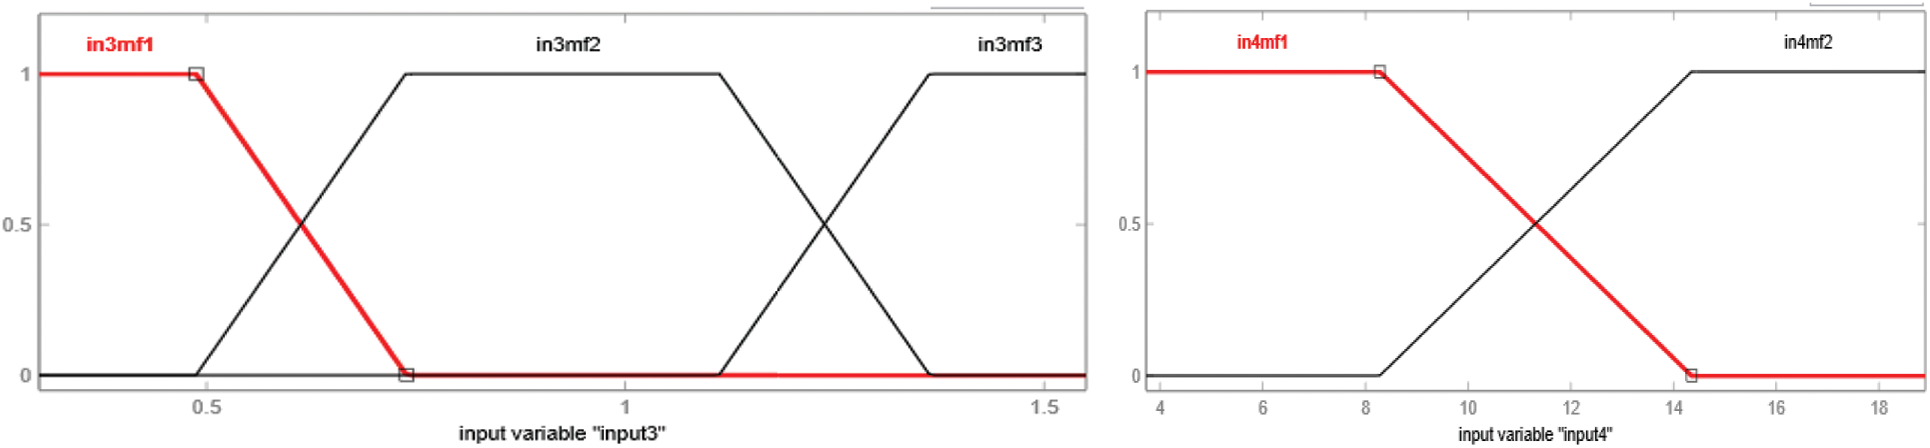
Figure 9: Membership function of input3, i.e., Anti-HBc or HBcAb and input4, i.e., HBV DNA
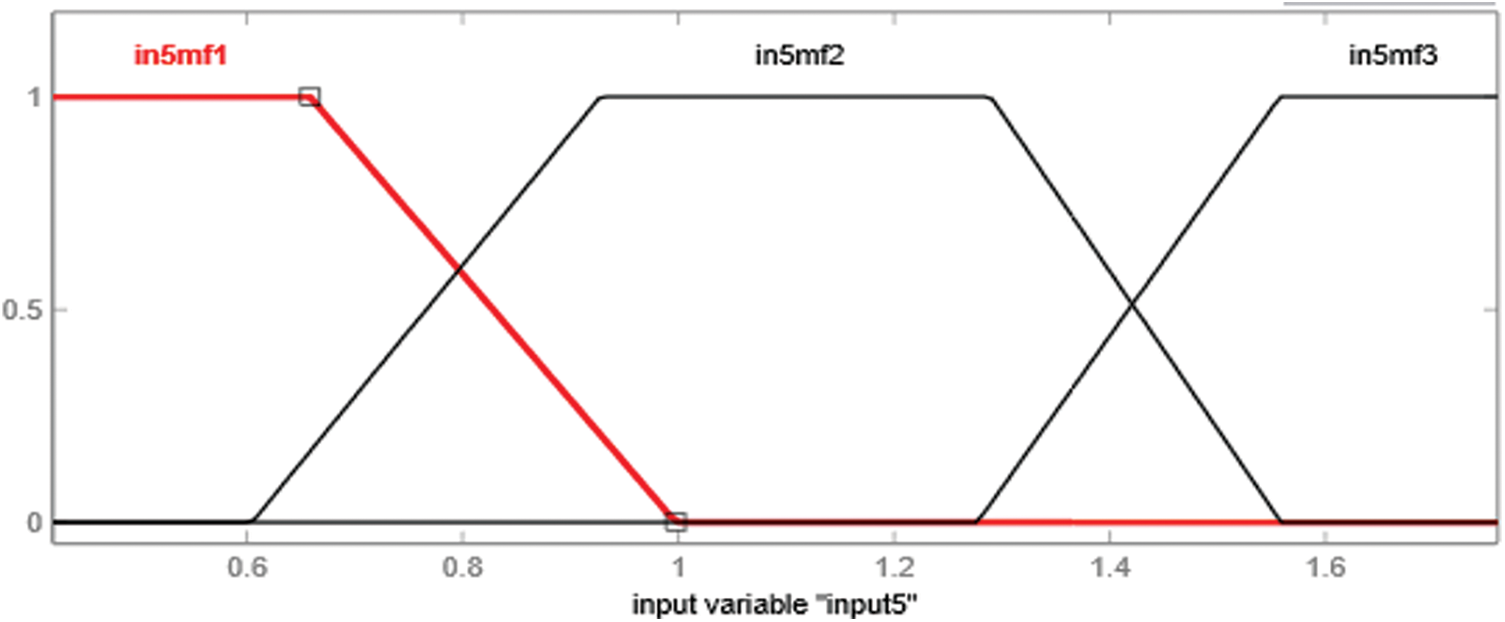
Figure 10: Membership function of input5, i.e., Anti-HBcAg-IgM
In the case of an adaptive neuro-fuzzy inference system, the rules, as well as facts, are generated by the model itself during the phase of its training. It takes each and every mixture of the provided inputs, which are possible for the diagnosis of hepatitis B disease by itself. The framework of rules is demonstrated in Fig. 11. The number of rules that are developed by the model is 108.
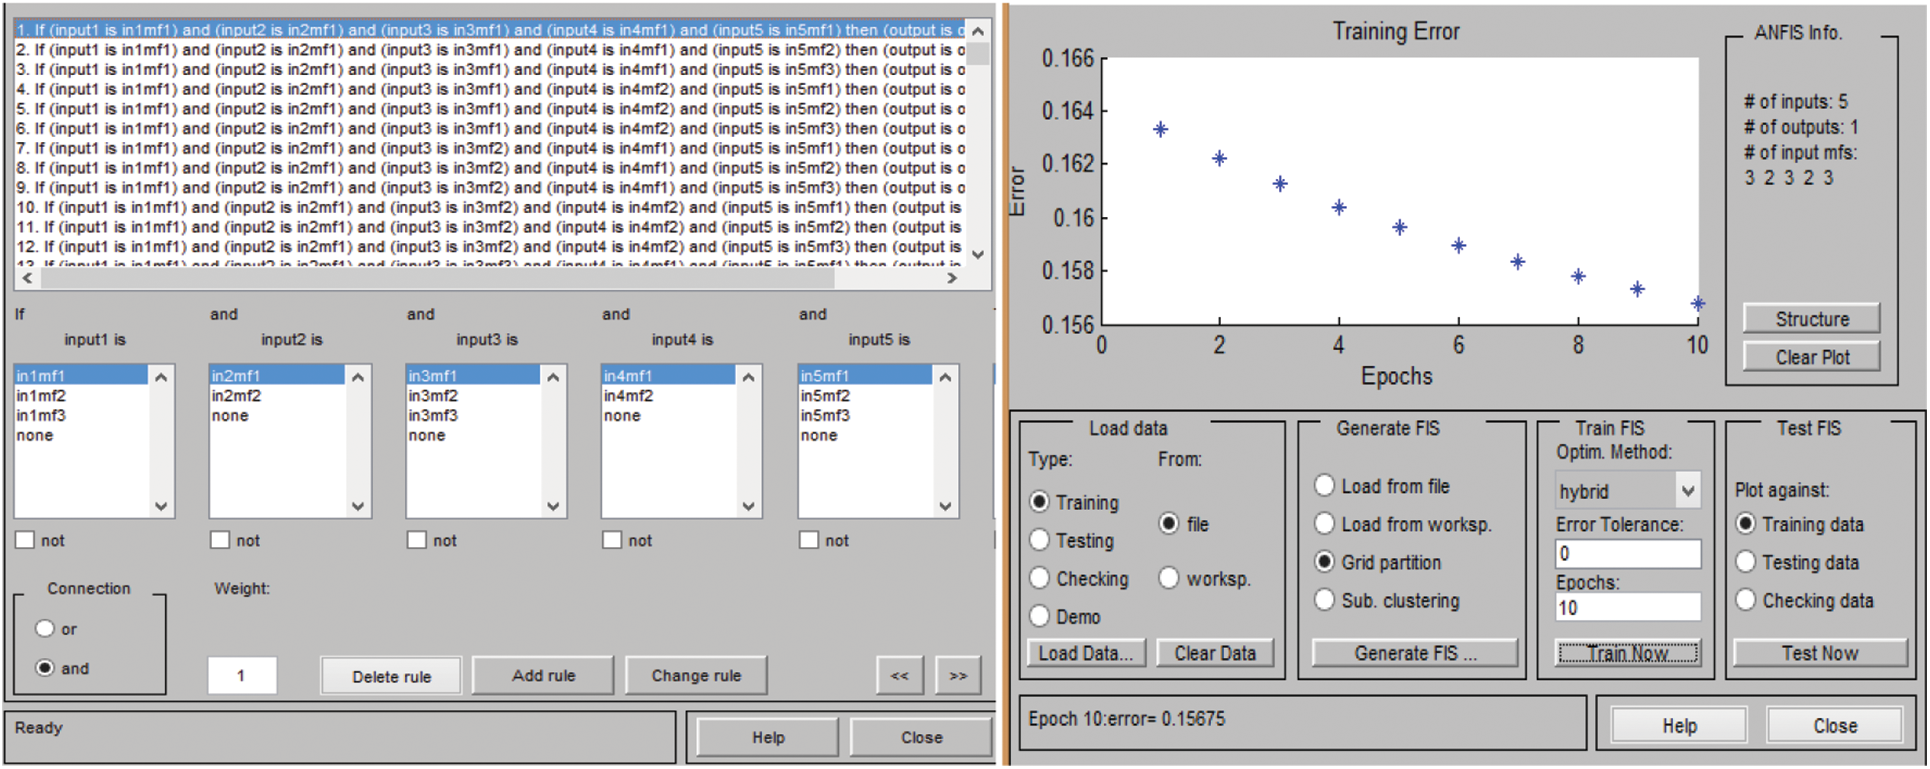
Figure 11: Framework of rules in ANFIS and training error at 10 epchs
The number of rules that are generated by the system by itself can be calculated as given below:
Total number of rules = input1 (3) * input2 (2) * input3 (3) * input4 (2) * input 5(3) = 3 * 2 * 3 * 2 * 3 = 108 rules
The most crucial part in the development of an adaptive neuro-fuzzy inference system is training and testing. The gathered dataset is partitioned into two parts, so that the training and testing datasets differs from each other. Hence, in this developed model, the dataset is partitioned into 75% and 25%, which are used for training as well as testing, respectively. The approach that is used for the partitioning is k-fold cross-validation. For the training phase, 10 epochs are considered, as shown in Fig. 11. After training and testing, the validation of the model is also done. The validation of the developed system is essential, as it depicts whether the developed model is correctly classifying all the provided data or not.
5.1 Results for Developing Fuzzy Inference System
To analyze the working of the developed fuzzy inference system to diagnose HBV in terms of classifying the provided data into accurate as well as appropriate classes, the different 50 tests are carried out.
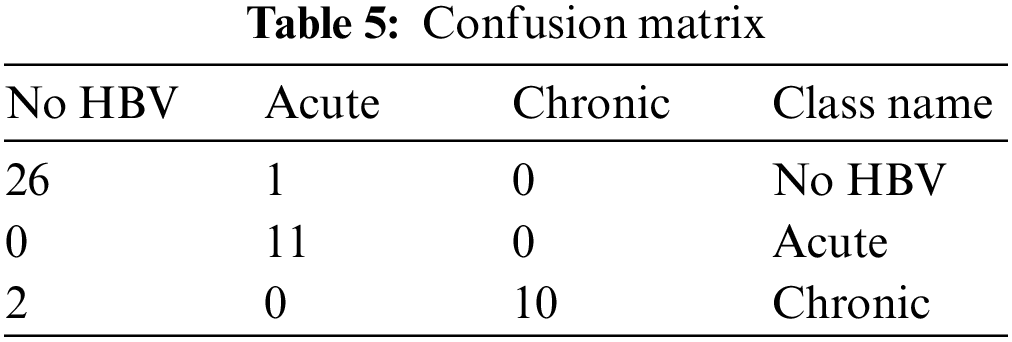
Tab. 5 shows the confusion matrix of different test samples. As illustrated above, the total number of test samples is 50, and out of these, 47 are accurately classified into the considered classes. The 1st column represented the cases of No HBV. There is a total of 27 samples of those patients who are non infected, and out of these samples, only one case is observed as classified into incorrect class. Likewise, the 2nd column represents the acute infection and having total 11 test cases. These 11 test cases are positively classified, and there is not any single case of acute infection, which is classified incorrectly. Moreover, the thirds column indicates the chronic infection and having a total of 12 test samples. Out of these 12 samples, 2 are classified inaccurately, whereas 10 test cases are classified into the correct class by the developed model.
Tab. 6 represents the confusion matrix, but the dimensions of it are reduced. The class name No HBV is considered into no class, and similarly, the other two classes, i.e., acute and chronic, are considered into yes class. Hence, the dimensionality of the matrix is reduced.

From the above table, the various performance parameters that are discussed above are figured out.
Therefore, from Tab. 7,
The value of True Positive, i.e., TP, is 21
The value of True Negative, i.e., TN, is 26
The value of False Negative, i.e., FN, is 2
The value of False Positive, i.e., FP, is 1
5.2 Results for Developed ANFIS
The accuracy of the developed medical intelligent system for the diagnosis of hepatitis B disease has been evaluated by comparing the observed value from the system itself with the target values given by the professionals or experts.
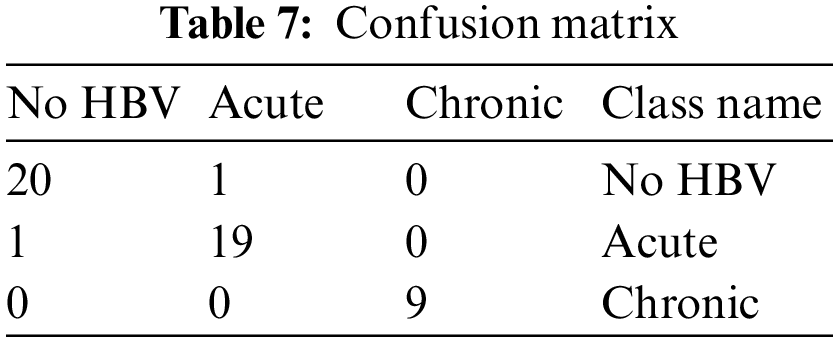
Tab. 7 shows the confusion matrix of different test samples. As explained above, the total number of test samples are 50, and out of these, 48 are accurately classified into the considered classes. The 1st column represented the cases of No HBV. There is a total of 20 samples of those patients who are non infected, and out of these samples, only one case is observed as classified into incorrect class. Likewise, the 2nd column represents the acute infection and having total 19 test cases. Out of these 19 samples, 1 is classified inaccurately, whereas 18 test cases are classified into the correct class by the developed model. Moreover, the third column indicates the chronic infection and having a total of 9 test samples. These 9 test cases are positively classified, and there is not any single case of acute infection which is classified incorrectly.
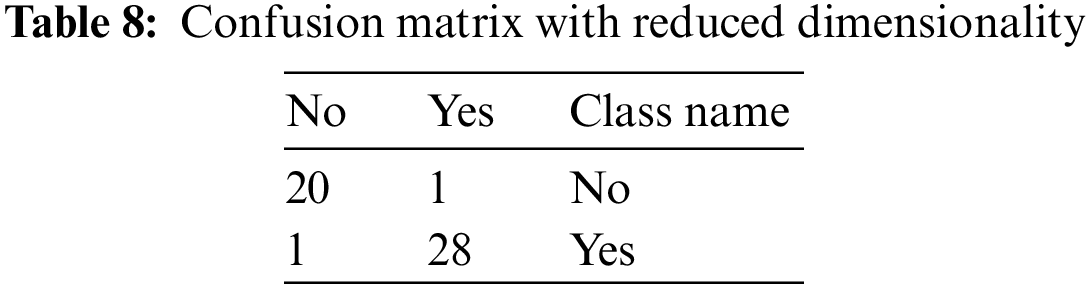
Tab. 8 represents the confusion matrix, but the dimensions of it are reduced. The class name No HBV is considered into no class, and similarly, the other two classes, i.e., acute and chronic, are considered into yes class. Hence, the dimensionality of the matrix is reduced.
From the above table, the various performance parameters that are discussed above are figured out.
Therefore, from,
The value of True Positive, i.e., TP, is 28
The value of True Negative, i.e., TN, is 20
The value of False Negative, i.e., FN, is 1
The value of False Positive, i.e., FP, is 1
5.3 Comparison of Both Developed Models
In order to figure out which developed model is best for the diagnosis of hepatitis B disease, a comparative study has been done among the fuzzy inference system as well as adaptive neuro-fuzzy inference system. The performance has been matched or compared with one another to make this comparison. By doing so, it is observed that which model has the capability to classify the provided inputs into accurate classes. The obtained results from both, i.e., fuzzy inference system as well as neuro-fuzzy inference system, are also compared with the results provided by the expert or professional doctor of hepatitis B disease.
Following the completion of this comparative study, it is analyzed that the model developed by using the neuro-fuzzy technique has more accurate compared to the system developed by using fuzzy logic. In other words, the adaptive neuro-fuzzy inference system has more capability to classify the provided inputs adequately than the fuzzy inference system.
All the parameters of performance that are taken under consideration are also compared with each other of both systems. This comparison of the different parameter is made in Tab. 9. The graphical representation of this comparative study makes it easy to understand the comparison between the performances of two developed systems. The two different charts are used to represent the analysis, i.e., column graph and bar chart. Figs. 12 and 13 show the graphical representation of this comparative study by using column graph and bar chart respectively.
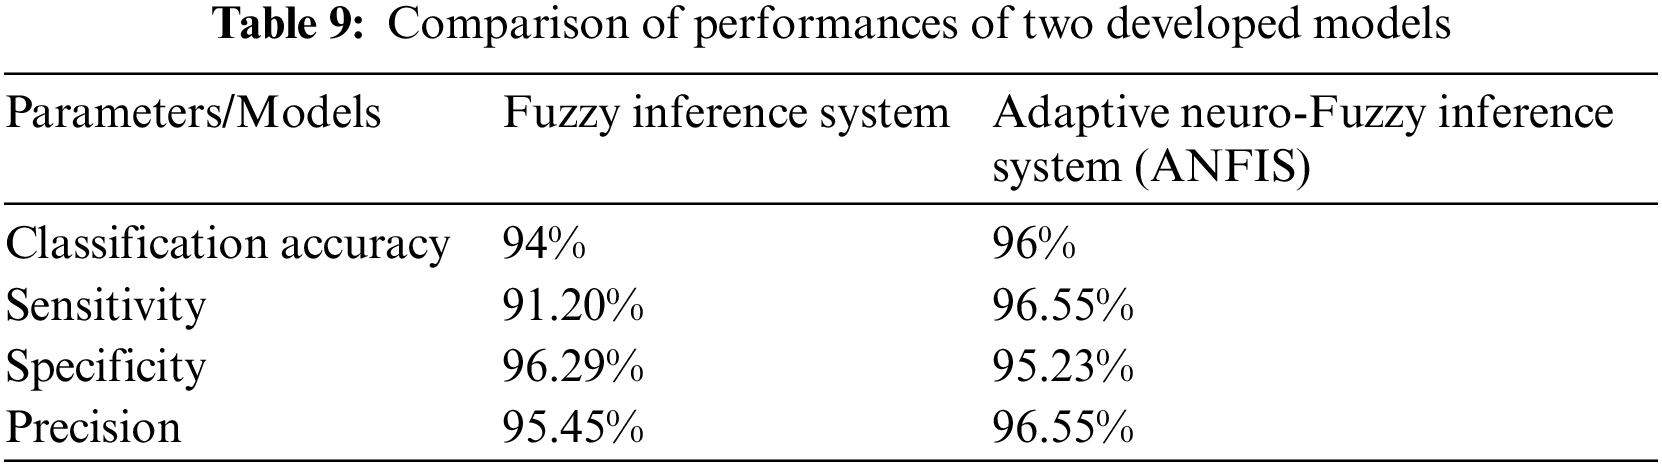
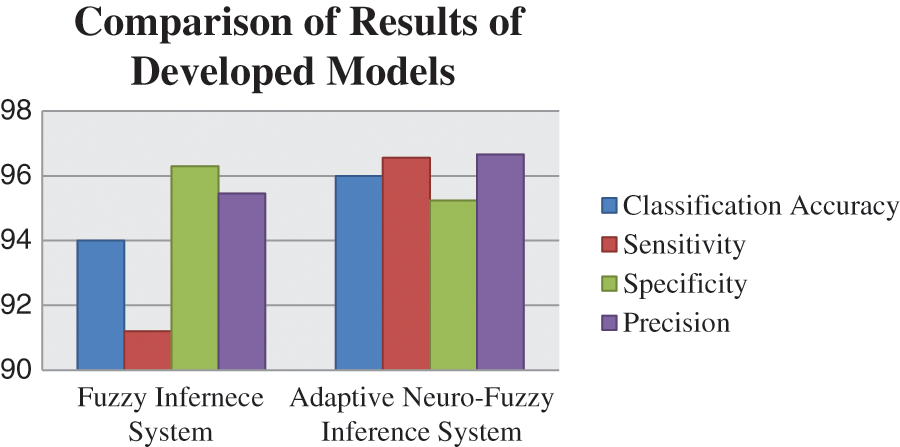
Figure 12: Graphical representation of a comparison of two models by column graph
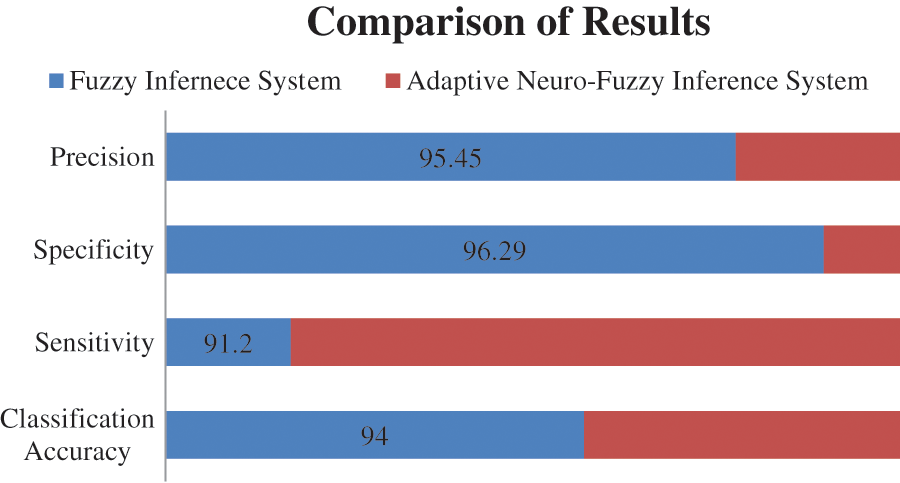
Figure 13: Graphical representation of a comparison of two models by a bar chart
The entire research work is based on the development of a medical diagnostic system for the diagnosis of hepatitis B disease by using soft computing technologies, i.e., fuzzy logic and neuro-fuzzy technique. The performance parameters are also determined according to the outcome of the models. The considered parameters are classification accuracy, sensitivity, specificity and precision. A comparative study is also done to evaluate the performance of the model in terms of accuracy. The classification accuracy of the developed system is 94% and 95.55% for fuzzy inference system and adaptive neuro-fuzzy inference system, respectively. Hence, the performance evaluation concluded that the outcome given by the developed medical diagnostic system by using ANFIS is accurate and correct as compared to the developed fuzzy inference system and also can be used in hospitals for the diagnosis of Hepatitis B disease. In other words, the adaptive neuro-fuzzy inference system has more capability to classify the provided inputs adequately than the fuzzy inference system.
For future work, the acquired input variables can be more accurate so that the virus can be detected in its introductory stage. The membership functions, as well as ranges of linguistic variables, can also be enhanced by doing a more comprehensive research. Moreover, with the advancements in wireless signal processing [56–65], and electronics [66–68], we believe that the methodology will be more simplified in the near future.
Acknowledgement: We deeply acknowledge Universidad Santiago de Cali for supporting this study.
Funding Statement: This research has been funded by Direccion General de Investigaciones of Universidad Santiago de Cali under call No.01–2021.
Conflicts of Interest: The authors declare that there is no conflict of interest associated with this study.
References
1. C. Long, H. Qi and W. Peng, “System dynamics of chronic hepatitis B - modeling the virus and immune system of chronic hepatitis b,” in 2010 2nd Int. Workshop on Intelligent Systems and Applications, Wuhan, China, pp. 1–4, 2010. [Google Scholar]
2. W. Shen, Z. Wei, Y. Li, H. Zhang and P. Liu, “Multiple granular analysis of TCM data with applications on diagnosis of hepatitis B,” in 2015 IEEE Int. Conf. on Systems, Man, and Cybernetics, Hong Kong, China, pp. 2920–2925, 2015. [Google Scholar]
3. Y. -F. Liaw and C. -M. Chu, “Hepatitis B virus infection,” The Lancet, vol. 373, no. 9663, pp. 582–592, 2009. [Google Scholar]
4. L. S. Tang, E. Covert, E. Wilson, and S. Kottilil, “Chronic hepatitis B infection,” JAMA, vol. 319, no. 17, pp. 1802, 2018. [Google Scholar]
5. Y. Bai, X. Chen, C. Dong, Y. Liu and Z. Zhang, “A comparison of multimodal biomarkers for chronic hepatitis B assessment using recursive feature elimination,” in 2016 38th Annual Int. Conf. of the IEEE Engineering in Medicine and Biology Society (EMBC), Orlando, FL, USA, pp. 2448–2451, 2016. [Google Scholar]
6. C. Cheng, P. Lee, C. Chin, W. Liu, I. Wu et al., “Discovering clinical biomarkers of chronic hepatitis B by mining mutation hotspots,” in 2011 Int. Conf. on Technologies and Applications of Artificial Intelligence, Chung Li, Taiwan, pp. 51–56, 2011. [Google Scholar]
7. L. Du, D. Huang and Q. Xie, “A mathematical model for acute hepatitis B virus infection,” in 2010 3rd Int. Conf. on Biomedical Engineering and Informatics, Yantai, China, pp. 1109–1113, 2010. [Google Scholar]
8. S. U. Emon, T. I. Trishna, R. R. Ema, G. I. H. Sajal, S. Kundu et al., “Detection of hepatitis viruses based on J48, KStar and naïve Bayes classifier,” in 2019 10th Int. Conf. on Computing, Communication and Networking Technologies (ICCCNT), Kanpur, India, pp. 1–7, 2019. [Google Scholar]
9. M. Al-Sarem, F. Saeed, Z. Al-Mekhlafi, B. Mohammed, T. Al-Hadhrami et al., “An optimized stackingensemble model for phishing websites detection,” Electronics, vol. 10, no. 11, pp. 1285, 2021. [Google Scholar]
10. M. Al-Sarem, A. Alsaeedi, F. Saeed, W. Boulila and O. A. Bakhsh, “A novel hybrid deep learning model fordetecting COVID-19-related rumors on social media based on LSTM and concatenated parallel CNNs,” AppliedSciences, vol. 11, no. 17, pp. 7940, 2021. [Google Scholar]
11. K. Leung, K. H. Lee, J. Wang, E. Y. T. Ng, H. L. Y. Chan et al., “Data mining on DNA sequences of hepatitis B virus,” In IEEE/ACM Transactions on Computational Biology and Bioinformatics, vol. 8, no. 2, pp. 428–440, 2011. [Google Scholar]
12. H. Yasin, T. A. Jilani and M. Danish, “Hepatitis C classification using data mining techniques,” International Journal of Computer Applications, vol. 24, no. 3, pp. 1–6, 2011. [Google Scholar]
13. H. Wang, Y. Liu and W. Huang, “Random forest and Bayesian prediction for hepatitis B virus reactivation,” in 2017 13th Int. Conf. on Natural Computation, Fuzzy Systems and Knowledge Discovery (ICNC-FSKD), Guilin, China, pp. 2060–2064, 2017. [Google Scholar]
14. X. Chen, L. Ma, N. Chu and Y. Hu, “Diagnosis based on decision tree and discrimination analysis for chronic hepatitis b in TCM,” in 2011 IEEE Int. Conf. on Bioinformatics and Biomedicine Workshops (BIBMW), Atlanta, GA, USA, pp. 817–822, 2011. [Google Scholar]
15. S. Uhmn, D. Kim, S. W. Cho, J. Y. Cheong and J. Kim, “Chronic hepatitis classification using SNP data and data mining techniques,” in 2007 Frontiers in the Convergence of Bioscience and Information Technologies, Jeju, Korea (Southvol. 81, 2007. [Google Scholar]
16. F. Saeed, M. Al-Sarem, M. Al-Mohaimeed, A. Emara, W. Boulila et al., “Enhancing Parkinson's disease prediction using machine learning and feature selection methods,” Computers, Materials & Continua, vol. 71, no. 3, pp. 5639–5658, 2022. [Google Scholar]
17. H. Moujahid, B. Cherradi, M. Al-Sarem, L. Bahatti, A. B. A. M. Y. Eljialy et al., “Combining CNN and grad-cam for COVID-19 disease prediction and visual explanation,” Intelligent Automation & Soft Computing, vol. 32, no. 2, pp. 723–745, 2022. [Google Scholar]
18. Z. G. Al-Mekhlafi, B. A. Mohammed, M. Al-Sarem, F. Saeed, T. Al-Hadhrami et al., “Phishing websites detection by using optimized stacking ensemble model,” Computer Systems Science and Engineering, vol. 41, no. 1, pp. 109–125, 2022. [Google Scholar]
19. S. N. Qasem, M. Al-Sarem and F. Saeed, “An ensemble learning based approach for detecting and tracking COVID 19 rumors,” Computers, Materials & Continua, vol. 70, no. 1, pp. 1721–1747, 2022. [Google Scholar]
20. M. Driss, A. Aljehani, W. Boulila, H. Ghandorh and M. Al-Sarem, “Servicing your requirements: An FCA and RCAdrivenapproach for semantic web services composition,” IEEE Access, vol. 8, pp. 59326–59339, 2020. [Google Scholar]
21. G. G. S. Uttreshwar and A. A. Ghatol, “Hepatitis B diagnosis using logical inference and generalized regression neural networks,” in 2009 IEEE International Advance Computing Conference, Patiala, India, pp. 1587–159l5, 2009. [Google Scholar]
22. M. Rouhani and M. M. Haghighi, “The diagnosis of hepatitis diseases by support vector machines and artificial neural networks,” in 2009 Int. Association of Computer Science and Information Technology - Spring Conf., Singapore, pp. 456–458, 2009. [Google Scholar]
23. S. C. Wang, “Artificial neural network,” in Interdisciplinary Computing in Java Programming, Boston, MA: Springer, pp. 81–100, 2003. [Google Scholar]
24. S. E. Dreyfus, “Artificial neural networks, back propagation, and the Kelley-Bryson gradient procedure,” Journal of Guidance, Control, and Dynamics, vol. 13, no. 5, pp. 926–928, 1990. [Google Scholar]
25. F. Rosenblatt, “The perceptron: A probabilistic model for information storage and organization in the brain,” Psychological Review, vol. 65, no. 6, pp. 386–408, 1958. [Google Scholar]
26. S. Mangrulkar, “Artificial neural systems,” ISA Transactions, vol. 29, no. 1, pp. 5–7, 1990. [Google Scholar]
27. J. M. Zurada, “Introduction to artrificial neural network,” Image and Vision Computing, vol. 8, pp. 82–89, 1992. [Google Scholar]
28. L. A. Zadeh, “Fuzzy logic,” ISA Transactions, vol. 21, no. 4, pp. 83–93, 1988. [Google Scholar]
29. V. Novák, “Which logic is the real fuzzy logic?,” Fuzzy Sets and Systems, vol. 157, no. 5, pp. 635–641, 2006. [Google Scholar]
30. O. Terrada and O. Bouattane, “A fuzzy medical diagnostic support system for cardiovascular diseases diagnosis using risk factors,” in 2018 Int. Conf. on Electronics, Control, Optimization and Computer Science (ICECOCS), pp. 1–6, 2018. [Google Scholar]
31. J., Jang, “ANFIS: Adaptive-network-based fuzzy inference system,” IEEE Transactions on Systems, Man, and Cybernetics, vol. 23, no. 3, pp. 665–685, 1999. [Google Scholar]
32. M. Al-Sarem, W. Boulila, M. Al-Harby, J. Qadir and A. Alsaeedi, “Deep learning-based rumor detection on microblogging platforms: A systematic review,” IEEE Access, vol. 7, pp. 152788–152812, 2019. [Google Scholar]
33. B. Kaur, H. Sadawarti and J. Singla, “A Neuro-fuzzy based intelligent system for diagnosis of renal cancer,” International Jjournal of Scientifuc & Technology Research, vol. 9, no. 1, pp. 3699–3705, 2020. [Google Scholar]
34. E. Dogantekin, A. Dogantekin, D. Avci and L. Avci, “An intelligent diagnosis system for diabetes on linear discriminant analysis and adaptive network based fuzzy inference system: LDA-ANFIS,” Digital Signal Processing, vol. 20, no. 4, pp. 1248–1255, 2010. [Google Scholar]
35. R. Nohria, “Comparative study of adaptive neuro-fuzzy and fuzzy inference system for diagnosis of hypertension,” in 2017 Int. Conf. on Computing Methodologies and Communication (ICCMC), China, pp. 406–411, 2017. [Google Scholar]
36. C. Mahesh, K. Kiruthika and M. Dhilsathfathima, “Diagnosing hepatitis B using artificial neural network based expert system,” in Int. Conf. on Information Communication and Embedded Systems (ICICES2014), Chennai, India, pp. 1–7, 2014. [Google Scholar]
37. E. Gannour, O. Oussama, S. Hamida, B. Cherradi, M. Al-Sarem et al., “Concatenation of pre-trained convolutionalneural networks for enhanced COVID-19 screening using transfer learning technique,” Electronics, vol. 11, no. 1, pp. 103, 2022. [Google Scholar]
38. Z. G. Al-Mekhlafi, B. A. Mohammed, M. Al-Sarem, F. Saeed, T. Al-Hadhrami et al., “Phishing websites detection by using optimized stacking ensemble model,” Computer Systems Science and Engineering, vol. 41, no. 1, pp. 109–125, 2022. [Google Scholar]
39. Y. Chen, Y. Luo, W. Huang, D. Hu, R. Zheng et al., “Machine-learning-based classification of real-time tissue elastography for hepatic fibrosis in patients with chronic hepatitis B,” Computers in Biology and Medicine, vol. 89, no. January, pp. 18–23, 2017. [Google Scholar]
40. R. Wei, J. Wang, X. Wang, G. Xie, Y. Wang et al., “Clinical prediction of HBV and HCV related hepatic fi brosis using machine learning,” EBioMedicine, vol. 35, pp. 25–36, 2018. [Google Scholar]
41. M. Nilashi, H. Ahmadi, L. Shahmoradi, O. Ibrahim and E. Akbari, “A predictive method for hepatitis disease diagnosis using ensembles of neuro-fuzzy technique,” Journal of Infection and Public Health, vol. 12, no. 1, pp. 13–20, 2019. [Google Scholar]
42. S. Khan, R. Ullah, A. Khan, R. Ashraf, H. Ali et al., “Analysis of hepatitis B virus infection in blood sera using Raman spectroscopy and machine learning,” Photodiagnosis and Photodynamic Therapy, vol. 23, pp. 89–93, 2018. [Google Scholar]
43. Q. -H. Ye, L. -X. Qin, M. Forgues, P. He, J. W. Kim et al., “Predicting hepatitis B virus–positive metastatic hepatocellular carcinomas using gene expression profiling and supervised machine learning,” Nature Medicine, vol. 9, no. 4, pp. 416–423, 2003. [Google Scholar]
44. M. Hadwan, M. Al-Sarem, F. Saeed and M. A. Al-Hagery “An improved sentiment classification approach for measuring user satisfaction toward governmental services’ mobile apps using machine learning methods withfeature engineering and SMOTE technique,” Applied Sciences, vol. 12, pp. 5547, 2022. [Google Scholar]
45. D. Zhang, J. Hu, F. Li, X. Ding, A. K. Sangaiah et al., “Small object detection via precise region-based fully convolutional networks,” Computers, Materials and Continua, vol. 69, no. 2, pp. 1503–1517, 2021. [Google Scholar]
46. J. Wang, Y. Wu, S. He, P. K. Sharma, X. Yu et al., “Lightweight single image super-resolution convolution neural network in portable device,” KSII Transactions on Internet and Information Systems (TIIS), vol. 15, no. 11, pp. 4065–4083, 2021. [Google Scholar]
47. J. Wang, Y. Zou, P. Lei, R. S. Sherratt and L. Wang, “Research on recurrent neural network based crack opening prediction of concrete dam,” Journal of Internet Technology, vol. 21, no. 4, pp. 1161–1169, 2020. [Google Scholar]
48. J. Zhang, J. Sun, J. Wang and X. G. Yue, “Visual object tracking based on residual network and cascaded correlation filters,” Journal of Ambient Intelligence and Humanized Computing, vol. 12, no. 8, pp. 8427–8440, 2021. [Google Scholar]
49. S. He, Z. Li, Y. Tang, Z. Liao, F. Li et al., “Parameters compressing in deep learning,” Computers Materials & Continua, vol. 62, no. 1, pp. 321–336, 2020. [Google Scholar]
50. A. Sharma, D. Prashar, A. Ahmad Khan, F. Ahmed Khan and S. Poochaya, “Automatic leukaemia segmentationapproach for blood cancer classification using microscopic images,” Computers, Materials & Continua, vol. 73, no. 2, pp. 3629–3648, 2022. [Google Scholar]
51. K. Lakshmanna, R. Kaluri, N. Gundluru, Z. S. Alzamil, D. S. Rajput et al.,“A review on deep learning techniques for IoT data,” Electronics, vol. 11, no. 10, pp. 1604, 2022. [Google Scholar]
52. W. Wang, H. Liu, J. Li, H. Nie and X. Wang, “Using CFW-net deep learning models for X-ray images to detect COVID-19 patients,” International Journal of Computational Intelligence Systems, vol. 14, no. 1, pp. 199–207, 2021. [Google Scholar]
53. W. Wang, Y. Jiang, Y. Luo, J. Li, X. Wang et al., “An advanced deep residual dense network (DRDN) approach for image super-resolution,” International Journal of Computational Intelligence Systems, vol. 12, no. 2, pp. 1592–1601, 2019. [Google Scholar]
54. W. Wang, Y. Yang, J. Li, Y. Hu, Y. Luo et al., “Woodland labeling in chenzhou, China, via deep learning approach,” International Journal of Computational Intelligence Systems, vol. 13, no. 1, pp. 1393–1403, 2020. [Google Scholar]
55. A. A. Khan, P. Uthansakul, P. Duangmanee and M. Uthansakul, “Energy efficient design of massive MIMO by considering the effects of nonlinear amplifiers,” Energies, vol. 11, pp. 1045, 2018. [Google Scholar]
56. P. Uthansakul and A. A. Khan, “Enhancing the energy efficiency of mmWave massive MIMO by modifying the RF circuit configuration,” Energies, vol. 12, pp. 4356, 2019. [Google Scholar]
57. P. Uthansakul and A. A. Khan, “On the energy efficiency of millimeter wave massive MIMO based on hybrid architecture,” Energies, vol. 12, pp. 2227, 2019. [Google Scholar]
58. A. A. Khan, P. Uthansakul and M. Uthansakul, “Energy efficient design of massive MIMO by incorporating with mutual coupling,” International Journal on Communication Antenna and Propagation, vol. 7, pp. 198–207, 2017. [Google Scholar]
59. P. Uthansakul, A. A. Khan, M. Uthansakul and M. Duangmanee, “Energy efficient design of massive MIMO based on closely spaced antennas: Mutual coupling effect,” Energies, vol. 11, pp. 2029, 2018. [Google Scholar]
60. P. Uthansakul, P. Anchuen, M. Uthansakul and A. A. Khan, “QoE-Aware self-tuning of service priority factor for resource allocation optimization in LTE network,” IEEE Transactions on Vehicular Technology, vol. 69, pp. 887–900, 2020. [Google Scholar]
61. P. Uthansakul, P. Anchuen, M. Uthansakul and A. A. Khan, “Estimating and synthesizing QoE based on QoS measurement for improving multimedia services on cellular networks using ANN method,” IEEE Transactions on Network and Service Management, vol. 17, pp. 389–402, 2020. [Google Scholar]
62. A. A. Khan, C. Wechtaisong, F. A. Khan and N. Ahmad, “A Cost-efficient environment monitoring robotic vehicle for smart industries,” CMC-Computers, Materials & Continua, vol. 71, pp. 473–487, 2022. [Google Scholar]
63. A. A. Khan and F. A. Khan, “A Cost-efficient radiation monitoring system for nuclear sites: Designing and implementation,” Intelligent Automation & Soft Computing, vol. 32, pp. 1357–1367, 2022. [Google Scholar]
64. S. Vinson Joshua, A. Selwin Mich Priyadharson, R. Kannadasan, A. A. Khan, W. Lawanont et al., “Crop yield prediction using machine learning approaches on a wide spectrum,” Computers, Materials & Continua, vol. 72, no. 3, pp. 5663–5679, 2022. [Google Scholar]
65. M. B. Kamal, A. A. Khan, F. A. Khan, M. M. Ali Shahid, C. Wechtaisong et al., “An innovative approach utilizing binary-view transformer for speech recognition task,” Computers, Materials & Continua, vol. 72, no. 3, pp. 5547–5562, 2022. [Google Scholar]
66. N. Mushtaq, A. A. Khan, F. A. Khan, M. J. Ali, M. M. Ali Shahid et al., “Brain tumor segmentation using multi-view attention based ensemble network,” Computers, Materials & Continua, vol. 72, no. 3, pp. 5793–5806, 2022. [Google Scholar]
67. S. Prajam, C. Wechtaisong and A. A. Khan, “Applying machine learning approaches for network traffic forecasting,” Indian Journal of Computer Science and Engineering, vol. 13, no. 2, pp. 324–335, 2022. [Google Scholar]
68. A. A. Khan, “Energy efficient design of 5G massive mimo,” Ph.D. dissertation, Suranaree University of Technology, Thailand, 2018. [Google Scholar]
 | This work is licensed under a Creative Commons Attribution 4.0 International License, which permits unrestricted use, distribution, and reproduction in any medium, provided the original work is properly cited. |