| Computers, Materials & Continua DOI:10.32604/cmc.2022.031345 | |
| Article |
Metaheuristics Enabled Clustering with Routing Scheme for Wireless Sensor Networks
1Department of Computer Science, College of Science & Art at Mahayil, King Khalid University, Saudi Arabia
2Department of Information Systems, College of Computing and Information System, Umm Al-Qura University, Saudi Arabia
3Department of Information Technology, College of Computer and Information Sciences, Princess Nourah Bint Abdulrahman University, P.O. Box 84428, Riyadh, 11671, Saudi Arabia
4Department of Digital Media, Faculty of Computers and Information Technology, Future University in Egypt, New Cairo, 11835, Egypt
5Department of Computer and Self Development, Preparatory Year Deanship, Prince Sattam bin Abdulaziz University, AlKharj, Saudi Arabia
*Corresponding Author: Manar Ahmed Hamza. Email: ma.hamza@psau.edu.sa
Received: 15 April 2022; Accepted: 06 June 2022
Abstract: Wireless Sensor Network (WSN) is a vital element in Internet of Things (IoT) as the former enables the collection of huge quantities of data in energy-constrained environment. WSN offers independent access to the target region and performs data collection in an effective manner. But energy constraints remain a challenging issue in WSN since it operates on in-built battery. The studies conducted earlier recommended that the energy spent on communication process must be considerably reduced to improve the efficiency of WSN. Cluster organization and optimal selection of the routes are considered as NP hard optimization problems which can be resolved with the help of metaheuristic algorithms. Clustering and routing are considered as effective approaches in enhancing the energy effectiveness and lifespan of WSN. In this background, the current study develops an Improved Duck and Traveller Optimization (IDTO)-enabled cluster-based Multi-Hop Routing (IDTOMHR) technique for WSN. Primarily, IDTO algorithm is exploited for the selection of Cluster Head (CH) and construction of clusters. Besides, Artificial Gorilla Troops Optimization (ATGO) technique is also used to derive an optimal set of routes to the destination. Both clustering and routing approaches derive a fitness function with the inclusion of multiple input parameters. The proposed IDTOMHR model was experimentally validated for its performance under different aspects. The extensive experimental results confirmed the better performance of IDTOMHR model over other recent approaches.
Keywords: Wireless sensor network; clustering; routing; metaheuristics; energy efficiency; lifetime
Wireless Sensor Network (WSN) is an intermesh of Sensor Nodes (SN) that are linked with one another in a network via wireless means. WSN identifies application zones to observe the external and environmental statuses of remote locations [1]. It ensures wireless transmission of the data through limited computing capability. However, it has lesser energy sources which result in network failure issues [2]. Thus, it is considered as a prerequisite for WSNs to have SNs with inbuilt battery due to energy constraints. Therefore, the current research work is aimed at mitigating the power consumption of SNs [3]. Further, WSNs can be applied in large-scale in various domains such as environment monitoring, border control applications, and remote surveillance. In general, the sensor nodes are normally cheaper, possess low battery power and experience energy constraints [4,5]. Fig. 1 displays the infrastructure of WSN.
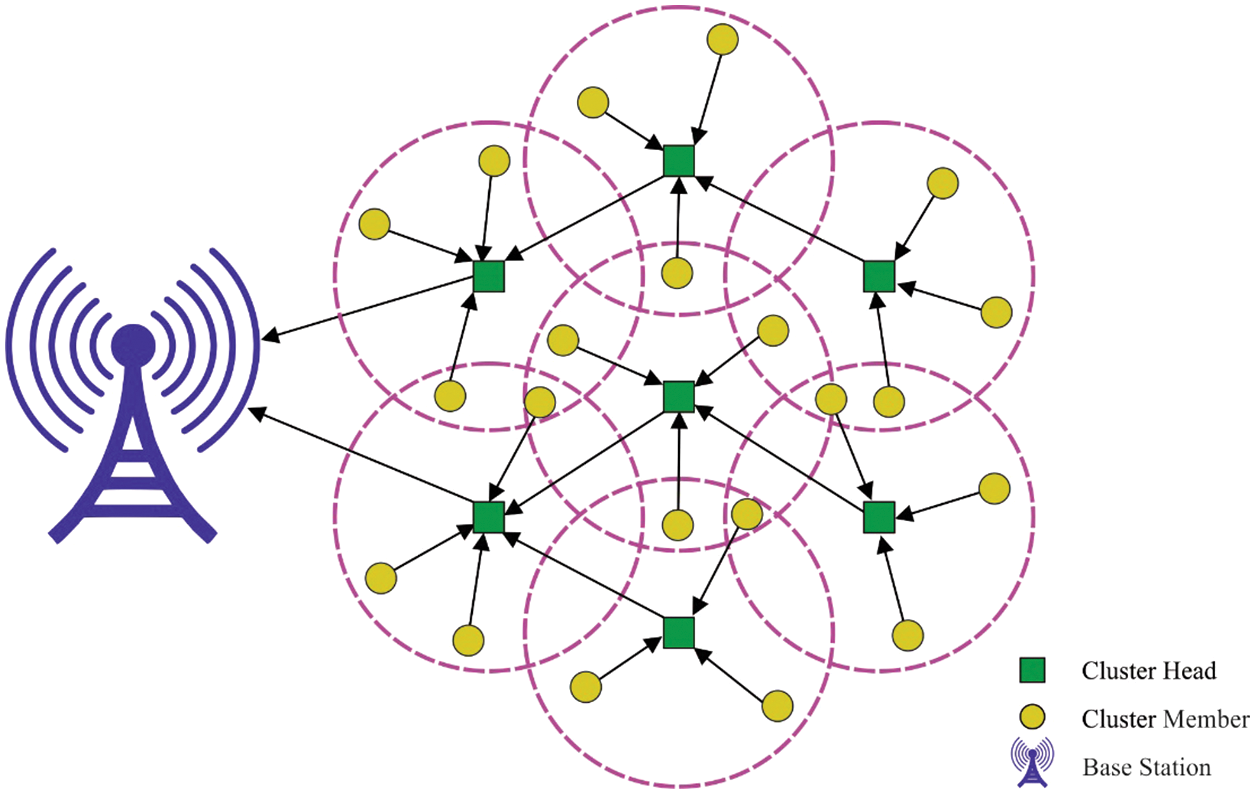
Figure 1: Structure of WSN
The main challenge in WSN is to increase the lifespan of network since the sensors do not possess the capability to transmit the data at the beginning to Base Station (BS) [6,7]. In data collection applications, every sensor is liable to sense and transmit the data packets to BS. The method of combining the data reduces data dissipation and saves power by clubbing unique incoming data packets into a single packet. Therefore, many applications are created to expand the lifespan of WSNs. Sensor Nodes function on the basis of in-built battery due to which WSNs experience energy-constraint issues [8–10]. Therefore, the dissipation of power is controlled to extend the lifespan of the network. Clustering is a process in which the sensors are grouped together in the network based on selected features. Each group is termed as a cluster; a Cluster Head (CH) exits in each cluster and is liable to each and every cluster member; further, it collects the data from other cluster member nodes and sends it to BS [11,12]. In order to reduce the power dissipation rate in WSN, an optimum route should be identified from the source to destination using routing protocol. This route is aimed at reducing the power utilization rate, whenever broadcasting the data [13]. Various routing protocols have been proposed earlier which function on the basis of power dissipation variable, whereas a few useful routing protocols has been examined by authors that are prominently utilized in the mitigation of power dissipation rate in WSN [14].
The researchers, in the study conducted earlier [15], proposed Moth Flame Optimization (MFO) algorithm based on Thresholding sensitive Energy-effective Clustering Protocol (TECP) to increase the lifetime of the network. MFO used multihop transmission between CHs and BSs to accomplish the optimum connectivity cost, reduction of energy and load balancing for distant CHs. In literature [16], a heterogeneous network-based cluster routing approach was introduced. It emphasized on resolving the problems involved in energy utilization and network lifespan so as to achieve better performance from the network. The presented method depends on probability approach in which node energy and CH selection possibility of distinct heterogeneous nodes are used in the selection of CHs.
In the study conducted earlier [17], a Light weight Trust Management Scheme (LTMS) was presented based on binomial distribution to defend from internal attacks. At the same time, the study also considered different domains such as energy, distance, environment, and security to present a Multi-dimensional Secure Clustered Routing (MSCR) protocol with the help of dynamic dimension weight in hierarchical WSN. In literature [18], Self-Organizing Map (SOM) NN was utilized to accomplish primary clustering on network node. In inter cluster routing phase, it is possible to achieve inter-cluster routing with the help of enhanced Ant Colony Optimization (ACO). The researchers [19] developed and analyzed an EE clustering-based routing method and selective-path priority table based on mobile sink application. The priority table can be generated by prioritizing the two shortest routes to the sink or CH in line with the rules.
The current study develops an Improved Duck and Traveller Optimization (IDTO)-enabled Cluster-based Multi-Hop Routing (IDTOMHR) technique for WSN. Primarily, IDTO algorithm is exploited for the selection of Cluster Head (CH) and construction of clusters. Besides, Artificial Gorilla Troops Optimizer (ATGO) technique is involved to derive an optimal set of routes to reach the destination. Both clustering and routing approaches derive a Fitness Function (FF) with the inclusion of multiple input parameters. The proposed IDTOMHR model was experimentally validated under different aspects.
In this study, a novel IDTOMHR technique has been developed to increase the energy effectiveness and lifespan of WSN. Initially, IDTO algorithm is exploited for effectual CH selection and cluster construction tasks. Next, ATGO technique is utilized to derive an optimal set of routes to reach the destination. Both clustering and routing approaches derive a Fitness Function with the inclusion of multiple input parameters.
2.1 Stage I: Cluster Construction Phase
Initially, IDTO algorithm is exploited for effectual CH selection and cluster construction tasks. The authors have conducted the current study to find a solution that improves the energy efficiency of WSNs. With energy constraint as the primary issue to be resolved, the current study is aimed at attaining the best possible solution for a specific period with maximum quality and minimum cost [20].
At this point,
At this point, both the variables
Here the gamma-adjusted function is developed. At this point 0
At this point,
Now,
The place of the concerned duck limits the separation of voyage, while it promotes the identification of prey. Speed
Here S indicates the Speed and D denotes the distance utilized to attain P i.e., Prey. Here, force is calculated as follows.
At this point,
Assume
P(s) = Parameters
In this technique i.e., IDTO, a novel and optimum solution
The next generation is upgraded with the help of optimum function provided herewith.
The performance is maximized using the equation given below.
In order to increase the lifetime of WSN, several clustering methods are used to select the optimum CH and the effective solution resolves the problems. Fitness Function (FF) is the key for each technique and it determines the comparative significance of each and every model. A high appropriateness value represents that the model is effective. In current work, fitness function is constructed for IDTO algorithm and it considers power utilization and the distance between BS and the CH. Fitness function F can be determined using the following equation.
The weight for fitness parameter is arbitrary allocated
Here,
The overall distance can be determined as given below.
2.2 Stage II: Route Selection Phase
Once the clusters are constructed, ATGO technique is applied to derive an optimal set of routes to reach the destination [21]. This technique is simulated on the basis of group behavior of gorillas which is inclusive of five approaches. In exploration stage, three strategies are utilized such as migration in the direction of recognized place, migration towards unknown places, and moving towards other gorillas. The exploitation stage uses two approaches such as competition for adult females and following the silverback.
Each gorilla is regarded as a candidate solution in ATGO. Further, in every optimization phase, the optimal candidate solution is regarded as a silverback gorilla. Three distinct approaches are utilized for exploration stage such as migration toward an unknown location to increase the exploration of ATGO, migration towards another gorilla to increase the balance between exploration and exploitation stages and migration in the direction of recognized position to increase the ability of ATGO in terms of searching different optimization regions. These three approaches, in the exploration stage, are arithmetically expressed herewith.
whereas
Here
Two approaches are applied in the exploitation stage of ATGO such as competition for adult females and following the silverback. With the application of C value in Eq. (19) and comparing it against the variable
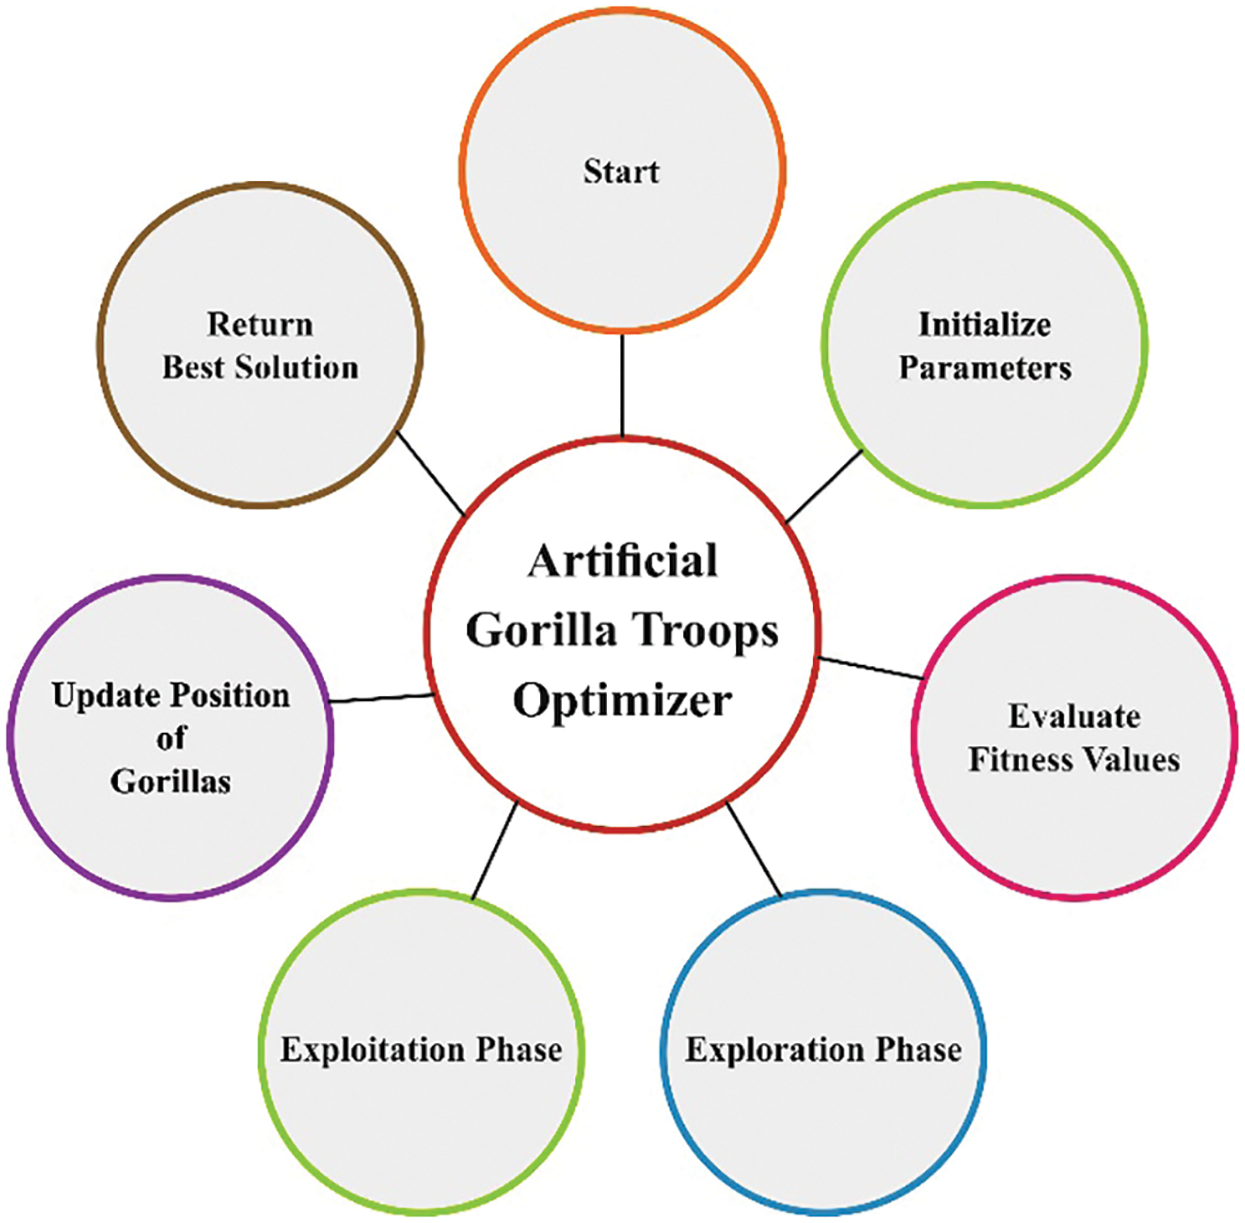
Figure 2: Flowchart of ATGO technique
In order to define an optimum group of routes by ATGO algorithm, the given function is employed to determine the subsequent hop to BS and is calculated as follows.
The drive is to determine an optimal set of routes from CHs to BS using an FF that comprises of two parameters such as energy and distance. Primarily, the RE of next-hop nodes is determined and the node with high energy is fixed as relay node. Hence, the nodes with high RE are offered as next-hop nodes. A primary sub-objective
In addition, the Euclidean distance is also executed to define the distance from CHs to BS. In general, minimized energy dissipation depends on the broadcasted distance. Thus, the node with lesser distances is chosen for relay nodes. Therefore, the next sub-objective, by means of distance i.e.,
The above-mentioned sub-objective is revised to FF, whereas
In order to ensure the enhanced performance of the proposed IDTOMHR model, the authors conducted multiple experiments and the results are discussed in this section. Tab. 1 provides the comprehensive comparative study results achieved by IDTOMHR model and other recent models [22] in terms of Network Lifetime (NLFT), Total Energy Consumption (TEC), and Average Residual Energy (ARE).
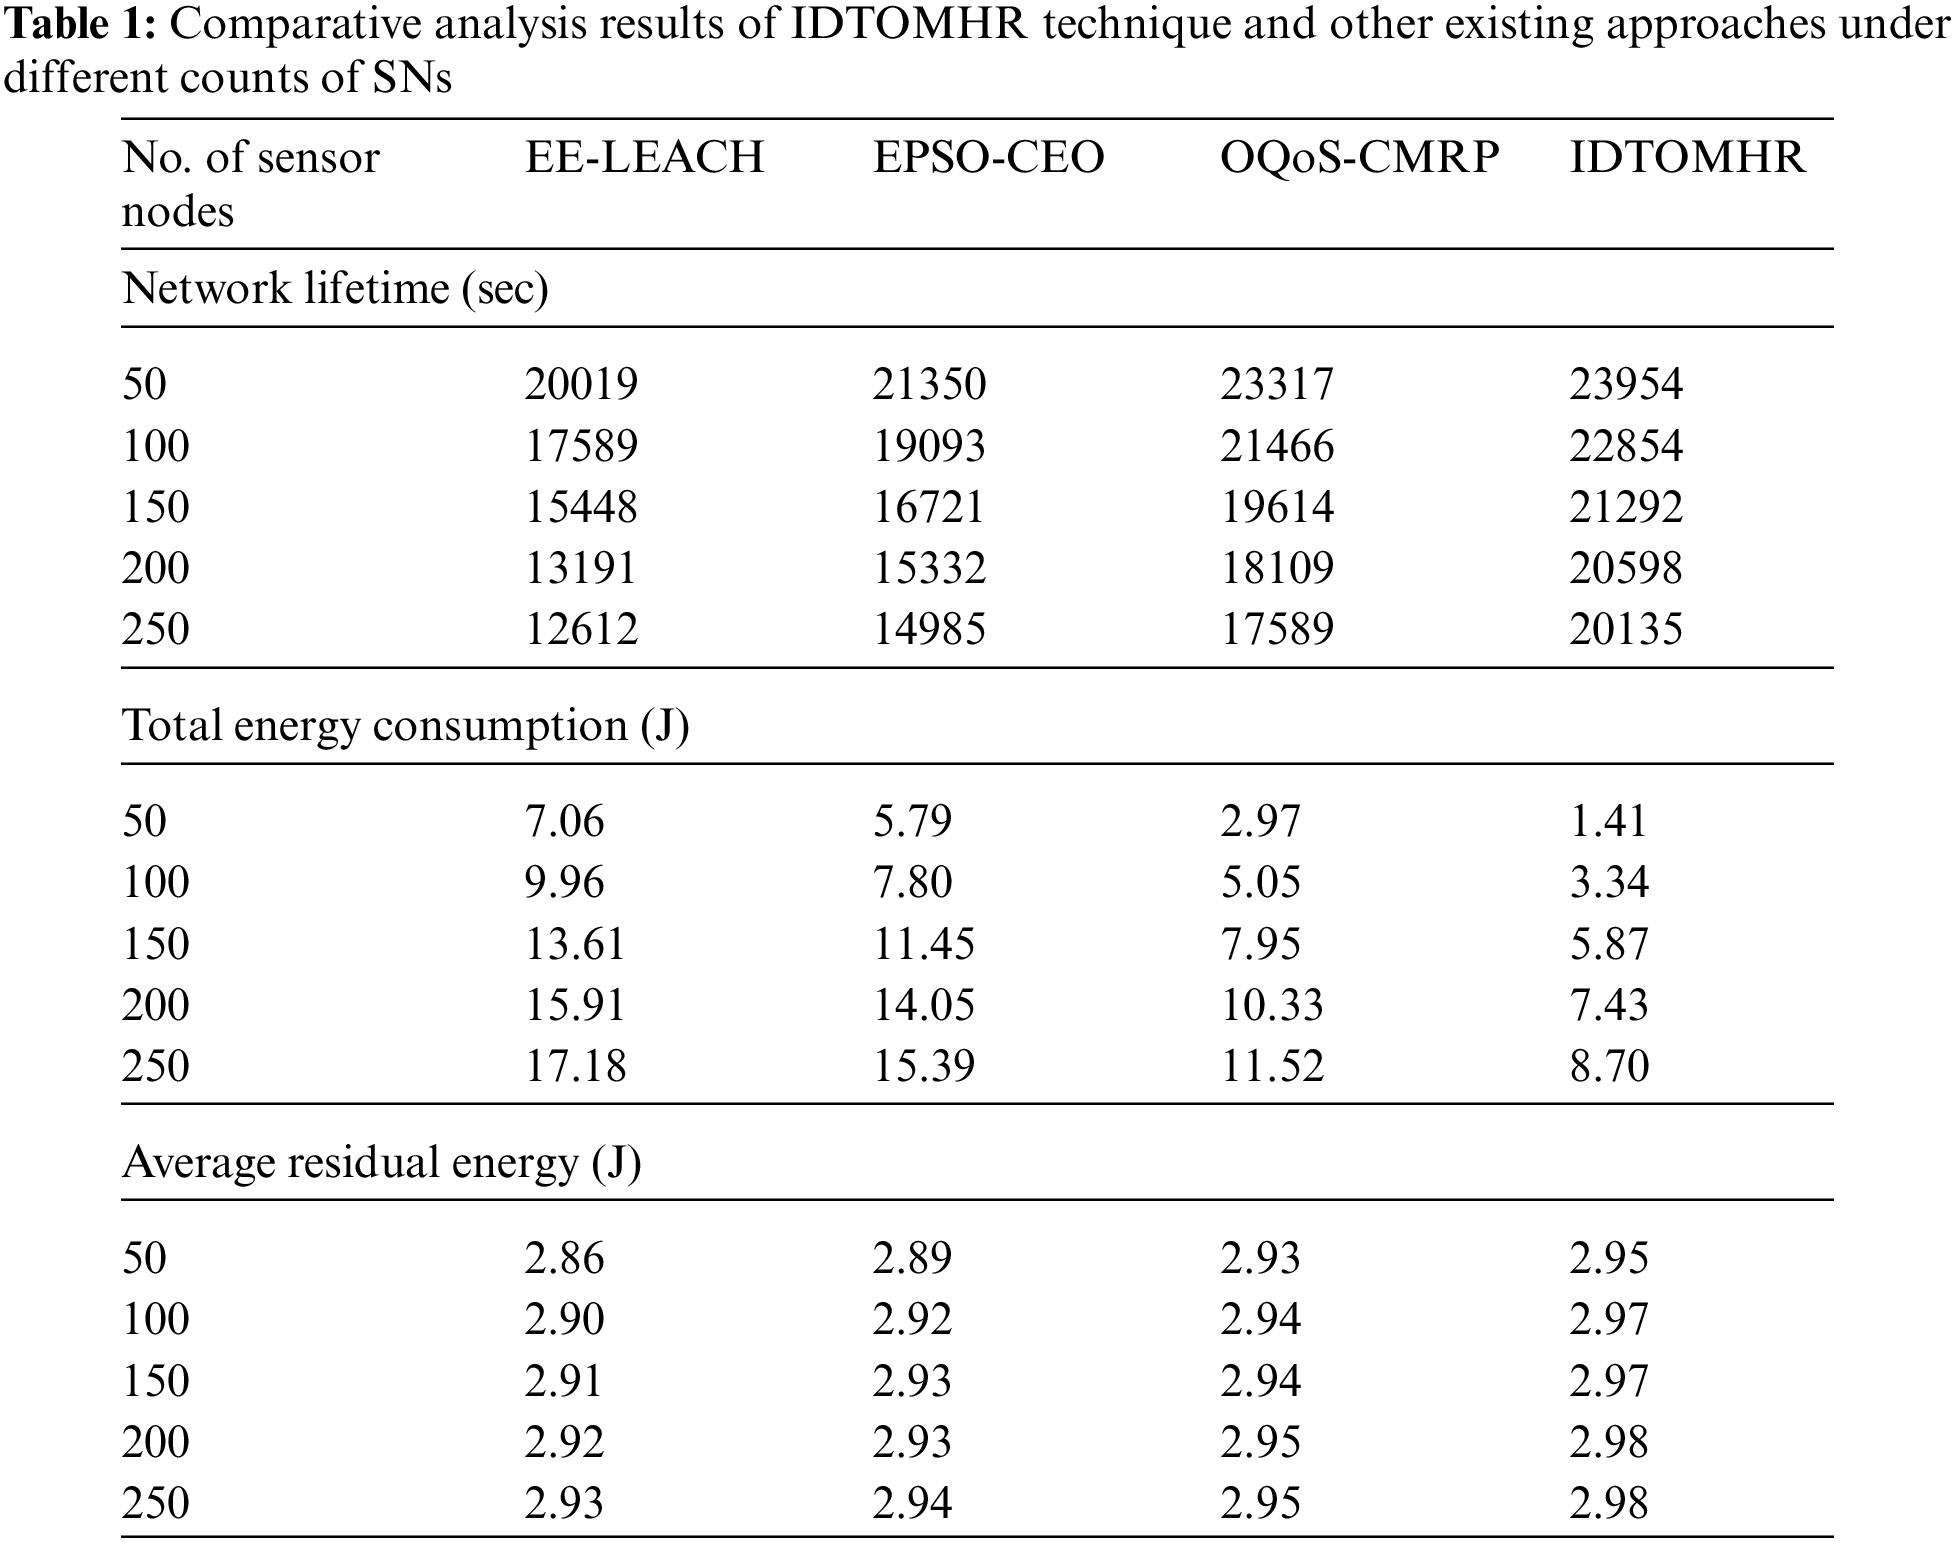
Fig. 3 highlights the NLFT analysis results achieved by IDTOMHR model and other existing models under distinct SNs. The obtained values imply that the proposed IDTOMHR model accomplished an improved NLFT over other methods. For instance, with 50 SNs, IDTOMHR model offered a high NLFT of 23954 s, whereas EE-LEACH, EPSO-CEO, and OQoS-CMRP models reached the least NLFT values such as 20019 s, 13250 s, and 23317 s respectively. Moreover, with 150 SNs, the proposed IDTOMHR model achieved an improved NLFT of 21292 s, whereas EE-LEACH, EPSO-CEO, and OQoS-CMRP models achieved the least NLFT values such as 15448 s, 16721 s, and 19614 s respectively. At last, with 250 SNs, the proposed IDTOMHR model produced a superior NLFT of 20135 s, whereas EE-LEACH, EPSO-CEO, and OQoS-CMRP models reached less NLFT values such as 12612 s, 14985 s, and 17589 s respectively.
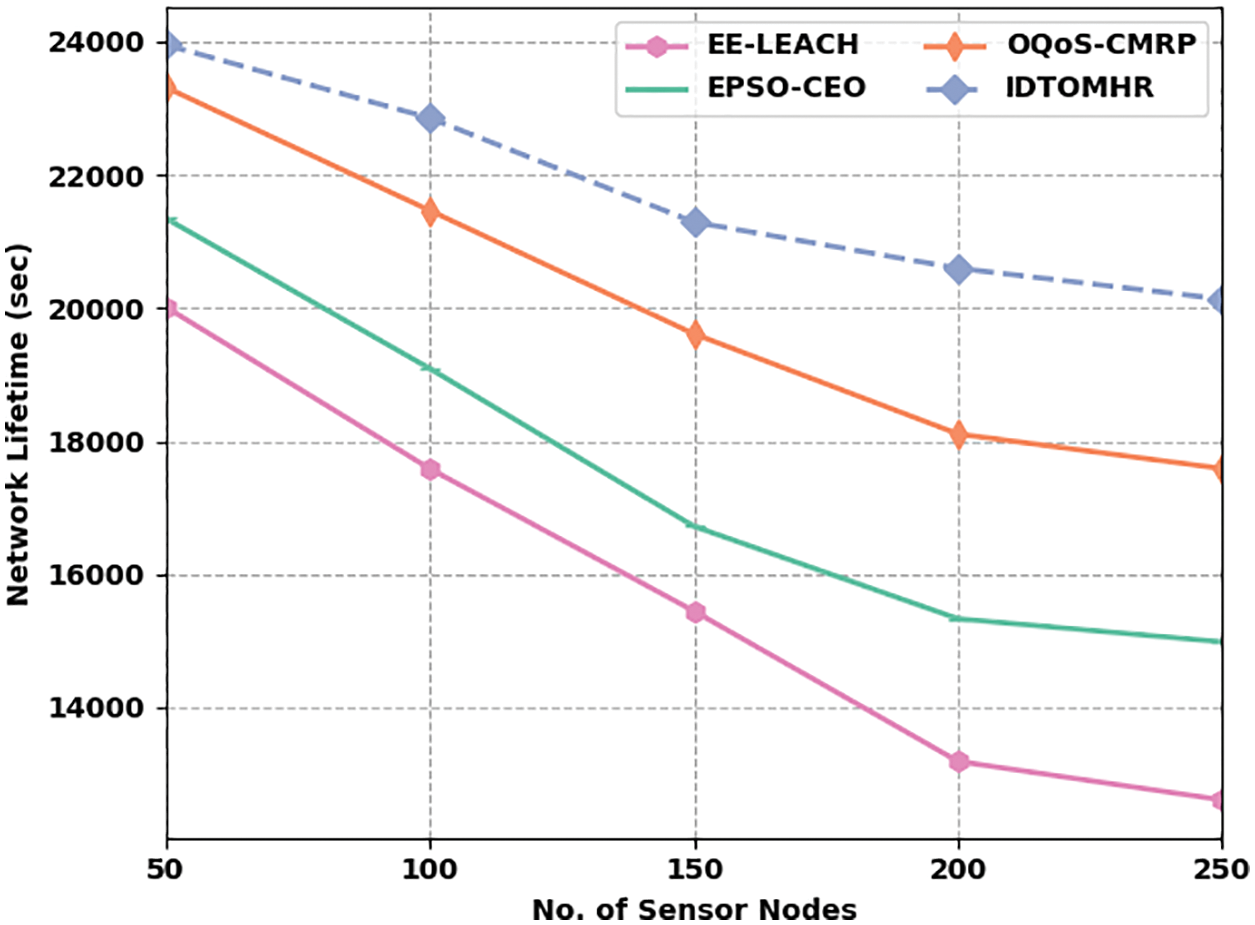
Figure 3: NLFT analysis results of IDTOMHR approach under different counts of SNs
Fig. 4 illustrates the TEC assessment results accomplished by IDTOMHR model and other existing models under dissimilar SNs. The figure portrays that the proposed IDTOMHR model produced the least TEC over other methods. For instance, with 50 SNs, the proposed IDTOMHR model reached a low TEC of 1.14 J, whereas EE-LEACH, EPSO-CEO, and OQoS-CMRP models attained the highest TEC values such as 7.06 J, 5.79 J, and 2.97 J respectively. Furthermore, with 150 SNs, the proposed IDTOMHR model accomplished the least TEC of 5.87 J, whereas EE-LEACH, EPSO-CEO, and OQoS-CMRP models achieved high TEC values such as 13.61 J, 11.45 J, and 7.95 J respectively. Lastly, with 250 SNs, IDTOMHR model attained the least TEC of 8.70 J, whereas EE-LEACH, EPSO-CEO, and OQoS-CMRP models accomplished high TEC values such as 17.18 J, 15.39 J, and 11.52 J respectively.
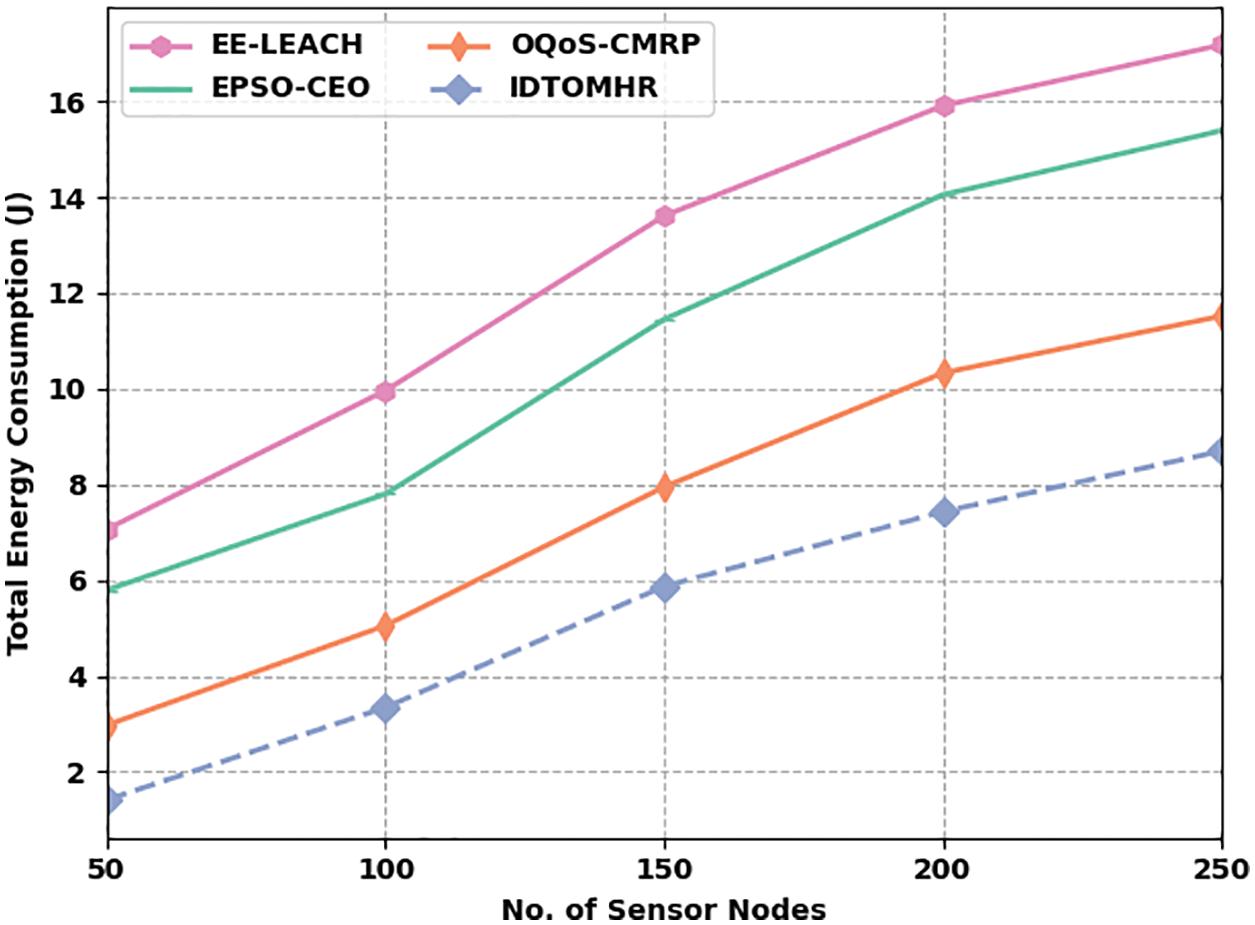
Figure 4: TEC analysis results of IDTOMHR approach under different counts of SNs
Fig. 5 portrays the ARE examination results achieved by IDTOMHR technique and other existing models under distinct SNs. The obtained values imply that IDTOMHR approach accomplished an enhanced ARE over other methods. For instance, with 50 SNs, IDTOMHR model offered an increased ARE of 2.95 J, whereas EE-LEACH, EPSO-CEO, and OQoS-CMRP approaches achieved the least ARE values such as 2.86 J, 2.89 J, and 2.93 J correspondingly. Furthermore, with 150 SNs, the proposed IDTOMHR model presented an improved ARE of 2.97 J, whereas EE-LEACH, EPSO-CEO, and OQoS-CMRP models obtained the least ARE values such as 2.91 J, 2.93 J, and 2.94 J correspondingly. Eventually, with 250 SNs, the proposed IDTOMHR model resulted in a superior ARE of 2.98 J, whereas EE-LEACH, EPSO-CEO, and OQoS-CMRP methods reached less ARE values such as 2.93 J, 2.94 J, and 2.95 J correspondingly.
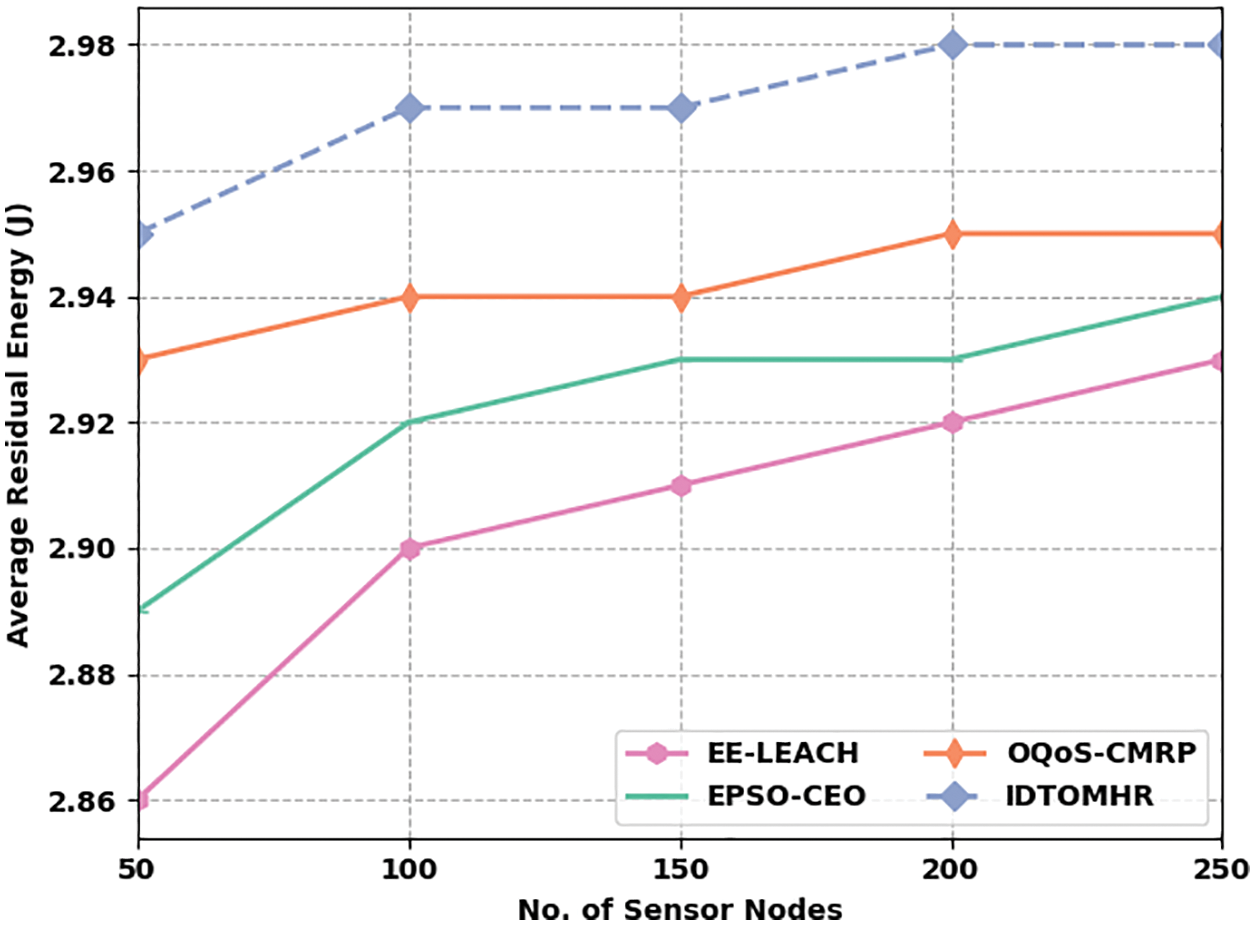
Figure 5: ARE analysis results of IDTOMHR approach under different counts of SNs
Tab. 2 demonstrates the results of comprehensive comparative analysis conducted between IDTOMHR technique and other recent models with respect to Packet Delivery Ratio (PDR) and Normalized Overhead (NO). Fig. 6 showcases the PDR analysis results achieved by IDTOMHR model and other existing models under distinct Simulation Time (ST). The values obtained from the analysis imply that the proposed IDTOMHR model accomplished an improved PDR over other methods. For instance, with 100 s STs, IDTOMHR model offered an increased PDR of 96.28%, whereas EE-LEACH, EPSO-CEO, and OQoS-CMRP approaches achieved less PDR values such as 84.29%, 88.04%, and 94.22% correspondingly. Furthermore, with 300 STs, the proposed IDTOMHR technique achieved an enhanced PDR of 94.78%, whereas EE-LEACH, EPSO-CEO, and OQoS-CMRP models offered less PDR values such as 79.23%, 83.73%, and 92.16% correspondingly. Finally, with 500 s STs, IDTOMHR model resulted in a superior PDR of 89.91%, whereas EE-LEACH, EPSO-CEO, and OQoS-CMRP models produced the least PDR values such as 75.86%, 79.80%, and 85.42% correspondingly.
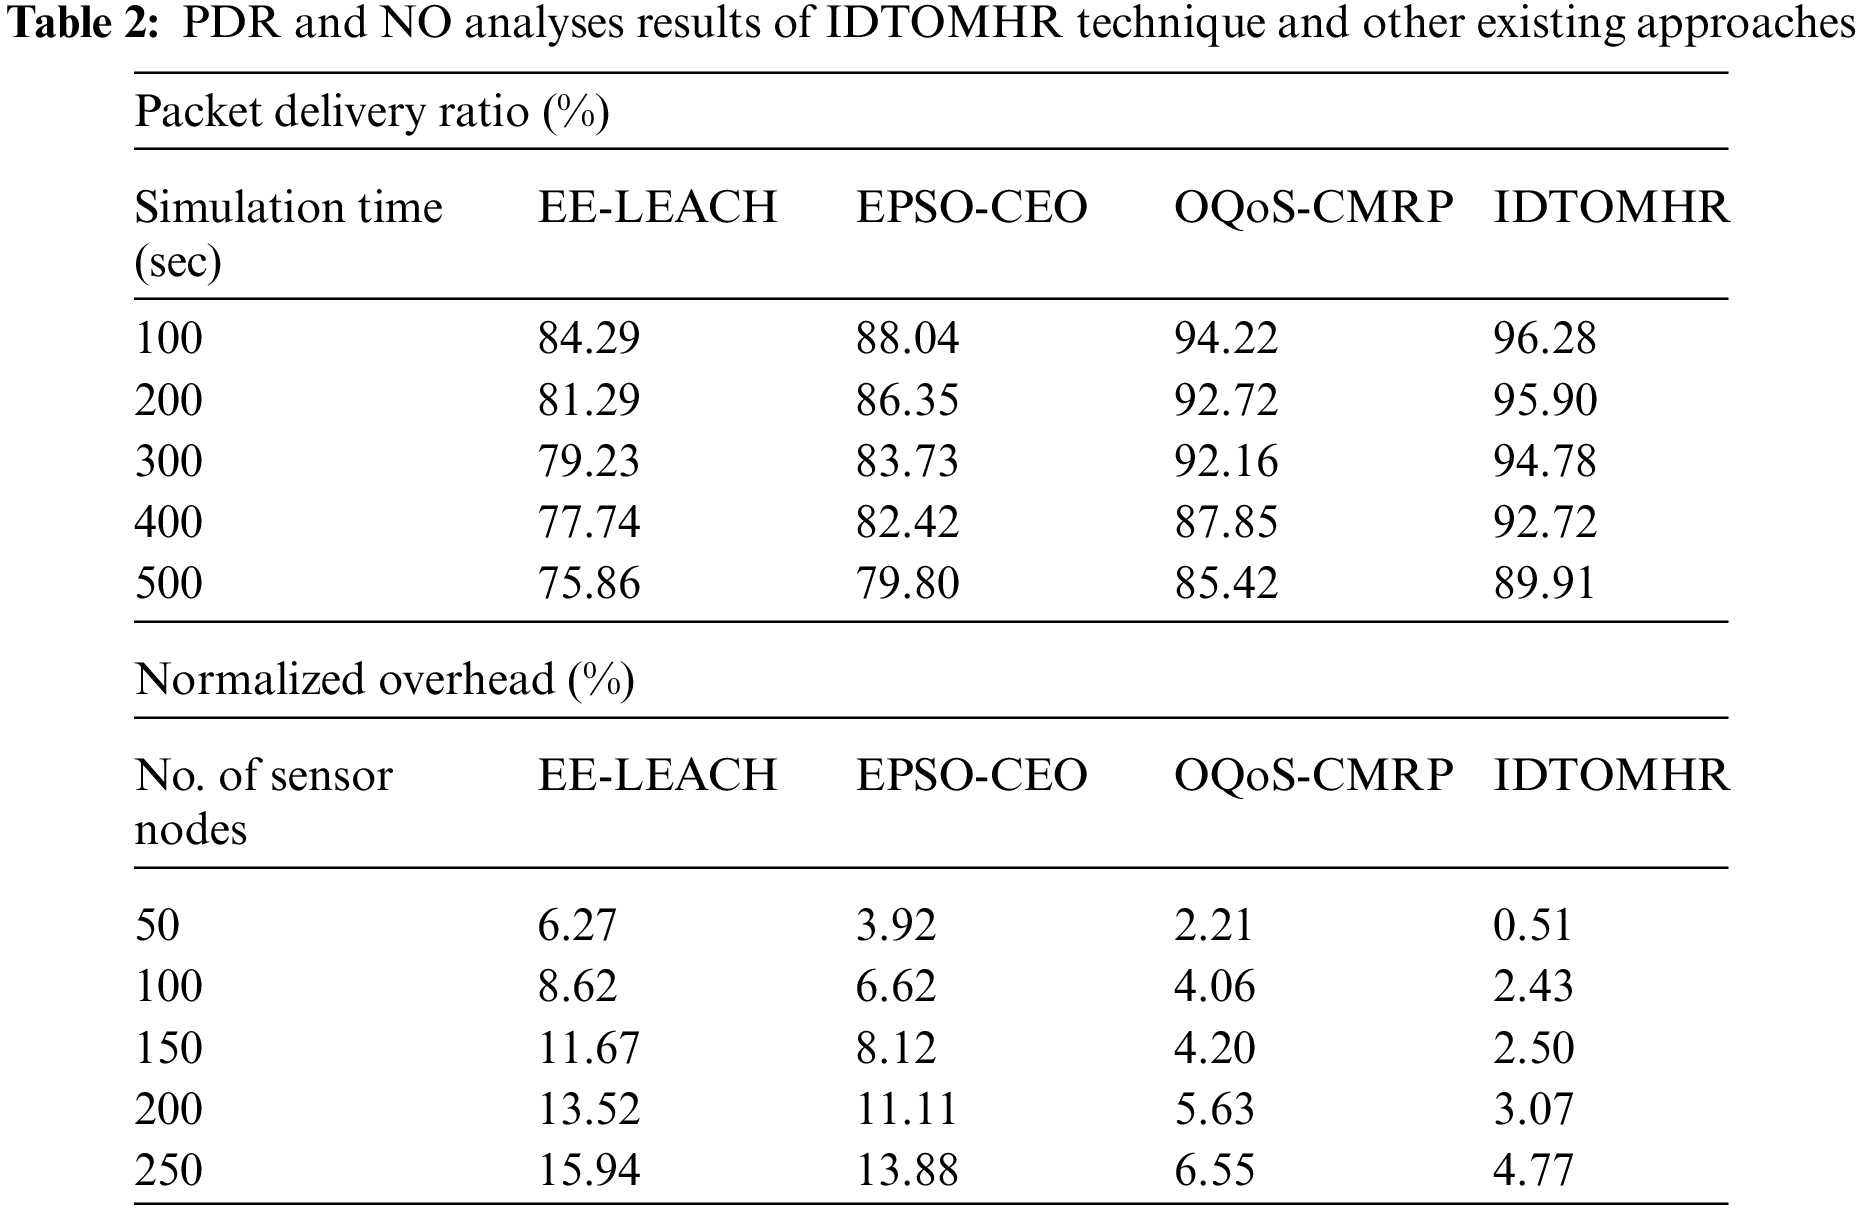
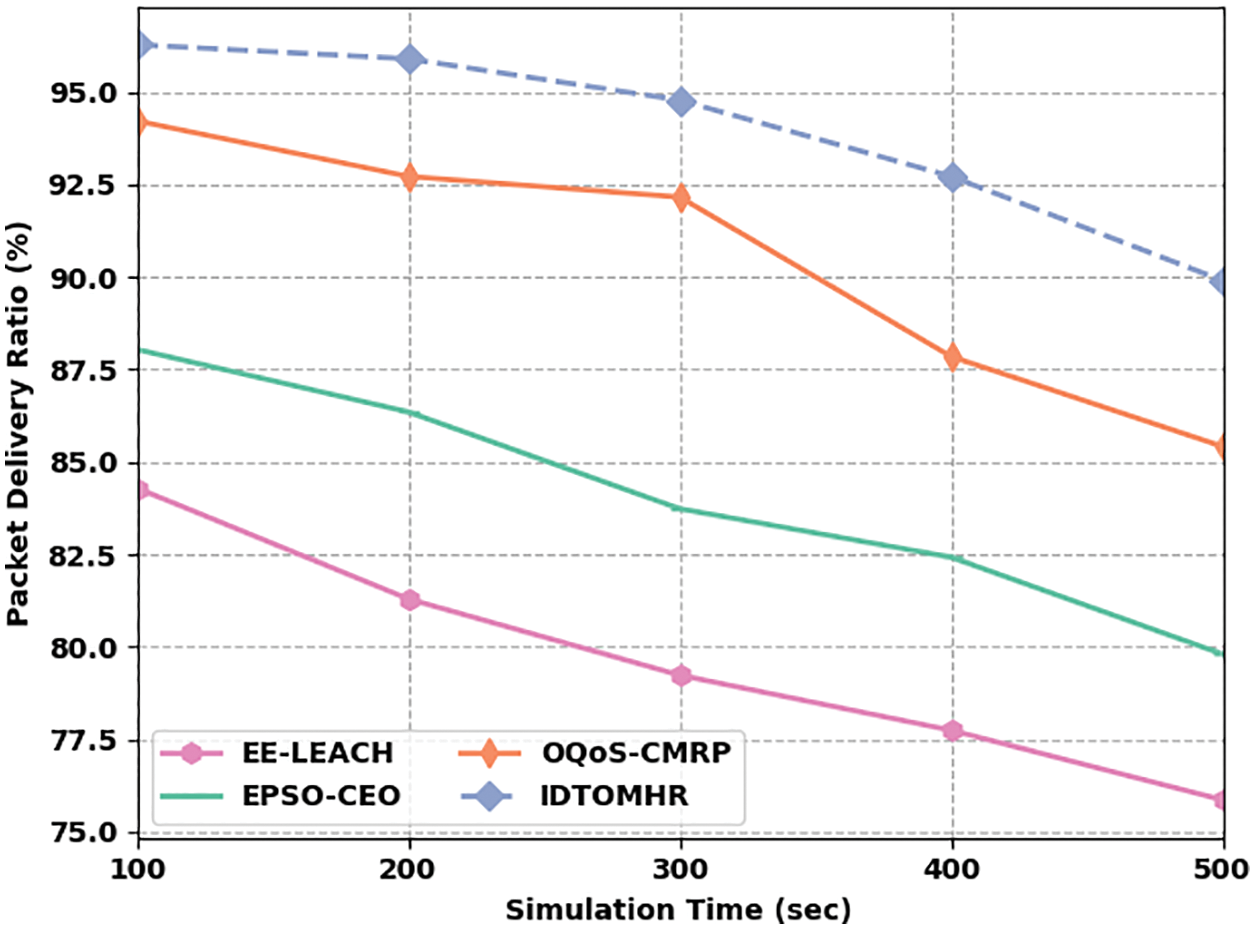
Figure 6: PDR analysis results of IDTOMHR approach under various STs
Fig. 7 defines the NO assessment results accomplished by IDTOMHR algorithm and other existing models under dissimilar SNs. The figure imply that the proposed IDTOMHR model produced the least NO compared to other methods. For instance, with 50 SNs, the proposed IDTOMHR system reached the least NO of 0.51%, whereas EE-LEACH, EPSO-CEO, and OQoS-CMRP models attained high NO values such as 6.27%, 3.92%, and 2.21% correspondingly. Also, with 150 SNs, the proposed IDTOMHR technique accomplished a less NO of 2.50%, whereas EE-LEACH, EPSO-CEO, and OQoS-CMRP techniques attained high NO values such as 11.67%, 8.12%, and 4.20% respectively. Followed by, with 250 SNs, the proposed IDTOMHR model attained the least NO of 4.77%, whereas EE-LEACH, EPSO-CEO, and OQoS-CMRP techniques accomplished high NO values such as 15.94%, 13.88%, and 6.55% correspondingly.
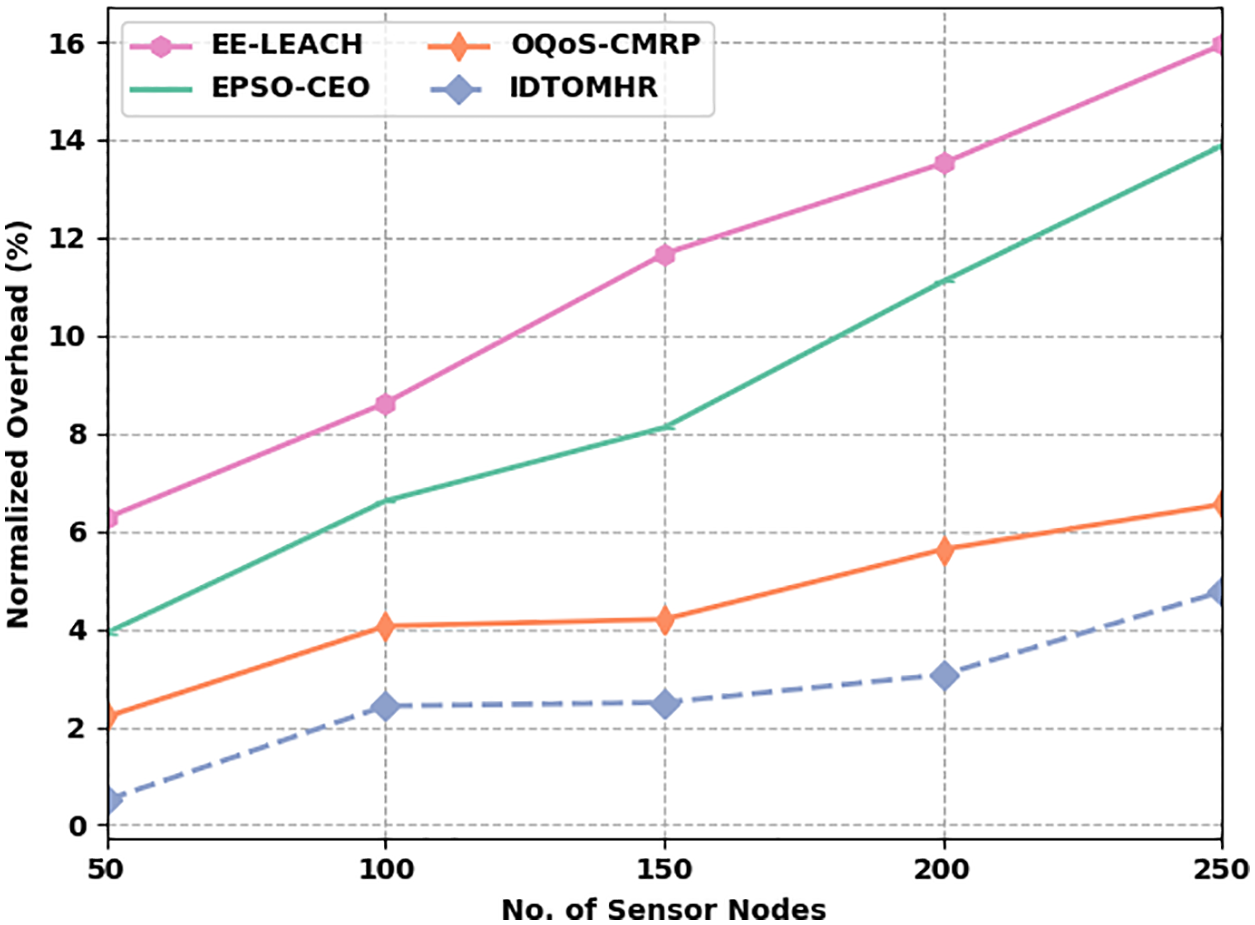
Figure 7: NO analysis results of IDTOMHR approach under various SNs
Tab. 3 shows the comprehensive comparative analysis results achieved by IDTOMHR model and other recent algorithms in terms of Throughput (THPT) and End to End Delay (ETED).
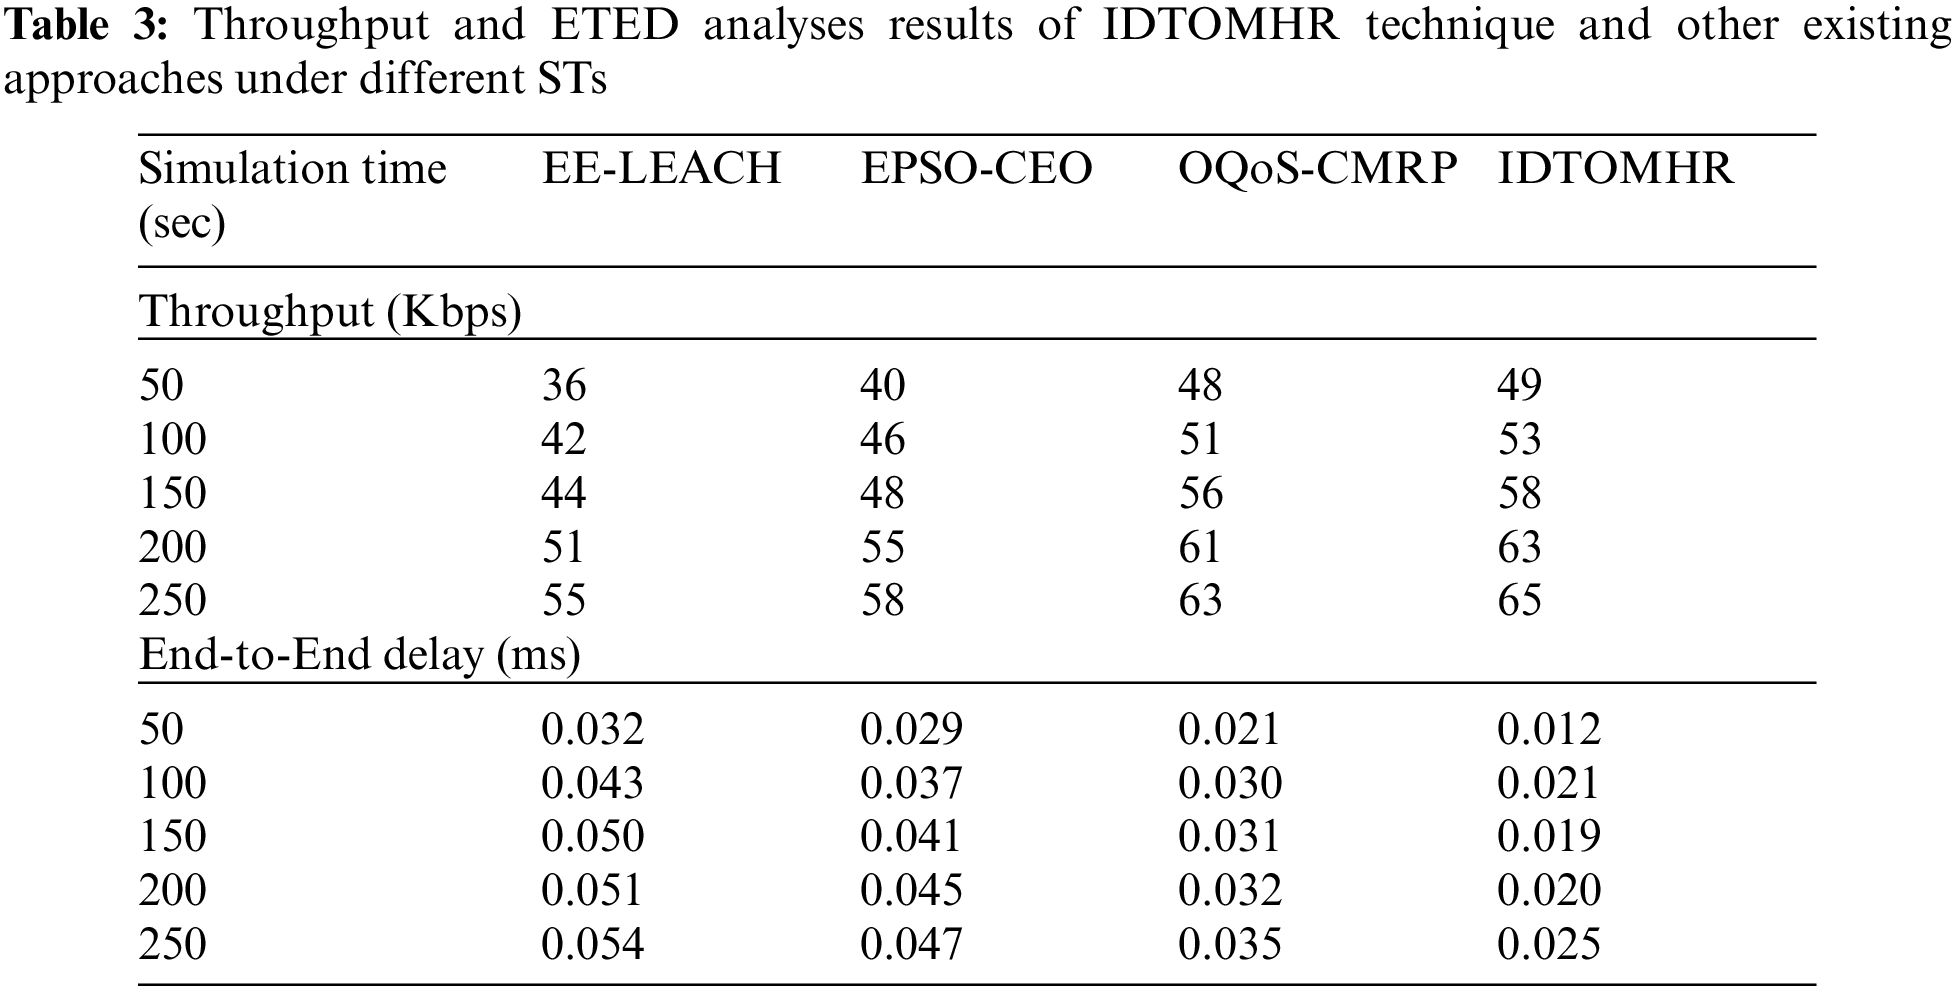
Fig. 8 illustrates the THPT examination results achieved by IDTOMHR algorithm and other existing models under distinct STs. The obtained values imply that the proposed IDTOMHR system accomplished a high THPT over other algorithms. For sample, with 50 s STs, the proposed IDTOMHR model obtained an enhanced THPT of 49 Kbps, whereas EE-LEACH, EPSO-CEO, and OQoS-CMRP models reached low THPT values such as 36 Kbps, 40 Kbps, and 48 Kbps respectively. Moreover, with 150 s STs, the proposed IDTOMHR system achieved an improved THPT of 58 Kbps, whereas EE-LEACH, EPSO-CEO, and OQoS-CMRP methods offered low THPT values such as 44 Kbps, 48 Kbps, and 58 Kbps respectively. Finally, with 250 s STs, the proposed IDTOMHR model produced a superior THPT of 65 Kbps, whereas EE-LEACH, EPSO-CEO, and OQoS-CMRP models achieved less THPT values such as 55 Kbps, 58 Kbps, and 63 Kbps correspondingly.
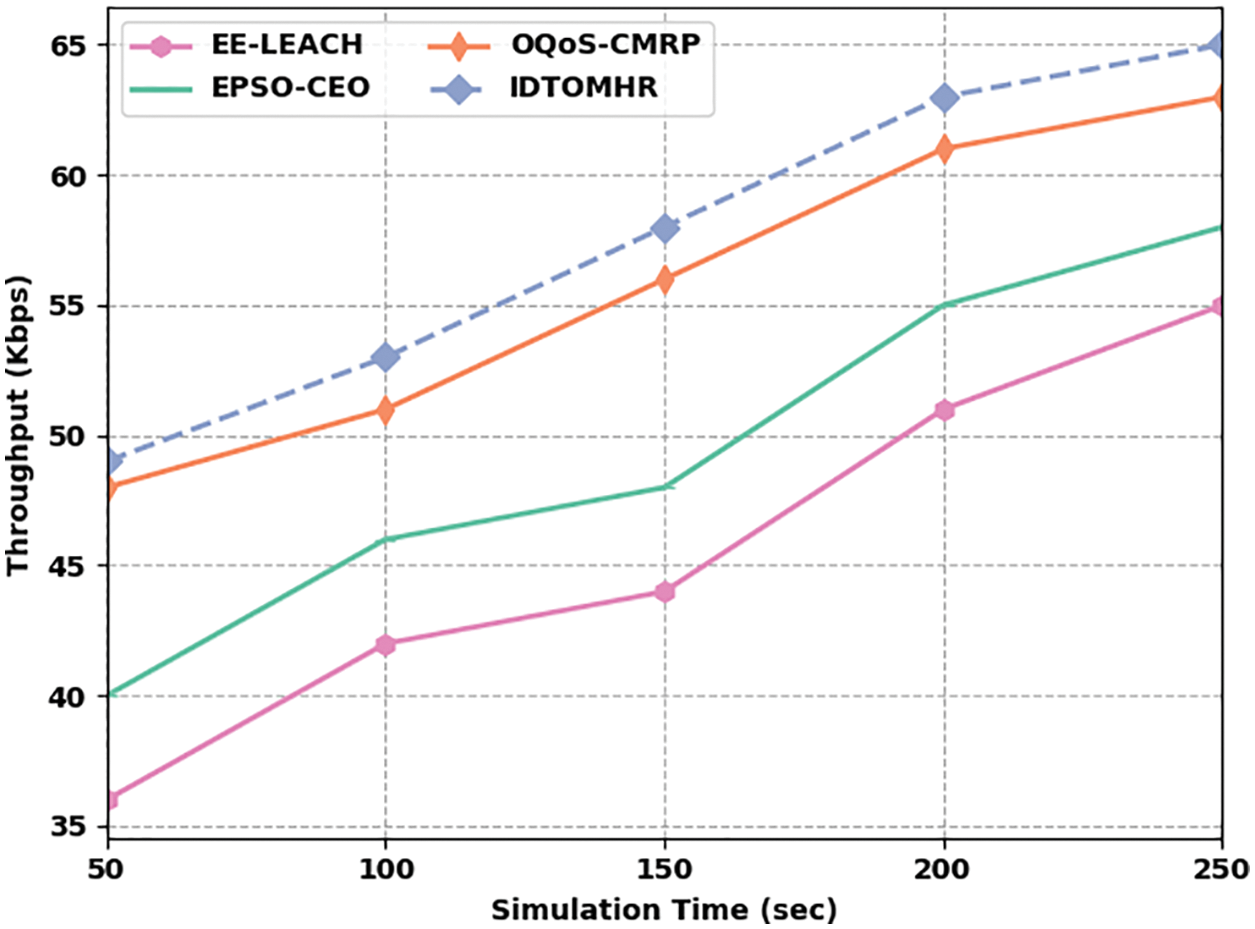
Figure 8: Throughput analysis of IDTOMHR approach under different STs
Fig. 9 exhibits the ETED analysis results accomplished by IDTOMHR model and other existing models under dissimilar STs. The figure shows that the proposed IDTOMHR model achieved the least ETED over other methods and showed excellent performance. For instance, with 50 s STs, IDTOMHR model reached a less ETED of 0.012 ms, whereas EE-LEACH, EPSO-CEO, and OQoS-CMRP models attained high ETED values such as 0.032 ms, 0.029 ms, and 0.021 ms respectively. Besides, with 150 s STs, the proposed IDTOMHR model accomplished a low ETED of 0.019 ms, whereas EE-LEACH, EPSO-CEO, and OQoS-CMRP models reached high ETED values such as 0.050 ms, 0.041 ms, and 0.031 ms correspondingly. At last, with 250 s STs, the proposed IDTOMHR model attained the least ETED of 0.025 ms, whereas EE-LEACH, EPSO-CEO, and OQoS-CMRP models accomplished high ETED values such as 0.054 s, 0.047 ms, and 0.035 ms respectively.
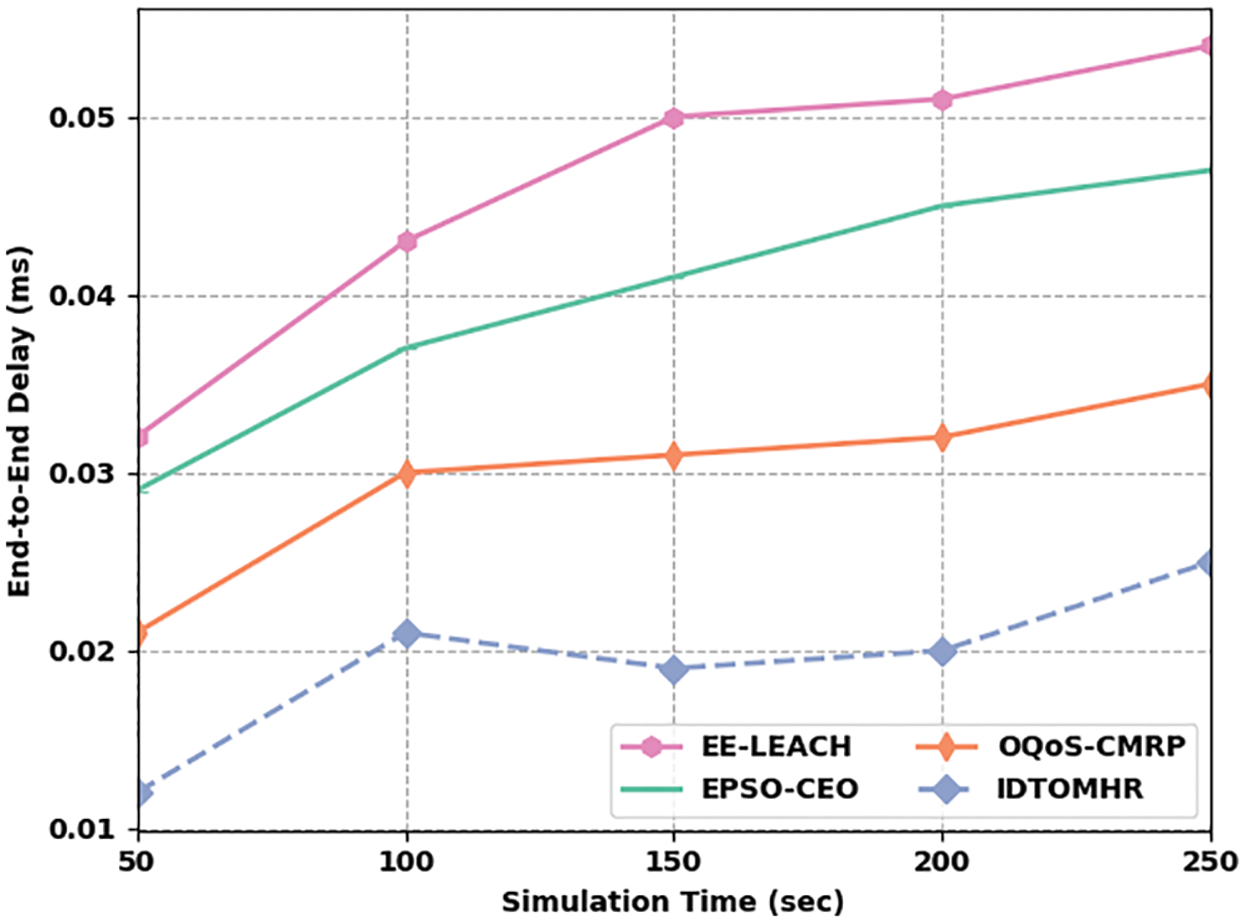
Figure 9: ETED analysis of IDTOMHR approach under different STs
After a detailed examination of the results, it is evident that the proposed IDTOMHR model improved the lifespan of WSNs compared to other methods.
In this study, a novel IDTOMHR approach has been developed to increase the energy effectiveness and lifespan of WSN. Initially, IDTO algorithm is exploited for effectual CH selection and cluster construction tasks. Next, ATGO approach is utilized to derive an optimum set of routes to reach the destination. Both clustering and routing approaches derive a fitness function with the inclusion of multiple input parameters. The proposed IDTOMHR technique was experimentally validated under different aspects. The extensive experimental results established the better performance of IDTOMHR technique over recent approaches. Thus, the presented IDTOMHR method can be utilized to improve overall network efficiency in WSN. In future, energy-aware data aggregation and intrusion detection schemes can be developed for WSN.
Funding Statement: The authors extend their appreciation to the Deanship of Scientific Research at King Khalid University for funding this work through Large Groups Project under grant number (45/43). Princess Nourah bint Abdulrahman University Researchers Supporting Project Number (PNURSP2022R238), Princess Nourah bint Abdulrahman University, Riyadh, Saudi Arabia. The authors would like to thank the Deanship of Scientific Research at Umm Al-Qura University for supporting this work by Grant Code: 22UQU4210118DSR14.
Conflicts of Interest: The authors declare that they have no conflicts of interest to report regarding the present study.
References
1. I. Daanoune, B. Abdennaceur and A. Ballouk, “A comprehensive survey on LEACH-based clustering routing protocols in wireless sensor networks,” Ad Hoc Networks, vol. 114, pp. 102409, 2021. [Google Scholar]
2. S. Arjunan and P. Sujatha, “Lifetime maximization of wireless sensor network using fuzzy based unequal clustering and ACO based routing hybrid protocol,” Applied Intelligence, vol. 48, no. 8, pp. 2229–2246, 2018. [Google Scholar]
3. Q. Wang, D. Lin, P. Yang and Z. Zhang, “An energy-efficient compressive sensing-based clustering routing protocol for WSNs,” IEEE Sensors Journal, vol. 19, no. 10, pp. 3950–3960, 2019. [Google Scholar]
4. S. Arjunan and P. Sujatha, “A survey on unequal clustering protocols in wireless sensor networks,” Journal of King Saud University-Computer and Information Sciences, vol. 33, no. 1, pp. 118, 2021. [Google Scholar]
5. G. Han and L. Zhang, “WPO-EECRP: Energy-efficient clustering routing protocol based on weighting and parameter optimization in WSN,” Wireless Personal Communications, vol. 98, no. 1, pp. 1171–1205, 2018. [Google Scholar]
6. Z. Zhao, K. Xu, G. Hui and L. Hu, “An energy-efficient clustering routing protocol for wireless sensor networks based on agnes with balanced energy consumption optimization,” Sensors, vol. 18, no. 11, pp. 3938, 2018. [Google Scholar]
7. I. Abunadi, M. M. Althobaiti, F. N. Al-Wesabi, A. M. Hilal, M. Medani et al., “Federated learning with blockchain assisted image classification for clustered UAV networks,” Computers, Materials & Continua, vol. 72, no. 1, pp. 1195–1212, 2022. [Google Scholar]
8. S. Arjunan, S. Pothula and D. Ponnurangam, “F5N-based unequal clustering protocol (F5NUCP) for wireless sensor networks,” International Journal of Communication Systems, vol. 31, no. 17, pp. e3811, 2018. [Google Scholar]
9. F. N. Al-Wesabi, M. Obayya, M. Hamza, J. S. Alzahrani, D. Gupta et al., “Energy aware resource optimization using unified metaheuristic optimization algorithm allocation for cloud computing environment,” Sustainable Computing: Informatics and Systems, vol. 35, 2022. [Google Scholar]
10. M. A. Alohali, F. N. Al-Wesabi, A. M. Hilal, S. Goel, D. Gupta et al., “Artificial intelligence enabled intrusion detection systems for cognitive cyber-physical systems in industry 4.0 environment,” Cognitive Neurodynamics, 2022. [Google Scholar]
11. M. Shafiq, H. Ashraf, A. Ullah and S. Tahira, “Systematic literature review on energy efficient routing schemes in wsn–a survey,” Mobile Networks and Applications, vol. 25, no. 3, pp. 882–895, 2020. [Google Scholar]
12. P. Sirohi, F. N. Al-Wesabi, H. M. Alshahrani, P. Maheshwari, A. Agarwal et al., “Energy-efficient cloud service selection and recommendation based on QoS for sustainable smart cities,” Applied Sciences, vol. 11, 2021. [Google Scholar]
13. S. Famila, A. Jawahar, A. Sariga and K. Shankar, “Improved artificial bee colony optimization based clustering algorithm for SMART sensor environments,” Peer-to-Peer Networking and Applications, vol. 13, no. 4, pp. 1071–1079, 2020. [Google Scholar]
14. J. Uthayakumar, T. Vengattaraman and P. Dhavachelvan, “A new lossless neighborhood indexing sequence (NIS) algorithm for data compression in wireless sensor networks,” Ad Hoc Networks, vol. 83, pp. 149–157, 2019. [Google Scholar]
15. N. Mittal, “Moth flame optimization based energy efficient stable clustered routing approach for wireless sensor networks,” Wireless Personal Communications, vol. 104, no. 2, pp. 677–694, 2019. [Google Scholar]
16. P. Rawat and S. Chauhan, “Probability based cluster routing protocol for wireless sensor network,” Journal of Ambient Intelligence and Humanized Computing, vol. 12, no. 2, pp. 2065–2077, 2021. [Google Scholar]
17. W. Fang, W. Zhang, W. Chen, J. Liu, Y. Ni et al., “MSCR: Multidimensional secure clustered routing scheme in hierarchical wireless sensor networks,” EURASIP Journal on Wireless Communications and Networking, vol. 2021, no. 1, pp. 14, 2021. [Google Scholar]
18. Z. Wang, H. Ding, B. Li, L. Bao, Z. Yang et al., “Energy efficient cluster based routing protocol for wsn using firefly algorithm and ant colony optimization,” Wireless Personal Communications, 2022, http://doi.org/10.1007/s11277-022-09651-9. [Google Scholar]
19. O. O. Ogundile, M. B. Balogun, O. E. Ijiga and E. O. Falayi, “Energy-balanced and energy-efficient clustering routing protocol for wireless sensor networks,” IET Communications, vol. 13, no. 10, pp. 1449–1457, 2019. [Google Scholar]
20. K. Arumugam, S. Ramasamy and D. Subramani, “Improved duck and traveler optimization (idto) algorithm: A two-way efficient approach for breast tumor segmentation using multilevel thresholding,” European Journal of Molecular & Clinical Medicine, vol. 7, no. 10, pp. 2020, 2020. [Google Scholar]
21. B. Abdollahzadeh, F. S. Gharehchopogh and S. Mirjalili, “Artificial gorilla troops optimizer: A new nature-inspired metaheuristic algorithm for global optimization problems,” International Journal of Intelligent Systems, vol. 36, no. 10, pp. 5887–5958, 2021. [Google Scholar]
22. O. Deepa and J. Suguna, “An optimized QoS-based clustering with multipath routing protocol for wireless sensor networks,” Journal of King Saud University-Computer and Information Sciences, vol. 32, no. 7, pp. 763–774, 2020. [Google Scholar]
 | This work is licensed under a Creative Commons Attribution 4.0 International License, which permits unrestricted use, distribution, and reproduction in any medium, provided the original work is properly cited. |