| Computers, Materials & Continua DOI:10.32604/cmc.2022.031583 | |
| Article |
Optimization of Adaptive Fuzzy Controller for Maximum Power Point Tracking Using Whale Algorithm
1Department of Electrical Engineering, Jouybar Branch, Islamic Azad University, Jouybar, Iran
2Department of Electrical Engineering, Semnan University, Semnan, Iran
3Department of Electrical and Electronics Engineering, Faculty of Engineering and Architectures, Nisantasi University, Istanbul, Turkey
4Department of Information Electronics, Fukuoka Institute of Technology, Fukuoka, Japan
*Corresponding Author: Mehrdad Ahmadi Kamarposhti. Email: mehrdad.ahmadi.k@gmail.com
Received: 21 April 2022; Accepted: 29 May 2022
Abstract: The advantage of fuzzy controllers in working with inaccurate and nonlinear inputs is that there is no need for an accurate mathematical model and fast convergence and minimal fluctuations in the maximum power point detector. The capability of online fuzzy tracking systems is maximum power, resistance to radiation and temperature changes, and no need for external sensors to measure radiation intensity and temperature. However, the most important issue is the constant changes in the amount of sunlight that cause the maximum power point to be constantly changing. The controller used in the maximum power point tracking (MPPT) circuit must be able to adapt to the new radiation conditions. Therefore, in this paper, to more accurately track the maximum power point of the solar system and receive more electrical power at its output, an adaptive fuzzy control was proposed, the parameters of which are optimized by the whale algorithm. The studies have repeated under different irradiation conditions and the proposed controller performance has been compared with perturb and observe algorithm (P&O) method, which is a practical and high-performance method. To evaluate the performance of the proposed algorithm, the particle swarm algorithm optimized the adaptive fuzzy controller. The simulation results show that the adaptive fuzzy control system performs better than the P&O tracking system. Higher accuracy and consequently more production power at the output of the solar panel is one of the salient features of the proposed control method, which distinguishes it from other methods. On the other hand, the adaptive fuzzy controller optimized by the whale algorithm has been able to perform relatively better than the controller designed by the particle swarm algorithm, which confirms the higher accuracy of the proposed algorithm.
Keywords: Maximum power tracking; photovoltaic system; adaptive fuzzy control; whale optimization algorithm; particle swarm optimization
In recent years, the use of solar energy to produce cheap, clean and unlimited electricity has become increasingly important. The high costs of project implementation as well as the low efficiency of energy conversion are inescapable disadvantages of solar systems. To reduce the weaknesses of this system, many efforts and researches have been done or are being done to improve the efficiency of energy conversion in it, by increasing the quality of solar panels and also extracting maximum power from solar systems. The electrical characteristics of solar systems are inherently nonlinear, and these characteristics are a function of environmental conditions such as the intensity of solar radiation, the surface temperature of the panel, and the amount of charge attached to it. As a result, by carefully selecting the converter operating point installed at the output of the solar panel, the maximum electrical power can be received from the panel in different conditions of radiation and temperature [1]. By changing the radiation and temperature conditions in solar power generation systems, the maximum power point of the panel changes and therefore it should be using the maximum power point tracking (MPPT) patterns, the amount of power extracted from the solar panel can always be at a constant maximum value. Hold and, more simply, track the maximum power point. Extensive research has been done to find the maximum power point of the solar panel, some of which are briefly reviewed below. The basis of maximum power point tracking methods can be divided into four categories [2]. The first group is the methods based on the exact model of the solar cell and finding the relationships in the model presented at maximum power. But the main weakness of these methods is the lack of flexibility with changing the solar cell. That is, the results obtained for one type of cell from a particular manufacturer for another type of cell that has another manufacturer are not approved [3]. Also, if the selection of solar cell parameters has an error, the search for the maximum power point is always associated with a relatively large error [4]. The second category is methods based on the relationship between the operating point of the system and the parameters of the solar cell. In this tracking method, using the linear relationship between the operating point voltage of the panel and its open circuit voltage, the maximum power point is searched [5]. However, the relationship between the operating point of the panel and the open circuit voltage is completely non-linear, and linearization causes an error in accurate tracking. On the other hand, switching off the solar system several times to measure the voltage of the open circuit causes a loss of electrical power and reduces efficiency [6]. The third category of tracking is based on following the basic algorithm. Such methods can be called perturbation and observation methods. The principles of perturbation and observation method are based on creating perturbation in the output voltage of the system and examining its output power. If the output power increases with perturbation, the perturbation continues in the same direction and vice versa, if the power decreases, the next perturbation is applied in reverse [7]. The perturbation tracking and observation method searches for the maximum power point without the need for solar cell parameters. However, the main weakness of this method is the constant fluctuations around the maximum power point, which will cause a power ripple [8]. Finally, the fourth category is methods based on artificial intelligence. In this category, fuzzy logic and neural networks will be used to track the maximum power point of the solar system. High accuracy and speed of response as well as no loss of maximum power point in semi-shady conditions are prominent features of intelligent methods [9]. Also, in the presence of uncertainty in solar radiation information, the controller is able to track the maximum power point.
Despite the many MPPT methods available to photovoltaic system users, it is possible to select the best suitable method for the required application [10–15]. Occurrence of several local maximum points due to relative shadow in a photovoltaic array can be a real obstacle to the proper operation of an MPP tracker. If a local maximum is followed instead of the actual MPP, it will cause significant power loss [16–19]. The basis of the controller proposed in this paper is based on the relationship between radiation intensity and maximum point voltage. With this relationship, at any moment by measuring the intensity of the glow, the maximum power point voltage can be calculated and the system puts the output at the maximum power point voltage. In the proposed Ripple method, the output power of the solar system is minimal. In this paper, the adaptive fuzzy method will be used to track the maximum power of the photovoltaic system, which in addition to its high efficiency, this tracking method also has low output fluctuations in the steady state. For this purpose, a powerful whale optimization algorithm will be used to improve the proposed adaptive fuzzy control method. High accuracy and speed of convergence as well as no trapping at local maximum power points are the prominent characteristics of the proposed controller in the maximum power tracker circuit.
The proposed controller is an adaptive fuzzy controller, in which the fuzzy controller is used in parallel. The proposed adaptive fuzzy controller structure is such that the type and structure of the system under study are ignored first, and then the stability of the system is guaranteed and the frequency changes are minimized. To solve the problems that classical controllers have in different working conditions and also to increase the power received from the solar system, fuzzy controllers have been used as the maximum power point tracking circuit in the control system. The proposed adaptive fuzzy controller, as an efficient controller, is used in the field tracking studies of the maximum power of the photovoltaic system. The performance of the proposed controller is such that the output value of the controller is finally adjusted by the adaptive section. For better controller performance, the whale algorithm is used, which has good convergence speed and efficiency to optimize nonlinear functions. Fig. 1 shows the proposed controller.
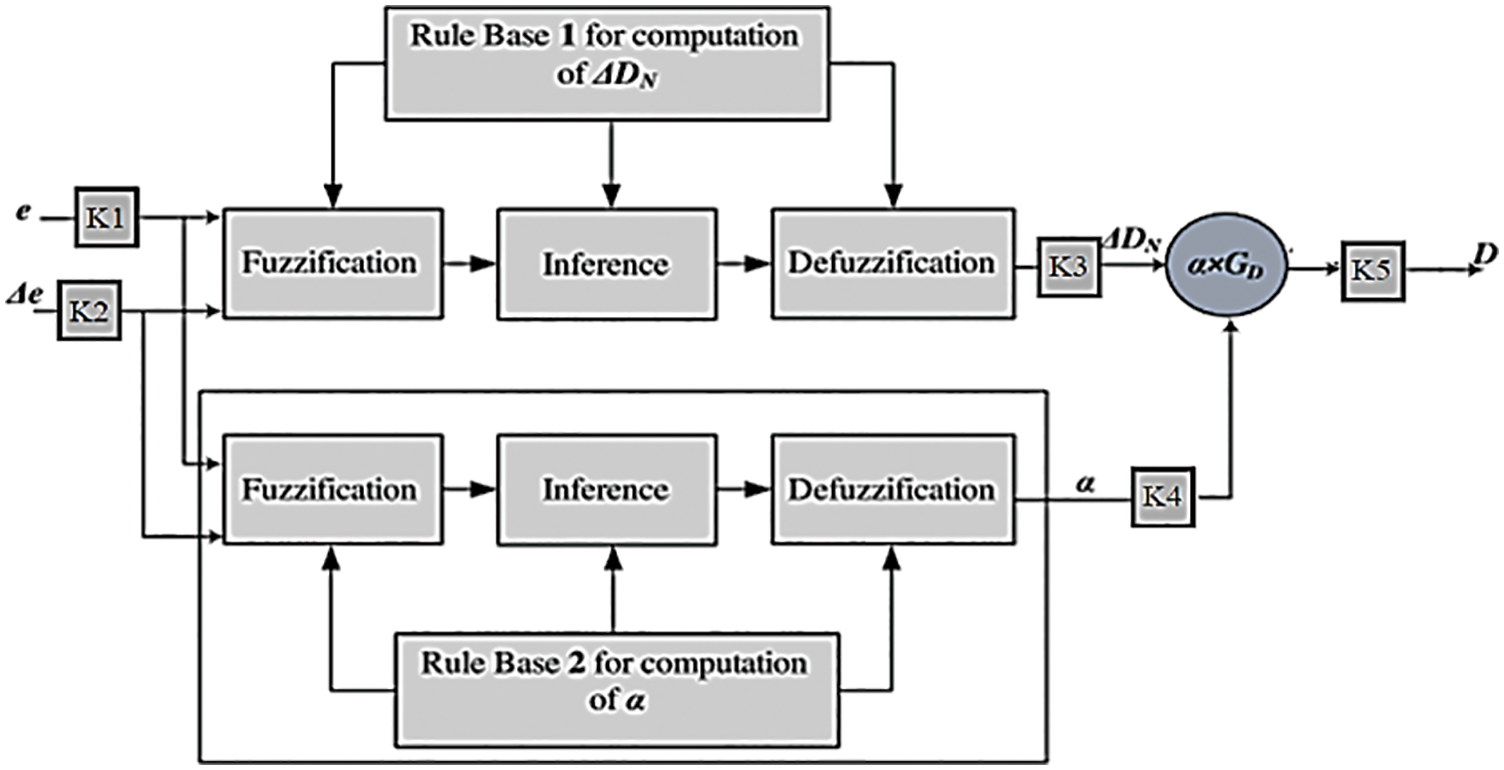
Figure 1: The proposed controller
The input signal of the fuzzy controllers is the power error and its derivative, and the output of these controllers is sent to the pulse generator circuit to generate the appropriate voltage to produce the converter control signals. The input and output membership functions for the fuzzy controllers of the main section and the adaptive section are shown in Figs. 2 and 3, respectively.
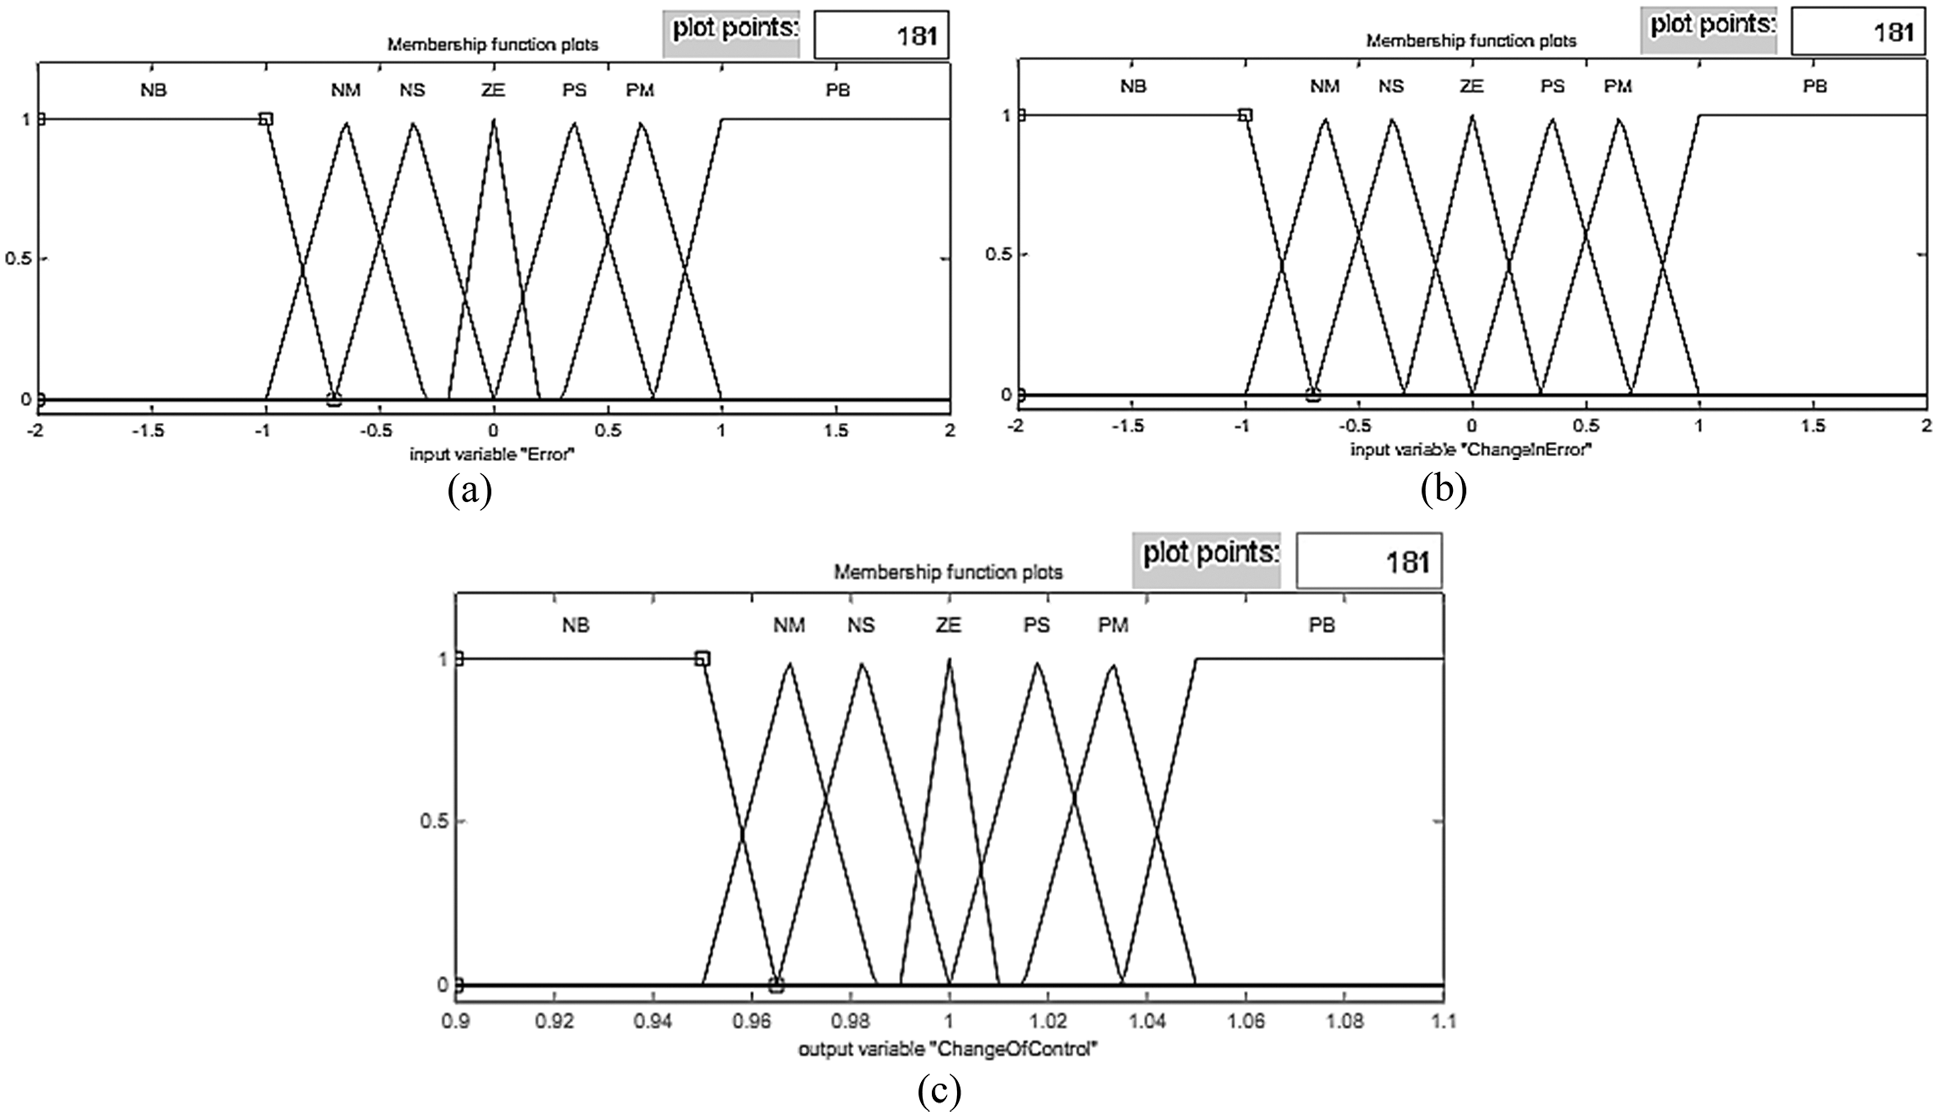
Figure 2: Membership functions of the main fuzzy control inputs and outputs
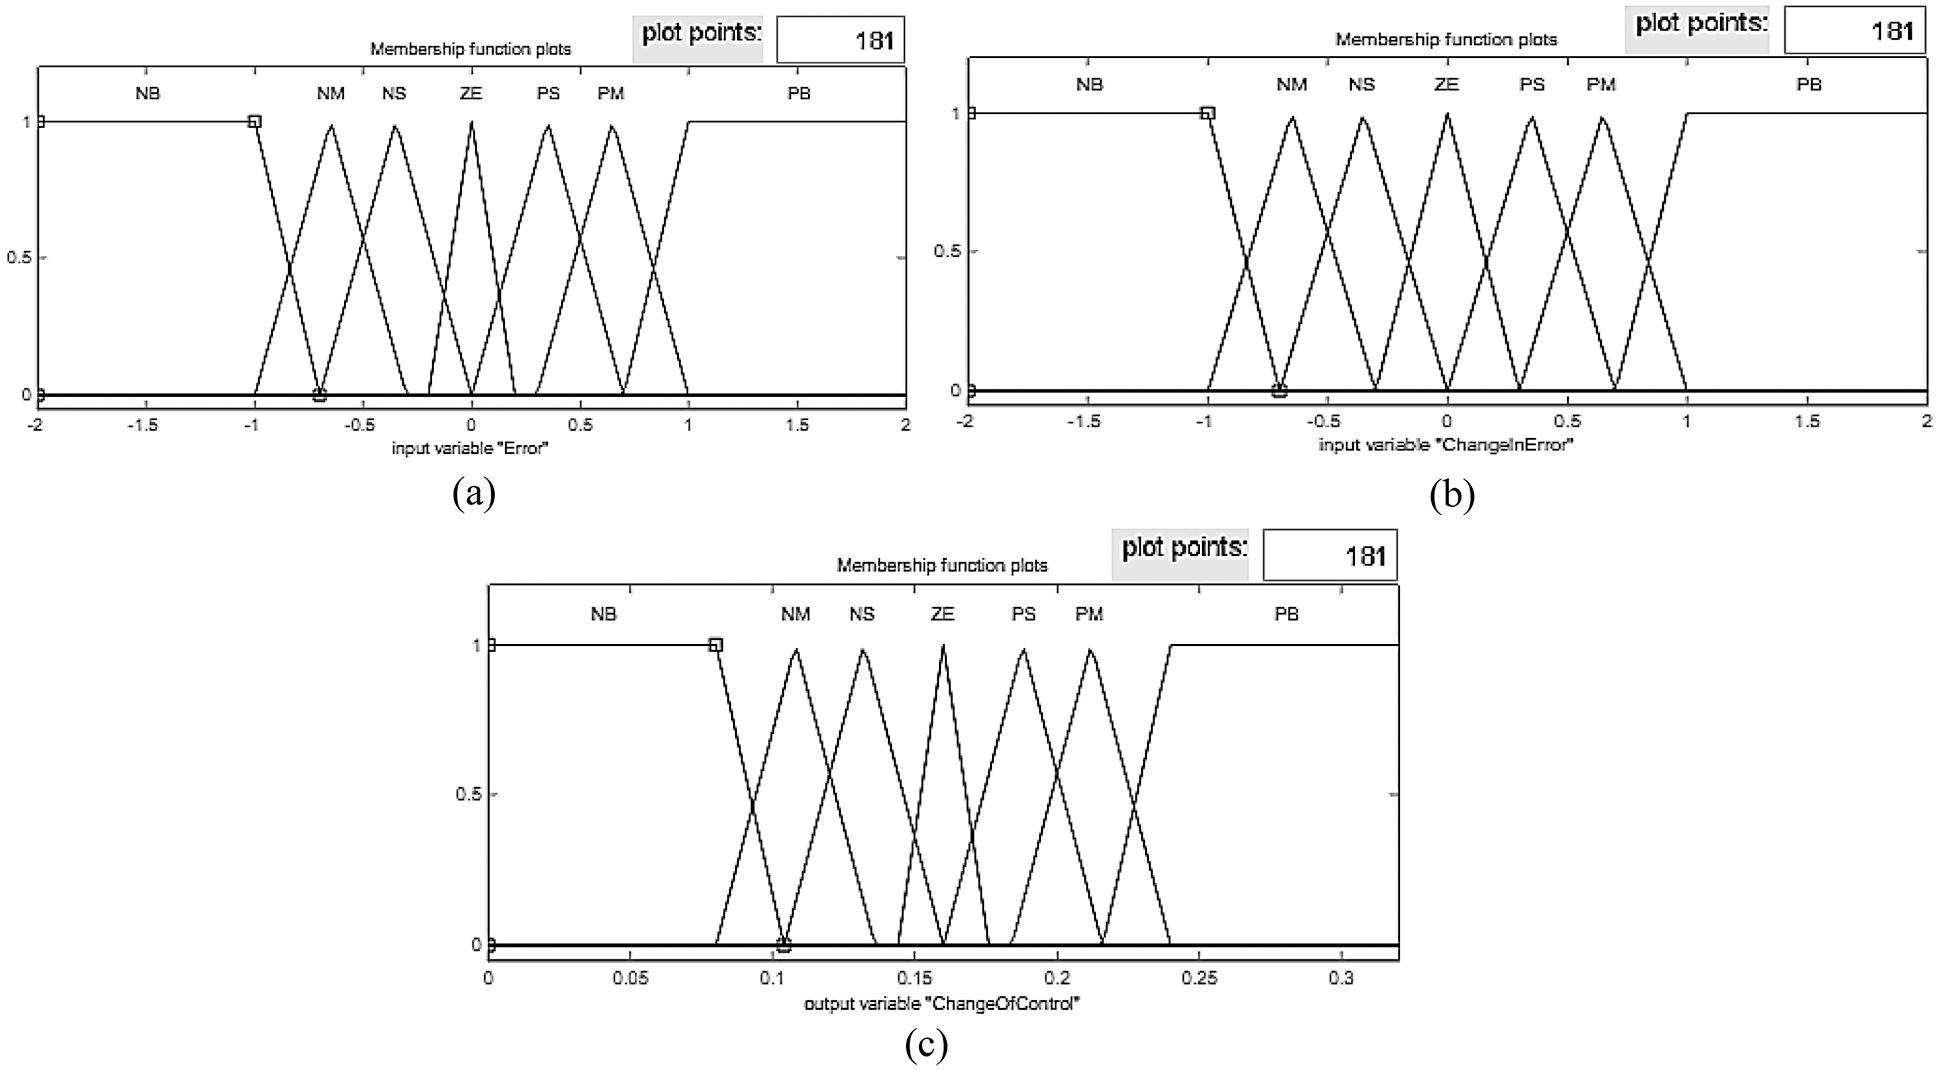
Figure 3: Membership functions of fuzzy control inputs and outputs of the adaptive section
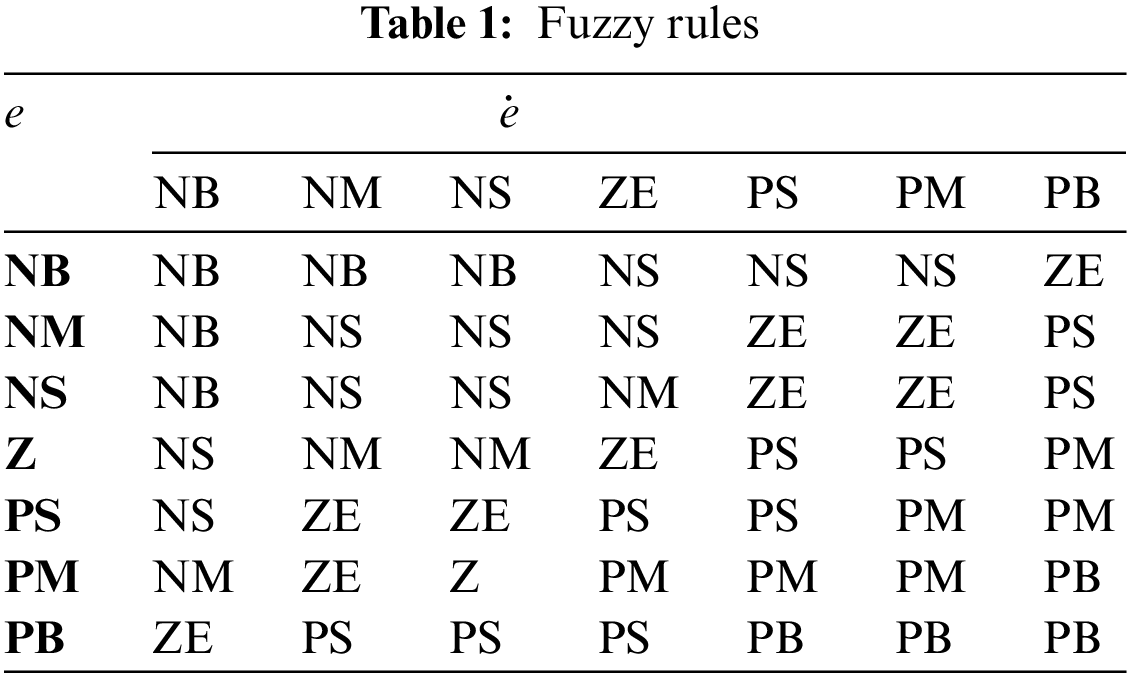
As shown in Figs. 2 and 3, for the control inputs and outputs of the seven triangular-type membership functions with the verbal acronyms NS and PS, respectively, indicate negative changes and Small positive and ZE mean zero changes, two triangular membership functions with the acronyms NM and PM representing negative and moderate positive changes, respectively, and NB and PB representing large negative and positive changes, respectively. The fuzzy rules for the fuzzy controller used in the maximum power detector circuit are shown in Tab. 1. In Tab. 1, the output values of the fuzzy control are specified. For fuzzy control in the proposed tracker circuit, 25 rules are considered.
The performance of fuzzy logic-based controllers is highly dependent on how its membership functions are designed. In this paper, a modified version of the differential evolution algorithm is used for the controller design. Also, the time integral criterion in error size of integral of time-weighted absolute error (ITAE) index has been used as the objective function to determine the optimal parameters by the algorithm. This criterion is in the form of Eq. (1) [20].
In the Eq. (1), tsim is simulation time, Pmax is the maximum power of the solar panel and P is the output power of the solar system and t is a time operator. By selecting this criterion as the objective function, the algorithm always tries to minimize the difference between the output power and the maximum power of the solar system in the fastest time.
4 Whale Optimization Algorithm
Whales can think, learn, judge, communicate, and even become emotionally like humans, but certainly at a much lower level of intelligence. Whales have been observed to be able to develop their own language. Another interesting point is the social behavior of whales. They live alone or in groups. But they are mostly observed in groups. Some species of whales can live in the same family for the rest of their lives. One of the largest bed whales is the humpback whale [21]. Their favorite prey is krill and small fish groups. Fig. 4 shows this mammal.
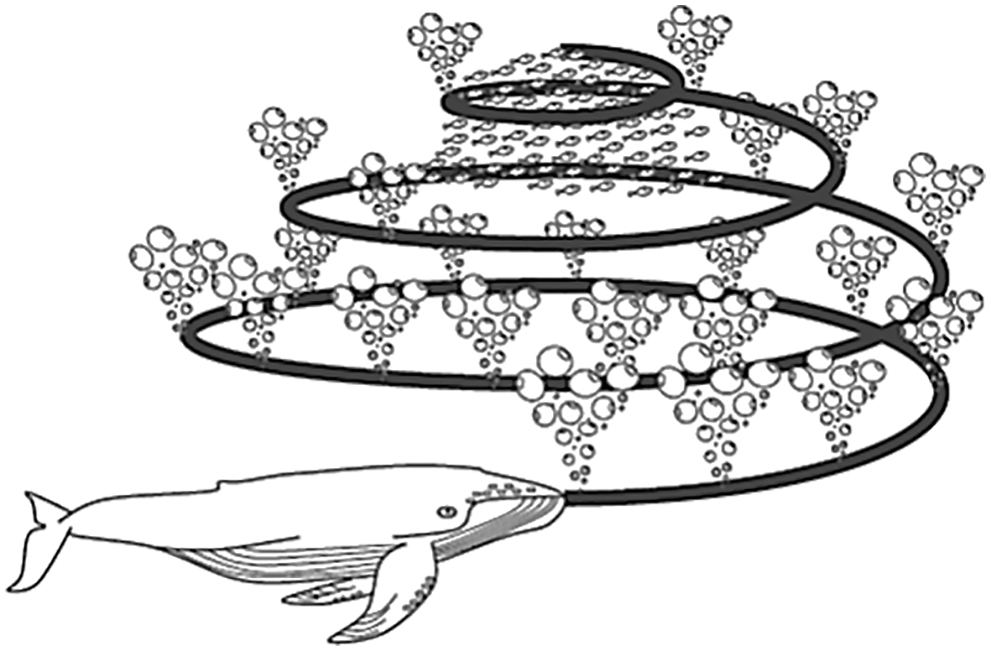
Figure 4: Behavior of whales to find food adapted from [22]
The most interesting thing about humpback whales is their special hunting strategy. This feeding behavior is called bubble feeding. Humpback whales prefer to hunt populations of krill or small fish near the surface of the ocean. It has been observed that this feeding strategy is accomplished by creating distinct bubbles along a circular path shown in Fig. 4. Prior to 2011, this behavior was assessed only on the basis of observations from the ocean surface. But Goldbucken evaluated this behavior using labeled sensors. They obtained 300 feeding events of the bubble trap using labels from nine distinct dorsal whales. They discovered two bubble-related maneuvers, calling them ascending spirals and double loops. In the first maneuver, the humpback whale swims down about 12 meters behind and then begins to create bubbles in a spiral around the bait and swims towards the surface. The next maneuver consists of three different stages: the coral ring, the tapping with the fins, and the capture ring. It should be noted that feeding bubble traps is a unique behavior that is only observed in dorsal hump whales.
In the following, the mathematical model of prey siege, spiral bubble feed maneuver and prey search is presented. Then the whale optimization algorithm (WOA) is presented. The humpback whale can detect the position of prey and surround them. Since the optimal design position in the search space is not initially known, the WOA algorithm assumes that the best solution for the current candidate is the target bait or close to the optimal conditions. Once the best search agent is defined, other search agents try to update their positions relative to the best search agent. This behavior is demonstrated by the following relationships:
where t represents the most recent iteration,
That a decreases linearly from 2 to 0 during the iterations (in both exploration and exploitation stages) and r is a random vector in [0,1]. Fig. 5 shows the logic behind a two-dimensional problem. Position (X, Y) of a search agent can be updated according to the position of the current best record (X*, Y*). Different locations around the best factor can be obtained according to the current position by adjusting the values of vectors A and C. The possible update position of a 3D search agent is also shown in Fig. 5. It should be noted that by defining a random vector (r) it is possible to access any position in the search space between the key points shown in Fig. 6. Thus, Eq. (5) enables each search agent to update its position in the neighborhood of the best current solution and simulate the siege of prey. The same concept can be extended to a n-dimensional search space, and search agents will move around the best solution ever found in the surrounding cube cloud. As mentioned in the previous section, humpback whales attack prey with a bubble trap strategy. For mathematical modeling of the bubble trap behavior of dorsal hump whales, two approaches are designed as follows:
• Mechanism of tightening the siege: This behavior is obtained by reducing the value of
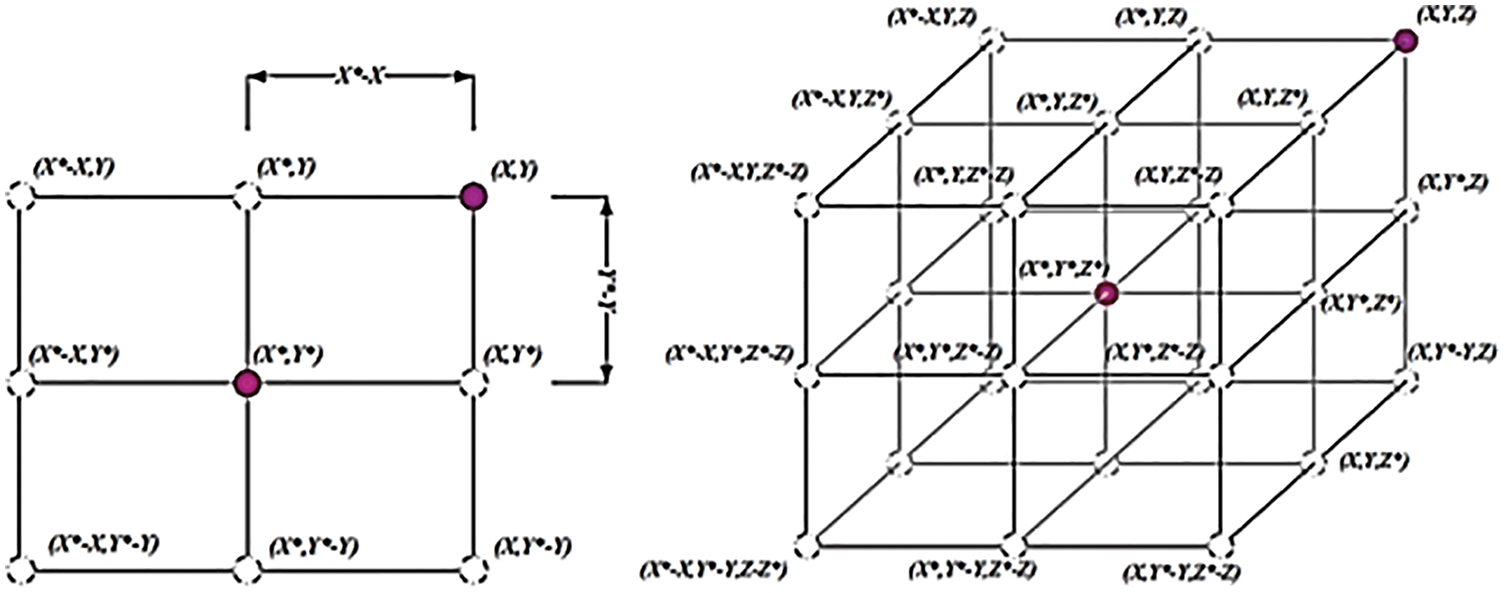
Figure 5: Whale search space for food adapted from [22]
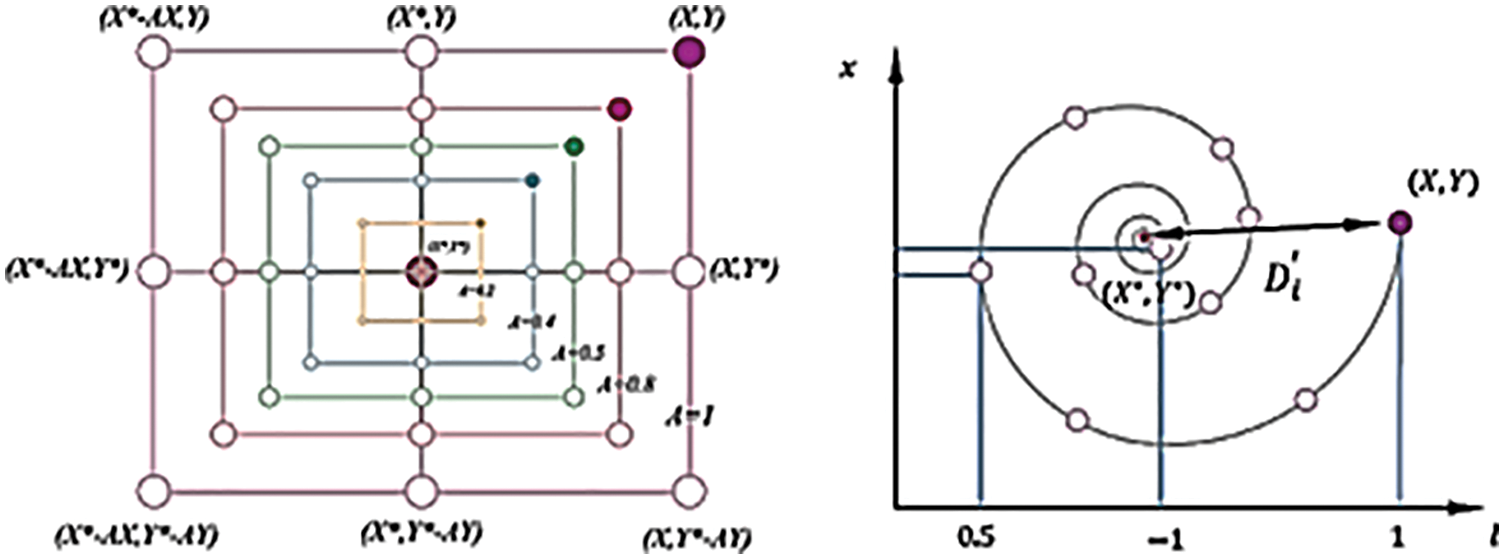
Figure 6: Possible position of the whale to find food adapted from [22]
In other words,
• Position spiral update: As shown in Fig. 6, this solution first calculates the distance between the whale in (X, Y) and the prey in (X*, Y*). Then a spiral relationship is created between the position of the whale and the prey so that the spiral motion of the back hump is as follows:
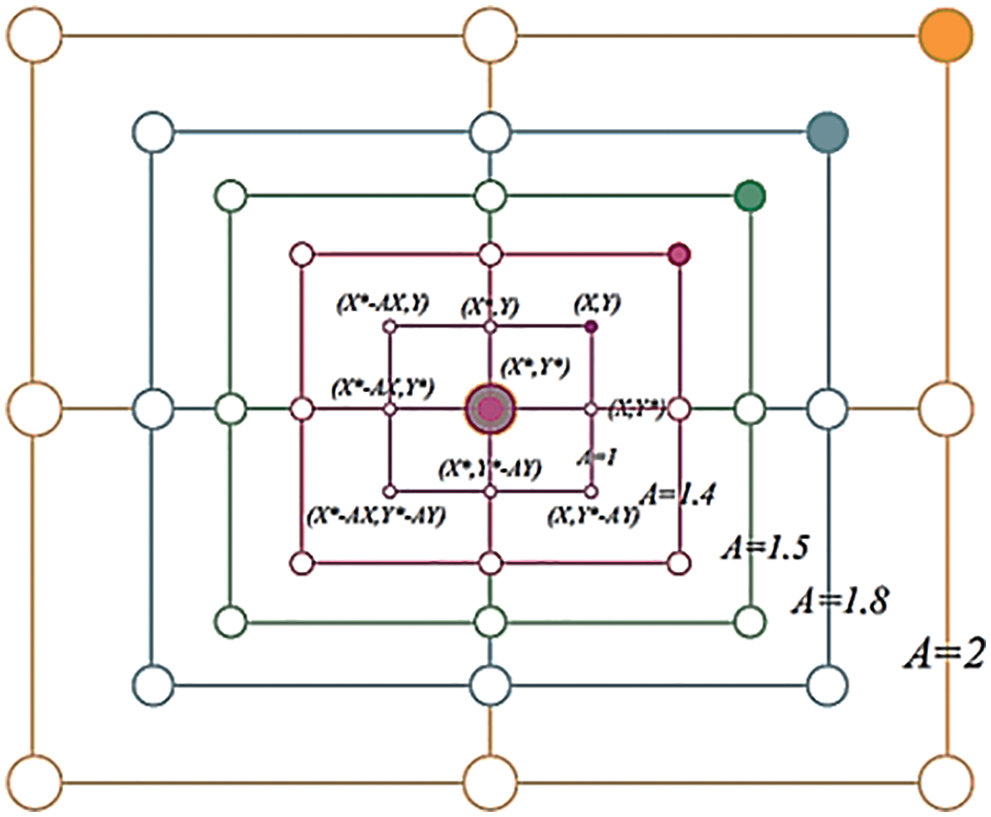
Figure 7: Whale algorithm search mechanism adapted from [22]
Theoretically, WOA can be considered a global optimizer; because it can be explored/exploited. In addition, the proposed cube cloud mechanism defines a neighborhood search space as the best solution and allows other search agents to apply the best current record within that domain. Search vector A variability allows the WOA algorithm to easily switch conditions between exploration and exploitation. As A decreases, some iterations are devoted to exploration (| A | ≥1) and others to exploitation (| A | <1). Interestingly, WOA contains only two main internal parameters that need to be set (A and C). Although mutations and other evolutionary operations may be included in the WOA formula to completely reconstruct the behavior of the dorsal whales, it was decided to minimize the number of initiatives and the number of internal parameters, thus implementing a basic version of the WOA algorithm. Following is the process of designing the maximum power point tracking circuit by the whale algorithm.
Step 1: Simulation of the studied solar system along with the proposed maximum adaptive fuzzy power search circuit in MATLAB Simulink environment
Step 2: Algorithm parameters are entered (number of populations, number of iterations, etc.)
Step 3: Randomly populate the whale population (each whale has information such as parameters and the MPPT circuit form of membership functions)
Step 4: Run Simulink with the values intended for each whale and record changes in the angular velocity of the generators (with the sim command)
Step 5: Calculate the objective function for each factor according to the output power values of the solar system obtained in the previous step.
Step 6: Choose the Best Search Agent (Factor with the Lowest ITAE Value)
Step 7: Update the algorithm parameters.
Step 8: Start the iterations and update the MPPT circuit parameter values
Step 9: If P > 0.5 and also |A| > 1 using the Eqs. (3)–(5), update the position of each factor.
Step 10: If P > 0.5 and also |A| < 1, update the position of each factor using Eqs. (3)–(6).
Step 11: If P < 0.5, update the position of each factor using Eqs. (3)–(8).
Step 12: Put the new values of each factor (updated MPPT circuit parameters) in Simulink and run Simulink again. Solar system output power values are recorded
Step 13: Calculate the objective function for each factor according to the output power values of the solar system obtained in the previous step.
Step 14: Choose the Best Search Agent (Factor with the Lowest ITAE Value)
Step 15: If the number of repetitions is less than the maximum number of repetitions, go to step seven, otherwise the optimization process will end.
5 Simulation and Analysis of Results
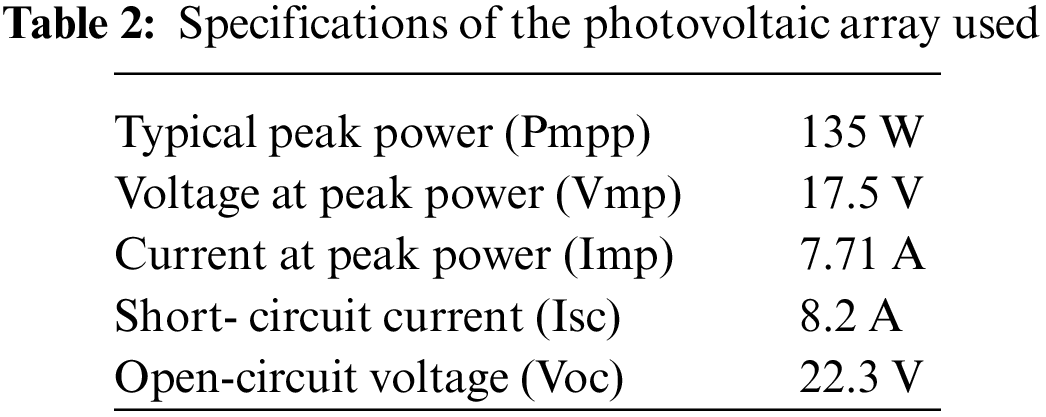
The studied photovoltaic system consists of three main parts: the photovoltaic array, the boost converter, and the maximum power point search circuit, which feeds the local load once. The photovoltaic array used by Sunpower brand has a nominal capacity of 135 W. Tab. 2 shows other specifications of this array [23].
The view of the studied photovoltaic system is shown in Fig. 8.
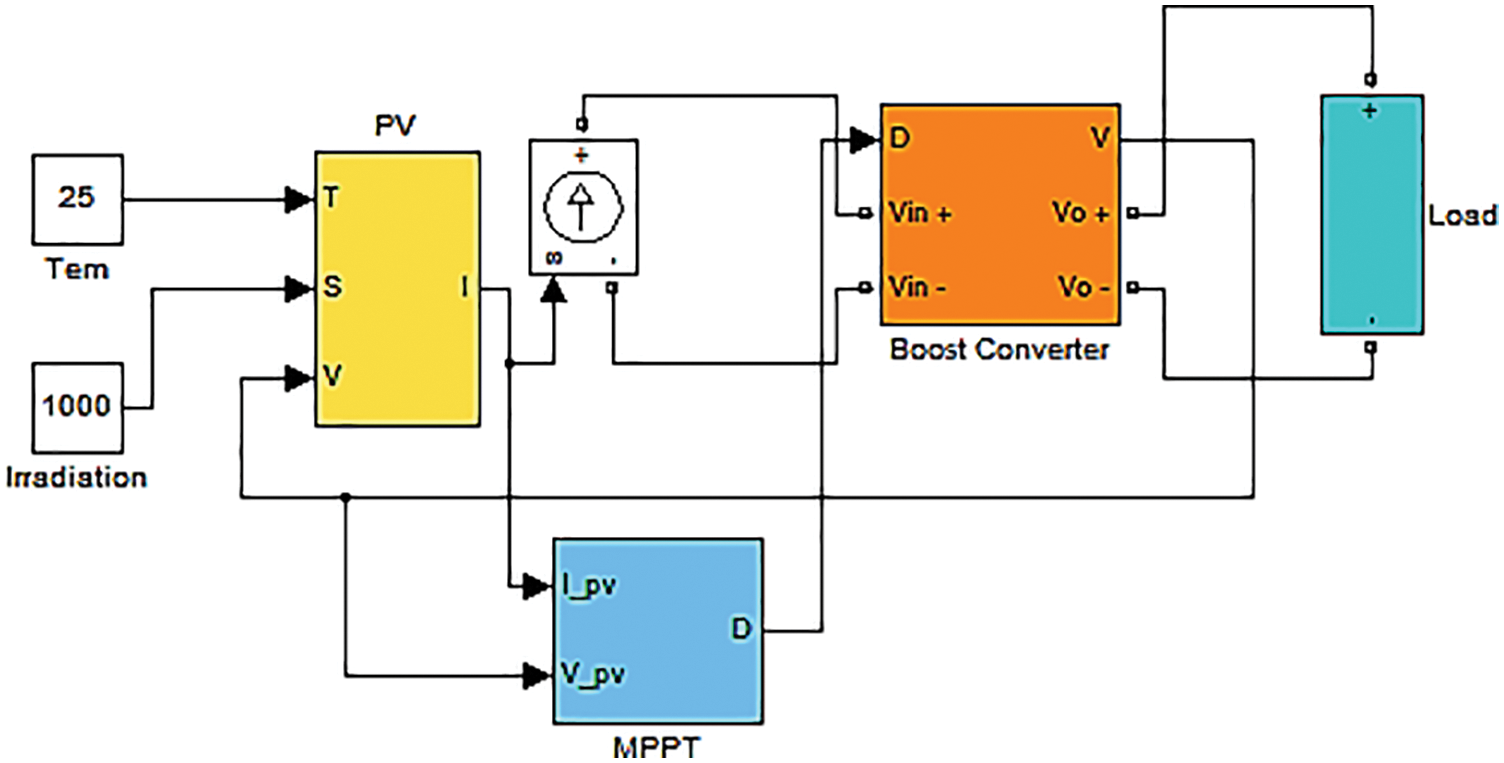
Figure 8: View of the studied photovoltaic system
The voltage and current of the array at the maximum power point are 17.5 volts and 7.71 amps, respectively, and also the short circuit current of the array is 8.2 amps and its open circuit voltage is 22.3 volts. In order to determine the optimal parameters of the proposed controller, the whale algorithm has been used. The particle swarm algorithm was also used to design the maximum power search circuit. The values of the algorithm parameters and the range of changes of the decision variables are given in Tab. 3. After optimization, the convergence process of the algorithm was obtained as shown in Fig. 9.
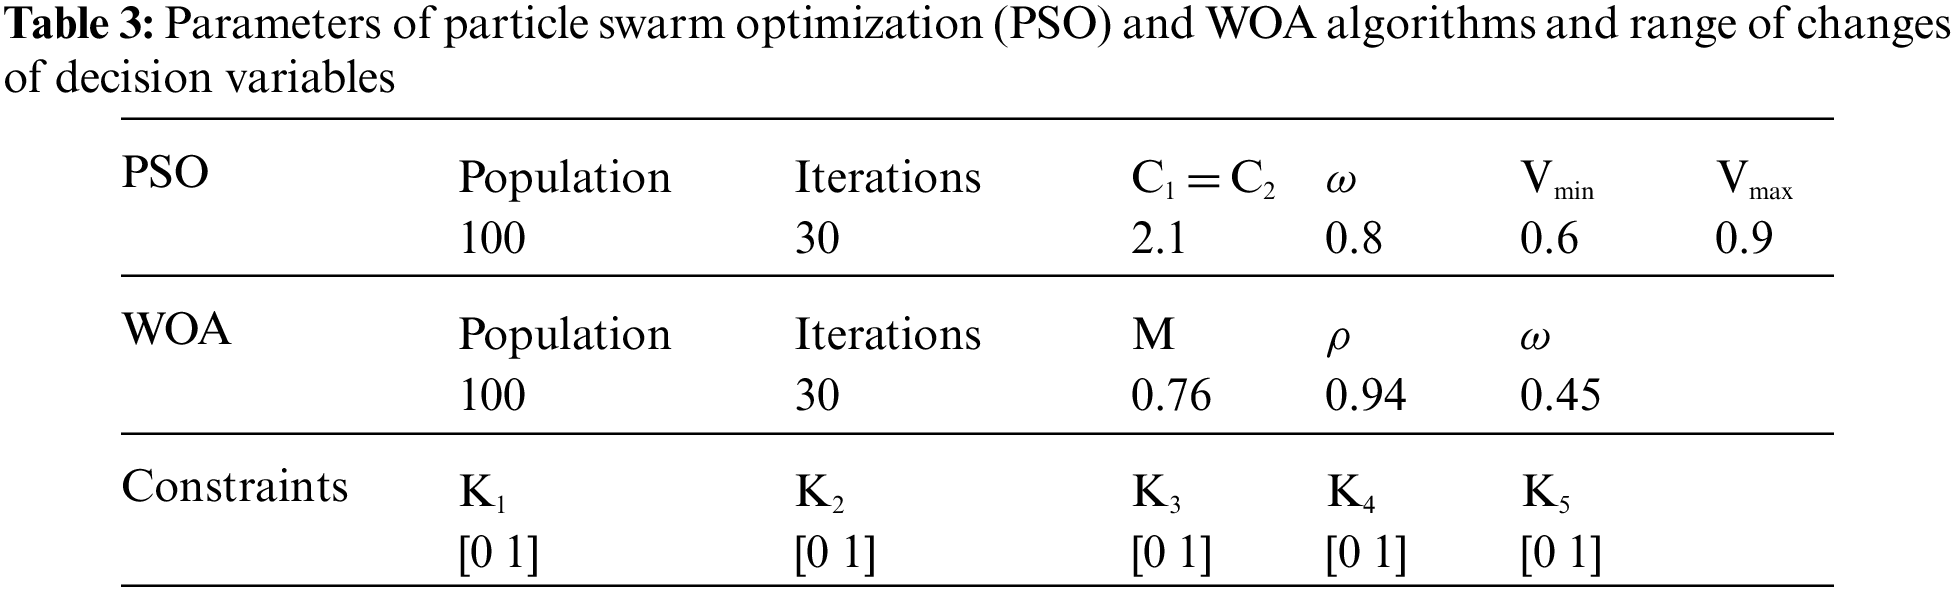
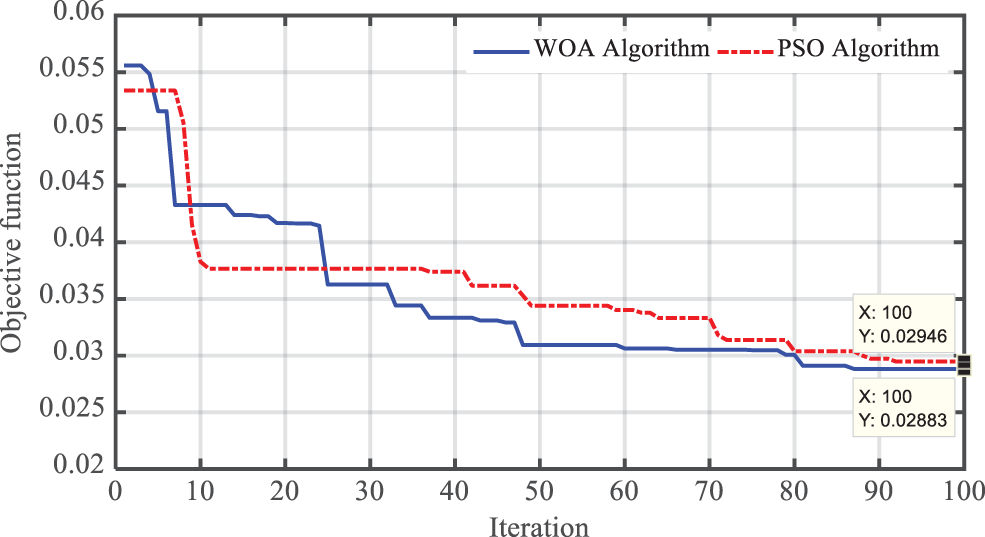
Figure 9: Convergence process of whale optimization and particle swarm optimization algorithms
As shown in the Fig. 9, the final value of the objective function (ITAE criterion) after optimization by PSO algorithm was equal to 0.02946 p.u after 91 iterations, while the final response of the proposed WOA algorithm was equal to 0.02883 p.u. has been achieved. In Figs. 10 and 11, the membership functions optimized by the PSO and WOA algorithms, respectively, are shown.
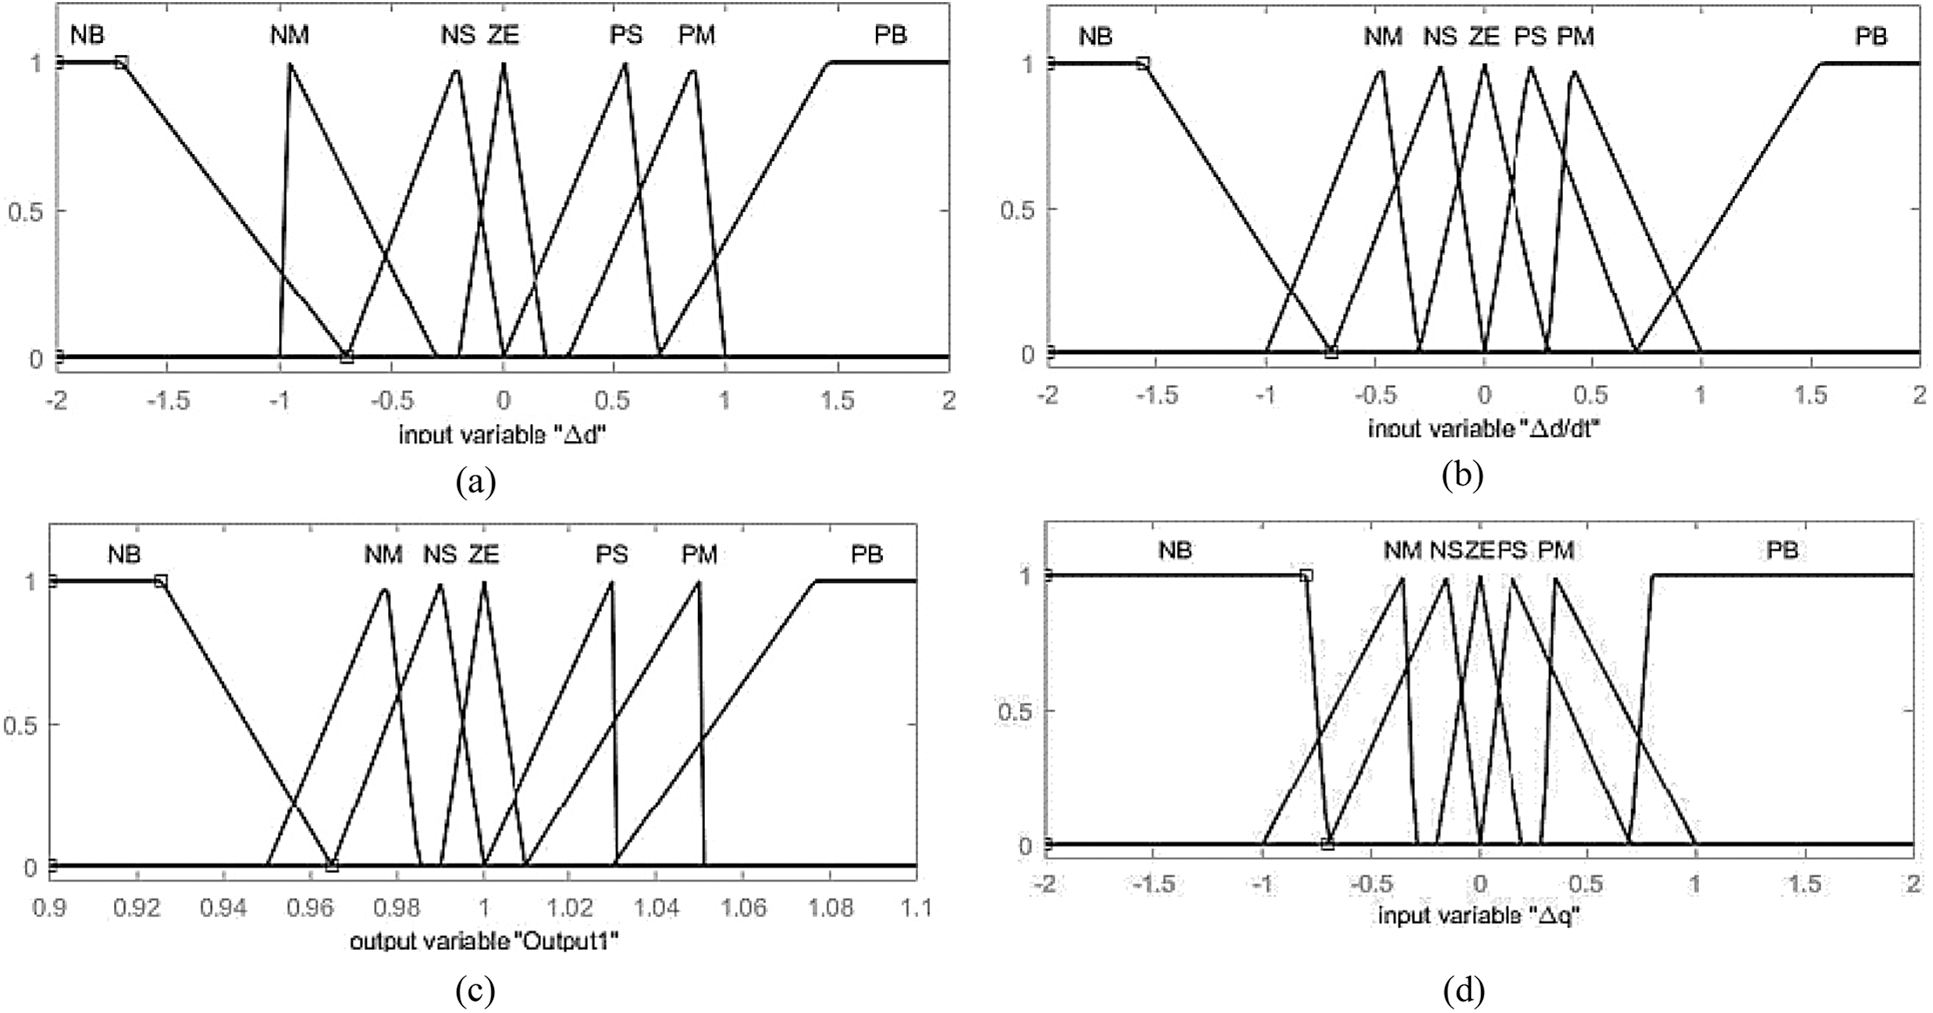
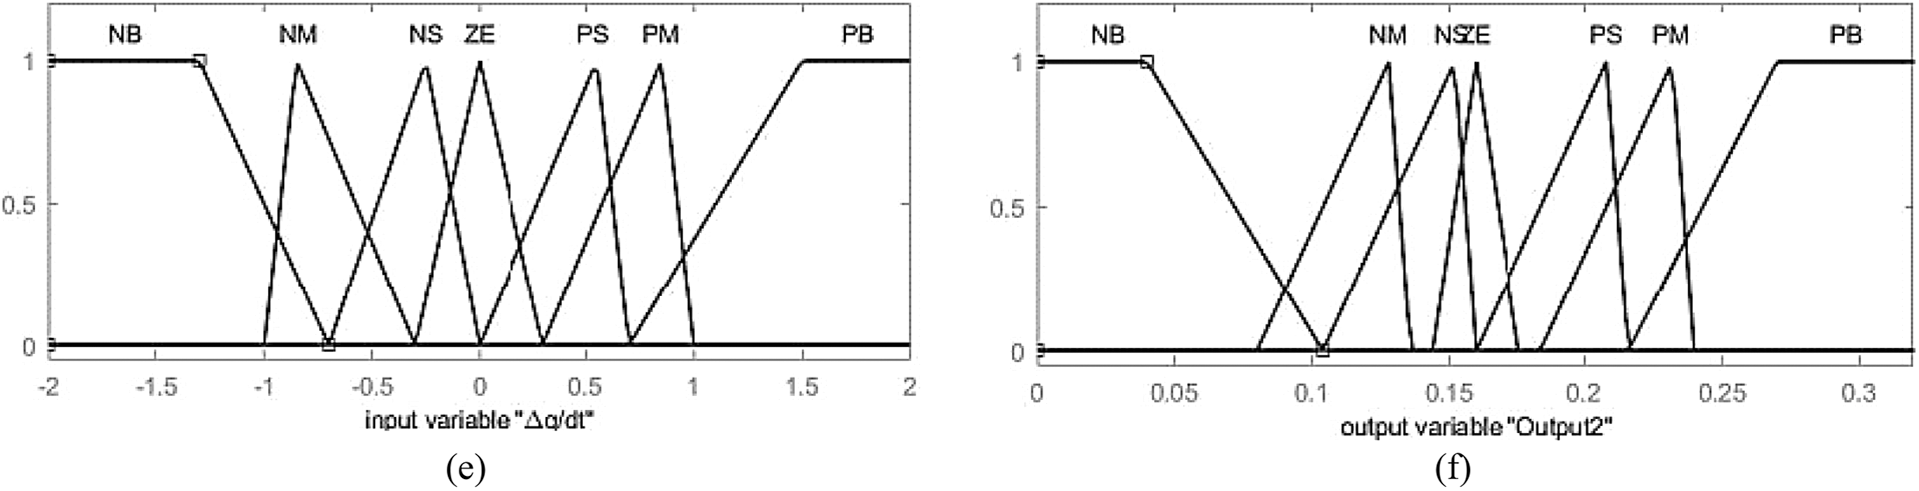
Figure 10: Membership functions optimized by the particle swarm algorithm ((a). Error input in Vd (b). Error derivative input in Vd (c). Main fuzzy control part output (d). Error derivative input in Vq (e). Error derivative input Vq (f). Adaptive part output)
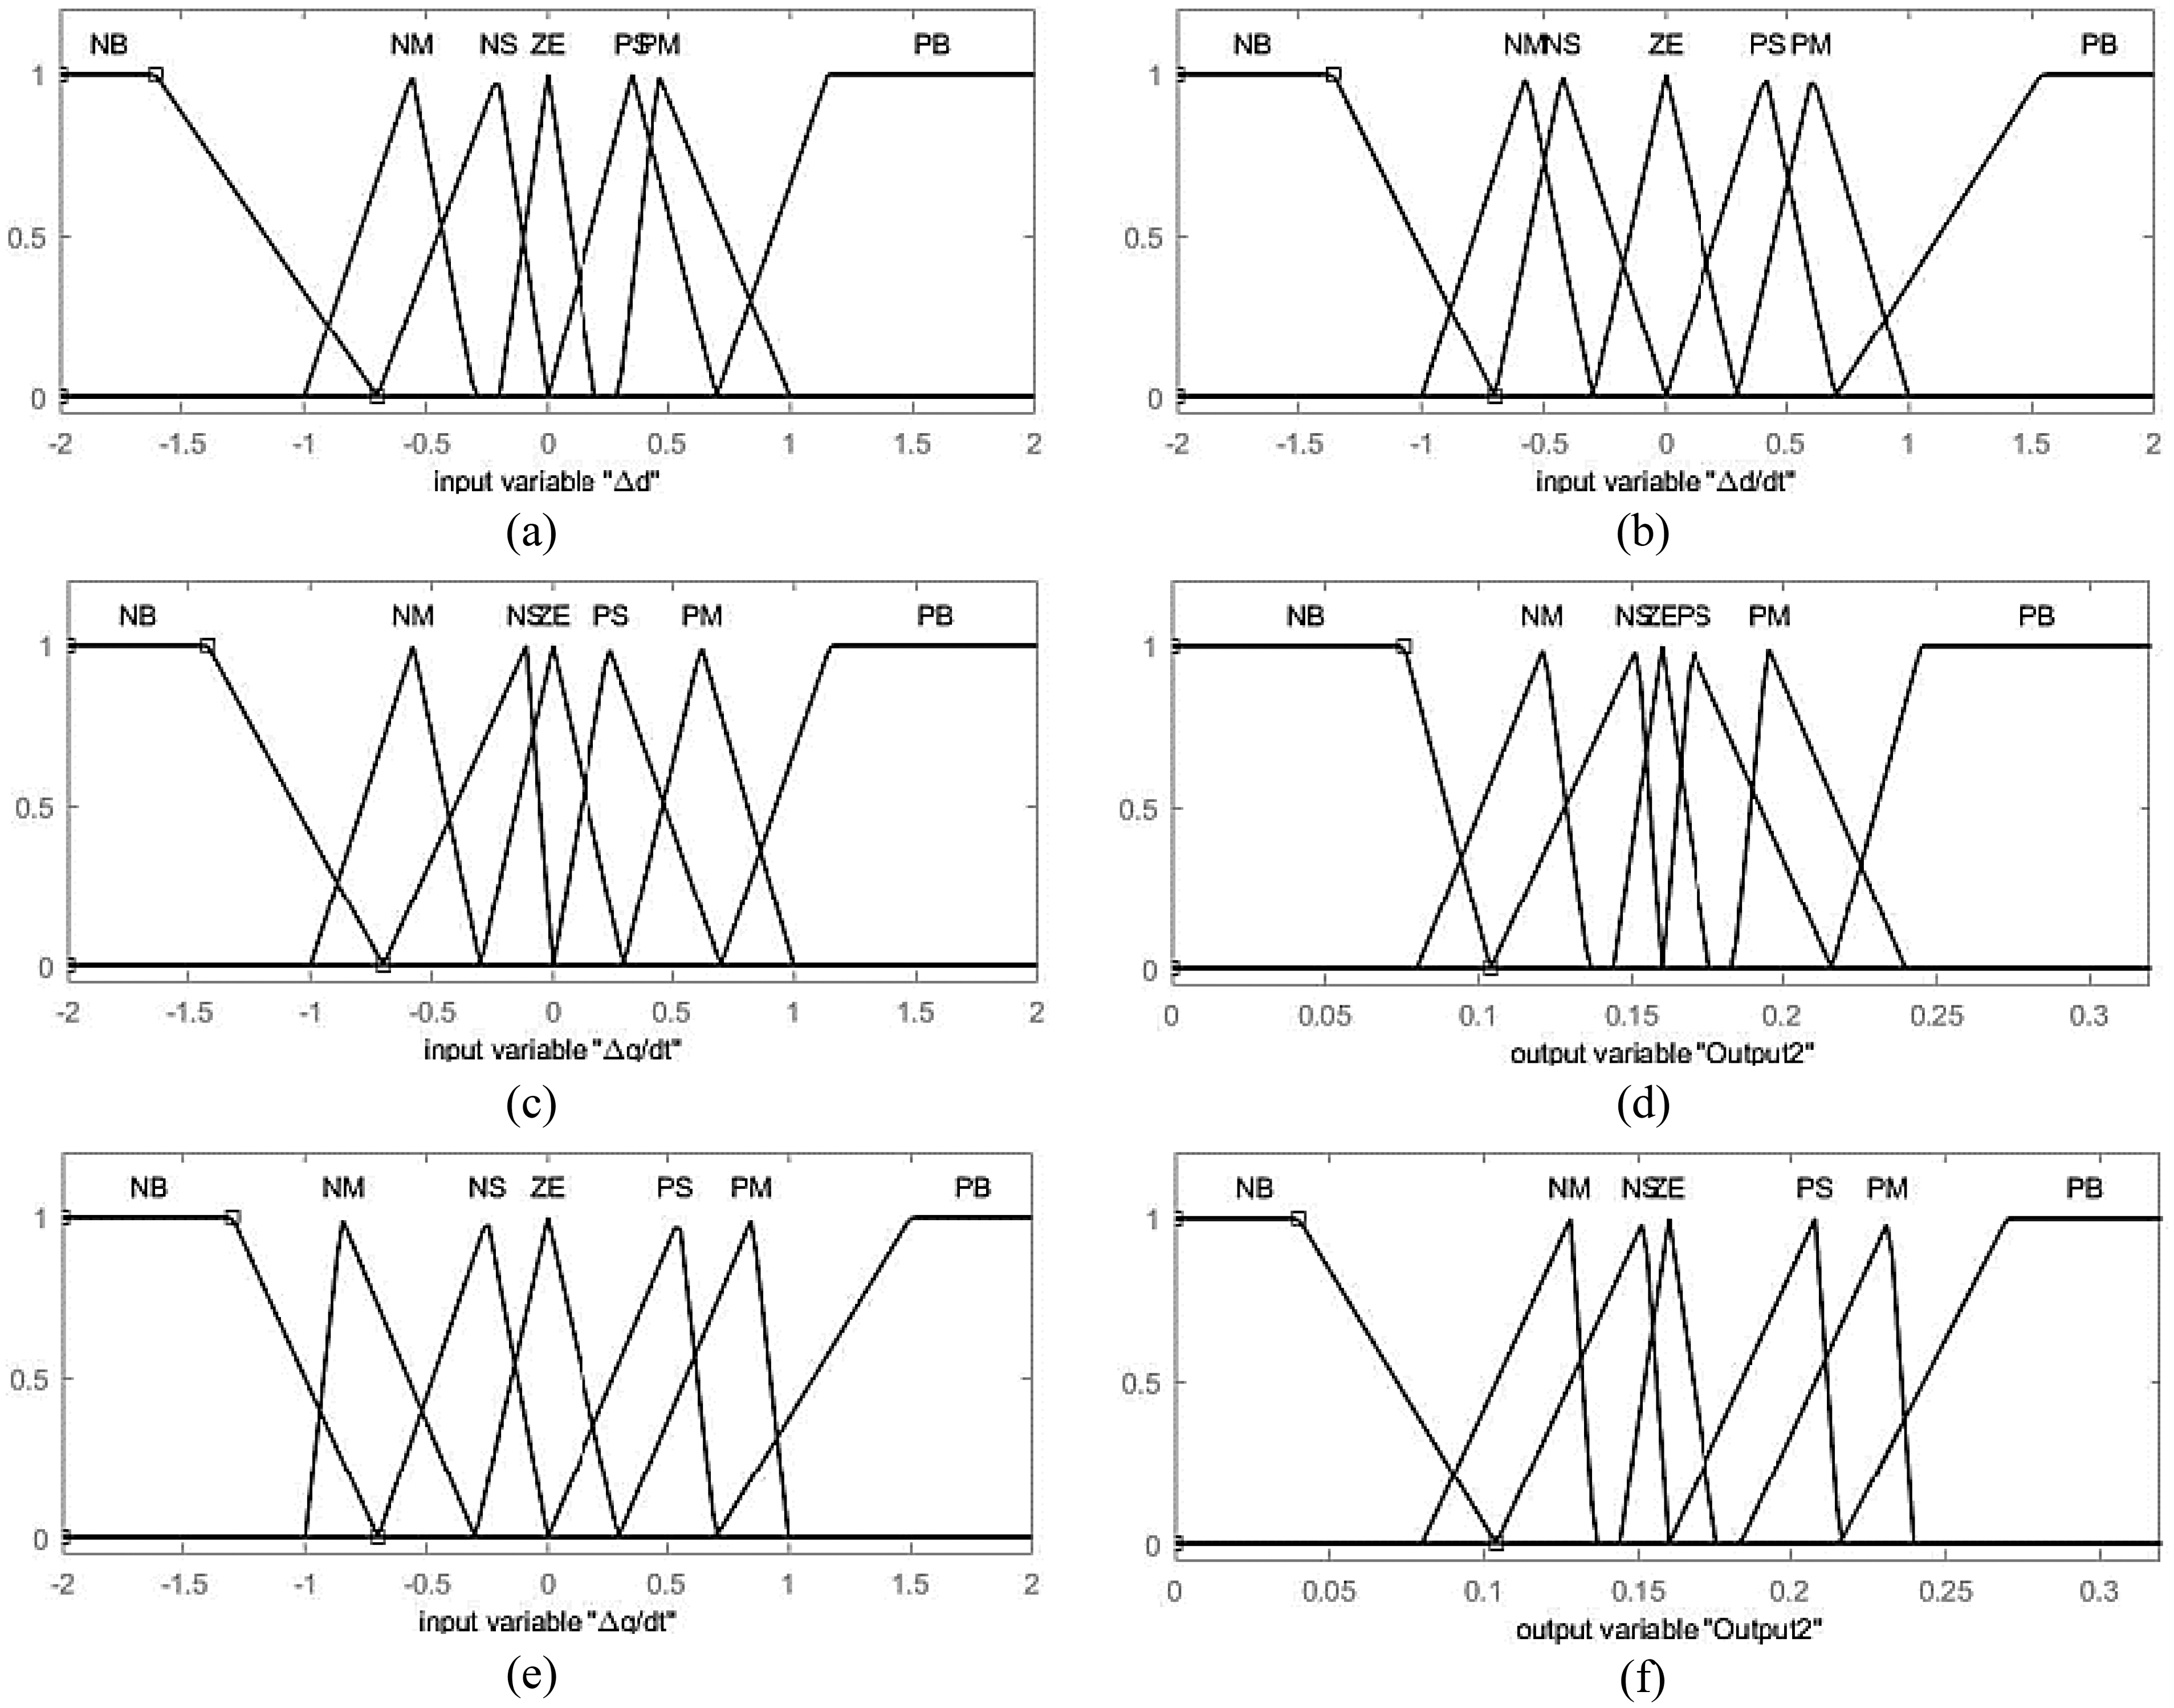
Figure 11: Membership functions optimized by the WOA ((a). Error input in Vd (b). Error derivative input in Vd (c). Main fuzzy control part output (d). Error derivative input in Vq (e). Error derivative input Vq (f). Adaptive part output)
After optimization by particle swarm algorithm, the value of parameter K1 is equal to 0.84, parameter K2 is equal to 0.65, parameter K3 is equal to 0.92, parameter K4 is equal to 0.87, parameter K5 is equal to 0.69 has been obtained.
Also, the value of parameter K1 is equal to 0.87, parameter K2 is equal to 0.63, parameter K3 is equal to 0.92, parameter K4 is equal to 0.85, and parameter K5 is equal to 0.74. In the following, the results of the simulations have been analyzed and analyzed.
In this section, simulations were performed to evaluate the performance of the fuzzy adaptive WOA-based MPPT (WOA-AF-MPPT) and the results were similar to the results of a photovoltaic system but with a fuzzy maximum tracker circuit. The optimized adaptation is compared by the fuzzy adaptive PSO-based MPPT (PSO-AF-MPPT) as well as the maximum power search circuit based on the perturbation and observation method (P&O) [24–55]. The simulations are repeated in the form of two scenarios of changes in the intensity of radiation emitted to the array surface and changes in ambient temperature. In the first part of the simulations, assuming the temperature remained constant at the standard value of 2°C, the radiation intensity to the array changed. However, in the second part of the simulations, under different conditions, assuming the radiation intensity remained constant at the standard value of 1000 watts per square meter, with wide temperature changes, the performance of the maximum power search circuits was investigated. The MPPT circuit has a better performance that can search for the maximum power point in the fastest time and with the minimum amplitude of fluctuations by changing the radiation intensity or temperature of the array.
5.1 Evaluation of the Results of the First Scenario (Effects of Changing the Intensity of Radiation)
In the first part of the simulations, the function of the maximum power search circuits is tested, assuming that the temperature remains constant at the standard value (25 Co) and by changing the intensity of the radiation to the solar array. The pattern of solar radiation intensity is assumed according to Fig. 12. The initial radiation intensity of the array was equal to 600 w/m2, which will reach 800 w/m2 with immediate changes of 200 w/m2 in the third second of the simulation. The intensity of the sun’s rays remained constant until the fifth second of the simulation. Then in the fifth second with increasing intensity of radiation, its value will reach 1000 w/m2. Finally, in the eighth second of the simulation, with a sudden decrease in the intensity of the radiation, its value will reach 400 w/m2. From the ninth second to the end of the sharp simulation time, the trend of changes in solar radiation was considered slow. Radiation intensity changes are designed to be instantaneous and slow to evaluate the performance of the maximum power detector circuits designed in difficult conditions where it is possible to be trapped at local maximum power points.
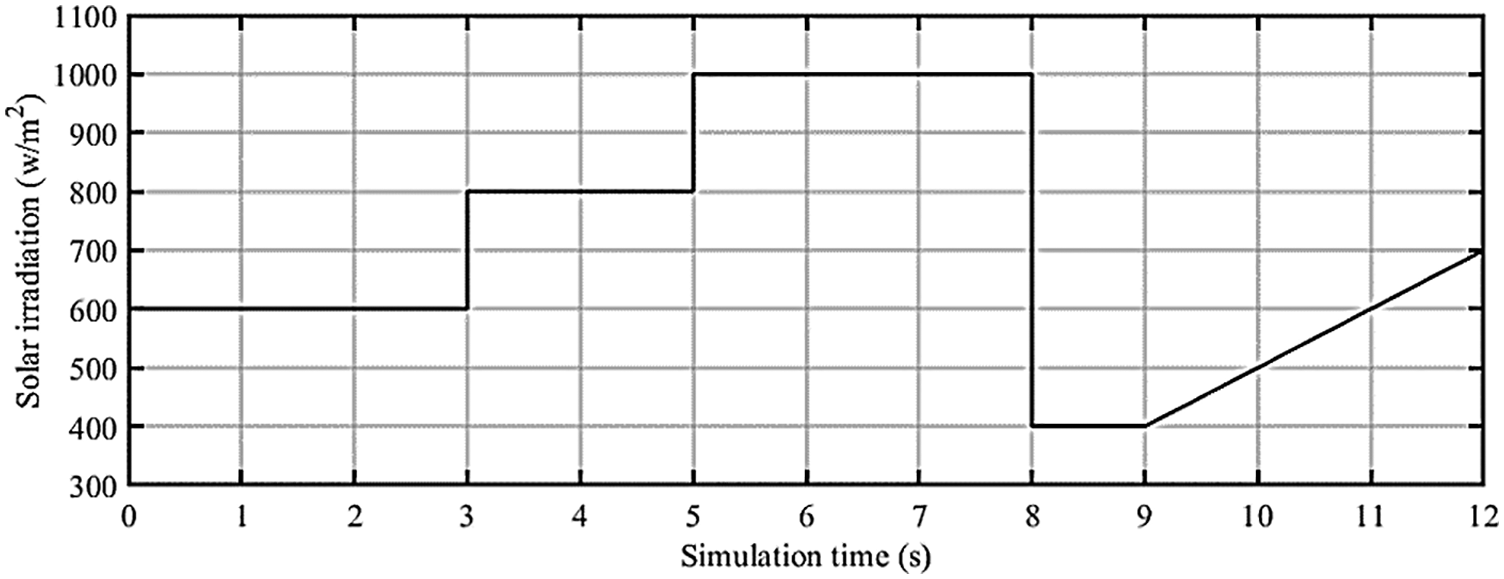
Figure 12: The trend of changes in radiation intensity to the solar array
In the conditions of changes in the intensity of radiation radiated to the surface of the array according to Fig. 12, the maximum power that can be extracted from the solar array under study is obtained as Fig. 13.
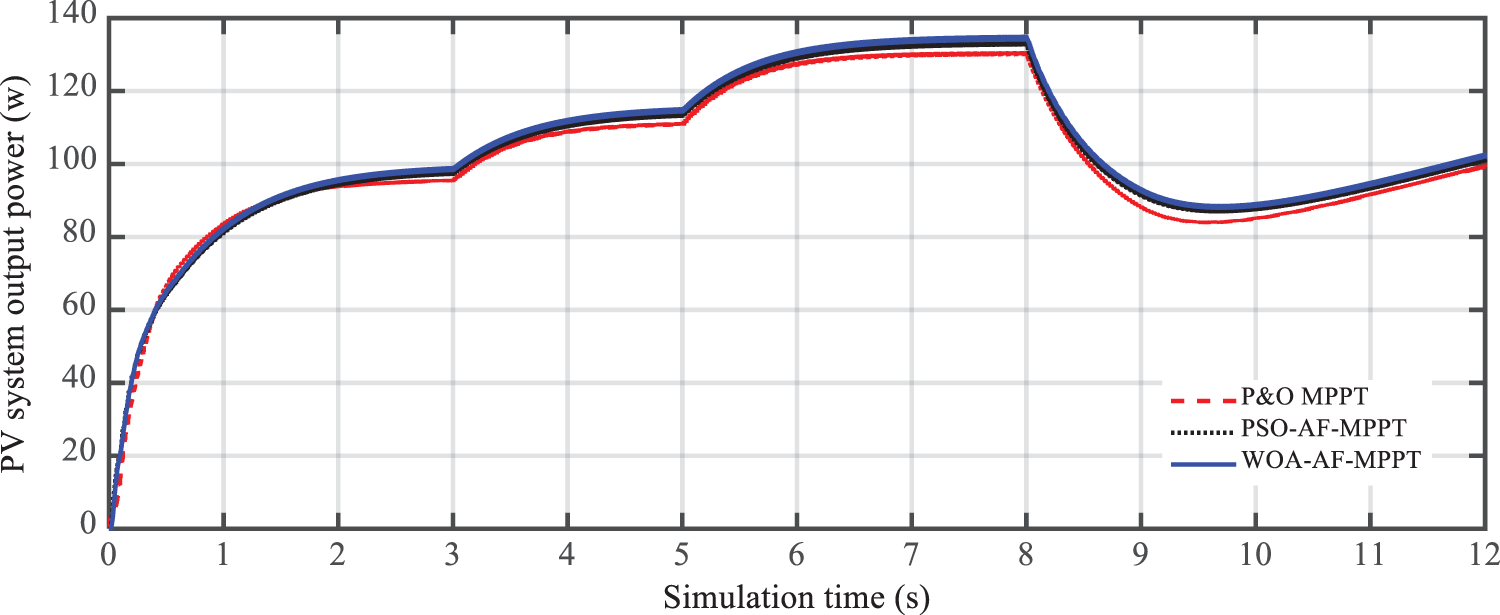
Figure 13: Maximum extraction power of the solar array under conditions of radiation changes
According to the results, the maximum power obtained from the solar system in the conditions of using the tracer circuit of the adaptive maximum fuzzy power optimized by PSO and WOA algorithms at 600 watts per square meter is equal to 97.61 W and 99.23 W, respectively. On the other hand, if a perturbation and observation (P&O) circuit is used, the maximum power received from the array at 600 watts per square meter will be about 94.21 W. As the intensity of solar radiation increases, the output power of the system has increased. So that in the standard radiation intensity of 1000 watts per square meter, the amount of power produced by the photovoltaic system in the conditions of using the proposed control circuit was about 134.8 watts and if using a controller optimized by the PSO algorithm was equal to 134.6 watts. If using the P&O maximum power search circuit, the maximum power output is estimated to be approximately 131.2 W. At this radiation intensity, approximately 3.6 watts, the power output of the solar system if using WOA-AF-MPPT is higher than P&O algorithm based MPPT (P&O-MPPT). Although this power difference is small, in the long run, the difference in electrical energy generated by the solar system will be significant. By reducing the radiation intensity to 400 watts per square meter, the power received from the solar system will be reduced. The amount of torque produced for the two WOA-AF-MPPT and PSO-AF-MPPT maximum power search circuits is 88.89 and 87.23 watts, respectively. While in this radiation intensity, if P&O-MPPT is used, the power received from the solar system is set at 84.62 watts. According to the results, with increasing the intensity of solar radiation, the production capacity of the solar system increases and vice versa, with decreasing the intensity of solar radiation, the amount of power output is reduced. The speed of operation of all three search circuits of maximum power used is approximately equal.
Then, in Fig. 14, the maximum power values of the photovoltaic system at the intensity of 400, 600, 800 and 100 watts per square meter are shown in the form of bar graphs for the two search methods used.
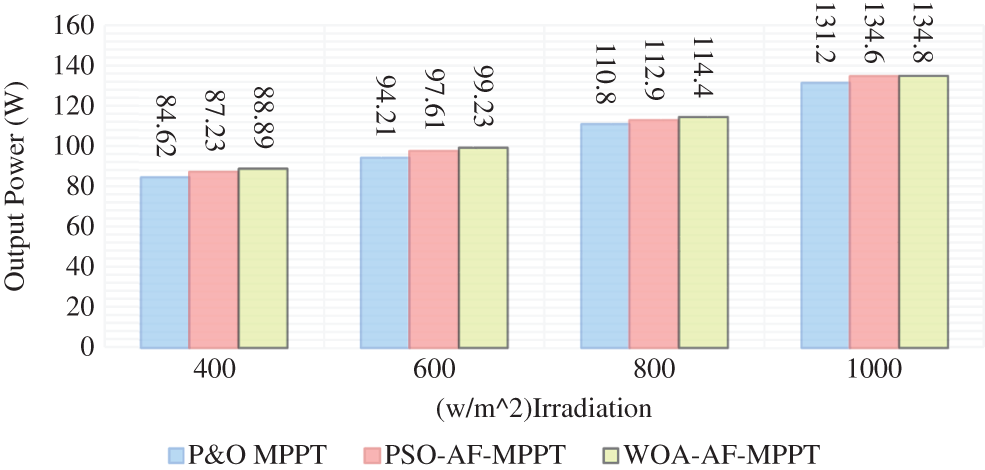
Figure 14: Maximum power values of the photovoltaic system in different radiations
According to the results obtained from the simulations performed in the first part, it can be said that the method of searching for the maximum proposed fuzzy adaptive power optimized by the whale algorithm at all levels of solar radiation has a higher electrical output power than the two methods. Tracking is another. In order to determine the amount of output power perturbation at the output of the solar system, the magnified image from 6.96 to 7.06 s is shown in Fig. 15. By evaluating the results, the performance of the designed maximum power tracking circuits in reducing the output power distortion level can be analyzed.
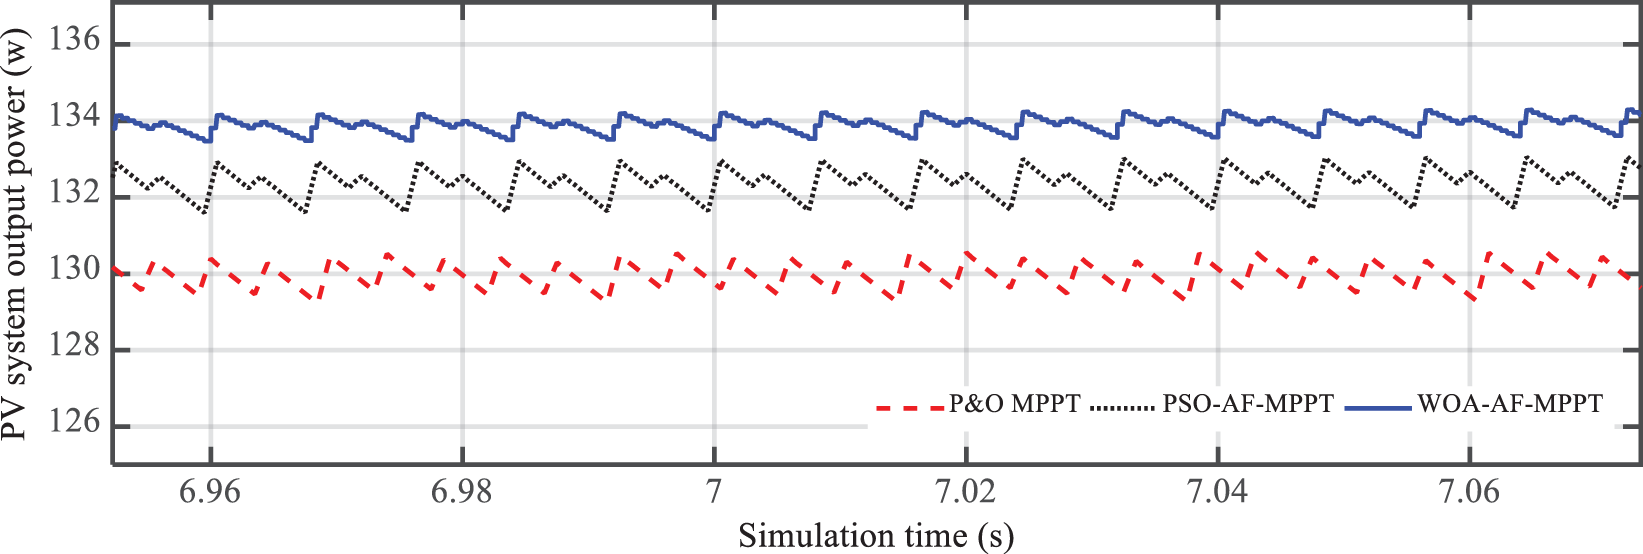
Figure 15: Distortion of the output power of the photovoltaic system in the conditions of radiation changes
According to the results of Fig. 15, the maximum power tracking circuit of the proposed WOA-AF-MPPT solar array has less output power distortion than the other two tracking methods. The percentage of output power distortion in the photovoltaic system with WOA-AF-MPPT, PSO-AF-MPPT and P&O-MPPT maximum power search circuit is set at 2.3%, 3.1% and 5.7%, respectively. The lower power distortion at the output of the photovoltaic system is one of the positive features of the adaptive fuzzy tracking method compared to the perturbation and observation method.
5.2 Examining the Results of the Second Scenario (Effects of Temperature Change)
In the second part of the simulations, unlike the first part, it is assumed that the radiation intensity to the photovoltaic array is constant and equal to 1000 w/m2, and by applying changes in the temperature of the photovoltaic array, the efficiency of the maximum power search circuit based on logic the second type of fuzzy has been evaluated. The temperature changes considered in this scenario are in the form of Fig. 16.
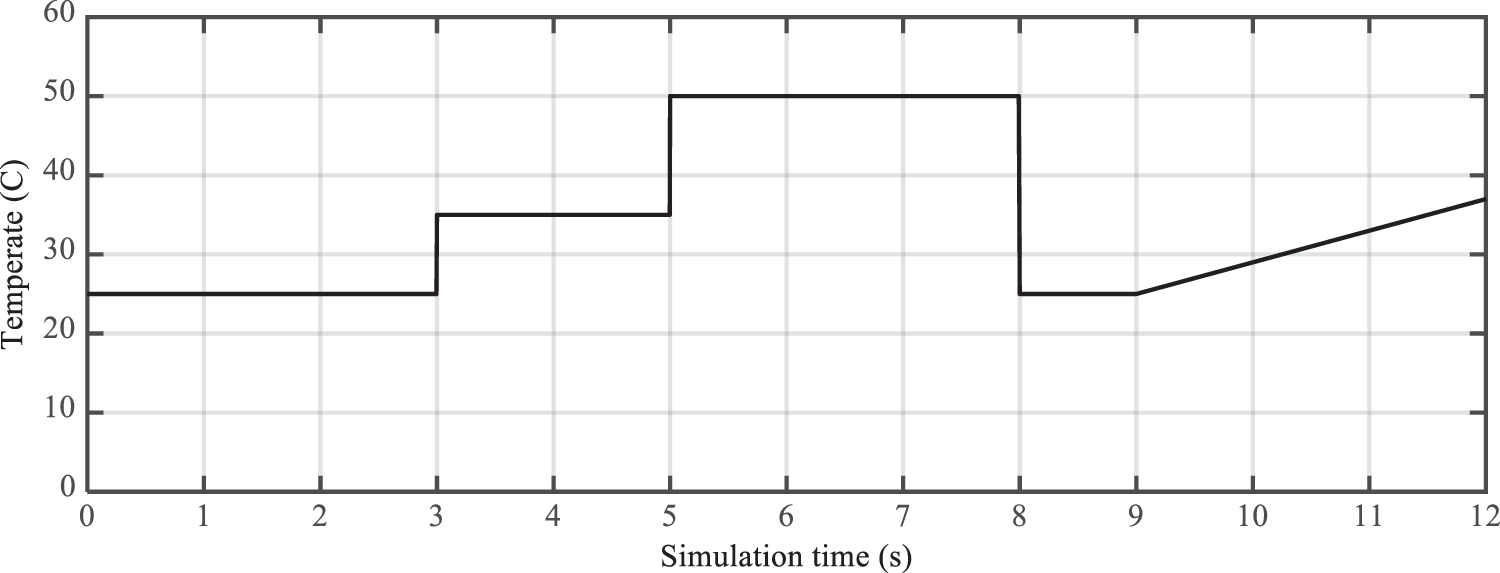
Figure 16: Changes in the surface temperature of the solar array
Accordingly, the initial temperature of the array is set at 25°C, which has reached a temperature of 35°C with an instantaneous increase of 10°C in the third second. In the fifth second, the temperature increased and the maximum value, i.e. the temperature reached 50°C. Finally, as the temperature decreased in the eighth second, the temperature of the photovoltaic array returned to its original value of 25°C. From the ninth to the twelfth second, the temperature changes had a gradual increasing trend. After performing the simulations, the output power of the photovoltaic system in case of array temperature changes with the pattern defined in the figure above, is determined as Fig. 17.
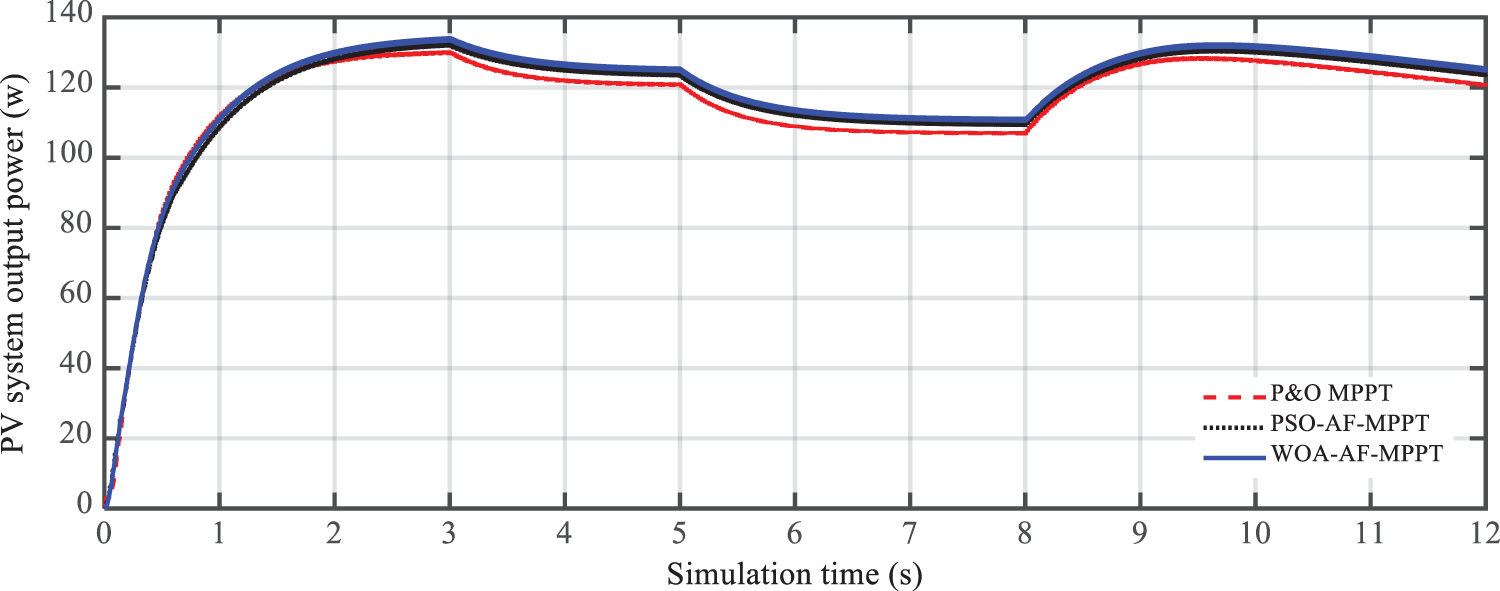
Figure 17: Maximum power output from the solar array under temperature change conditions
According to Fig. 17, with increasing ambient temperature and the level of photovoltaic presentation, the output power of the system has decreased slightly. The maximum power of the photovoltaic array at 25°C, if using the maximum power search circuits based on adaptive fuzzy logic optimized by particle swarm algorithms, is calculated to be 134.6 and 134.8 watts, respectively. The maximum amount of power that can be received under the same conditions and when using P&O-MPPT is calculated to be approximately 131.2 watts. By doubling the temperature of the solar array to 50°C, the output power of the solar system decreases by 17% for the two search circuits with a maximum power of PSO-AF-MPPT and WOA-AF-MPPT, respectively 110.7 watts and 111.9 W is set. The maximum power in these conditions if P&O-MPPT is used is equal to 106.7 watts. The operating speed of each track circuit is approximately the same in the event of temperature changes. In Fig. 18, the seconds are shown as magnified from 6.96 to 07.04.
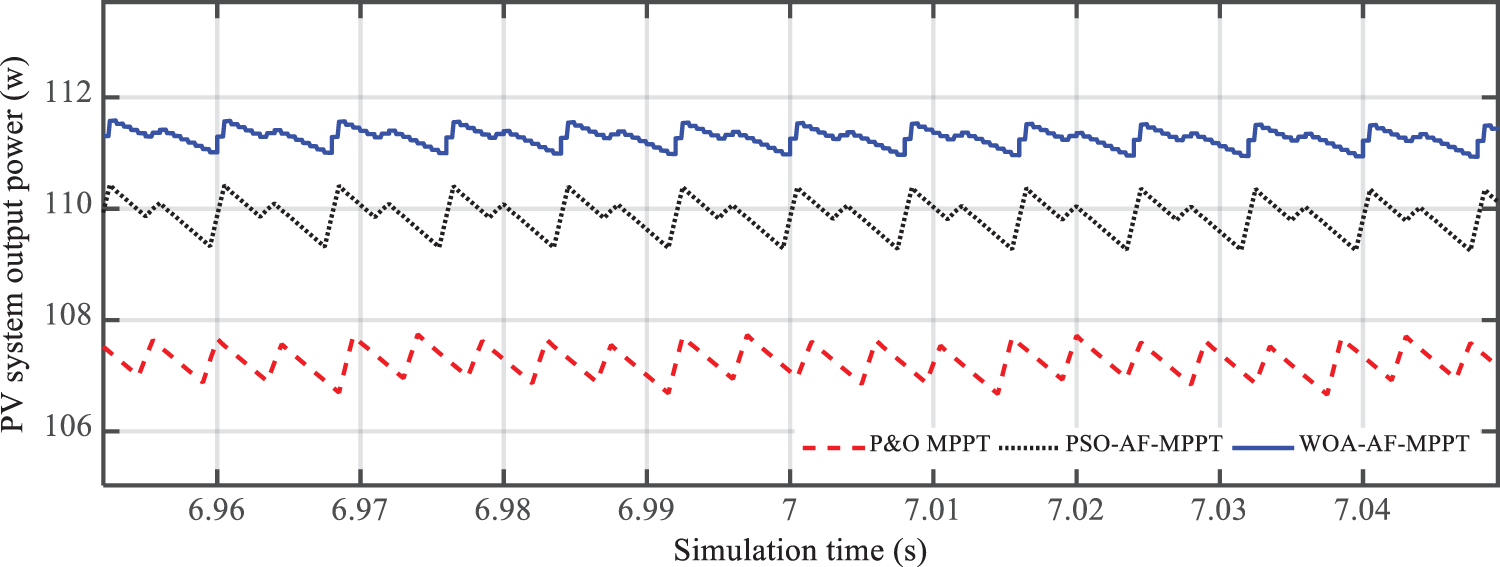
Figure 18: Distortion of the output power of the photovoltaic system in the second scenario
In Fig. 19, the maximum power output of the photovoltaic array at temperatures of 25, 35 and 50°C is shown.
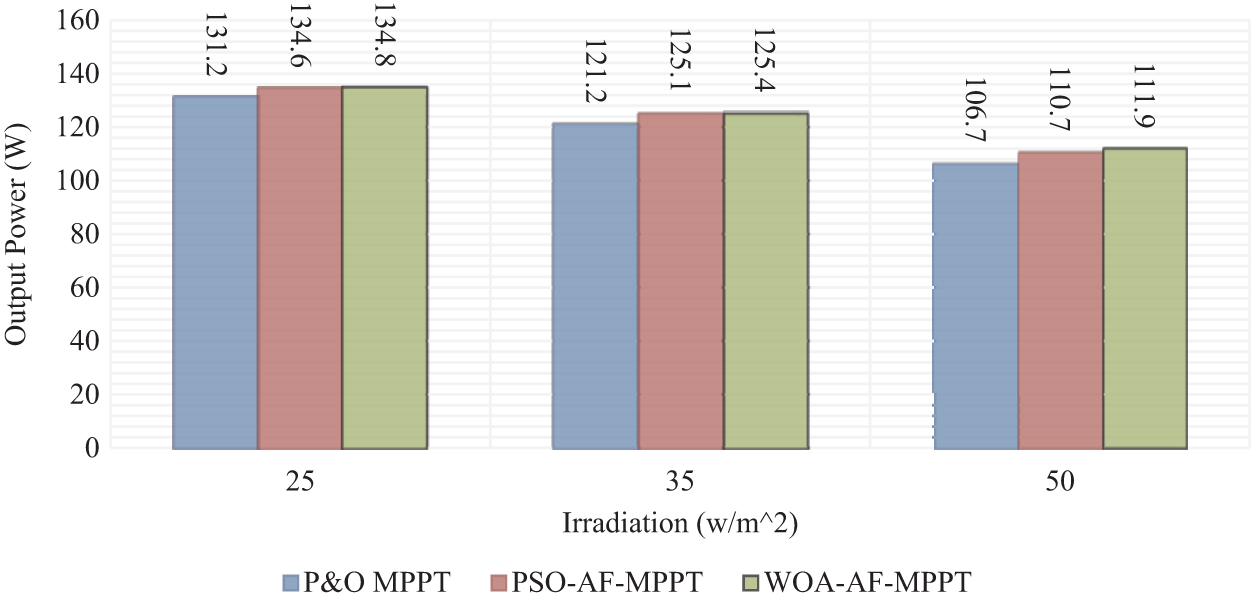
Figure 19: Maximum power values of the photovoltaic system at different temperatures
According to the calculated maximum power values, the maximum amount of extracted power is obtained at a temperature of 25°C. In the simulations performed in this scenario, as in the first scenario, the maximum power values obtained in the solar system with the WOA-AF-MPPT proposed maximum power tracking circuit were higher than when other maximum power tracking methods were used.
In this paper, an adaptive fuzzy based control optimized by the whale algorithm is used to achieve the maximum power of the photovoltaic array in conditions of instantaneous and slow changes of radiation and temperature. In order to optimize the parameters and membership functions of the proposed controller, the whale algorithm is used. The ITAE is also considered as the objective function of the problem. The Whale algorithm optimizes the proposed controller parameters by minimizing the ITAE target function. To evaluate the performance of the proposed control system (WOA-AF-MPPT), the simulation results with the results of the adaptive fuzzy maximum power tracking circuit optimized by the particle swarm algorithm (PSO-AF-MPPT) and the maximum power point tracking circuit based on the perturbation and observation method (P&O-MPPT), compared. The simulations are performed in two scenarios with different operating conditions. In the first part of the simulations, by keeping the surface temperature of the photovoltaic array constant at the standard value of 25°C, only with changes in radiation intensity to the array surface, the efficiency of the maximum designed power search circuits is evaluated and analyzed. In the second part of the simulations, the radiation intensity to the array surface at 1000 watts per square meter was constant and with the changes in the array surface temperature, the performance of the two maximum power tracking circuits were compared with each other. The results of the simulations in two scenarios confirm the better operation of the adaptive fuzzy based control method. Even though the performance speed of all three-control methods was almost equal due to the equal number of membership functions, but the amount of electrical power that can be received more with less power perturbation, shows the superiority of fuzzy logic method over perturbation and observation method has it.
Funding Statement: The authors received no specific funding for this study.
Conflicts of Interest: The authors declare that they have no conflicts of interest to report regarding the present study.
References
1. B. Yang, L. Zhong, X. Zhang, H. Shu, T. Yu et al., “Novel bio-inspired memetic salp swarm algorithm and application to MPPT for PV systems considering partial shading condition,” Journal of Cleaner Production, vol. 215, no. 3, pp. 1203–1222, 2019. [Google Scholar]
2. P. Fu-Sheng and P. Tseng, “An efficient GWO MPPT for a PV system using impedance information acceleration,” International Journal of Electronics, vol. 106, no. 4, pp. 648–661, 2019. [Google Scholar]
3. P. Somashree, C. Subramani, R. Sridhar, T. Thamizh Thentral and S. Padmanaban, “Nature-inspired MPPT algorithms for partially shaded PV systems: A comparative study,” Energies, vol. 12, no. 8, pp. 1–21, 2019. [Google Scholar]
4. A. Mazen, M. T. El-Mohandes and M. El-Ghazaly, “An efficient tracking of MPP in PV systems using a newly-formulated P&O-MPPT method under varying irradiation levels,” Journal of Electrical Engineering & Technology, vol. 15, no. 1, pp. 501–513, 2020. [Google Scholar]
5. A. Nedjma, M. S. Aitcheikh, M. Becherif and M. A. Ebrahim, “AI-based global MPPT for partial shaded grid connected PV plant via MFO approach,” Solar Energy, vol. 171, pp. 593–603, 2018. [Google Scholar]
6. Y. Unal, A. Kircay and S. Borekci, “PV system fuzzy logic MPPT method and PI control as a charge controller,” Renewable and Sustainable Energy Reviews, vol. 81, no. 8, pp. 994–1001, 2018. [Google Scholar]
7. J. Sandip, N. Kumar, R. Mishra, D. Sen and T. Kumar Saha, “Development and implementation of modified MPPT algorithm for boost converter-based PV system under input and load deviation,” International Transactions on Electrical Energy Systems, vol. 30, pp. e12190, 2020. [Google Scholar]
8. P. Sanjeevikumar, N. Priyadarshi, J. B. Holm-Nielsen, M. Sagar Bhaskar, F. Azam et al., “A novel modified sine-cosine optimized MPPT algorithm for grid integrated PV system under real operating conditions,” IEEE Access, vol. 7, pp. 10467–10477, 2019. [Google Scholar]
9. R. Hegazy, A. Mazen, M. R. Gomaa, M. A. Tolba, A. Fathy et al., “A novel statistical performance evaluation of most modern optimization-based global MPPT techniques for partially shaded PV system,” Renewable and Sustainable Energy Reviews, vol. 115, no. 109372, pp. 1–28, 2019. [Google Scholar]
10. B. C. H. Hussaian, V. Bansal, C. Rani, R. M. Brisilla and S. Odofin, “Development of cuckoo search MPPT algorithm for partially shaded solar PV SEPIC converter,” Soft Computing for Problem Solving, vol. 1048, pp. 727–736, 2020. [Google Scholar]
11. T. Kok Soon, S. Mekhilef, M. Seyedmahmoudian, B. Horan, A. T. Oo et al., “Improved differential evolution-based MPPT algorithm using SEPIC for PV systems under partial shading conditions and load variation,” IEEE Transactions on Industrial Informatics, vol. 14, no. 10, pp. 4322–4333, 2018. [Google Scholar]
12. A. Elyousr, K. Farag, A. M. Abdelshafy and A. Y. Abdelaziz, “MPPT-based particle swarm and cuckoo search algorithms for PV systems,” in Modern Maximum Power Point Tracking Techniques for Photovoltaic Energy Systems, pp. 379–400, 2020. [Google Scholar]
13. P. Amit Kumer, N. Kumar Roy and H. Roy Pota, “MPPT methods for solar PV systems: A critical review based on tracking nature,” IET Renewable Power Generation, vol. 13, no. 10, pp. 1615–1632, 2019. [Google Scholar]
14. R. Hegazy, A. Mazen, M. R. Gomaa, M. A. Tolba, A. Fathy et al., “A novel statistical performance evaluation of most modern optimization-based global MPPT techniques for partially shaded PV system,” Renewable and Sustainable Energy Reviews, vol. 115, no. 109372, pp. 1–28, 2019. [Google Scholar]
15. Y. Bo, L. Zhong, X. Zhang, H. Shu, T. Yu et al., “Novel bio-inspired memetic salp swarm algorithm and application to MPPT for PV systems considering partial shading condition,” Journal of Cleaner Production, vol. 215, no. 3, pp. 1203–1222, 2019. [Google Scholar]
16. L. Yong, S. Samad, F. Waly Ahmed, S. S. Abdulkareem, S. Hao et al., “Analysis and enhancement of PV efficiency with hybrid MSFLA-FLC MPPT method under different environmental conditions,” Journal of Cleaner Production, vol. 271, no. 122195, pp. 1–21, 2020. [Google Scholar]
17. B. Ratnakar Babu, S. Mikkili and P. Kumar Bonthagorla, “Critical review on PV MPPT techniques: Classical, intelligent and optimization,” IET Renewable Power Generation, vol. 14, no. 9, pp. 1433–1452, 2020. [Google Scholar]
18. P. Sanjeevikumar, N. Priyadarshi, J. Bo Holm-Nielsen, M. Sagar Bhaskar, F. Azam et al., “A novel modified sine-cosine optimized MPPT algorithm for grid integrated PV system under real operating conditions,” IEEE Access, vol. 7, pp. 10467–10477, 2019. [Google Scholar]
19. H. Abdelghani and S. Messalti, “PSO-based SMC variable step size P&O MPPT controller for PV systems under fast changing atmospheric conditions,” International Journal of Numerical Modelling: Electronic Networks, Devices and Fields, vol. 32, no. 5, pp. e2603, 2019. [Google Scholar]
20. P. Neeraj, V. K. Ramachandaramurthy, S. Padmanaban and F. Azam, “An ant colony optimized MPPT for standalone hybrid PV-wind power system with single Cuk converter,” Energies, vol. 12, no. 1, pp. 1–23, 2019. [Google Scholar]
21. M. Seyedali and A. Lewis, “The whale optimization algorithm,” Advances in Engineering Software, vol. 95, no. 12, pp. 51–67, 2016. [Google Scholar]
22. P. Somashree, C. Subramani, R. Sridhar, T. Thentral and S. Padmanaban, “Nature-inspired MPPT algorithms for partially shaded PV systems: A comparative study,” Energies, vol. 12, no. 8, pp. 1–19, 2019. [Google Scholar]
23. M. Majad, A. Feroz Mirza and Q. Ling, “Harris hawk optimization-based MPPT control for PV systems under partial shading conditions,” Journal of Cleaner Production, vol. 274, no. 2, pp. 122857, 2020. [Google Scholar]
24. H. Chen, Y. Miao, Y. Chen, L. Fang, L. Zeng et al., “Intelligent model-based integrity assessment of nonstationary mechanical system,” Journal of Web Engineering, vol. 20, no. 2, pp. 253–280, 2021. [Google Scholar]
25. Z. Lv and L. Qiao, “Deep belief network and linear perceptron based cognitive computing for collaborative rbots,” Applied Soft Computing, vol. 92, pp. 1–10, 2020. [Google Scholar]
26. J. Mou, P. Duan, L. Gao, X. Liu and J. Li, “An effective hybrid collaborative algorithm for energy-efficient distributed permutation flow-shop inverse scheduling,” Future Generation Computer Systems, vol. 128, no. 99, pp. 521–537, 2022. [Google Scholar]
27. S. Lv and F. Song, “Particle swarm intelligence and the evolution of cooperation in the spatial public goods game with punishment,” Applied Mathematics and Computation, vol. 412, pp. 126586, 2022. [Google Scholar]
28. B. Li, Y. Feng, Z. Xiong, W. Yang and G. Liu, “Research on AI security enhanced encryption algorithm of autonomous IoT systems,” Information Sciences, vol. 575, no. 4, pp. 379–398, 2021. [Google Scholar]
29. W. Yang, X. Chen, Z. Xiong, Z. Xu, G. Liu et al., “A privacy-preserving aggregation scheme based on negative survey for vehicle fuel consumption data,” Information Sciences, vol. 570, pp. 526–544, 2021. [Google Scholar]
30. L. Zhang, T. Gao, G. Cai and K. L. Hai, “Research on electric vehicle charging safety warning model based on back propagation neural network optimized by improved gray wolf algorithm,” Journal of Energy Storage, vol. 49, pp. 104092, 2022. [Google Scholar]
31. D. Li, S. S. Ge and T. H. Lee, “Fixed-time-synchronized consensus control of multiagent systems,” IEEE Transactions on Control of Network Systems, vol. 8, no. 1, pp. 89–98, 2021. [Google Scholar]
32. Y. Zhang, F. Liu, Z. Fang, B. Yuan, G. Zhang et al., “Learning from a complementary-label source domain: theory and algorithms,” IEEE Transaction on Neural Networks and Learning Systems, vol. x, pp. 1–15, 2021. [Google Scholar]
33. S. He, F. Guo, Q. Zou and H. Ding, “MRMD2.0: A python tool for machine learning with feature ranking and reduction,” Current Bioinformatics, vol. 15, no. 10, pp. 1213–1221, 2020. [Google Scholar]
34. Z. Wu, C. Li, J. Cao and Y. Ge, “On scalability of association-rule-based recommendation: A unified distributed-computing framework,” ACM Transactions on the Web, vol. 14, no. 3, pp. 1–21, 2020. [Google Scholar]
35. Z. Wu, A. Song, J. Cao, J. Luo and L. Zhang, “Efficiently translating complex SQL query to map reduce jobflow on cloud,” IEEE Transactions on Cloud Computing, vol. 8, no. 2, pp. 508–517, 2020. [Google Scholar]
36. W. Zheng, Y. Xun, X. Wu, Z. Deng, X. Chen et al., “A comparative study of class rebalancing methods for security bug report classification,” IEEE Transactions on Reliability, vol. 70, no. 4, pp. 1–13, 2021. [Google Scholar]
37. W. Zheng, T. Shen, X. Chen and P. Deng, “Interpretability application of the just-in-time software defect prediction model,” Journal of Systems and Software, vol. 188, no. 3, pp. 111245, 2022. [Google Scholar]
38. B. Bai, R. Zhou, G. Cai, W. Hu and G. Yang, “Coupled thermo-hydro-mechanical mechanism in view of the soil particle rearrangement of granular thermodynamics,” Computers and Geotechnics, vol. 137, pp. 104272, 2021. [Google Scholar]
39. F. Meng, W. Cheng and J. Wang, “Semi-supervised software defect prediction model based on tri-training,” KSII Transactions on Internet and Information Systems, vol. 15, no. 11, pp. 4028–4042, 2021. [Google Scholar]
40. Y. Wang, H. Wang, B. Zhou and H. Fu, “Multi-dimensional prediction method based on Bi-LSTMC for ship roll,” Ocean Engineering, vol. 242, no. 3, pp. 110106, 2021. [Google Scholar]
41. Z. Chen, J. Tang, X. Y. Zhang, D. K. C. So, S. Jin et al., “Hybrid evolutionary-based sparse channel estimation for IRS-assisted mmwave MIMO systems,” IEEE Transactions on Wireless Communications, vol. 21, no. 3, pp. 1586–1601, 2022. [Google Scholar]
42. A. Yan, Y. Hu, J. Cui, Z. Chen, Z. Huang et al., “Information assurance through redundant design: A novel TNU error-resilient latch for harsh radiation environment,” IEEE Transactions on Computers, vol. 69, no. 6, pp. 789–799, 2020. [Google Scholar]
43. A. Yan, Z. Xu, X. Feng, J. Cui, Z. Chen et al., “Novel quadruple-node-upset-tolerant latch designs with optimized overhead for reliable computing in harsh radiation environments,” IEEE Transactions on Emerging Topics in Computing, vol. 10, no. 1, pp. 404–413, 2020. [Google Scholar]
44. S. Chen, J. Zhang, F. Meng, D. Wang, Z. Wei et al., “A markov chain position prediction model based on multidimensional correction,” Complexity (New York, N.Y.), vol. 2021, pp. 1–8, 2021. [Google Scholar]
45. F. Meng, A. Pang, X. Dong, C. Han, X. Sha et al., “H∞ optimal performance design of an unstable plant under bode integral constraint,” Complexity (New York N.Y.), vol. 2018, pp. 1–10, 2018. [Google Scholar]
46. F. Meng, D. Wang, P. Yang, G. Xie, R. Cutberto et al., “Application of sum of squares method in nonlinear H∞ control for satellite attitude maneuvers,” Complexity (New York N.Y.), vol. 2019, pp. 1–10, 2019. [Google Scholar]
47. W. Zheng, X. Liu and L. Yin, “Research on image classification method based on improved multi-scale relational network,” PeerJ Computer Science, vol. 7, no. 3, pp. 1–21, 2021. [Google Scholar]
48. Z. Ma, W. Zheng, X. Chen and L. Yin, “Joint embedding VQA model based on dynamic word vector,” PeerJ Computer Science, vol. 7, pp. 1–20, 2021. [Google Scholar]
49. W. Zheng, L. Yin, X. Chen, Z. Ma, S. Liu et al., “Knowledge base graph embedding module design for visual question answering model,” Pattern Recognition, vol. 120, no. 2, pp. 108153, 2021. [Google Scholar]
50. M. Zhang, Y. Chen and W. Susilo, “PPO-CPQ: A privacy-preserving optimization of clinical pathway query for e-healthcare systems,” IEEE Internet of Things Journal, vol. 7, no. 10, pp. 10660–10672, 2020. [Google Scholar]
51. M. Zhang, Y. Chen and J. Lin, “A privacy-preserving optimization of neighborhood-based recommendation for medical-aided diagnosis and treatment,” IEEE Internet of Things Journal, vol. 8, no. 13, pp. 10830–10842, 2021. [Google Scholar]
52. S. Zhao, F. Li, H. Li, R. Lu, S. Ren et al., “Smart and practical privacy-preserving data aggregation for fog-based smart grids,” IEEE Transactions on Information Forensics and Security, vol. 16, pp. 521–536, 2021. [Google Scholar]
53. J. Yu, L. Lu, Y. Chen, Y. Zhu and L. Kong, “An indirect eavesdropping attack of keystrokes on touch screen through acoustic sensing,” IEEE Transactions on Mobile Computing, vol. 20, no. 2, pp. 337–351, 2021. [Google Scholar]
54. H. Kong, L. Lu, J. Yu, Y. Chen and F. Tang, “Continuous authentication through finger gesture interaction for smart homes using WiFi,” IEEE Transactions on Mobile Computing, vol. 20, no. 11, pp. 3148–3162, 2021. [Google Scholar]
55. H. Salem, M. Y. Shams, O. M. Elzeki, M. Abd Elfattah, J. F. Al-Amri et al., “Fine-tuning fuzzy KNN classifier based on uncertainty membership for the medical diagnosis of diabetes,” Applied Sciences, vol. 12, no. 3, pp. 1–26, 2022. [Google Scholar]
 | This work is licensed under a Creative Commons Attribution 4.0 International License, which permits unrestricted use, distribution, and reproduction in any medium, provided the original work is properly cited. |