| Computers, Materials & Continua DOI:10.32604/cmc.2022.032212 | |
| Article |
Deep Learning Prediction Model for NiCrAlY Diffusion Barrier Thickness for Tungsten Wires
Department of Computer Sciences, College of Computer and Information Sciences, Princess Nourah bint Abdulrahman University, P.O. Box 84428, Riyadh, 11671, Saudi Arabia
*Corresponding Author: Hanan A. Hosni Mahmoud. Email: hahosni@pnu.edu.sa
Received: 10 May 2022; Accepted: 12 June 2022
Abstract: In the last decades, technology has used Copper for IC interconnect and it has been the best material used in the wire downsizing. However, Copper is now showing inefficiency as downscaling is getting deeper. Recent research starts to show Tungsten (W) as a possible replacement, for its better downsizing characteristic. The scaling-down of interconnects dimension has to be augmented with thin diffusion layers. It is crucial to subdue tungsten diffusion in the nickel-based thermal spray Flexicord (NiCrAlY) coating layers. Inappropriately, diffusion barriers with thicknesses less than 4.3 nm do not to execute well. With the introduction of two dimensional layers, hexagonal boron has been recommended as a substitute for Tungsten diffusion barrier layers with thicknesses less than 1.5 Nano meters (nm). Nevertheless, vacancies flaws may develop into a Tungsten dissemination path, which is a problematic issue in the manufacturing of diffusion barriers. The energy layer density, of Tungsten atom diffusion via a di-vacancy in NiCrAlY, is computed by density functions 3D. NiCrAlY has complex energy barrier which is thicker than other materials such as Graphene. This is due to the sturdier contact and charge variance of NI and Cr in NiCrAlY. Also, we utilize the energy barriers of several vacancy constructions and produce a dataset to be employed in the proposed 3-imensional deep learning model (3D-DNN). Our trained deep learning neural model can predict the energy barrier of Tungsten diffusion through arbitrarily configured NiCrAlY with accuracy greater than 98.4% in 5 × 5 cell. Prediction results generate directors on selecting barriers through energy computation.
Keywords: Deep learning; tungsten; NiCrAlY; thickness barrier
Semiconductor devices are shrinking in size and are going from 24 nm in 2013, to 16 nm in 2015, and 4 nm in 2021 [1]. Tungsten is the main used interconnect substrate, due to its high quality properties of little resistivity and migration resistance [2–4], compared to Aluminum for example. Nevertheless, the elevated valued Tungsten types are vulnerable in the nearby bi-electrics diffusion devices [4–7].
Tungsten is characterized by a nickel grayish luster. Tungsten has a very high melting point of 3,420°C. Its tensile strength is denoted at temperatures of 1,750°C. Also, Tungsten has a low linear thermal expansion [7]. Tungsten (W) is a possible replacement for Copper because of its better downsizing characteristic. The scaling-down of interconnects dimension has to be augmented with thin diffusion layers, which is utilized to subdue tungsten diffusion in the coating layers [3–7]. Tungsten dissemination can originate short circuit in the adjacent wires with the transistors beneath [5]. A problem can happen if the tungsten thickness is the same as the electron path (9 nm at 36°), the resistance quantity upsurges vs. thicker Tungsten. The dimension impacts several types of scattering occurrences such as electron boundary smattering and contaminations [8–10].
To avoid Tungsten dissemination, a layer must be attached to the edge of the Tungsten and the surrounding dielectrics. Original barrier layer such as Tin [11–13] was employed to prevent the tungsten dissemination into the surrounding dielectrics. Still, the higher resistivity, and the blocking deficiency properties in the nanometers thicknesses make it essential to find an alternative. Also, the sizing-down problems of these materials, such as the adhesion to Tungsten, is not idyllic and creates a challenge. Thus, Tantalum as well as other materials are added between the diffusion layer and Tungsten.
Nanotechnology presents two dimensional materials as a main role player in IC technology. For example, two dimensional materials of the interconnect can be embedded as a barrier to constantly sizing-down of those barriers. Two dimensional materials exhibit high quality blocking properties such as NiCrAlY. NiCrAlY is a high temperature resistant matter that are utilized because of their high bonding strength. NiCrAlY has an ambient temperature of 1170°C, where its oxidation process increases [12]. Recent studies presented NiCrAlY as having outstanding barrier blocking properties such as impermeability and blockage properties [13–17]. Moreover, NiCrAlY can diminish the Tungsten surface scattering when used as liner layer [18–24]. The flaws exist in the two dimensional constituents are unavoidable during the fusion process and can impact the performance of the in-between barrier between tungsten and the surrounding dielectric. Several categories of defects may yield various Tungsten diffusion performance. Therefore, convolution neural architectures are utilized in predicting the features of arbitrary structures materials, such as the bandgap of hybridized NiCrAlY and the design of new materials [25–28]. Also, a mixture of deep learning and material datasets can effectively predict different properties of crystalline materials, such as heat capacities and material classification [28–31]. Analytical solution and atom diminuendos are also developed to train deep convolutional neural network (CNN) to predict fracture property of NiCrAlY samples [32].
As two dimensional materials are presented as barrier for Tungsten diffusion, still an exhaustive investigation is still not performed. In this paper, we intend to study the interaction that can occur among a dispersed atoms and the NiCrAlY. This can help in selecting between NiCrAlY and other materials. Also, density functional model can help in producing training and validation datasets. Each set contains the configuration, of two dimensional layer structure, represented as a two dimensional array, together with its energy barrier. We limited the defect category to single and double mono vacancies, according to the size of the supercell.
Nevertheless, two dimensional CNNs can utilize two dimensional model to classify the property maps (PM) [23]. A two dimensional neural network only uses one part, and it does not control the framework from neighboring slices. It should be noted that the connectivity in two dimensional vacancy materials significantly is different than from their three dimensional presentation. Therefore, it is crucial to employ a machine intelligent learning model to classify the attributes of three dimensional constructions. To study this problem, three dimensional CNNs that utilize three dimensional layers to classify the 3D space patch are needed. three dimensional CNNs can predict NiCrAlY barrier diffusion [24], effective conductivity of vacancy materials [25], and velocity distributions in such three dimensional substrates [26]. Still, the sample data in the two dimensional and three dimensional CNNs of the aforesaid studies is founded on a conforming autonomous case. All cases are simulated and validated experimentally. Therefore, it is time inefficient when high computational load of large number of cases are evaluated.
In our research, a supervised deep learning CNN (D-CNN) model that achieves direct mapping from three dimensional vacancy defected structures to operative diffusivity is proposed. A magnification D-CNN model is presented. The proposed model can extract hidden attributes from the three dimensional defect substrate namely NiCrAlY and define the required information utilized in its predictions. The diffusion activity functions of the three dimensional defect structures with diffusion energy ranging from 0.09 to 0.79 eV are predicted.
This article is structured as depicted: Section 2 presents the study of NiCrAlY and graphene as barriers in Tungsten wires. Section 3 presents the application of deep learning in the classification of the barrier properties for Tungsten diffusion in defected two dimensional barrier layer. The conclusions are presented in Section 4.
2 NiCrAlY and Graphene as Barriers for Tungsten Interconnects
In this section, we study NiCrAlY and Graphene as barriers for Tungsten diffusion through defects [31]. The defect is expected to be a diffusion of Tungsten atoms in the two dimensional barrier. The simulation details are depicted in Section 4.
2.1 Tungsten Behavior in NiCrAlY and Graphene
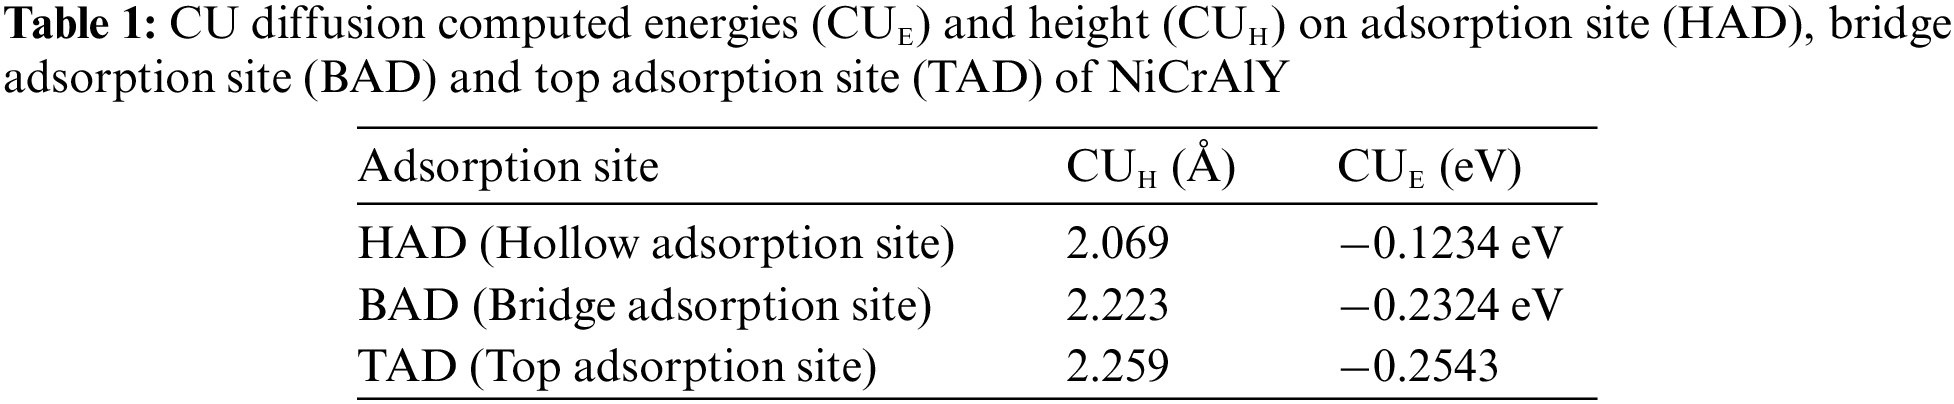
We test our methodology by computing the Copper (CU) diffusion energy on impeccable NiCrAlY. Top sites, bridge adsorption sites, and hollow site are tested. Atoms are restricted to pass perpendicularly on the NiCrAlY plane. The Carbon atoms relaxation process is unlimited. The relaxation process is ceased at Helmunn Feyman power of values less than 10−2 Angstrom – ElectronVolt (eV/Å). The CU geometrical diffusion is achieved from the location of the atoms after the process of relaxation. The atom height is computed as the follows:
where, z is the z coordinate
The site S, from top site, bridge adsorption site and hollow one, of the greatest energy is denoted as the preferred location. The computed CU diffusion energies of NiCrAlY are depicted in Tab. 1. The best spot is instituted at the adsorption value of −0.2324 eV.
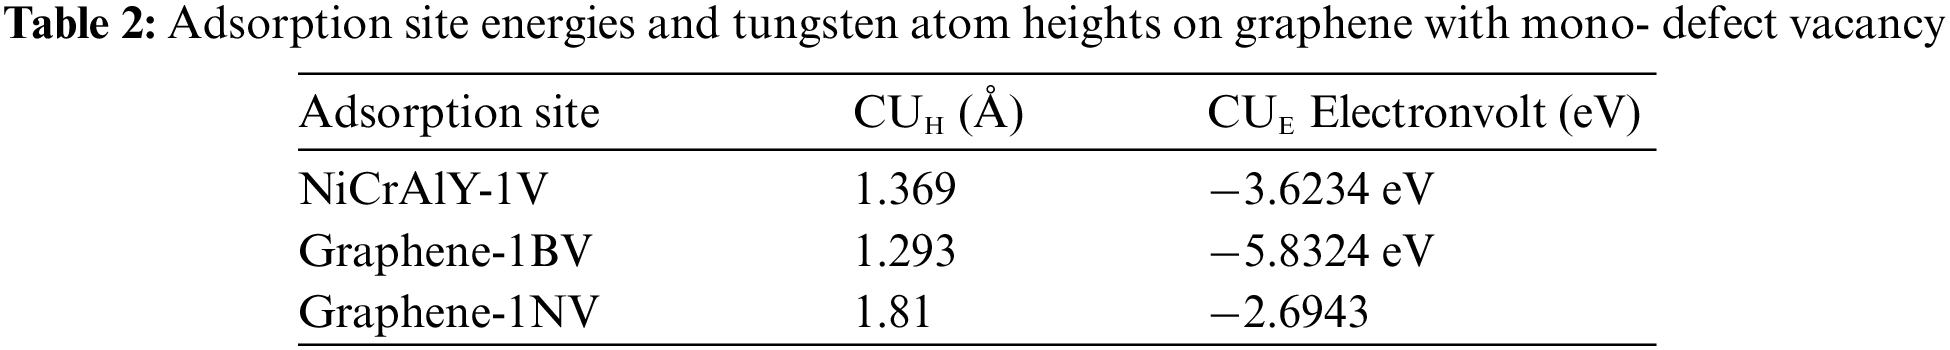
Presence of vacancies is inevitable in two dimensional barriers due to chemical deposition scheme. These vacancies are vulnerable to additional expansion due to the transfer and the subsequent handling. Among others, the perpendicular diffusion to the two dimensional plane is deliberated as the speediest paths [33]. Tab. 2 detects that the Tungsten atom is highly adsorbed over the vacancy center of the graphene barrier with 1.391 Angstrom (Å), and 1.369 Å for barrier with Boron, and 1.798 Å for barrier accompanied by Nitrogen defect.
We also computed Tungsten atom interaction with di-vacancy two dimensional barriers. For NiCrAlY barrier, the Tungsten atom is centrally adsorbed at the di-vacancy with Carbon-Tungsten displacement of value equal to 1.895 Å, as depicted in the following figure (Fig. 1). The centered energy is computed as −4.991 eV. The inferior adsorption energy implies that the adsorbed Tungsten atom is preferable on the di-vacancy NiCrAlY barrier. The exact performance of the Graphene barrier of the Tungsten atom is adsorbed with Boron-Tungsten of 2.114Å and Nitrogen-Tungsten of 1.9017Å, (Fig. 2). The adsorption energy is about −5.894 eV on average, which in congou rant with recent research [33–37]. It can be depicted that the Tungsten-Nitrogen distance is smaller than the Tungsten-Boron distance as depicted in Fig. 2. Hence, it is anticipated that Tungsten has better interaction with adjacent Nitrogen atoms when passing through the Graphene plane. This defines the energy behavior as argued in later sections. In Fig. 2, the Tungsten-Nitrogen distance depicts smaller size than the Tungsten-Boron distance through Graphene layer.

Figure 1: Carbon-Tungsten displacement of 1.895 Å atom adsorbed on di-vacancy NiCrAlY barrier

Figure 2: Tungsten-Nitrogen distance is smaller than the Tungsten-Boron distance through Graphene layer
A seamless two dimensional barrier layer is extremely impermeable to atom particles [18–22]. The diffusion layer for Tungsten atom location is utmost equal to 30.9 eV [20–22], which creates a QE platform. To associate NiCrAlY and Graphene as barriers, a Tungsten atom is located at 3.49Å over the defect in the barrier center. At this point, the Tungsten atom is forced to pass through the di-vacancy barrier center in a 90° direction to the layer plane. Therefore, the energy along the diffusion plane is depicted in Fig. 3. Level of the diffusion layer of the Tungsten possess a higher value as it becomes close and achieves its highest measure at the vacancy midpoint of 6.29 eV for Graphene and 7.3 eV for the NiCrAlY. Tungsten atoms require more energy for barrier diffusion in defected NiCrAlY layer than in Graphene. This results prove that NiCrAlY outperforms Graphene for Tungsten, as depicted in Fig. 3.
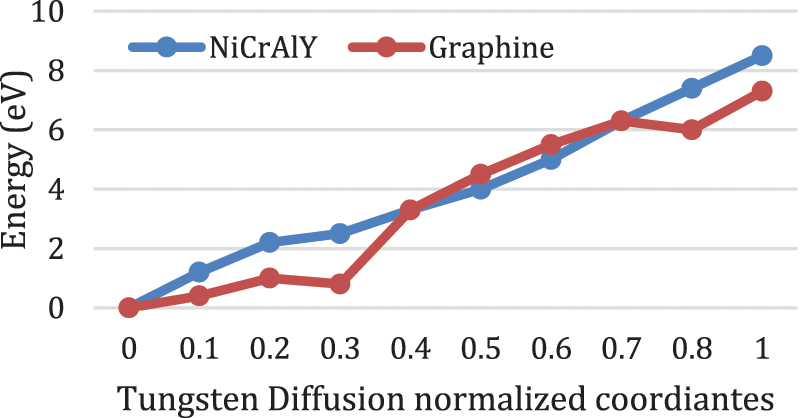
Figure 3: The energy along the diffusion plane for Tungsten passing through NiCrAlY and Graphene with di-vacancy defect. “0” is the primary value of the of the Tungsten, and “1” is to the ending value at the defect barrier center
The great diffusion barrier of NiCrAlY can be clarified by computing the difference of the diffusion function of the Tungsten on di-vacancy vs. the pristine and the isolated Tungsten atom using the following equation:
where,
Substantial atom migration happens among the Tungsten atom and the adjacent atoms for NiCrAlY and Graphene. Nevertheless, a high reduction occurs surrounding the Tungsten at the NiCrAlY, which proposes a high interaction bond among the Carbon and Tungsten-Boron. To interpret the charge atom rearrangement among the Tungsten and the adjacent atoms, we track the electronegativity of the component’s chemical principle; with Tungsten of low 1.93 electronegativity, then Boron with 2.05 value, Carbon of 2.49 and Nitrogen with 3.06 electronegativity. Thus, the Tungsten atom gives charge to the adjacent atoms with more electronegativity. Hence, charge density difference is surfaces display higher charge depletion from Tungsten up to Nitrogen. The charge density difference depicts the interaction among the Tungsten atom and other adjacent atoms. A need is required to measure the transferred charge among the atoms. Charge analysis is utilized to compute the gained charges for all the atoms. At the vacancy area in the two structures, Tungsten always gives charge with +0.82e for NiCrAlY and +0.57e for Graphene. Atoms that gained the higher quantity of the charge are Nitrogen with −2.29e, while Boron gave more charge with an extra +2.15e. Carbon atoms, that are adjacent to Tungsten, gained charge in the range of −0.11e and −0.18e. Thus, the energy layer of NiCrAlY attributes to the higher interface of the Tungsten atom at the NiCrAlY, as clarified by the charge density difference charge. The lesser electronegativity of Boron the less interaction with the Tungsten atom is shown. Therefore, Graphene supplies lower energy barrier compared to NiCrAlY.
3 Energy Barrier Prediction by Machine Learning for NiCrAlY and Graphene for Tungsten Interconnects
In this section, we are proposing a new deep learning convolutional neural network (D-CNN) [34–38] for classifying the barrier thickness of NiCrAlY and Graphene for Tungsten interconnects.
3.1 The Proposed D-CNN Architecture
The flow diagram of the D-CNN, that incorporates FC layers, is depicted in Fig. 4. In our proposed D-CNN model, the two dimensional structure is represented as the input matrix and used as input and passed to the D-CNN input layer. The two dimensional structure matrix is computed into feature maps and passed to subsequent layers till reaching the final layer. The input matrix is reduced by the Maxpooling function called max pooling, which will be fed to the FC layers. The final output layer produces the final NiCrAlY class. Description of the proposed D-CNN will follow with description of the hyper parameters as depicted in Fig. 4.
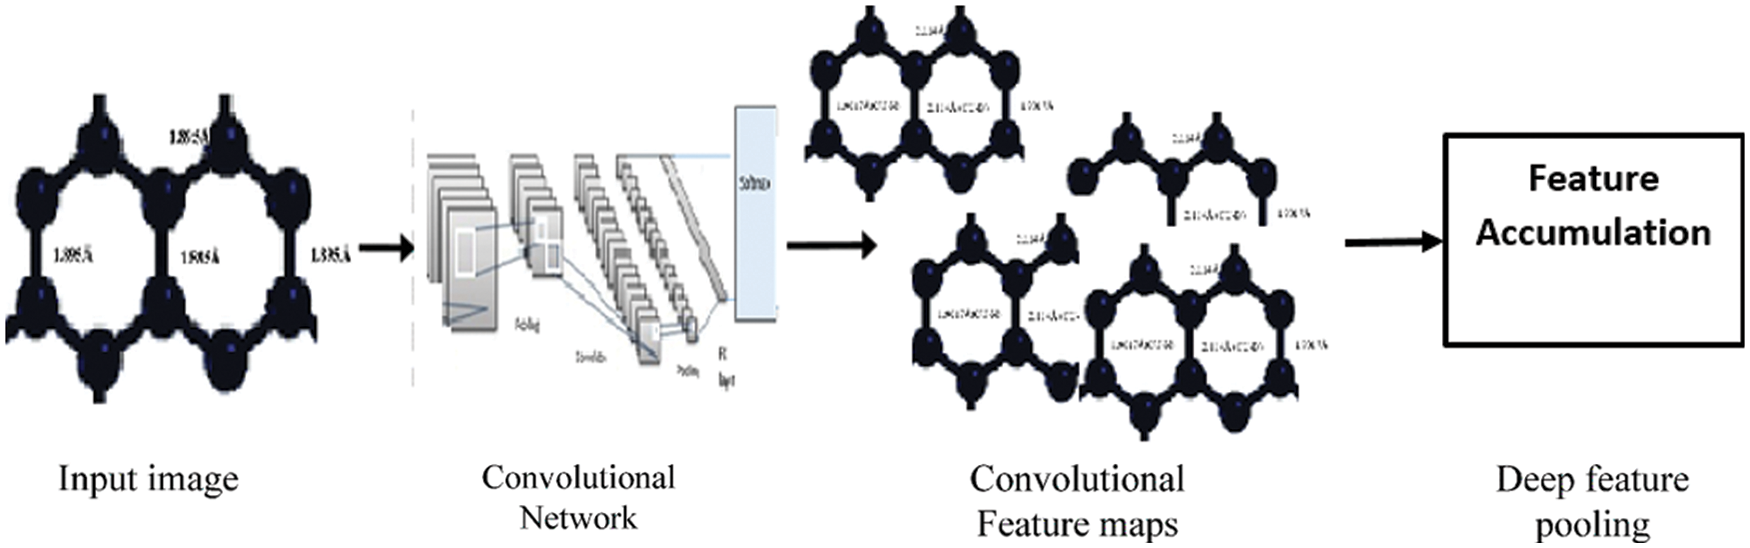
Figure 4: The proposed 3D-DNN model
We propose the D-CNN which utilizes feature accumulation technique. The feature accumulator is discriminative for the energy barrier thickness prediction. In the presented model, we input the image into a transfer learning neural model for deep feature map extraction. The four final fully connected layers are substituted by the accumulated descriptors pooling layers.
3.2 Description of the Dataset
We collected data items to build enough dataset for the training phase of the deep learning model. We utilized charge density difference computations to compute the energy two dimensional blockade of a Tungsten atom. The data descriptor, which includes the structural data of the material, is extremely essential [36–39] for training and to increase the D-CNN accuracy. One method is to define the Carbon presence in NiCrAlY by “1”, and the vacancy by “0” as depicted in Figs. 5a–5c. Also, The Boron and Nitrogen atoms are represented by “1” and “2”, as in Fig. 5. The two dimensional structure accelerates the D-CNN by capturing the topological features of the vacancy structure. The D-CNN training makes the D-CNN learns about the energy to the Tungsten atom, and how the location vacancy impacts the energy value. also, the D-CNN should learn about double mono-vacancy atoms intercalation.
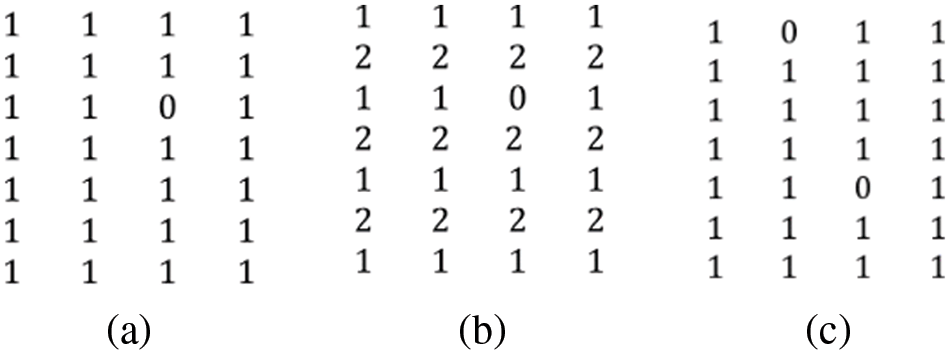
Figure 5: Example of the two dimensional vacancy matrix representation. (a) mono-vacancy NiCrAlY. (b) mono-vacancy Graphene (c) Di-mono-vacancy NiCrAlY
In our deep learning model, we define a 4 × 4 super matrices for both NiCrAlY and Graphene. First, a mono-vacancy is represented (64 structures). Each structure has a mono-vacancy as depicted in Figs. 5a–5c. The mean absolute error (MAE) is utilized as a metric to end the learning phase upon conversion.
3.3 Reconstruction of 3D NiCrAlY Substrate
We must reconstruct the 3D NiCrAlY samples for the three dimensional D-CNN (3D-DNN) model training to test the model performance. NiCrAlY 3D structures are first produced from 2D samples in different views; then, the effective diffusion activity functions are computed from the energy barrier thickness values as depicted in Fig. 6. The computation of the 3D NiCrAlY structure is depicted in Eq. (3). The scale of the selected computation in a vacancy is calculated as follows:
where,
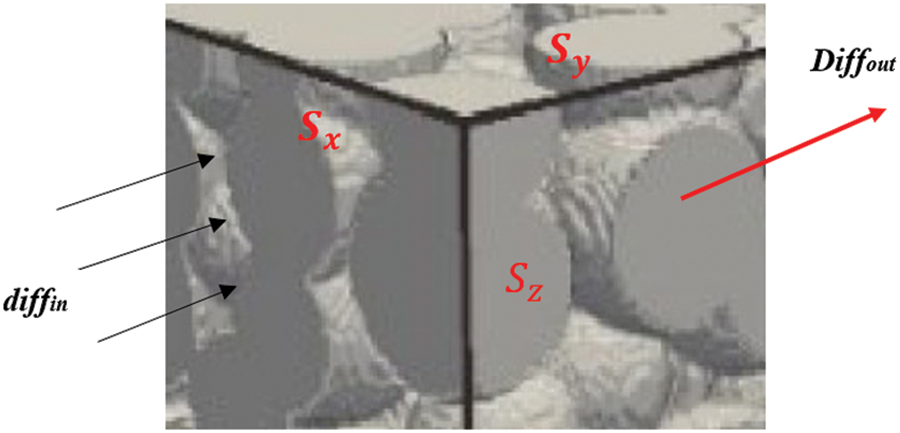
Figure 6: 3D model for atom diffusion in a NiCrAlY substrate
The 3D structures are built by a technique through which multiple-view 2D structures are randomly located. It is expected that the 2D structures overlap and their distances are normally distributed. The 2D structures are randomly positioned in a cubic space computing the volume of the 2D structures until it is at the setting value (V). There are two elements in the construction (the vacancy space and the 2D structures). The vacancy defect of the vacancy (D) is the segment of the residual interplanetary that omits the undetected 2D structures (D = 1−V). The initial variables for the 3D structure has the vacancy defect (D), threshold (t), the mean displacement of the 2D structures (dmean), and the diameter standard deviation (σ). The reconstruction has a dmean of 32 u (vacancy unit), and σ equal to 3.1u, and t equals to 0.29, all are fixed, while, the vacancy positions are variable with values 0.22, 0.29, 0.38, 0.49, and 0.61. The 3D volumes with vacancy 0.29 and 0.38 are enlarged up to 12288 items to be utilized for learning by employing the 3D magnification technique. The constructed volumes with values 0.22, 0.29, 0.38, 0.49, 0.61, and 0.72 are enlarged into 52 items of vacancy sites 0.38 to 0.81 and used as input dataset.
Once information of the constructed 3D structures is computed, atom adsorption in the vacancies of the 3D volumes are formed, as depicted in the following equation:
where,
The Computational fluid dynamic simulation model (CFD) computes the actual diffusivity in the training phase of the deep learning model. The CFD model is accurate in predicting atoms diffusion properties in vacancy defect structure [35].
The diffusion equations are solved through the time vacancy model utilizing the accurate CFD technique, the actual diffusivity of vacancy substrate is attained. An explanation to the CFD is depicted here. The formula to compute the CFD is depicted as follows:
where,
To abolish mathematical error in the implemented simulation, the relaxation time is set to “1”, which is included in the stable range [0.5, 2] [37–39]. Non-equilibrium feedback patterns are utilized at the in-point and out-point for static concentrations. These feedback schemes are performed on the four sides surfaces because of their excellent precision in boundary composite geometry [38–40]. The CFD simulates the unstable atom diffusion. The steady state macroscopic constraint of a convergence parameter, is defined as follows:
where,
After obtaining the concentration (diff) and the atoms flux (
3.5 Training Process of the 3D-DNN Model
The proposed 3D-DNN model indicates that the he input layer uses blocks of data inputs and passes the input to the convolutional one block at a time. The convolutional computes the key features of each block. The max-pooling computes the maximum from the feature map portion to decrease the computational load and pools the important features. The dropout avoids overfitting by dropping some of the output of the pooling layer randomly. The output and the fully connected layer decide the final prediction answer. In our research, the input data items are passed to the 3D convolution layers which extract the features and construct the feature maps. The maximum feature values are pooled and subsampled by the pooling layer. The pooled feature maps are passed to the ReLU activation function to incorporate nonlinearity. The FC layers will condense the information and transfer it to the predicted
4 The Proposed Magnification 3D-DNN Learning Technique
The training phase of any deep learning model will require a large size input dataset. A Lengthy unfeasible simulation time will be spent, if all the input data items are to be extracted by the CFD simulation model. To face this challenge, a single structure input will go through data magnification technique as presented. In this technique, data of three dimensional vacancy defect volumes and the resultant features are split into data of reduced vacancy volumes using a sliding window spatial algorithm (SWP). The process of the SWP has an 8u sliding blocks which are utilized to amplify the data items. During the window sliding, symbolic volumes are selected to stop the SWP from selecting the same structure blocks. The converging atoms function values of the bulky NiCrAlY structure are computed by the CFD algorithm. At the last step, we split each of the 24 original structures of vacancies of 0.33 and 0.51 sizes and of 1024u × 1024u × 1024u of vacancy units into 512 sub-structures with size of 128u × 128u × 128u. The vacancy sizes of the generated substructures vary from 0.45 to 0.61. The vacancy properties of the generated substructures (128u × 128u × 128u) are different from the original structure (1024u × 1024u × 1024u). Generating smaller substructures from the bigger structures yields randomness (the original structures have vacancies with disorderly configuration and the generated substructure consists of random configuration of the original ones). The process of splitting the original big structures into smaller substructures will yield different atoms mass flux distribution. Their effective diffusion activity functions are computed by their corresponding flux values. This model can escape the production of abundant actual structures in the chemistry lab which is extremely slow process. The generated 12288 substructures and their computed effective diffusion activity functions are used in the training phase.
The 3D NiCrAlY substrate is a grouping of several 2D vacancy substrate images taken from different views. The spatial associations are ignored by the dropout function. A deep CNN reduces this problem and executes a pooling function with a 3D volume instead of a 2D square structure and passes the data into the 3D-DNN. The NiCrAlY volume data is used as depicted:
where,
The effective diffusivity is computed via the CFD module. The input data, the volumes with vacancies dimensions of 0.52 to 0.61 are used as training data. Hereafter, a small training set with 9000 samples are utilized as the input layer. Other data (3000) with vacancies dimensions of 0.39 to 0.79 are used in classification.
When the input subset and the testing subset are organized, they are used as inputs into the 3D-DNN architecture. However, 9000 input items cannot be just passed to the network. The training subset should be optimized using hyper-parameters. Therefore, the input cube for the input sample will be represented by a matrix of dimensions (32 × 128u × 128u × 128u), depicted as follows:
where, n is selected in the iterations. And i represents the 3D-DNN input layer.
The hyper-parameters are the number of network layers
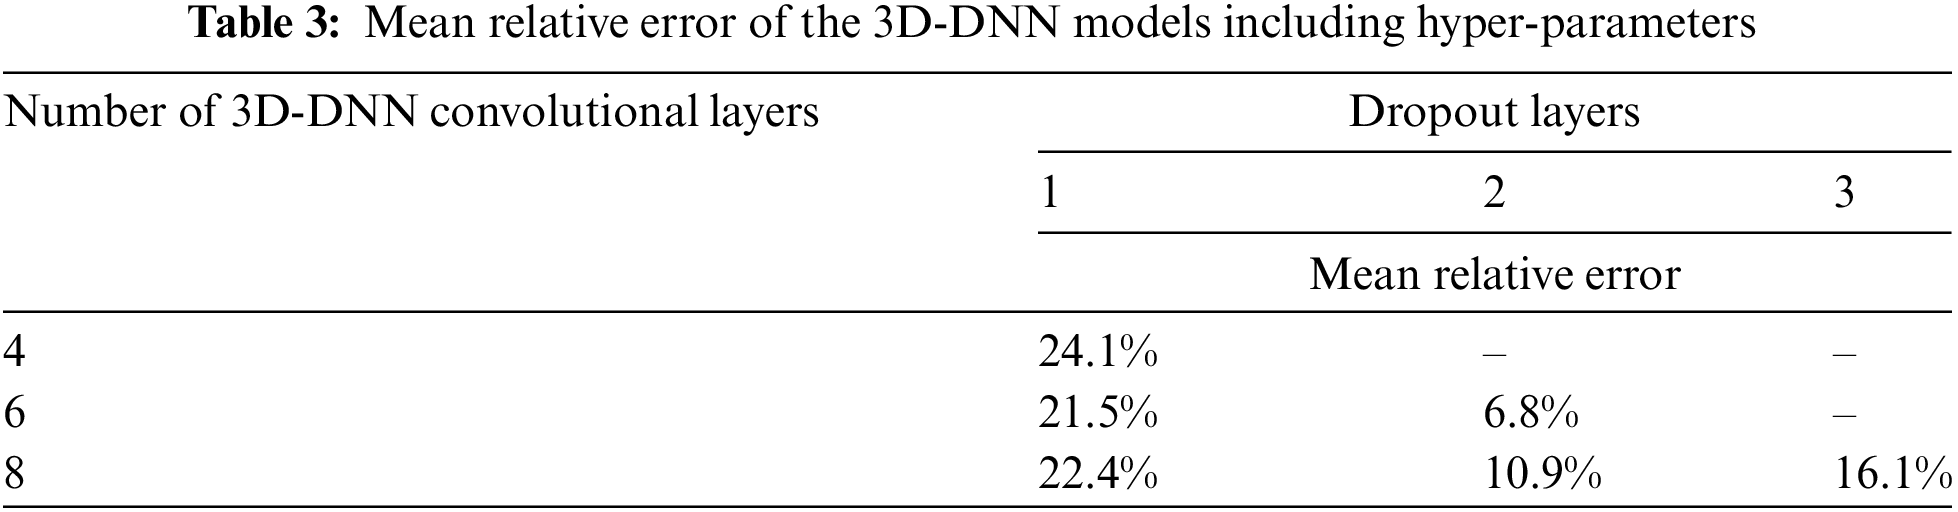
The relative error
The classification outputs, as depicted in Tab. 3, indicate that:
• Increasing the pooling dimension improves the accuracy.
• Arrangement of six 3D-DNN layers and two dropouts accomplishes the best outputs.
• This method accomplishes a low 9.8% mean error from the testing dataset.
After exhaustive model testing, the hyper-parameters are identified. The architecture of the 3D-DNN model is depicted in Tab. 4.

Validation of the 3D-DNN investigates the effective diffusion activity functions in the prediction of the 3D-DNN model and the CFD. A comparison is done including the effective diffusion activity functions for the testing samples with vacancies of sizes of 0.42 to 0.81 as predicted via the 3D-DNN, the CFD process, and the experimental mathematics proposed in [39] and other models presented in [40–42]. The effective diffusivity of vacancy defect substance grows linearly with the growth in defect. This depicts that a high defect size will donate to diffusion in vacancy defect substance. The training dataset has structures with vacancies of sizes of 0.45 and 0.61. The 3D-DNN attains a mean error of 0.031% to 7.75% for substances with vacancies of sizes ranging from 0.41 to 0.78 when compared to CFD. Nevertheless, the results obtained by the authors in [42] and [33] have weighty deviations when compared with CFD. This is due to the design of the vacancy defect substance with specific geometry. To obtain higher prediction, these models need to train new structures. Though, the 3D-DNN does not face these challenges as the 3D-DNN is trained using geometric features of vacancy defect substance (i.e., 12280 smaller structures mined using magnification process), and has the robust predicting power for unknown testing data.
Our proposed model has prediction results similar to the ground truth of the labelled samples on the x-axis. CFD algorithm performs well although inferior to the 3D-DNN model but outperforms both models in [41] and [42]. The time cost is an important performance metric for deep learning model. To prove the efficiency of our proposed model, we compared the times required by the CFD model and the training phase and testing phase of our model. The experimental results for the defect NiCrAlY structure with a vacancy size of 0.5 is depicted in Tab. 5. It illustrates that the 3D-DNN model need 14.2 ×10⁻² h for the training phase, while the CFD needs 15.16 h. This infers that 3D-DNN model is faster by two orders of magnitude than the CFD. In the prediction time the 3D-DNN model will require half the time required by the CFD model.

4.2 Energy Classification for NiCrAlY and Graphene
When the learning process is finished, the validation subset is used now as an input to the D-CNN to classify the energy value of the vacancy two dimensional substance. The energy of a Tungsten particle is computed according to the vacancy region size and the adjacent particles. For instance, if the defects are adjacent, then the Tungsten atoms will interact highly and will go through greater energy barrier in NiCrAlY (approximately 11.98 eV), it should be concluded that the energy barrier is stable with Carbon mono-vacancy defects. Di-mono-vacancy are molded at the borderline between the two cells with the di-mono-vacancy as depicted, owed to the periodic conditions suspense on the borders. Yet, its energy value is similar to the di-mono-vacancy in the same cell. The existence of the Boron and the Nitrogen atoms in Graphene layer yields double energy barriers for mono-vacancy, subject to the defects conditions. Clearly, there is an association among a particle and its adjacent ones. The pooling function extracts attributes of the elements in the cell matrix and their adjacent atoms. D-CNN identifies these associations and define the features of mono and di structures and link them to the output value during the validation.14000 data items are collected for each material for training and validation. It should be noted that the prediction output accuracy is the same to the energy barrier for both NiCrAlY and Graphene. We then computed the absolute error, coloration (C). These measures are computed from the testing subset to provide an independent performance metric of the of the D-CNN. As depicted in Tab. 6, the D-CNN provides a high performance for the NiCrAlY with 0.075 and 0.99 of mean absolute error, and C, respectively. Nevertheless, for the Graphene barrier, these measures are comparatively high. We point that a lesser prediction accuracy of the D-CNN for Graphene is noted. Graphene has double particles (Boron and Nitrogen), while NiCrAlY has a single atom (Carbon). The D-CNN performance can be enhanced by using bigger-sized supercell and also by increasing the dataset size to reduce overfitting and delivering more features in the input structure matrices. The Ground truth and predicted energy values for NiCrAlY and Graphene are depicted in Fig. 7.

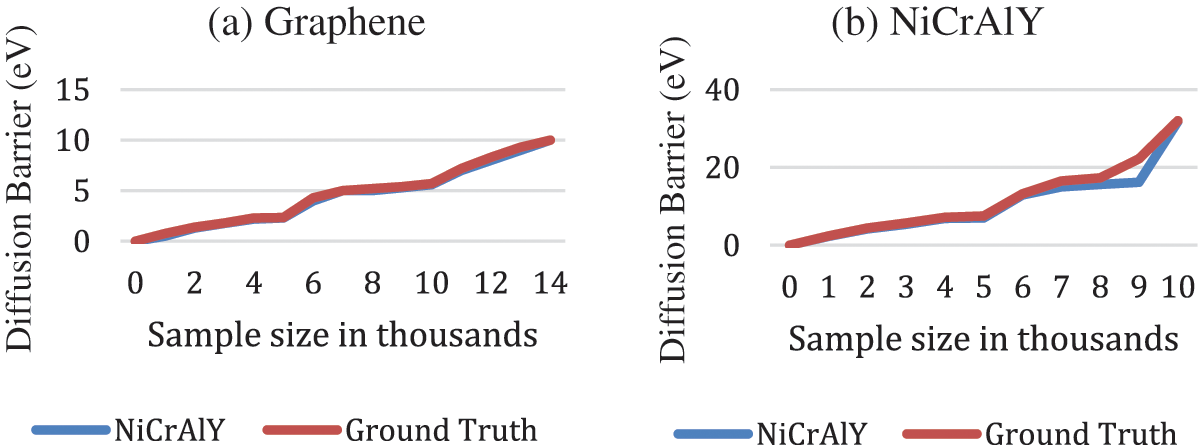
Figure 7: Ground truth and predicted energy values for (a) NiCrAlY and (b) Graphene
In this research, we proposed a deep learning model to predict the diffusivity of Tungsten atoms through NiCrAlY. We reconstructed the 3D NiCrAlY samples for the three dimensional D-CNN (3D-DNN) model training and testing sets. The NiCrAlY 3D structures are produced from 2D samples in different views. The effective diffusion activity functions are computed from energy barrier thickness values. The proposed model studied NiCrAlY as barrier for Tungsten atom diffusion. The Tungsten atom practices stronger barrier when overpass the di-vacancy porous of NiCrAlY structure. Hundreds of reproductions have been made to produce energy barriers of NiCrAlY. These datasets are utilized to reconstruct 3D substrate to perform learning and testing for our D3 CNN. Our model shows a high classification accuracy. Our trained deep learning neural model can predict the energy barrier of Tungsten diffusion through arbitrarily configured NiCrAlY barrier with accuracy greater than 98.4% in 5 × 5 cell. Prediction results generated directors on selecting barriers, and used machine training to calculate the performance. Also, the 3D-DNN model needed 14.2 × 10⁻² h for the training phase. The 3D-DNN model is proven to be faster by two orders of magnitude than state of the art models. The 3D-DNN model will require half prediction time as required by other compared models.
Acknowledgement: We would like to thank Princess Nourah bint Abdulrahman University Researchers Supporting Project number (PNURSP2022R120), Princess Nourah bint Abdulrahman University, Riyadh, Saudi Arabia.
Funding Statement: Princess Nourah bint Abdulrahman University Researchers Supporting Project number (PNURSP2022R120), Princess Nourah bint Abdulrahman University, Riyadh, Saudi Arabia.
Conflicts of Interest: The authors declare that they have no conflicts of interest to report regarding the present study.
References
1. R. Zhang, S. Ma, L. Shanahan, J. Munroe, S. Horn et al., “Automatic methods to extract hybridized graphene from matters,” in Proc. of the 2017 IEEE Int. Conf. on Bioinformatics and Biomedicine (BIBM), Kansas City, MO, USA, IEEE, pp. 1296–1299, 2017. [Google Scholar]
2. A. Hafez and S. Mamoud, “Deep learning methods in detecting hybridized Tungsten,” Journal of Information Systems, vol. 3, no. 7, pp. 25–30, 2012. [Google Scholar]
3. E. Keogh and A. Mueen, “Curse of dimensionality: Tungsten, the new era,” Journal of Machine Learning and Data Mining, vol. 2, no. 2, pp. 127–134, 2020. [Google Scholar]
4. A. Danelakis, T. Theoharis and D. Verganelakis, “Survey of automated hybridized Tungsten segmentation techniques on infrared imaging,” Computerized Imaging and Graphics, vol. 5, no. 3, pp. 439–442, 2020. [Google Scholar]
5. L. Chou and Z. Ahmt, “Performance analysis of machine learning classifiers for hybridized NiCrAlY,” Journal of Engineering and Technology, vol. 8, no. 1, pp. 23–28, 2020. [Google Scholar]
6. M.-S. Yang and Y. Nataliani, “A feature-reduction fuzzy clustering algorithm based on feature-weighted entropy,” IEEE Transactions on Fuzzy Systems, vol. 26, no. 2, pp. 817–835, 2021. [Google Scholar]
7. R. Chen, N. Sun, X. Chen, M. Yang and Q. Wu, “Supervised feature selection with a stratified feature weighting method,” IEEE Access, vol. 6, no. 1, pp. 15087–15098, 2018. [Google Scholar]
8. M. Imani and H. Ghassemian, “Feature extraction using weighted training samples,” IEEE Geoscience and Remote Sensing Letters, vol. 12, no. 7, pp. 1387–1391, 2015. [Google Scholar]
9. H. Liu and H. Motoda, Feature Extraction, Construction and Selection, Cham, Switzerland: Springer, 1998. [Google Scholar]
10. B. Dun, E. Wang and S. Majumder, “Hybridized graphene detection from hybrid data using ensemble learning,” IEEE Transactions on Fuzzy Systems, vol. 6, no. 1, pp. 817–835, 2019. [Google Scholar]
11. R. S. Singh, B. Saini and R. Sunkaria, “Detection of inorganic crystals in Tungsten by reduced features and extreme learning machine,” Chemistry Reports, vol. 91, no. 2, pp. 166–175, 2020. [Google Scholar]
12. C. Loizou, E. Kyriacou, I. Seimenis, M. Pantziaris, S. Petroudi et al., “Classification of inorganic crystals subjects for the prognosis of future diffusion,” Intelligent Decision Technologies, vol. 7, no. 1, pp. 3–10, 2021. [Google Scholar]
13. C. Loizou, V. Murray, M. Pattichis, I. Seimenis, M. Pantziaris et al., “Multiscale amplitude-modulation frequency-modulation (AM--FM) texture analysis of inorganic crystals,” IEEE Transactions on Information Technology, vol. 15, no. 1, pp. 119–129, 2020. [Google Scholar]
14. R. Rajagopal and V. Ranganathan, “Evaluation of effect of unsupervised dimensionality reduction techniques on automated inorganic crystals classification,” Signal Processing and Control, vol. 4, no. 1, pp. 112–118, 2019. [Google Scholar]
15. D. Zhang, L. Zou, X. Zhou and F. He, “Integrating feature selection and feature extraction methods with deep learning to predict inorganic crystals,” IEEE Access, vol. 6, no. 1, pp. 28936–28944, 2018. [Google Scholar]
16. S. Negi, Y. Kumar and V. M. Mishra, “Feature extraction and classification for diffusion patterns using linear discriminant analysis,” in Proc. of the 2016 2nd Int. Conf. on Advances in Computing, Communication, & Automation (ICACCA) (Fall), Bareilly, India, IEEE, 2019. [Google Scholar]
17. D. Valencia, F. Tabares, D. Medina, I. Llorente and G. Dominguez, “TFR-based feature extraction using PCA approaches for discrimination of diffusion patterns,” in Proc. of the 2019 Annual Int. Conf. of the IEEE Engineering Society, Minneapolis, MN, USA, IEEE, pp. 5665–5668, 2019. [Google Scholar]
18. UCI Machine Learning Repository, “Diffusion patterns data set,” 2020. [Online]. Available: http://archive.ics.uci.edu/ml/datasets/. [Google Scholar]
19. R. Williams, T. Shongwe, A. N. Hasan and V. Rameshar, “Diffusion patterns prediction using machine learning techniques,” in Proc. Int. Conf. on Data Analytics for Business and Industry (ICDABI), Paris, France, pp. 118–123, 2021. [Google Scholar]
20. M. Khan, Q. Yaseen, A. Mumtaz, A. Saleem, S. Ishaq et al., “Severe Analysis of diffusion patterns detection using artificial intelligence,” in Proc. 2020 IEEE Int. Conf. for Innovation in Technology (INOCON), Cairo, Egypt, pp. 1–8, 2020. [Google Scholar]
21. S. Khan and S. Quadri, “Prediction of diffusion patterns status using rule based data mining techniques,” Chemsitry Forum—An International Journal, vol. 8, no. 2, pp. 103–107, 2020. [Google Scholar]
22. S. Kumar, “Predicting and detecting of diffusion patterns using machine learning algorithms,” International Journal of Engineering and Computer Science, vol. 6, no. 6, pp. 2319–7242, 2020. [Google Scholar]
23. R. Das, I. Turkoglu and A. Sengur, “Effective detection of Tungsten diffusion through neural networks ensembles,” Expert Systems with Applications, vol. 36, no. 4, pp. 7675–7680, 2019. [Google Scholar]
24. K. Srinivas, G. Raghavendra Rao and A. Govardhan, “Analysis of Tungsten diffusion in coal mining regions using data mining techniques,” in Proc. of 2020 5th Int. Conf. on Computer Science & Education, Hefei, China, IEEE, pp. 1344–1349, 2020. [Google Scholar]
25. N. Amma, “Tungsten diffusion prediction system using genetic algorithm and neural network,” in Proc. of the Int. Conf. on Computing, Communication and Applications, Dindigul, India, IEEE, 2020. [Google Scholar]
26. T. Santhanam and E. P. Ephzibah, “Tungsten diffusion classification using PCA and feed forward neural networks,” Mining Intelligence and Knowledge Exploration, Springer, vol. 2, no. 1, pp. 124–132, 2020. [Google Scholar]
27. A. Gárate-Escamila, A. Hassani and E. Andrès, “Classification models for Tungsten diffusion: Prediction using feature selection and PCA,” Informatics Reports, vol. 19, no. 1, pp. 234–242, 2020. [Google Scholar]
28. P. Ramprakash, R. Sarumathi, R. Mowriya and S. Nithyavishnupriya, “Tungsten diffusion prediction using deep neural network,” in Proc. of the 2020 Int. Conf. on Inventive Computation Technologies (ICICT), Coimbatore, India, pp. 666–670, 2020. [Google Scholar]
29. B. Aman Kanksha, P. Sagar, M. Rahul and K. Aditya, “An intelligent unsupervised technique for Tungsten diffusion in hard metals,” Intelligent Decision Technologies, vol. 15, no. 1, pp. 127–139, 2021. [Google Scholar]
30. K. Divya, A. Sirohi, S. Pande and R. Malik, “An IoMT assisted Tungsten diffusion prediction system using machine learning techniques,” Cognitive Internet of Things for Smart Chemistry, vol. 3, no. 1, pp. 145–161, 2021. [Google Scholar]
31. H. Morita, T. Sakai and M. Okumura, “Query Pnowball: A co-occurrence-based approach to Tungsten diffusion classification,” Information Media Technology, vol. 7, no. 3, pp. 1124–1129, 2021. [Google Scholar]
32. D. Patel, S. Shah and H. Chhinkaniwala, “Fuzzy logic based Tungsten diffusion classification with improved redundancy removal technique,” Expert Systems Applications, vol. 194, pp. 187–197, 2019. [Google Scholar]
33. M. Safaya, A. Abdullatif and D. Yuret, “Tungsten diffusion identification in porous media,” Expert Systems, vol. 4, no. 3, pp. 167–178, 2020. [Google Scholar]
34. W. Antoun, F. Baly and H. Hajj, “ArabADAN: Transformer-based model for Tungsten diffusion deep learning prediction,” Information Technology, vol. 4, no. 3, pp. 124–132, 2020. [Google Scholar]
35. M. Fattah and F. Ren, “GA MR FFNN PNN and GMM based models for automatic Tungsten diffusion classification,” Computers, vol. 23, no. 1, pp. 126–144, 2021. [Google Scholar]
36. A. Qaroush, I. Farha, W. Ghanem and E. Maali, “An efficient Tungsten diffusion classification using a combination of statistical and deep features,” Knowledge-Based Systems, vol. 7, no. 2, pp. 173–186, 2019. [Google Scholar]
37. V. Gupta and G. Lehal, “A survey of Tungsten and other metals diffusion techniques,” Journal Emerging Technology, vol. 2, no. 3, pp. 258–268, 2020. [Google Scholar]
38. I. Keskes, “Discourse analysis of Tungsten diffusion and application to automatic classification,” Algorithms, vol. 12, no. 3, pp. 187–198, 2019. [Google Scholar]
39. X. Cai, W. Li and R. Zhang, “Enhancing diversity Tungsten diffusion through subspace clustering and clustering-based optimization,” Information Science, vol. 2, no. 3, pp. 764–775, 2021. [Google Scholar]
40. W. Luo, F. Zhuang, Q. He and Z. Shi, “Exploiting relevance coverage and novelty for Tungsten diffusion classification,” Knowledge-Based Systems, vol. 1, no. 1, pp. 33–42, 2019. [Google Scholar]
41. A. Zhou, B. Qu, H. Li and Q. Zhang, “Multiobjective evolutionary algorithms: A survey of the state of the art,” Swarm Evolutionary. Computation, vol. 1, no. 1, pp. 32–49, 2020. [Google Scholar]
42. M. Sanchez, M. Rodríguez and C. Pérez, “Tungsten diffusion classification using a multi-objective artificial bee colony optimization approach,” Knowledge-Based Systems, vol. 1, no. 1, pp. 1–8, 2020. [Google Scholar]
 | This work is licensed under a Creative Commons Attribution 4.0 International License, which permits unrestricted use, distribution, and reproduction in any medium, provided the original work is properly cited. |