| Computer Modeling in Engineering & Sciences |
DOI: 10.32604/cmes.2021.016696
ARTICLE
Using Sieve of Eratosthenes for the Factor Analysis of Neutrosophic Form of the Five Facet Mindfulness Questionnaire as an Alternative Confirmatory Factor Analysis
1Igdır University, Campus, Igdır, 76000, Turkey
2Department of Mathematics, Arts and Sciences Faculty, Bitlis Eren University, Bitlis, Turkey
3Department of Mathematics, University of New Mexico, Gallup, 87301, NM, USA
4Laboratory of Information Processing, Faculty of Science Ben M'Sik, University Hassan II, Casablanca, Morocco
*Corresponding Author: Selçuk Topal. Email: s.topal@beu.edu.tr
Received: 17 March 2021; Accepted: 08 July 2021
Abstract: In this study, the Five Facet Mindfulness Questionnaire which was adapted from the short form of the Five Facet Mindfulness Questionnaire was evaluated and this scale into neutrosophic form was converted and the results of the scale were compared for proposing new type confirmatory analysis procedure as well as developing neutrosophic scales. The exploratory factor analysis was used in the analysis of the data. Besides, test results were analyzed for Kaiser–Meyer–Olkin and Bartlett values, common factor variance values, scree plot graphs, and the principal component analysis results. The sample of the study consists of 194 students in mathematics departments at Bitlis Eren University and Iğdır University in Turkey by convenience sampling method. A convenience sampling is a kind of non-probability sampling procedure in which the sample is obtained from a group of individuals easily accessible or reachable. The convenience sampling method was chosen in this study because the study aims to examine the structure of the measurement tool rather than the psychological characteristics of a particular population. First of all, it is observed that if any classical scale can be converted into a neutrosophic one. It is observed that the sub-dimensions of a neutrosophic scale as agree, disagree, and undecided might not have a similar factor structure to the classical one. Interestingly, in the factor analysis of the neutrosophic scale, both classical and the agreement part of the neutrosophic scales have the same factors, implying that the one-dimensional classical scale measures the agreement degree of the participants. When the factor analysis was conducted to disagreement and vagueness dimensions, it seemed that some factors were eliminated and even some new factors emerged, indicating that in human cognition those three dimensions can be taken as independent of each other, just as assumed by neutrosophic logic. The another important implication of the factor analysis is that the neutrosophic forms of any questionnaire can be used for the validity of the classical ones. Loads of items or their accumulation into factors are compared to the classical scale and the three-dimensional neutrosophic scale in the factor, so that the corresponding ones in the same factors and the items or factors that do not correspond to each other are eliminated. It is very similar to the Sieve of Eratosthenes, which is an ancient algorithm for finding prime numbers up to any given limit where each prime is taken as an independent base or dimension and multiples of the selected primes in a given interval are eliminated until there are only prime numbers left. Finally, the reliability of three independent dimensions of the neutrosophic forms of any questionnaire can also be used to check whether the measurement tool is reliable. Low-reliability results in any dimensions may imply that the scale has some problems in terms of meaning, language, or other factors.
Keywords: Neutrosophic scales; factor analysis; scale development; explanatory analysis; reliability analysis
Neutrosopy is all about looking at the world with fresh eyes, and then tailoring the perspective to account for uncertainty. Neutrosophy offers a third logic alternative to the binary model of true or false, which goes by the name of neutrals. In summary, Neutrosophy replaces the binary method in logics by offering indeterminancy, which may also be interpreted as ambiguous, uncertain, or inconsistent. Neutrosophy was conceptualized by Smarandache et al. [1] in 1988, and development since then has rapidly grown with the use of logical extensions, such as measure, sets, graphs, and even practical applications in various areas. The field of neutrosophy has shown its power and effectiveness in a variety of contexts. This created a big backlog of contributions which were theoretical in nature and confirmed only using mathematical examples or restricted data sets. Neutrosophic logic could be used in both natural science and social science, and recently publications have been emphasized the use of the neutrosophic logic in social sciences. Neutrosophic sets are better than fuzzy sets for surveys because they provide a wider range of answers. Through its membership indeterminacy function, the former allows respondents to more clearly articulate their actual thoughts and feelings. Neutrosophy is beneficial to those who want to express themselves since it better captures their thoughts and emotions due to its embrace of indeterminacy and independent membership function of falsehood. Therefore the study’s primary goal is to use the principles of neutrosophy in social sciences, particularly in education and assessment and evaluation techniques of scale development [2–4].
The main purpose of the survey or scale development is to gather accurate and relevant data. In social sciences, the reliability and validity of scale and questionnaire formats are, therefore, used to enable to gather accurate and relevant data [5]. The data space and data range in this respect are essential parameters for developing scales since they often alter the data type, logical analytical space, methods, validity and reliability of the findings (Fig. 1).
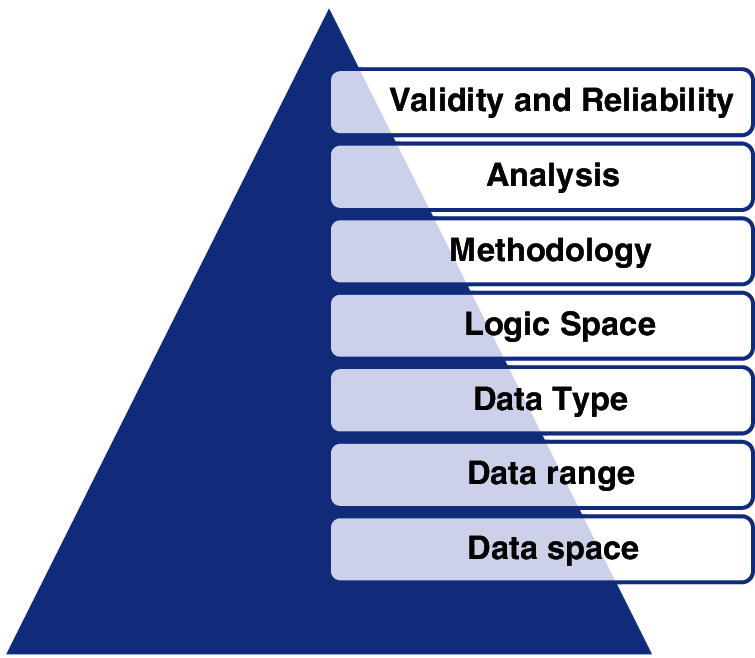
Figure 1: Data space and data range determines the validity and reliability of any scale
For measurement instruments such as scales, data space refers to an independent collection of choices for a particular measurement item. For example, there is only one choice in every Likert-type scale that the individual may express his/her ideas or feelings and its data space is 1d, but there are three different dimensions about each aspect in the neutrosophic scale as undecided, agreeable, and disagreeable. The data space is 1d for any form of Likert type scale a whereas 3d for neutrosophic space. Such a extension can be done for more dimensions. For instance, the more qualitative-oriented measurement tools like providing items that require more free opinions in a paragraph like preferences are supposed to have more dimensions as well. Though n-dimensional space is more suitable for clearer and more accurate outcomes, the representation of the data in less dimensional spaces can easily be statistically analyzed. Besides, the measurement tool’s objectivity in terms of estimation of common features decreases as the dimension of space rises. The benefit of the 3-dimensional neutrosophic scale is that the participants are both involved in the degree of agreement, disagreement, and uncertainty. The difference among classical logic, fuzzy logic and neurosophic logic can be describes as in Fig. 2. In the classical logic the space is in 0 dimension where there is only discrete points as 0 and 1. In the fuzzy logic the spaces can be represented as 1 dimensional continuum or segment where there is a continuous possible admixture of the states of 0 and 1. Finally, in the Fuzzy logic there are three independent states constituting 3 dimensional logic space.
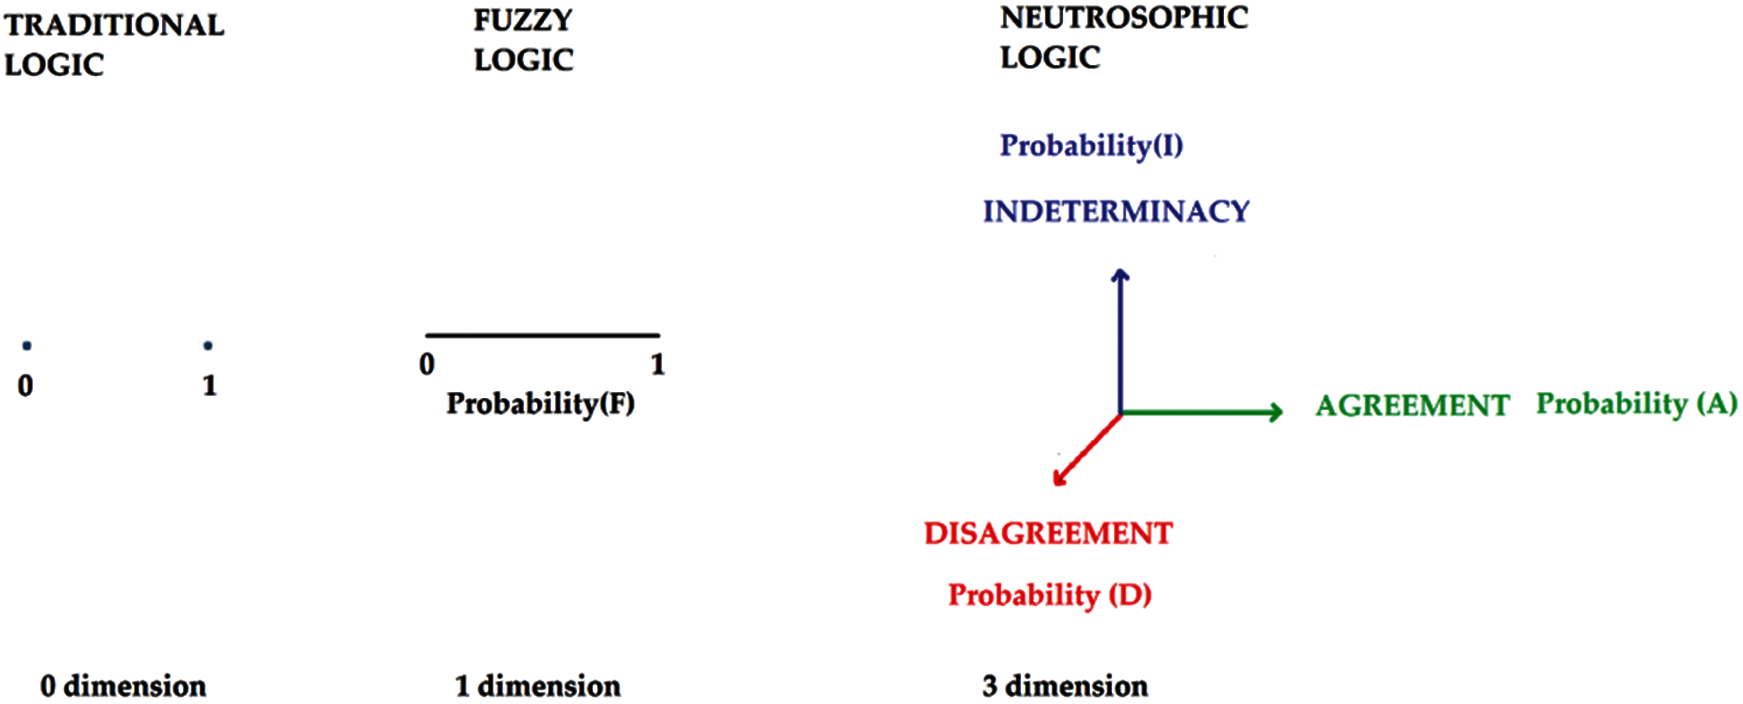
Figure 2: The difference difference among classical logic, fuzzy logic and neurosophic logic
It should be noted that there is no study focusing on 2d data space in the literature because the possible combinations of the agreement, disagreement and intederminacy in the forms of two independent states such as (a, d), (a, i), (d, i). Such a 2d data space is very limited because it disregards indeterminany, agreement, disagreement dimesions. For instance if 2d scale having agreement, disagreement dimesions firstly ignore the indeterminancy dimension. Secondly, sometimes agreement, disagreement dimesions are complement to each other as in the case od classical logic or fuzzy logic but the indeterminancy is important for the analysis. Such an example can be extended into the all possible combinations of (a, d), (a, i), (d, i). The degree of freedom of 2d space may dismiss the other two parameters that cannot be ignored in the actual case. These hidden variables can lead to huge differences especially in the case of the analysis of the options of a huge number of participants and even this cannot be realized (Fig. 3).
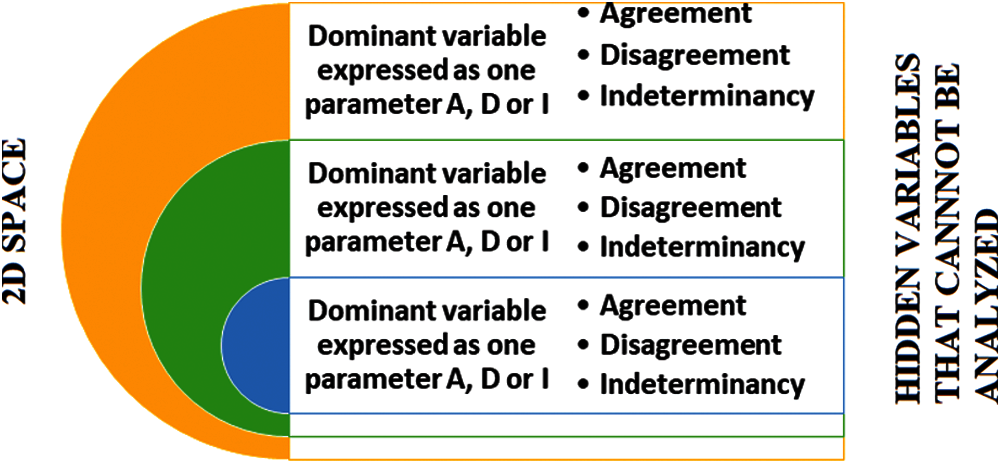
Figure 3: The degree of freedom of 2d space may dismiss the other two parameters that cannot be ignored in the actual case
However, in neutrosophic logic, it is impossible to dismiss three parameters since the researchers must give their opinions on them (Fig. 4).
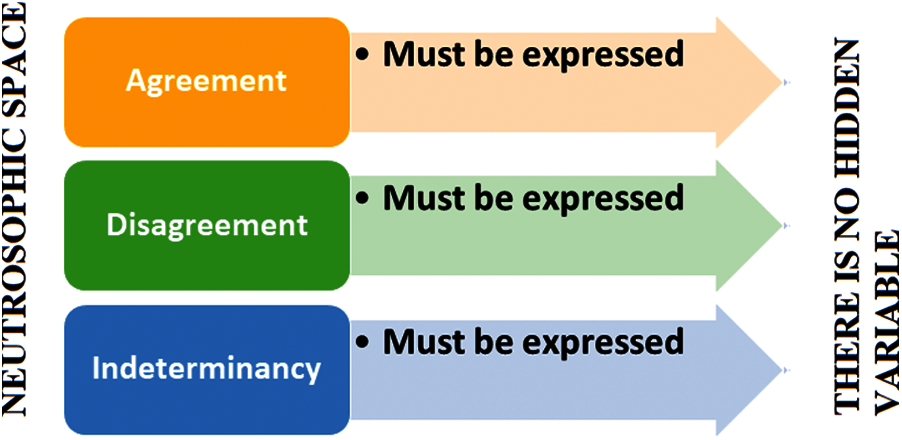
Figure 4: In neutrosophic logic, it is impossible to dismiss three parameters since the researchers must give their opinions on them
In everyday life, humans are not confined within one dimension space in terms of the expressions of the agreement, disagreement and interdeterminancy dimensions. Neutrosophic logic is more compatible with this fact since the participants express in the three-dimensional neutrosophic space both their agreement and their contradictions and the ambiguity of the items or scale parameters. We often believe that a sentence is understood, but one term in the statement leaves us unsure if it is the ‘right message’ the source intends. We often approve of such proposals, but we sometimes disagree with the item only because of the source of the message itself. The neutrosophic scale is therefore distinct in terms of data space from the classical Likert scale (Fig. 5).
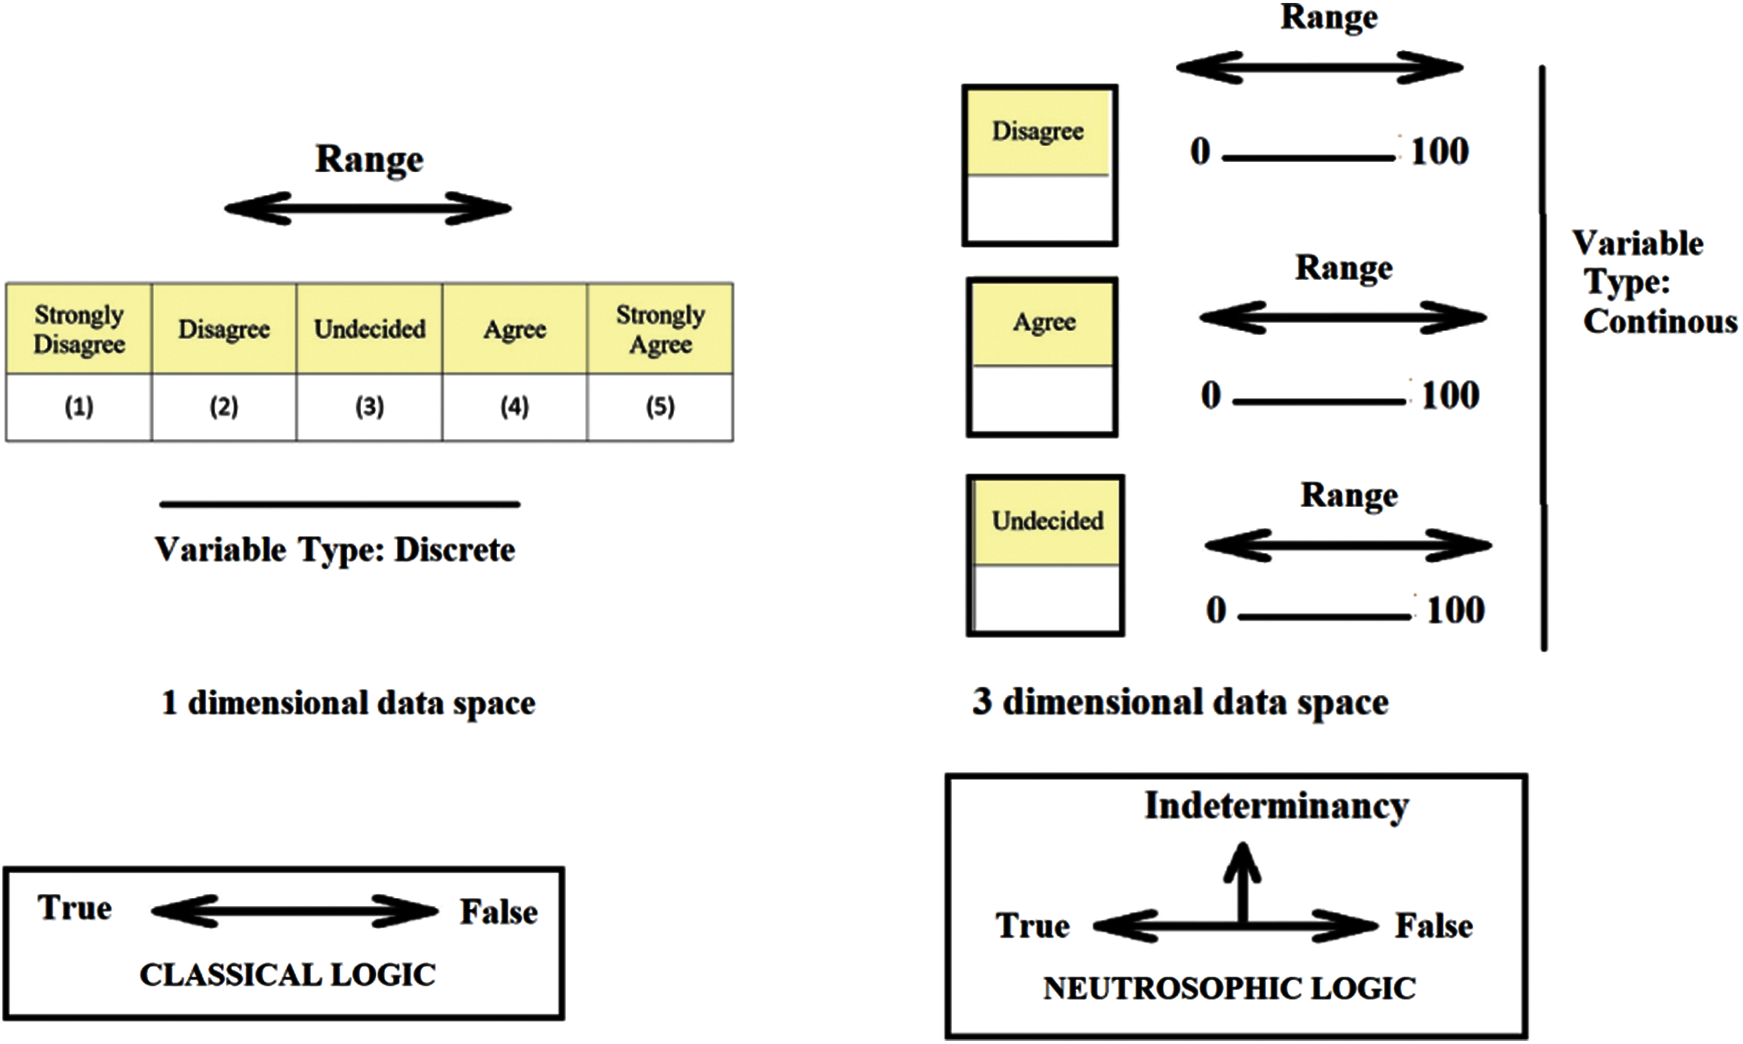
Figure 5: Data space of classical Likert type scale, neutrosophic scale
The second main point that differentiates between measuring tools is the range of the data that every scale is dependent on. The range of the data set is the difference from the highest value to the lowest value in any setting. Data may well be organized from 3 points in Likert form to 10 points on the Likert-type scale. The neutrosophic scale is, however, broader than the scales of such a Likert kind measurement tool. It contains all numbers ranging from 0 to 100. There are therefore continuous variable forms of neutrosophic scales, while Likert scales have discrete values in terms of rational numbers such that the data processing can differ. In this sense, this will help increase the sensitivity of the measuring instrument. This is actually what is called as neutrosophic Data in some recent researches is the piece of information that contains some indeterminacy. Similar to the classical statistics, it can be classified as [4]:
– Discrete neutrosophic data, if the values are isolated points.
– Continuous neutrosophic data, if the values form one or more intervals.
– Quantitative (numerical) neutrosophic data; for example: a number in the interval [6,7] (we do not know exactly), 47, 52, 67 or 69 (we do not know exactly);
– Qualitative (categorical) neutrosophic data; for example: blue or red (we do not know exactly), white, black or green or yellow (not knowing exactly).
– The univariate neutrosophic data is a neutrosophic data that consists of observations on a neutrosophic single attribute.
The logic space of a measuring instrument is the third essential point. Logic space is important because “in any field of knowledge, each structure is composed from two parts: a space, and a set of axioms (or laws) acting (governing) on it. If the space, or at least one of its axioms (laws), has some indeterminacy of the form (t, i, f) ≠ (1, 0, 0), that structure is a (t, i, f)-Neutrosophic Structure” [6]. The logic we are focused on, Neutrosophic Logic [7], is an emergent field where the percentage (percentage) of truth in a T subset, the percentage of indeterminacy in an I subset, and the proportion of falsity in an F subset are listed. We here consider a subset of truth (or falsity or indeterminacy), rather than just a number, since in many situations we can not precisely determine the proportions of truth and falsity but we can only approach them. For example, suppose that a statement (or proposition) is between 22% and 43% true and 51% to 82% false; indeterminancy (undecided): 32% to 39% or 40% to 52% true (according to various observers) and 57% or 62% to 71% false. The subsets are not simple intervals but are arranged in line with the proposition (open or closed or semi-open/semi-closed intervals, isolated, constant, or intersected or united by previous sets, etc.). On the other hand, there are many ways to evaluate and interpret data. Some recent studies reveal important developments based on the interpretation and effective use of data [8,9].
Although in Likert-type scales, there are mostly three options as agreement, disagreement, and vagueness, classical logic is located one valued option located on the opposite sides of true and false values. The neutrosophic set has three independent components, giving more freedom for analysis so that it brings different logical operations as well. Therefore, the methodology of the analysis of the data should be changed based on the logical structure of the scale. For instance, while factor analysis is used for classical Likert-type scales, as shown in this paper, we can not directly assume that all the sub-dimensions of any neutrosophic scale directly correspond to the factor structure of the classical one. Nevertheless, it should be noted that classical analysis and methods can indeed be used for neutrosophic scales based on different analysis procedures. Hence, we can conclude that the validity and reliability of the measurement tools can change based on the logical structure of the scale. Therefore, in this study, the Five Facet Mindfulness Questionnaire which was adapted by [10] from the short form of the Five Facet Mindfulness Questionnaire (FFMQ) was evaluated and this scale into neutrosophic form was converted and the results of the scale were compared for proposing new type confirmatory analysis procedure as well as developing neutrosophic scales.
2.1 Procedure for the Analysis of the Neutrosophic Form of the Five Facet Mindfulness Questionnaire
Firstly, it is thought that a valid and reliable scale should be chosen that has appropriate psychometric properties such as its adequacy, relevance, and usefulness since we see the characteristics of the neutrosophic scale in the reliable and valid foundations. Otherwise, we must do the reliability and validity analysis for the neutrosophic scale, but we want to check our method based on a more solid context since there is not so much research on this subject. The exploratory factor analysis includes the determination and clustering of objects by researchers to measure the same characteristic and offers insights into the reliability of objects and the test [11].
2.1.1 Kaiser–Meyer–Olkin (KMO) and Bartlett Tests
This method determines the proportion of the total variation in given variables that is most likely to be caused by latent factors. If values are very close to 1.0, then one may benefit from doing a factor analysis on the data. The findings of the factor analysis are unlikely to be particularly relevant if the value is less than 0.50. To test the hypothesis that the correlation matrix is an identity matrix, Bartlett’s test can be used. Component component analysis is usually quite effective when one has small values at the significance level (less than 0.05) [12]. Therefore the test results were analyzed for KMO and Bartlett values, common factor variance values, scree plot graphs, and the principal component analysis results. KMO and Bartlett tests also examined the adequacy of the scale for factor analysis. The KMO measure of sample adequacy is a test of how much variation can be explained by factors inside the data. A KMO value of 0.5 is poor as a measure of its factorability; 0.6 is acceptable; a value nearer to 1 is better [13]. The fact that the value of the ratio exceeds 0.80 suggests that the results are positive for factor analysis [13,14]. Bartlett’s test reveals that the data is likely to be factorable if p < 0.05, but it is called a sensitive test, but it is best to use it the other way round: if p > 0.05, do not continue; however, if p > 0.05, review other factorability metrics before proceeding [13]. The higher correlation between the factors suggests that the model was developed correctly and that the model’s hypotheses may also be evaluated. This illustrates the explained variance rate observed by the factor scale study. The variance explanation rate should be at least 50% [15].
In the Factor Analysis [13]: extraction dialog box, the graph generated by the Scree-Plot option may be used to determine which components should be removed as an alternative to eigenvalues >1.0. In factor analysis, the number of factors was decided by Eigenvalues statistics and Scree test (Line chart). Expressions greater than 1 in the eigenvalue statistics are accepted. The scree diagram shows the point at which the curve slope declines and flattens and the corresponding amount of the factor is determined [16]. The direct oblique rotation technique was used in the factor study. The Cronbach alpha reliability coefficient has been examined for the reliability of any scale. Cronbach alpha is a metric used to predict the stability of the inner consistency of the scale. When the internal coefficient of Cronbach alpha consistency is 0.70 and beyond, it can be said that the scale has adequate internal consistency [11,17,18].
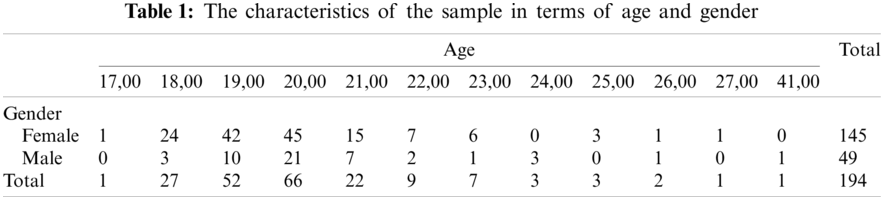
The sample of the study consists of 194 students in various departments at Bitlis Eren University and Iğdır University in Turkey by convenience sampling method. A convenience sampling is a kind of non-probability sampling procedure in which the sample is obtained from a group of individuals easily accessible or reachable. The convenience sampling method was chosen in this study because the study aims to examine the structure of the measurement tool rather than the psychological characteristics of a particular population (Tab. 1).
3.1 Factor Analysis for Agreement Dimension
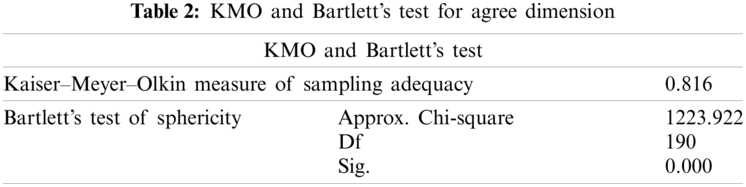
Before doing to assess the suitability of the data for the factor analysis, two methodological measures are used. KMO and Bartlett’s test are used for this [11]. Both are spherical tests. The KMO coefficient determines if the sample size for factor analysis is appropriate. The KMO value should be at least 0.60 and above if the sample size is sufficient; the Barlett test should also be important (p < 0.05) [18]. KMO and Bartlett’s test for agree dimension shows that data is suitable for the data to the factor analysis (KMO = 0.816, p < 0.05) (Tab. 2).
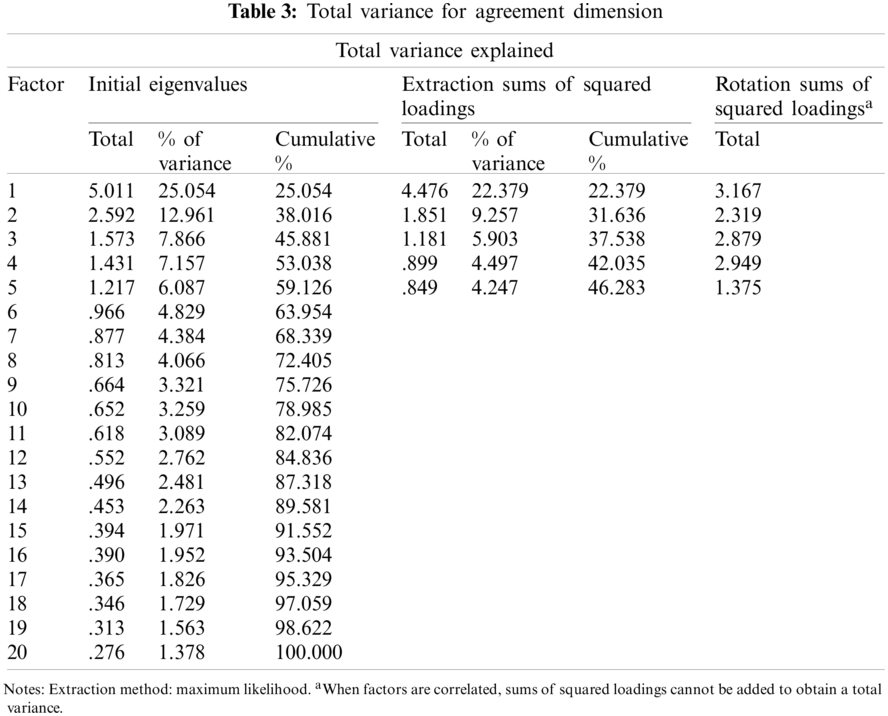
After assessing if the data was appropriate for factor analysis, the data are evaluated for an exploratory factor to evaluate the factor structure in the scale. The first analysis showed that five factors had an eigenvalue of 1 and higher, which explains the total variance of 46,283 points as given in Tab. 3.
The Scree plot was also examined to determine how many factors the scale consists of. The Scree plot is given in Fig. 6. The scree plot in Fig. 6 indicates that after the fifth point, the breaks are diminished and the chart is continued horizontally.
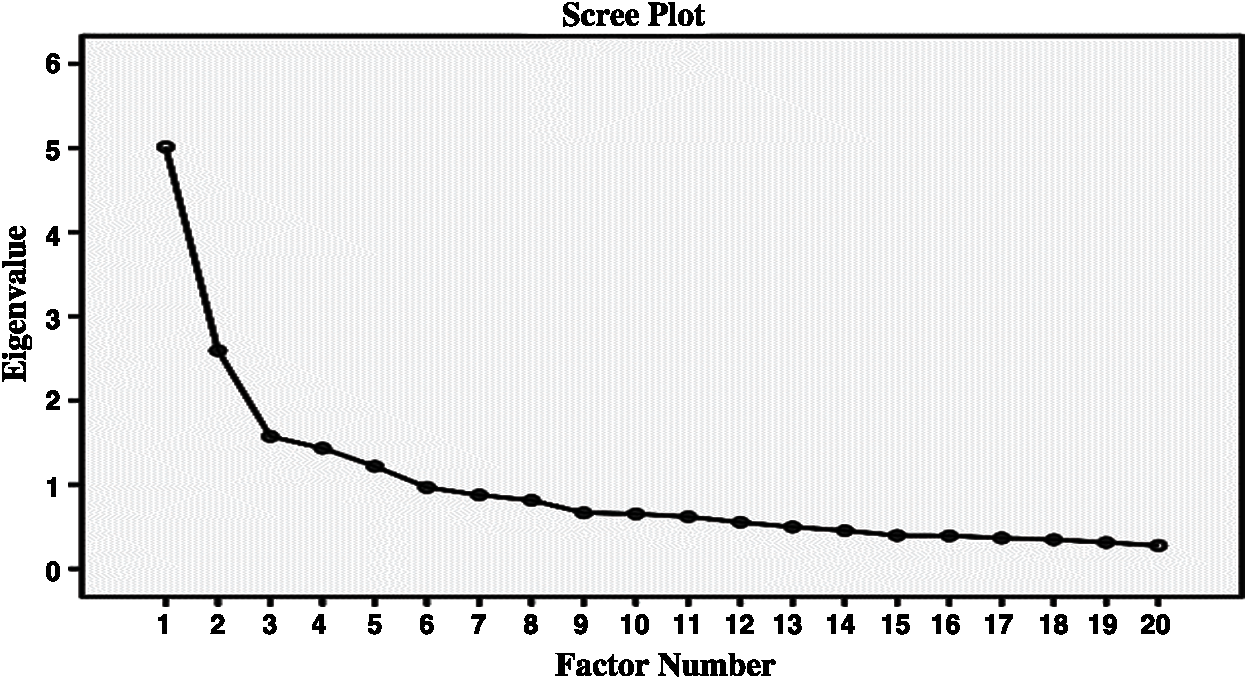
Figure 6: Scree plot for agreement dimension
The research was then carried out using the direct oblique rotation method. The data then proceeded. Researchers use the oblique rotation technique since the relations between factors exist [11,19]. In this analysis, the direct oblique rotation approach was chosen because the variables may be related. After rotation, no items were deleted from the scale with a factor load value of under 0.30 and overlaps of more than one factor. Then items used in the measuring scale with the same feature with a high factor load were held inside the scale. It is observed that no item with a load with a low factor was excluded. As a consequence of the analysis, five factors were taken into account for the remaining 20 items on the scale (Tab. 4).
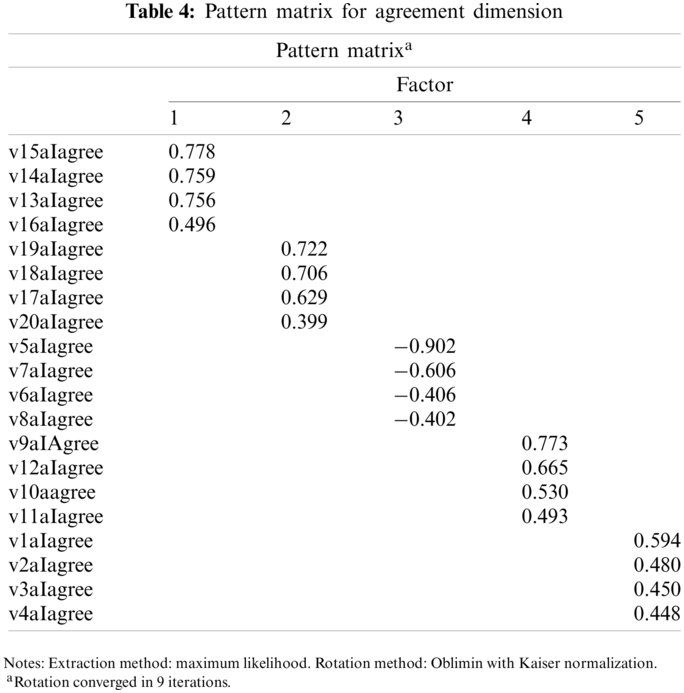
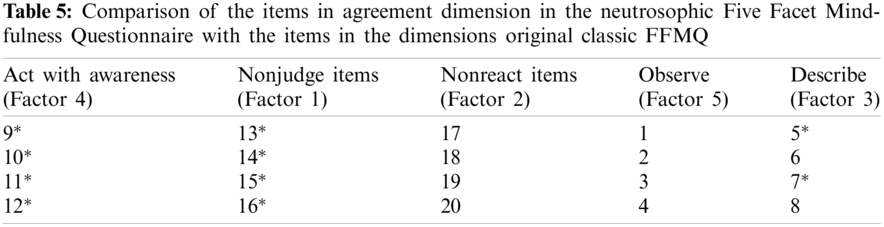
When the factor structure for agreement dimension is compared to the original classic Five Facet Mindfulness Questionnaire (FFMQ), it is observed that all items are directly correlated with the same dimensions of the original classic FFMQ (Tab. 5).
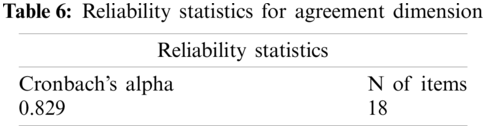
Reliability statistics show that the structure and assessment are highly reliable since reliability refers not only to the instrument itself but also to assessments obtained with a measurement tool [20–22] (Tab. 6).
3.2 Factor Analysis for Disagreement Dimension
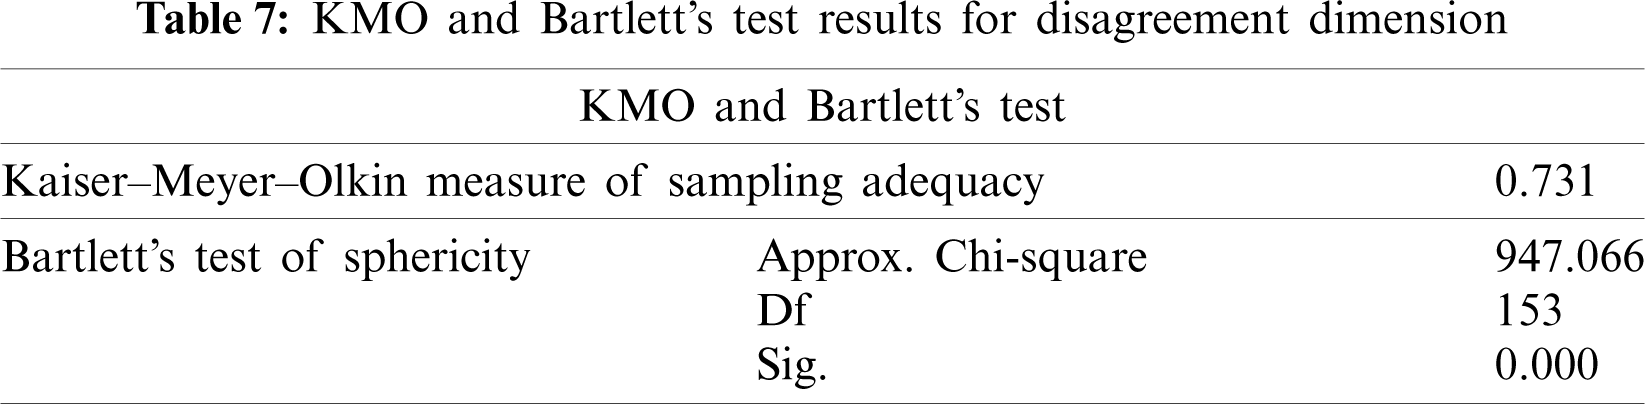
KMO and Bartlett’s test for disagreement dimension shows that data is suitable for data factor analysis (KMO = 740, p < 0.05). After assessing if the data was appropriate for factor analysis, the data are evaluated for an exploratory factor to evaluate the factor structure in the scale. The first analysis showed that five factors had an eigenvalue of 1 and higher, which explains the total variance of 45,221. The research was then carried out using the direct oblique rotation method. After rotation, one item (Item 1) was deleted from the scale since it overlaps with more than one factor because it overlaps with Factor 1 and factor four having similar factor loads as given 0.327 and 0.356. Then items used in the measuring scale with the same feature with a high factor load were held inside the scale and those with a load with a low factor were excluded. KMO and Bartlett’s test for disagreement dimension shows that data is suitable for data factor analysis (KMO = 0.731, p < 0.05) (Tab. 7).
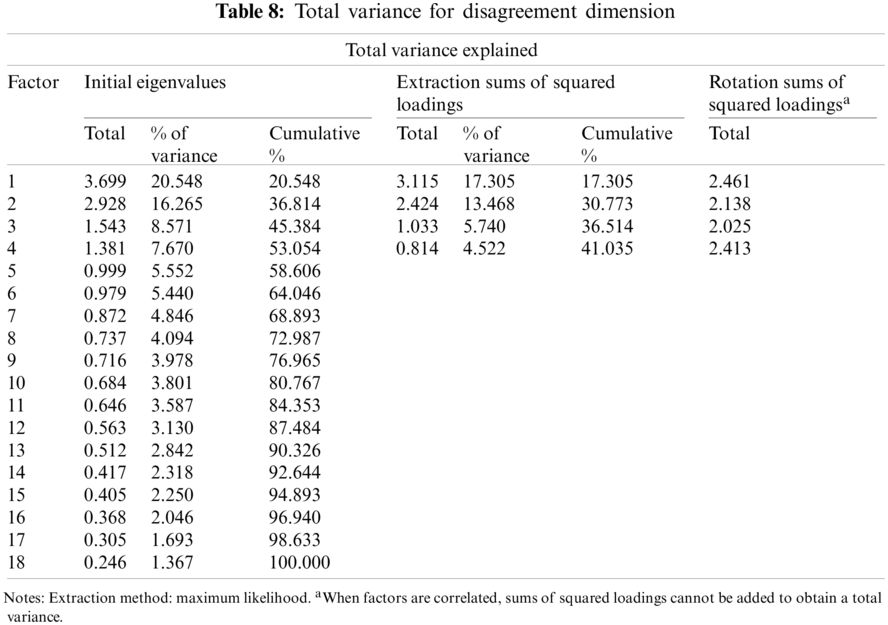
After assessing if the data was appropriate for factor analysis, the data are evaluated for an exploratory factor to evaluate the factor structure in the scale. The first analysis showed that four factors had an eigenvalue of 1 and higher, which explains the total variance of 41.035 points as given in Tab. 8.
Scree plot was also examined in order to determine how many factors the scale consists of. Scree plot is given in Fig. 7. The scree pilot in Fig. 7 indicates that after the fourth point, the breaks are diminished and the chart is continued horizontally.
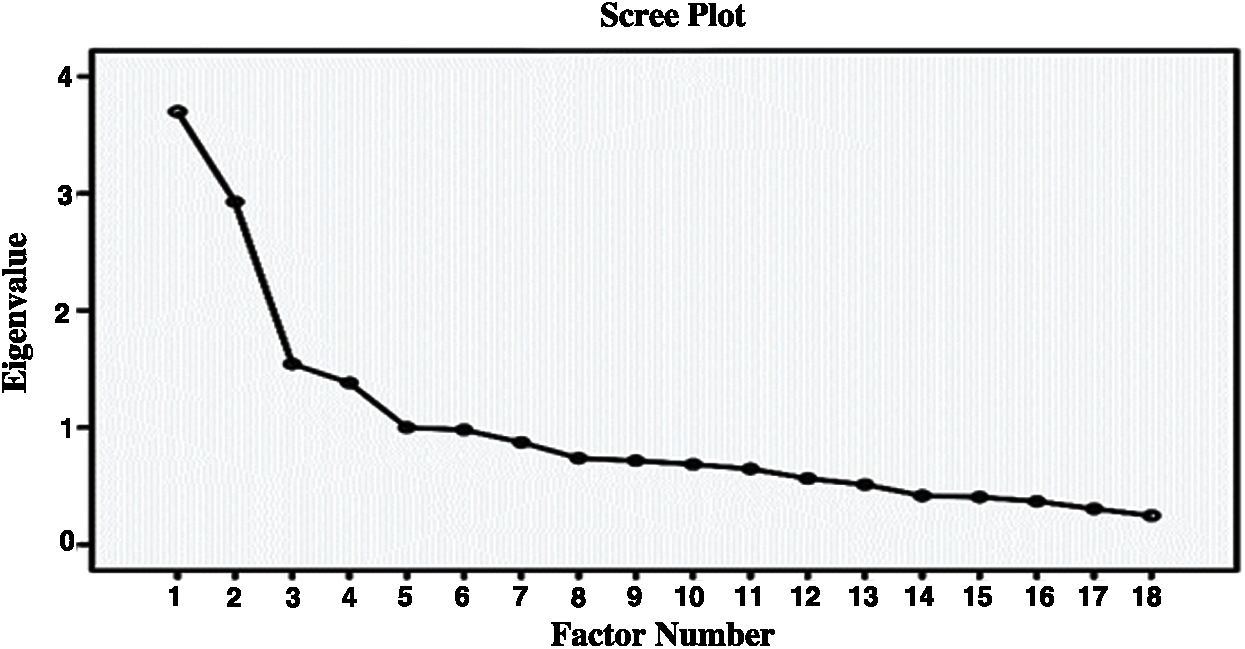
Figure 7: Scree plot for disagreement dimension
While one out of 20 items was removed on the draft scale and the analysis for the other 19 items was repeated. As a consequence of the study, four factors were taken into account for the remaining 19 items on the scale (Tab. 9).
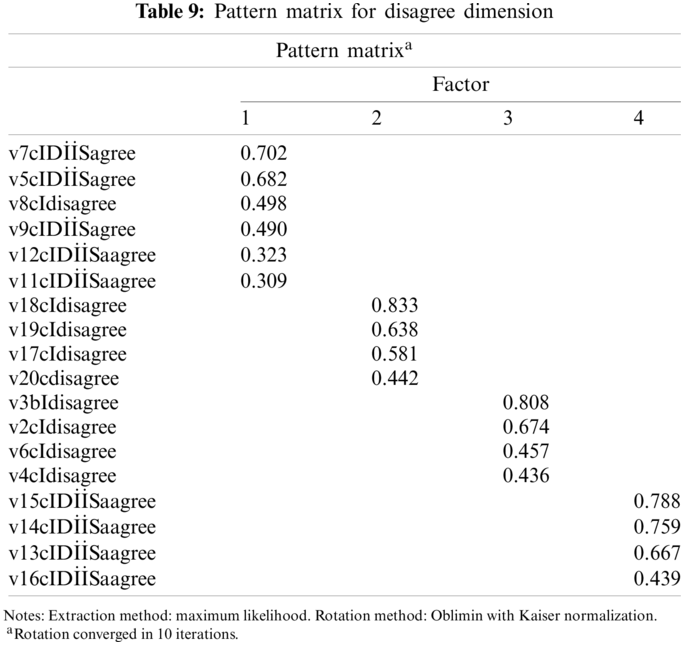
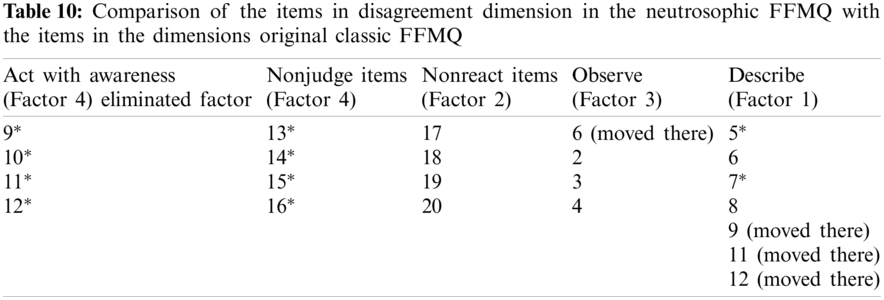
When the factor structure for disagreement dimension is compared to the original classic FFMQ, it is observed that all Item 6 is removed from the Describe dimension and it moved to the Observe dimension. It is observed that Items 9, 11, 12 were removed from the Act with Awareness they moved into the Describe. Additionally, the factor is eliminated because no items are accumulated there. It seems that as the dimension of the classical scale has changed, the general structure of the scale has also changed (Tab. 10).
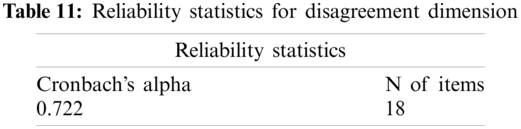
Reliability statistics show that the structure and assessment are regarded as reliable (Tab. 11).
3.3 Factor Analysis for the Uncertainty Dimension
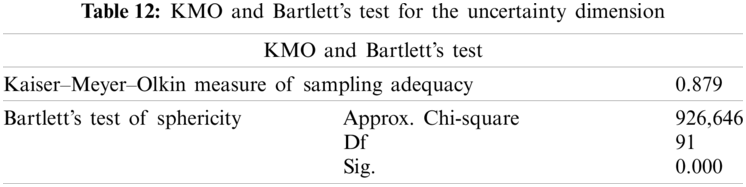
KMO and Bartlett’s test for uncertainty dimension shows that data is suitable for data factor analysis (KMO = 0.891, p < 0.05). After assessing if the data was appropriate for factor analysis, the data are evaluated for an exploratory factor to evaluate the factor structure in the scale. The first analysis showed that five factors had an eigenvalue of 1 and higher, which explains the total variance of 52.890 points. After rotation, three elements were deleted from the scale because they overlapped more than one-factor having similar loads (Item 17 having factor loads as 0.306 and −0.303 in Factor 1 and Factor 3, Item 20 having factor loads as 0.388 and −0.333 in Factor 2 and Factor 3, Item 6 having factor loads as −0.618 and 0.348 in Factor 3 and Factor 5). While 3 out of 20 items were removed on the draft scale and the analysis for the other 17 items was repeated. KMO and Bartlett’s test for uncertainty dimension shows that data is suitable for data factor analysis (KMO = 0.892, p < 0.05). After assessing if the data was appropriate for factor analysis, the data are evaluated for an exploratory factor to evaluate the factor structure in the scale. The first analysis showed that four factors had an eigenvalue of 1 and higher, which explains the total variance of 48.643 points. After rotation, three elements were deleted from the scale because they overlapped more than one-factor having similar loads (Item 16 having factor loads as, 418 and −0.314 in Factor 1 and Factor 2, Item 14 having factor loads as −0.738 and −0.316 in Factor 2 and Factor 3, Item 19 having factor loads as 0.386, −0.397 in Factor 1 and Factor 2). (Tab. 12).
As for the last analysis, KMO and Bartlett’s test for uncertainty dimension shows that data is suitable for the data for the factor analysis (KMO = 0.879, p < 0.05).
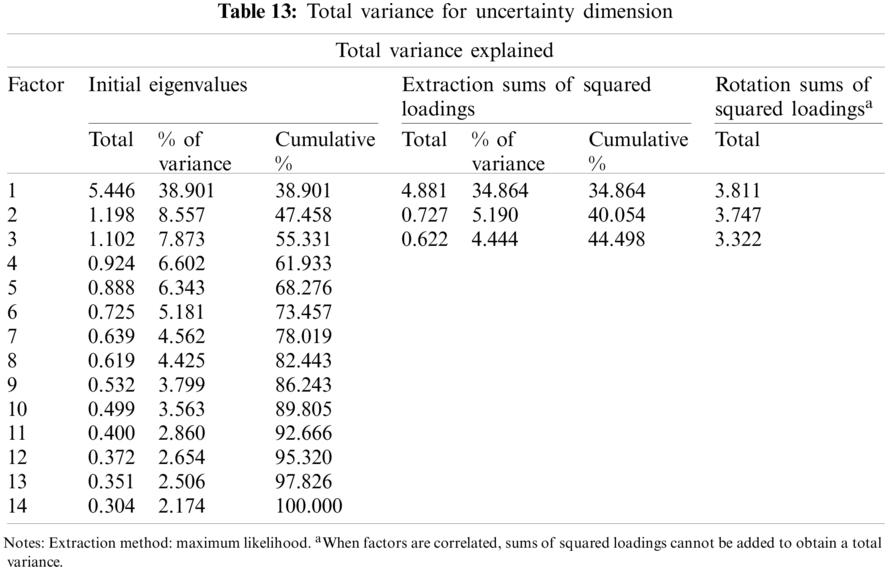
After assessing if the data was appropriate for factor analysis, the data are evaluated for an exploratory factor to evaluate the factor structure in the scale. The first analysis showed that three factors had an eigenvalue of 1 and higher, which explains the total variance of 44,498 points (Tab. 13).
The scree plot was also examined to determine how many factors the scale consists of. The Scree plot is given in Fig. 8. The scree plot in Fig. 8 indicates that after the third point, the breaks are diminished and the chart is continued horizontally.
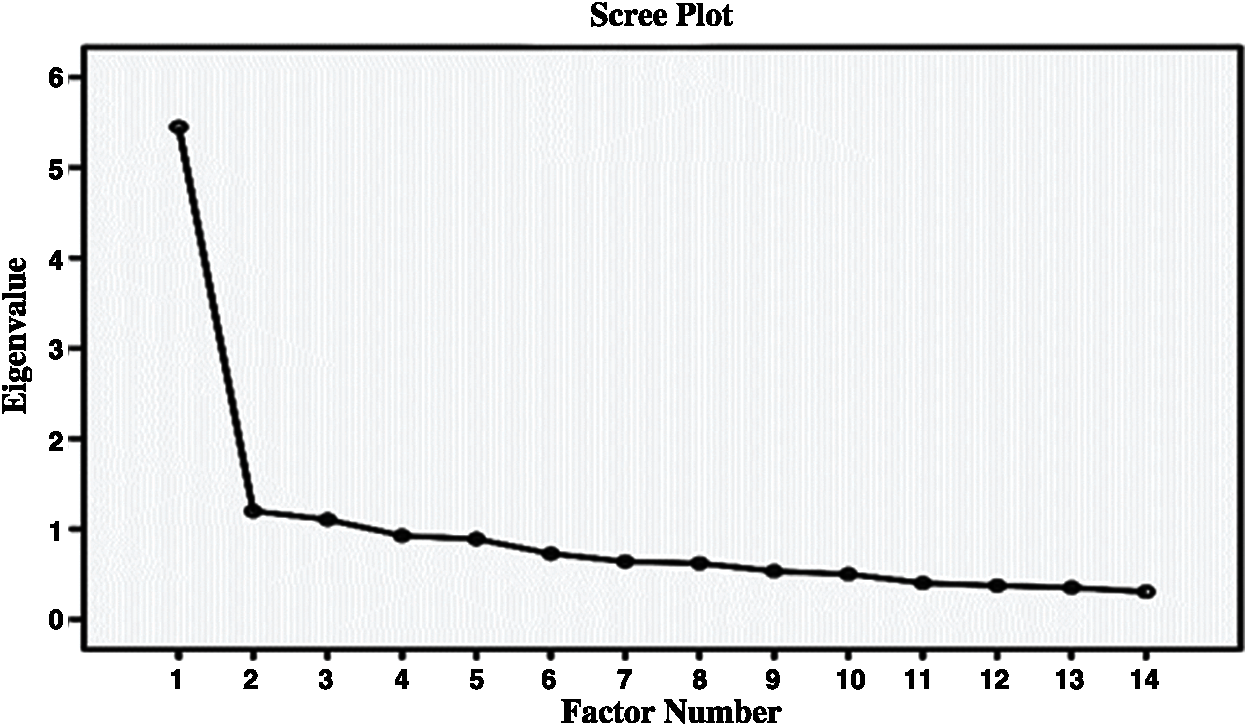
Figure 8: Scree plot for uncertainty dimension
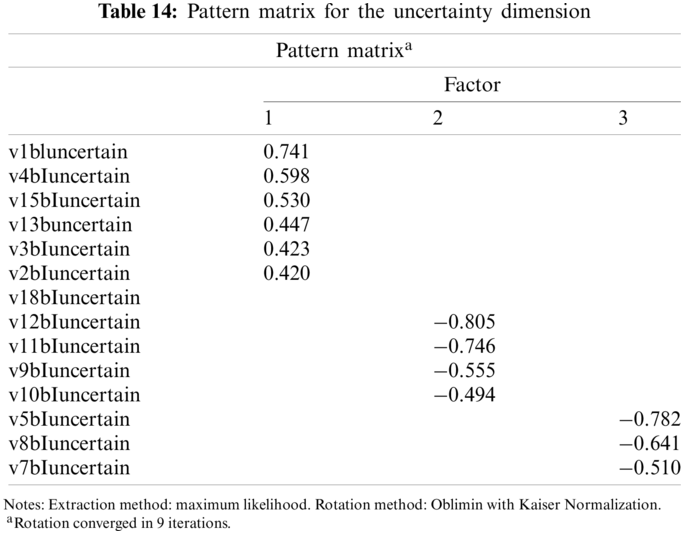
After rotation, no items were deleted from the scale with a factor load value of under 0.30 and overlaps of more than one factor. As a consequence of the study, three factors were taken into account for the remaining 13 items on the scale (Tab. 14).
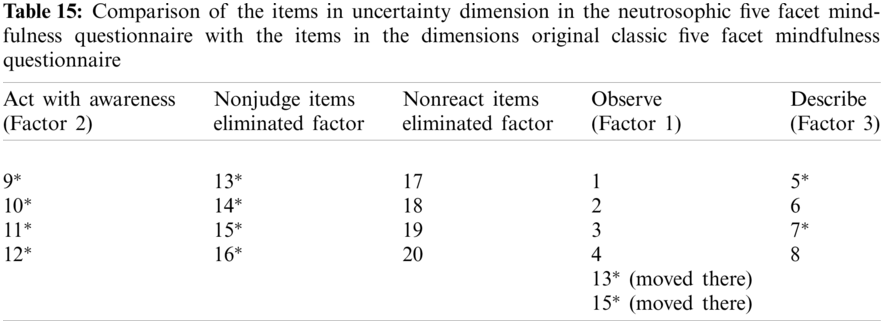
When the factor structure for uncertainty dimension is compared to the original classic Five Facet Mindfulness Questionnaire, it is observed that it seems that Observe is partially merged with Nonjudge items. Therefore, Nonjudge items are eliminated. Act with Awareness is originally correlated with Factor 2 so that it does not change its position. Nonreact factor items are also eliminated because they have no items corresponding to the original classical scale. Factor 3 corresponds to Describe except Item 6 because it was removed from there (Tab. 15).
Reliability statistics show that the structure and assessment are regarded as reliable (Tab. 16).
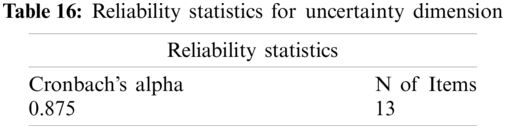
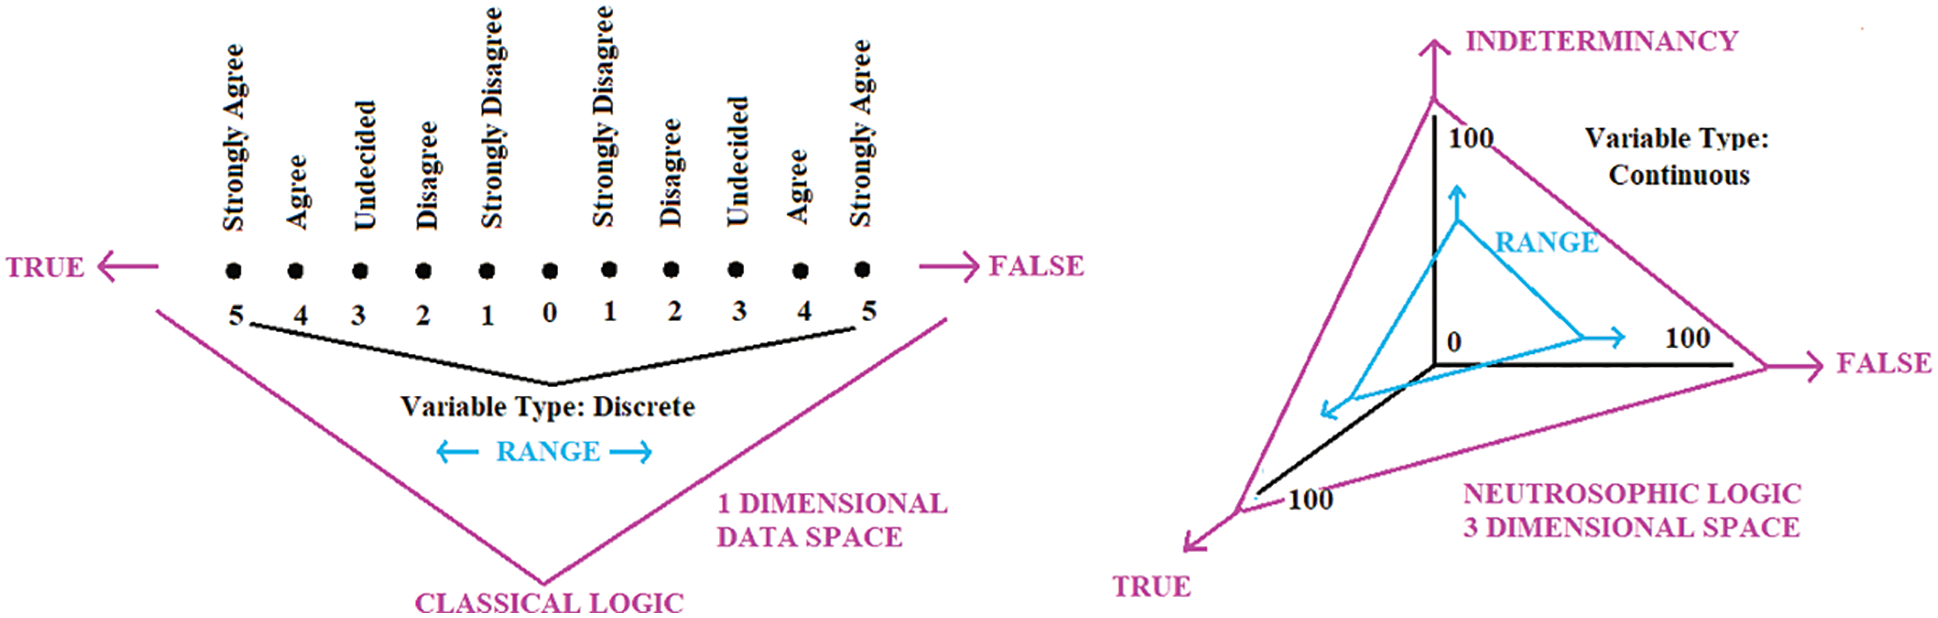
Figure 9: Factor structure of neutrosophic Questionnaire may not be same as the factor structure of the classical Questionnaire
The comparison of the items in the agreement, disagreement, and vagueness dimensions in the neutrosophic and classic Five Facet Mindfulness Questionnaire gives us many clues about how the structure of any questionnaire, survey, or scale can change as the dimensions or more generally, their space change. Therefore, if we convert any classical scale into a neutrosophic one, we shouldn’t directly assume that all of the sub-dimensions of a neutrosophic scale as agree, disagree, and undecided have a similar factor structure to the classical one. This is an important point, because, for further analysis of the data, such a wrong assumption may lead to wrong conclusions since neutrosophic logic requires three independent truth values while classical one takes two dependent truth values (Fig. 9).
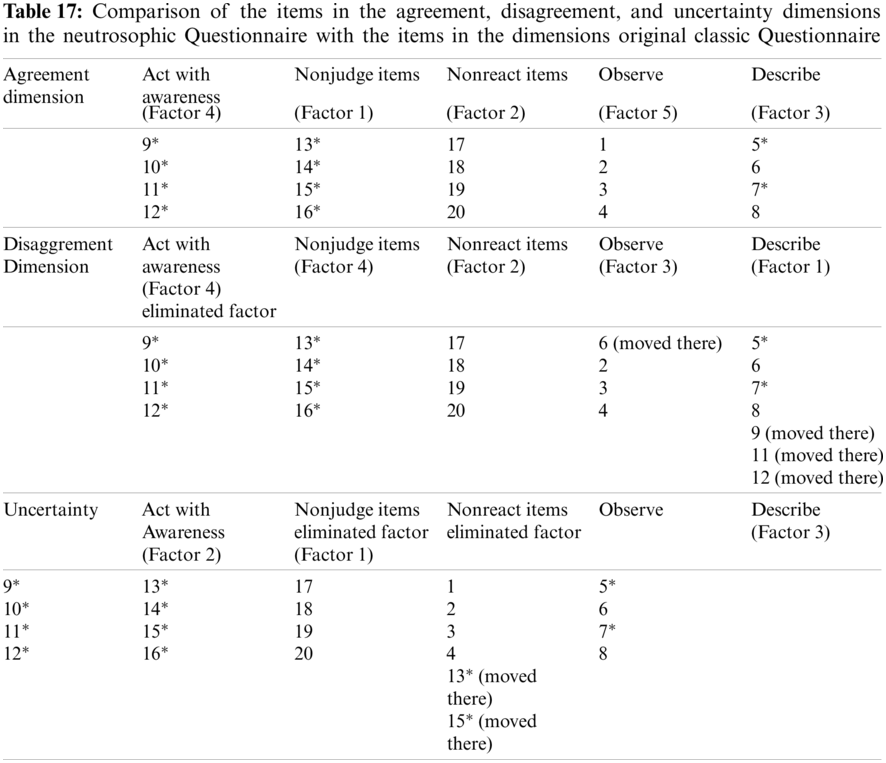
Interestingly, in the factor analysis of the neutrosophic scale, both classical and neutrosophic scales have the same factors, implying that the one-dimensional classical scale measures the agreement degree of the participants. When the factor analysis was conducted to disagreement and vagueness dimensions, it seemed that some factors were eliminated and even some new factors emerged, indicating that in human cognition those three dimensions can be taken as independent of each other, just as assumed by neutrosophic logic (Tab. 17).
The second important implication of the factor analysis is that the neutrosophic forms of any questionnaire can be used for the validity of the classical ones. Although it is not required that the dimensions of the neutrosophic forms of any questionnaire have the same or similar factors, since these different structures should be evaluated within their realms in terms of their structure, the classical forms of questionnaires can be checked based on neutrosophic forms. When Tab. 17 is examined, it is observed that some factors are eliminated on the neutrosophic scale while some of them stay in the same state. Since we used a valid and reliable scale having smaller items to check whether it is neutrosophic form can be used to evaluate it rather than a draft of a questionnaire having more items like 100 or 120 items, it seems that this scale is invalid, but for draft scales the similar procedure can be applied and more coherent scales having same factor structure in three dimensions with same items can be achieved so that items and dimensions can more sensitively measure the intended meaning of the items and factors. It is very similar to the Sieve of Eratosthenes, which is an ancient algorithm for finding the prime numbers up to any given limit where each prime is taken as an independent base or dimension and multiples of the selected prime in a given interval are eliminated until there are only prime numbers left.
Additionally, although it was said that this structure is deemed to be invalid for the general procedure, actually it is still used as a valid one because both factors, at least in two dimensions, were not eliminated. For instance, Act with Awareness (Factor 4) was eliminated in the disagreement dimension but it is still the same in two other dimensions as well, indicating that it has an approximately valid structure. Similar arguments can be made for items individually. For example, although Item 6 corresponds to the same structure in the classical one, indicating that it belongs to this factor, it changes its position in the other dimensions, possibly because of its dependence on other items in the realms of these two dimensions in the context of classical interdependent logic. Finally, the reliability of three independent dimensions of the neutrosophic forms of any questionnaire can also be used to check whether the measurement tool is reliable. Low-reliability results in any dimensions may imply that the scale has some problems in terms of meaning, language, or other factors.
Acknowledgement: The authors would like to thank the editor and anonymous referees who kindly reviewed the earlier version of this manuscript and provided valuable suggestions and comments.
Funding Statement: The authors received no financial support for the research, authorship, and/or publication of this study.
Conflicts of Interest: The authors declare that they have no conflicts of interest to report regarding the present study.
1. Smarandache, F., Said, B. (2020). Neutrosophic theories in communication, management and information technology. USA: NOVA Science Publisher. [Google Scholar]
2. AboElHamd, E., Shamma, H. M., Saleh, M., El-Khodary, I. (2021). Neutrosophic logic theory and applications. Neutrosophic Sets and Systems, 4, 30–51. DOI 10.5281/zenodo.8818. [Google Scholar] [CrossRef]
3. Smarandache, F. (2019). Introduction to neutrosophic sociology (Neutrosociology) infinite study. Brussells: Pons Publishing House. [Google Scholar]
4. Martínez, C., Hidalgo, G., Matos, M., Smarandache, F. (2021). Neutrosophy for survey analysis in social sciences. Neutrosophic Sets and Systems (Special Issue Impact of Neutrosophy in Solving the Latin American’s Social Problems), vol. 37, pp. 409–416. Infinte Study. [Google Scholar]
5. Taherdoost, H. (2016). Validity and reliability of the research instrument; how to test the validation of a questionnaire/survey in a research. How to test the validation of a questionnaire/survey in a research. SSRN Electronic Journal, 5(3), 28–36. DOI 10.2139/ssrn.3205040. [Google Scholar] [CrossRef]
6. Smarandache, F. (2015). Neutrosophic social structures specificities. Social Sciences and Education Research Review, 2(1), 3–10. https://ideas.repec.org/a/edt/jsserr/v2y2015i1p3-10.html. [Google Scholar]
7. Smarandache, F. (2003). A unifying field in logics: Neutrosophic logic. Neutrosophy, neutrosophic set, neutrosophic probability and statistics. Rehoboth: American Research Press. [Google Scholar]
8. Gayen, S., Smarandache, F., Jha, S., Singh, M. K., Broumi, S. et al. (2020). Introduction to plithogenic hypersoft subgroup. Neutrosophic Sets and Systems, 33, 208–233. https://digitalrepository.unm.edu/nss_journal/vol33/iss1/14. [Google Scholar]
9. Kumar, R., Edalatpanah, S. A., Gayen, S., Broumi, S. (2021). Answer note “A novel method for solving the fully neutrosophic linear programming problems: Suggested modifications”. Neutrosophic Sets and Systems, 39, 148–152. https://digitalrepository.unm.edu/cgi/viewcontent.cgi?article=1751&context=nss_journal. [Google Scholar]
10. Ayalp, H. D., Hisli Şahin, N. (2018). Beş Faktörlü Bilgece Farkindalik Ölçeği-Kisa Formu’nun (BFBFÖ-K) türkçe uyarlaması. Klinik Psikoloji Dergisi. DOI 10.31828/kpd2602443807092018m000002. [Google Scholar] [CrossRef]
11. Büyüköztürk, Ş. (2007). Sosyal Bilimler İçin Veri Analizi El Kitabı. Ankara: Pegem A Yayıncılık. [Google Scholar]
12. IBM Corporation (2021). KMO and Bartlett’s test. https://www.ibm.com/docs/en/spss-statistics/version-missing?topic=detection-kmo-bartletts-test. [Google Scholar]
13. Kemp, R., Snelgar, R., Brace, N., Harrison, V. (2021). SPSS for psychologists. London: Red Globe Press. [Google Scholar]
14. Field, A. (2009). Discovering statistics using SPSS. London: Sage publications. [Google Scholar]
15. Altunışık, R., Coşkun, R., Bayraktaroğlu, S., ve Yıldırım, E. (2012). Sosyal Bilimlerde Araştırma Yöntemleri. Sakarya: Sakarya Kitapevi. [Google Scholar]
16. Kalaycı, Ş. (2014). SPSS Uygulamalı Çok Değişkenli İstatistik Teknikleri. Ankara: Asil Yayın Dağıtım, Ltd. Şti. [Google Scholar]
17. Katrancı, M., Temel, S. (2018). Writing anxiety scale for primary school student: A validity and reliability study. Journal of Social and Humanities Sciences Research, 5(24), 1544–1555. DOI 10.26450/jshsr.516. [Google Scholar] [CrossRef]
18. Tabachnick, G. B., Fidell, L. S. (2013). Using multivariate statistics. 6th edition, London: Pearson. [Google Scholar]
19. Çokluk, Ö., Şekercioğlu, G., Büyüköztürk, Ş. (2012). Sosyal Bilimleri İçin Çok Değişkenli İstatistik Spss Ve Lisrel Uygulamaları (2. Baskı). Ankara: Pegem Akademi. [Google Scholar]
20. Linn, R. L., Gronlund, N. E. (2000). Measurement and assessment in teaching. 8th edition. New Jersey: Merrill. [Google Scholar]
21. Şencan, H. (2005). Sosyal ve Davranışsal Ölçümlerde Güvenilirlik ve Geçerlilik. Ankara: Nadir Kitap. Çokluk, Ö. [Google Scholar]
22. Şekercioğlu, G., Büyüköztürk, Ş (2012). Sosyal Bilimleri İçin Çok Değişkenli İstatistik Spss Ve Lisrel Uygulamaları (2. Baskı). Ankara: Pegem Akademi. [Google Scholar]
 | This work is licensed under a Creative Commons Attribution 4.0 International License, which permits unrestricted use, distribution, and reproduction in any medium, provided the original work is properly cited. |