| Computer Modeling in Engineering & Sciences |
DOI: 10.32604/cmes.2022.018130
ARTICLE
Identification of Denatured Biological Tissues Based on Improved Variational Mode Decomposition and Autoregressive Model during HIFU Treatment
1College of Mathematics and Physics, Hunan University Arts and Science, Changde, 415000, China
2Key Laboratory of Metallogenic Prediction of Nonferrous Metals and Geological Environment, Monitoring Ministry of Education, School of Geosciences and Info-physics, Central South University, Changsha, 410083, China
*Corresponding Author: Xian Zhang. Email: zhangxian128@csu.edu.cn
Received: 01 July 2021; Accepted: 09 October 2021
Abstract: During high-intensity focused ultrasound (HIFU) treatment, the accurate identification of denatured biological tissue is an important practical problem. In this paper, a novel method based on the improved variational mode decomposition (IVMD) and autoregressive (AR) model was proposed, which identified denatured biological tissue according to the characteristics of ultrasonic scattered echo signals during HIFU treatment. Firstly, the IVMD method was proposed to solve the problem that the VMD reconstruction signal still has noise due to the limited number of intrinsic mode functions (IMF). The ultrasonic scattered echo signals were reconstructed by the IVMD to achieve denoising. Then, the AR model was introduced to improve the recognition rate of denatured biological tissues. The AR model order parameter was determined by the Akaike information criterion (AIC) and the characteristics of the AR coefficients were extracted. Finally, the optimal characteristics of the AR coefficients were selected according to the results of receiver operating characteristic (ROC). The experiments showed that the signal-to-noise ratio (SNR) and root mean square error (RMSE) of the reconstructed signal obtained by IVMD was better than those obtained by variational mode decomposition (VMD). The IVMD-AR method was applied to the actual ultrasonic scattered echo signals during HIFU treatment, and the support vector machine (SVM) was used to identify the denatured biological tissue. The results show that compared with sample entropy, information entropy, and energy methods, the proposed IVMD-AR method can more effectively identify denatured biological tissue. The recognition rate of denatured biological tissue was higher, up to 93.0%.
Keywords: HIFU; ultrasonic scattered echo signals; IVMD; AR model
In modern medicine, high-intensity focused ultrasound (HIFU) has been widely used to treat diseases such as cancer and tumors [1–3]. HIFU treatment can focus ultrasonic energy on the treatment region of the body to kill cancer cells without damaging surrounding normal tissue and cells [4]. Therefore, it is important to identify whether biological tissue has been denatured during HIFU treatment [5]. So far, HIFU researchers have generally used ultrasound to identify denatured biological tissues due to its low cost, real-time performance, and good compatibility.
However, the ultrasonic echo signal contains a lot of noise, which affects the recognition rate of denatured biological tissues during HIFU treatment. Meanwhile, ultrasound echo signals exist frequency shifts when tissue has been denatured [6]. Therefore, it is difficult to filter out the noise of the ultrasonic echo signal from the biological tissue by the bandpass filter. Variational modal decomposition (VMD) can realize effective separation of intrinsic modal components (IMF) and signal frequency domain division [7]. The effective decomposition components of the signal are obtained and the optimal solution of the variational problem is finally calculated. Thus, it can effectively reduce the nonstationarity of time series with high complexity and strong nonlinearity [8]. VMD can decompose complex signals into a set of simple and residual signals, which usually was employed to reconstruct denoised signals in many fields. In [9–13], VMD was applied to analyze biological signals to identify diseases. In [14–17], VMD was applied to simplify the characteristic information of commodity price change rules and find future price changes. In [18–21], VMD was applied to analyze the mechanical equipment signals, and the intrinsic mode functions (IMF) containing the fault information were found to identify the fault type. Therefore, VMD was applied to denoise the ultrasonic scattered echo signals of HIFU treatment [22]. However, the VMD reconstructed ultrasonic scattered echo signals still contain noise due to the number of IMFs is limited. In order to solve the problem, the improved variational mode decomposition (IVMD) is proposed to filter out the noise in the ultrasonic scattered echo signal. IVMD filters the IMF component of noise according to the results of the autocorrelation function, and then the denoised ultrasonic scattered echo signal is output according to the spectrum energy of the reconstructed signal.
In addition, the ultrasonic echo signal is the nonlinear signal in the HIFU treatment. After the biological tissue has been denatured, many properties of the ultrasonic echo signal will change. With the development of nonlinear technology, many nonlinear computational methods are proposed to analyze various systems [23–25]. Researchers in the field of ultrasound have studied the characteristics of ultrasonic energy, sound speed, information entropy, and sample entropy of ultrasonic echo signals, hoping to find characteristics that can accurately reflect the characteristics of biological tissues [26–30]. In [26], the energy characteristics of ultrasonic signals were used to recognize the denatured biological tissue during HIFU treatment. In [27], the sound speed values were used to monitor the denatured biological tissue during HIFU treatment, and the results showed that the sound speed of denatured biological tissues was higher than that of normal tissues. In [28,29], the biological tissue state after HIFU irradiation was assessed by the information entropy of the radio frequency ultrasound. In [30], the sample entropy of the radio frequency ultrasonic signals was employed to distinguish the normal porcine tissues and denatured porcine tissues. However, all the methods mentioned above have some disadvantages, such as sound speed measurement of biological tissues is easily affected by environmental noise, which leads to the inaccuracy of the recognition results of denatured biological tissue. The existing recognition technology of denatured biological tissue has low recognition rate and weak recognition ability. Therefore, it is urgent to find a characteristics analysis method to improve the identification ability of denatured biological tissues.
The autoregressive (AR) model is a time sequence analysis method for mode recognition and prediction. The autoregressive characteristics of the model contain important information of the analyzed time sequence. It is very sensitive to the changes of sequence and can obtain the structure and complexity of dynamic data. In [31], the AR model was used to detect anomalous flight segments. In [32], the AR model was used to monitor the complexity of heart murmur sound signals. In [33], the effectiveness of the AR model for shaft crack diagnosis was verified. However, it has not been reported that the AR model coefficients of ultrasonic echo signals are applied to identify denatured tissue during HIFU treatment.
In this paper, a method based on IVMD-AR to identify denatured biological tissues is proposed. The ultrasonic scattered echo signal can be effectively denoised by IVMD reconstruction, the AR model is introduced to extract the characteristics of the denoised signal. The order of the AR model is determined by the Akaike information criterion (AIC), the characteristics are selected by receiver operating characteristic (ROC). The support vector machine (SVM) is used to identify denatured tissue. The actual data shows that the IVMD-AR method can more effectively identify denatured tissue.
The highlighted main contributions are described as follows:
(1) To solve the inherent disadvantages of VMD, we proposed the improved variational mode decomposition (IVMD) method to obtain the high-quality reconstructed signals.
(2) We introduce the autoregressive (AR) model to identify denatured biological tissue during HIFU treatment.
(3) We compare the proposed method with the existing methods, the investigation results show that the IVMD-AR method has higher recognition rate, which can more effectively identify denatured tissue.
2.1 Variational Mode Decomposition
VMD is applied to decompose the complex time series into a series of intrinsic mode functions (IMF), and each IMF is an AM-FM signal. The time series
where
Each IMF has a center frequency and the limited bandwidth. In the VMD algorithm, the decomposition process is the constrained variational problem as follows:
where
where
1. Initialize
2. Update uk,
3. The precision
2.2 Improved Variational Mode Decomposition
Due to the wide frequency distribution range of the noise in the ultrasonic signal and the limited number of modes obtained by VMD decomposition and reconstruction, the VMD reconstructed ultrasonic echo signals still contain noise. In order to solve the problem, the improved variational mode decomposition is proposed. The specific steps are as follow:
1. The original signal is decomposed into K IMFs by VMD.
2. The autocorrelation functions of all IMFs at
3. The
4. Calculate the spectral energy of the reconstructed signal. Then the proportion between the sum of the spectral energy of the former K-1 IMFs and the total spectral energy of the reconstructed signal is calculated.
5. Threshold of proportion is set. When the energy proportion calculated in Step 4 is less than the threshold, the reconstructed signal is regarded as the original signal in Step 1, and repeat Steps 1 to 4. When the proportion is larger than the threshold, the iteration stops and the reconstructed signal is output as the denoised signal.
The autoregressive model is a model that is developed based on the linear regression model. The p-order autoregressive model can be defined as:
where
Burg algorithm is applied to calculate the parameters of the autoregressive model. The average power minimum criterion of forwarding and the backward prediction error is applied in the Burg algorithm. Firstly, the reflection coefficient is estimated, and then the coefficients of the AR model are solved by using Levinson recursion from low order to high order. The forward and backward prediction errors are defined respectively as follows:
As shown in Eq. (13), the forward and backward prediction errors of each order are calculated by the lattice filter, where
The average power of forwarding and backward prediction errors is:
Minimize Pp by
Finally, the parameter of the AR model is obtained by using the Levinson formula:
2.4 Intra-Class Distance and Inter-Class Distance
Intra-class distances and inter-class distances are often used to evaluate clustering and classification effects. The separability between different classes is expressed as the inter-class distance. The compactness of features in the same class is expressed as the intra-class distance.
The intra-class distance for the c-class sample set
The inter-class distance between two classes can be expressed as:
where
Based on the concept of entropy, AIC provides a standard to weigh the complexity of the model and the fitting performance of the statistical model. Meanwhile, AIC is calculated as follows:
where q is the number of parameters and Fl is the maximum likelihood of the estimation model [34].
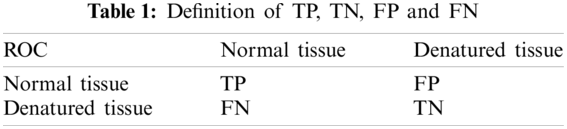
ROC is a dichotomy-based graphical representation that is commonly used to assess medical diagnosis. The ROC curve reflects the relationship between true positive rates (TPR) and false positive rates (FPR) of different thresholds in the whole classifier. TPR and FPR are calculated by the Eqs. (20) and (21). The definitions of TP, TN, FP and FN in the formulas are shown in Table 1. Taking TPR and FPR with the same threshold as ordinate and abscissa respectively. The test results of all data are marked in the two-dimensional coordinate system, and the ROC curve consists of all points. The area under curve (AUC) of ROC is the area enclosed by the ROC curve, abscissa and FPR = 1. AUC is often used to evaluate the overall accuracy of ROC diagnostic tests [35]. The higher the AUC, the better the classification effect, and the more accurate the identification of the denatured biological tissue.
Before the experiment, povidone was mixed with 95% alcohol in a ratio of 1:4, and then mixed with water in a volume ratio of 1:20. After waiting for 1 h, the gas in the water was removed. The experimental system is shown in Fig. 1. The HIFU transducer (PRO2008, Shenzhen, China) with a center frequency of 1.39 MHz was used to irradiate the fresh porcine muscle to change its biological tissue properties. The irradiation power of the HIFU transducer was 210–300 W, and the HIFU transducer was turned off after HIFU irradiation. The temperature of the porcine muscle at the focal region was measured by the thermometer. The type-B ultrasound scanner was used to monitor the treatment process. The fiber optic hydrophone (FOPH2000, Germany) was used to obtain ultrasonic echo signals and then saved by a digital oscilloscope (MDO3032, Tektronix, USA). In this experiment, 400 experimental data from 15 groups of samples were collected, including 200 signals of denatured tissue and 200 signals of normal tissues. The experimental porcine muscle tissue samples were sliced to distinguish whether the tissue had been denatured. Fig. 2 shows the status of sliced normal and denatured porcine tissue.
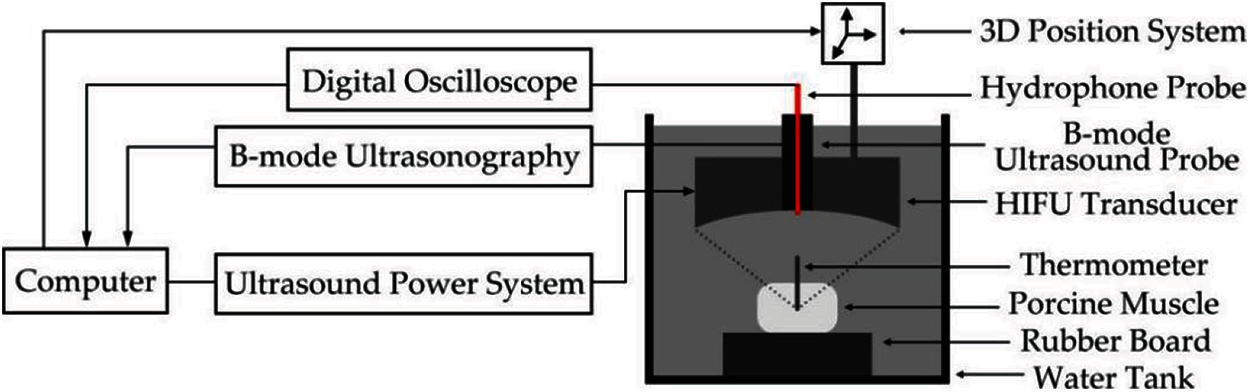
Figure 1: Experimental system
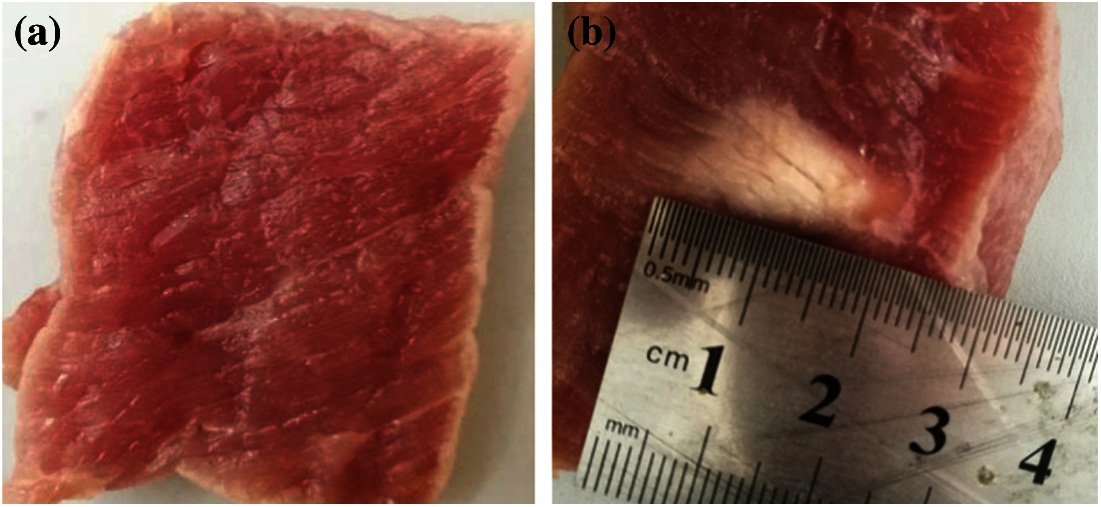
Figure 2: The status of sliced normal and denatured porcine tissue (a) Normal tissue; (b) Denatured tissue
3.2 Interception of Ultrasonic Scattered Echo Signal
The collected ultrasonic echo signals as shown in Fig. 3, and the sampling frequency is 20 MHz. Line 1 is the boundary point of the ultrasound through water and porcine muscle tissue. Line 2 is the starting point of the ultrasonic scattered echo signal from the treatment region and Line 3 is the end-point. Therefore, the length of the scattered echo signal reflected by the treatment area between Line 2 and Line 3 is 500 points. The default sound speed is 1550 m/s. The theoretical depth of the treatment region can be calculated as 19.3 mm. Meanwhile, the actual depth of the treatment region is 17 mm–20 mm. Therefore, the intercepted signals are reasonable for identifying denatured tissue.
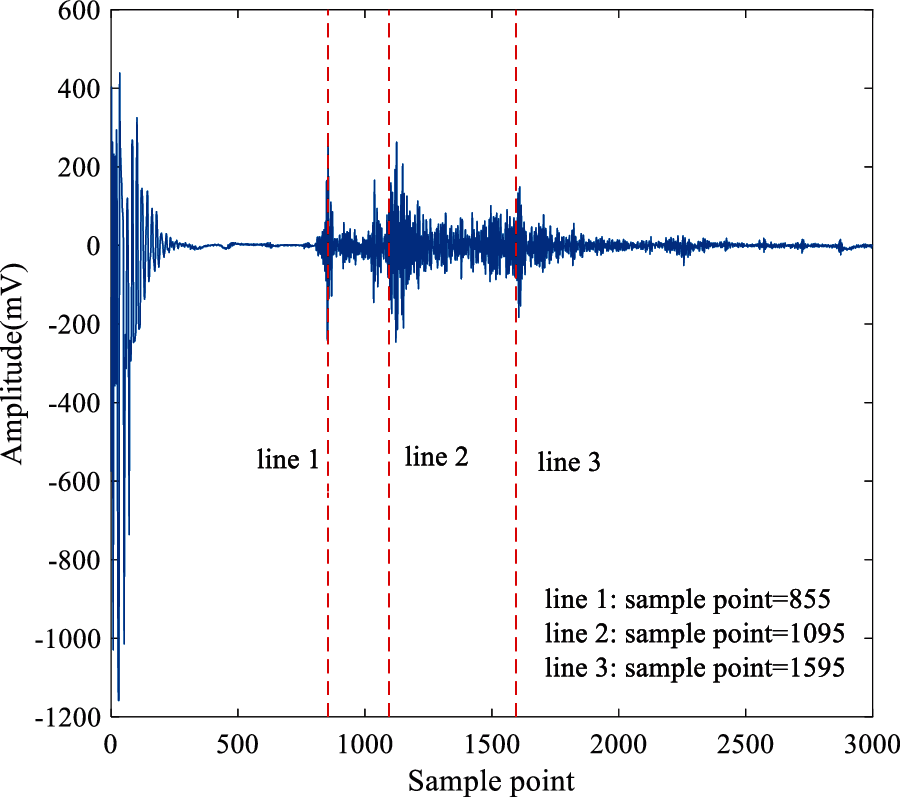
Figure 3: The waveform of ultrasonic echo signal
3.3 Comparison of IVMD and VMD
To analyze the simulation signal with noise by VMD and IVMD, respectively. The simulation signal is
The threshold of proportion is set as 0.98. When the proportion is larger than the threshold, the iteration stops and the reconstructed signal is output as the denoised signal. The reconstructed signal is obtained by IVMD and the frequency spectrum of the reconstructed signal is calculated. Compared with the frequency spectrum of simulated signal with noise and reconstructed signal by VMD, as shown in Fig. 5. It can be found that VMD decomposition can filter medium and high-frequency noise, but cannot filter noise around 20 Hz and 100 Hz. While IVMD can filter out not only medium and high-frequency noise but also noise between 20 Hz and 100 Hz. From the frequency spectrum analysis, IVMD can realize signal denoising more effectively compared with VMD.
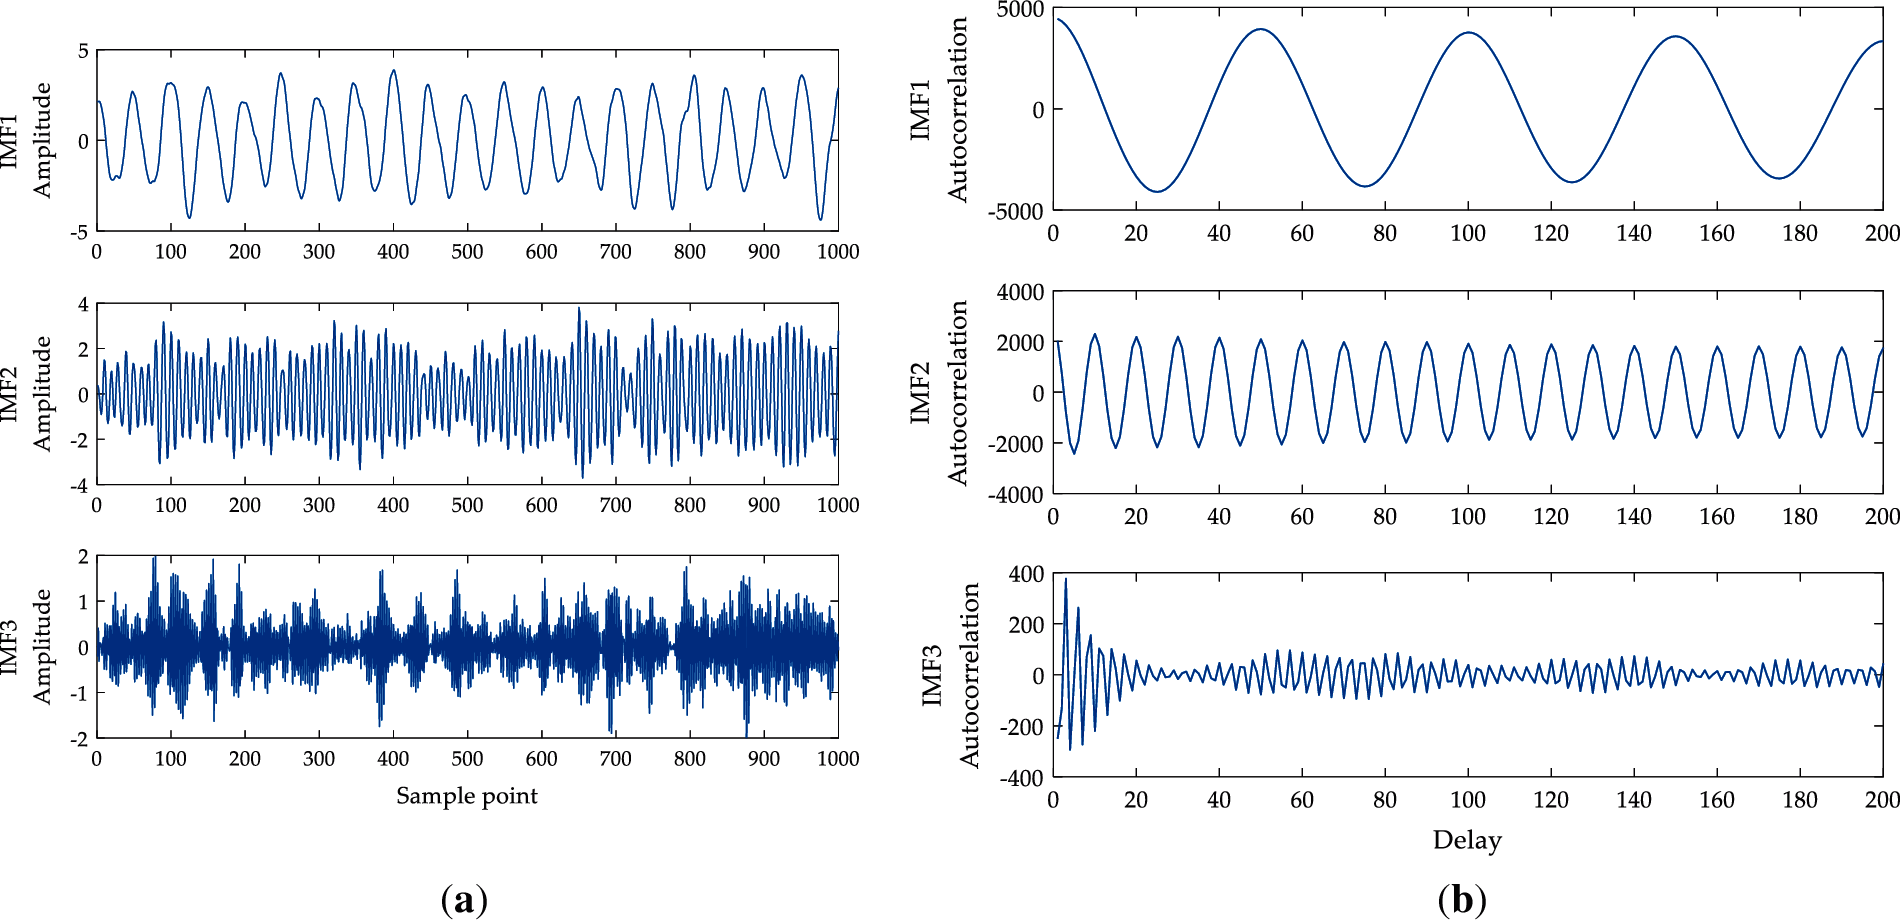
Figure 4: IMFs and its autocorrelation function (a) IMFs of the simulation signal obtained by VMD analysis; (b) Autocorrelation function of IMFs
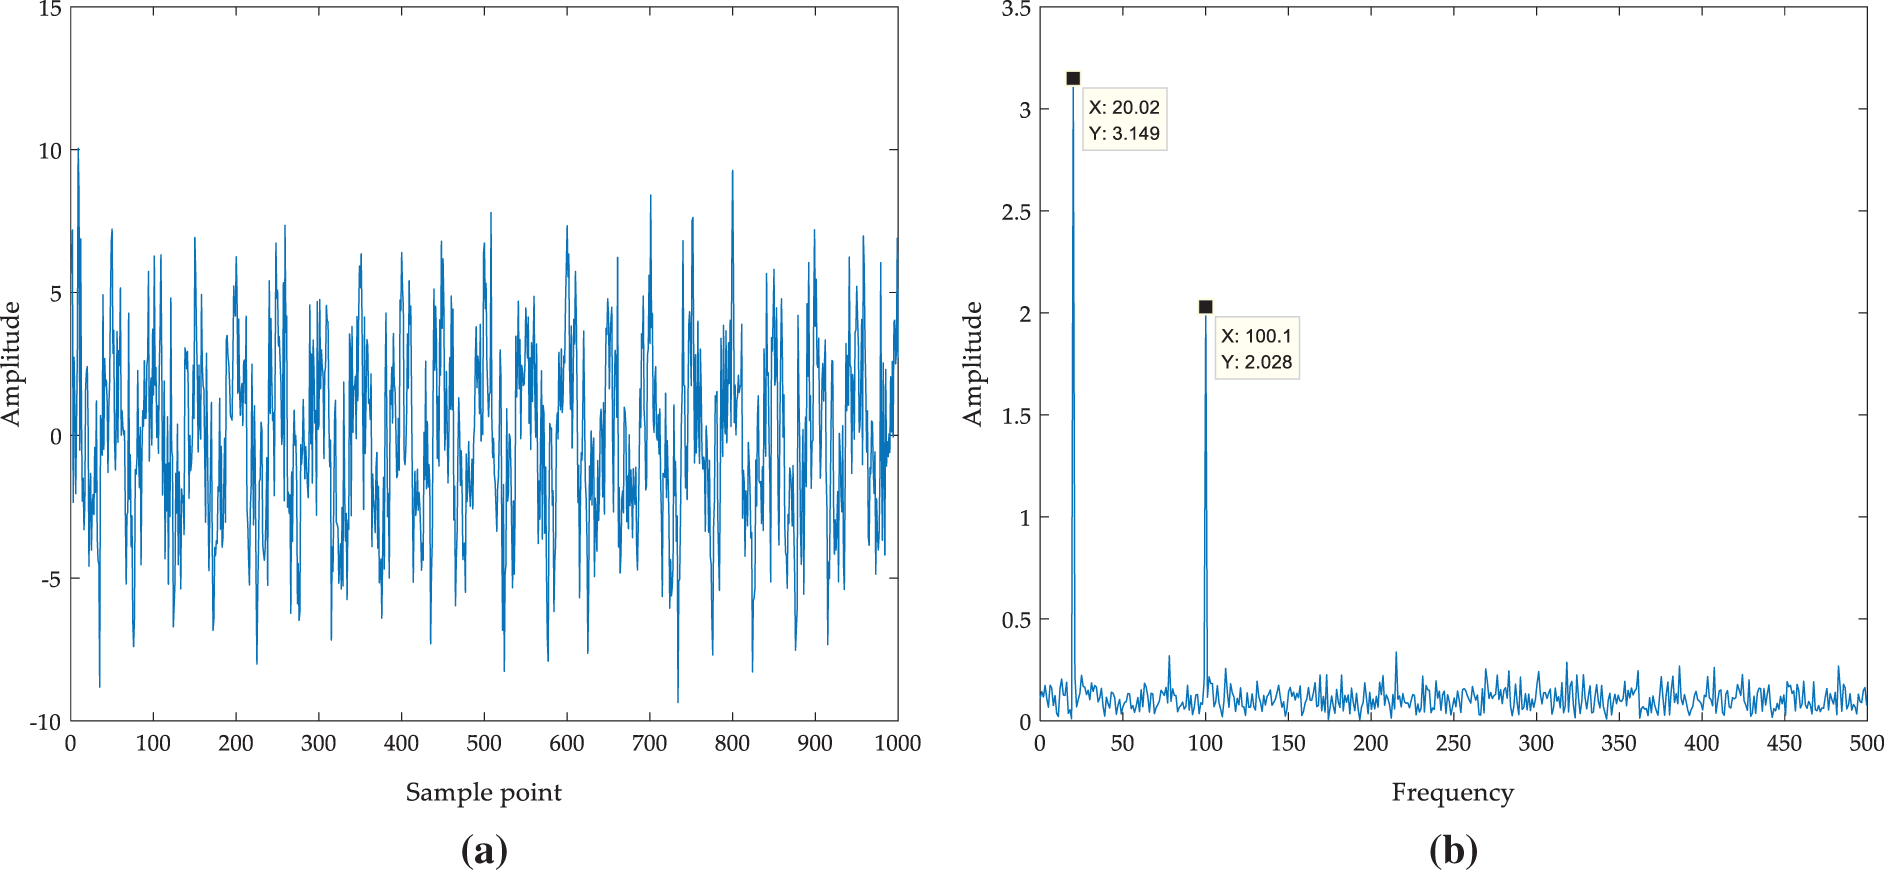
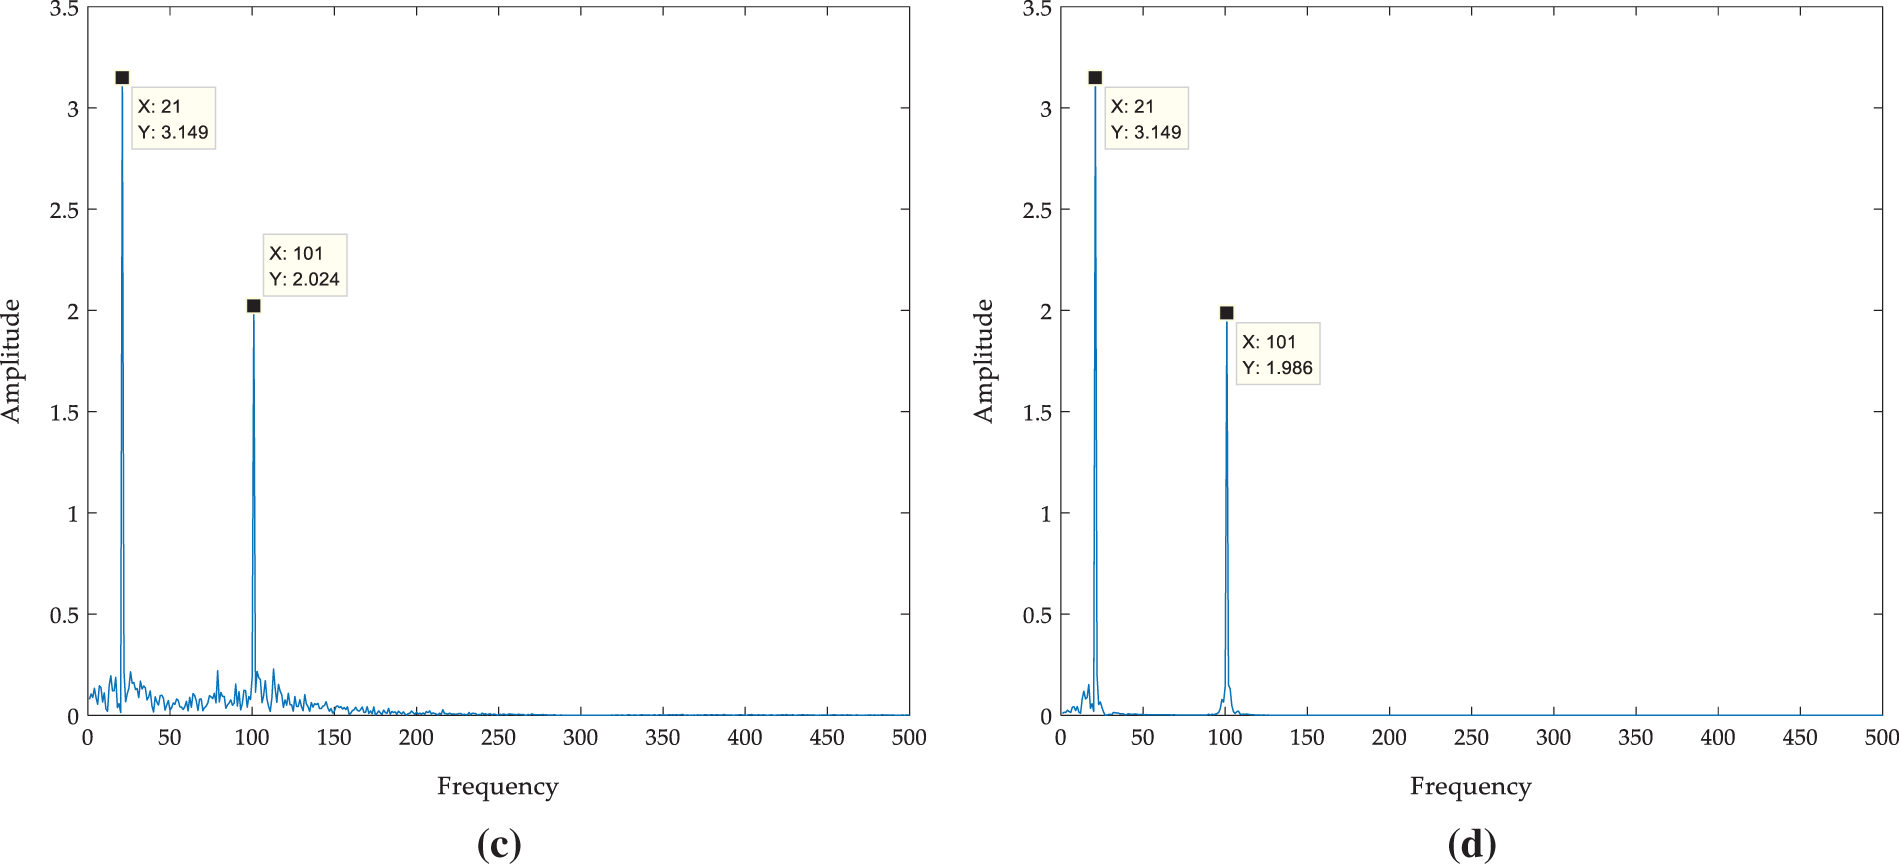
Figure 5: Comparison of denoising effects between VMD method and IVMD method (a) Waveform of f(t); (b) Frequency spectrum of f(t); (c) Frequency spectrum of VMD reconstructed signal; (d) Frequency spectrum of IVMD reconstructed signal
In order to prove the advantage of IVMD in low SNR signals, VMD and IVMD are applied to reconstruct the simulation signals with different SNR. The reconstructed signals of SNR and RMSE are calculated. From Fig. 6, it can be seen that SNR and RMSE of IVMD fluctuate within a certain range due to the analysis of the energy composition of the reconstructed signals. The SNR of the VMD reconstructed signal increases with the increase of the SNR of the input signal, and the RMSE decreases with the increase of the SNR ratio of the input signal. The SNR and RMSE of IVMD are stable. Furthermore, The SNR of the IVMD reconstructed signal is higher than that of the VMD reconstructed signal, and the RMSE of the IVMD reconstructed signal is lower than that of the VMD reconstructed signal. This means that the IVMD method has better denoising effect and stability than the VMD method.
Considering the advantages of IVMD in signal denoising, the IVMD method is used to denoise the ultrasonic scattered echo signal. Fig. 7a is an ultrasonic scattered echo signal of biological tissue extracted from the original signal. The signal in Fig. 7b is obtained by IVMD denoising. It can be observed that the signal obtained by IVMD has a distinct pulse waveform and the waveform oscillation is attenuated.
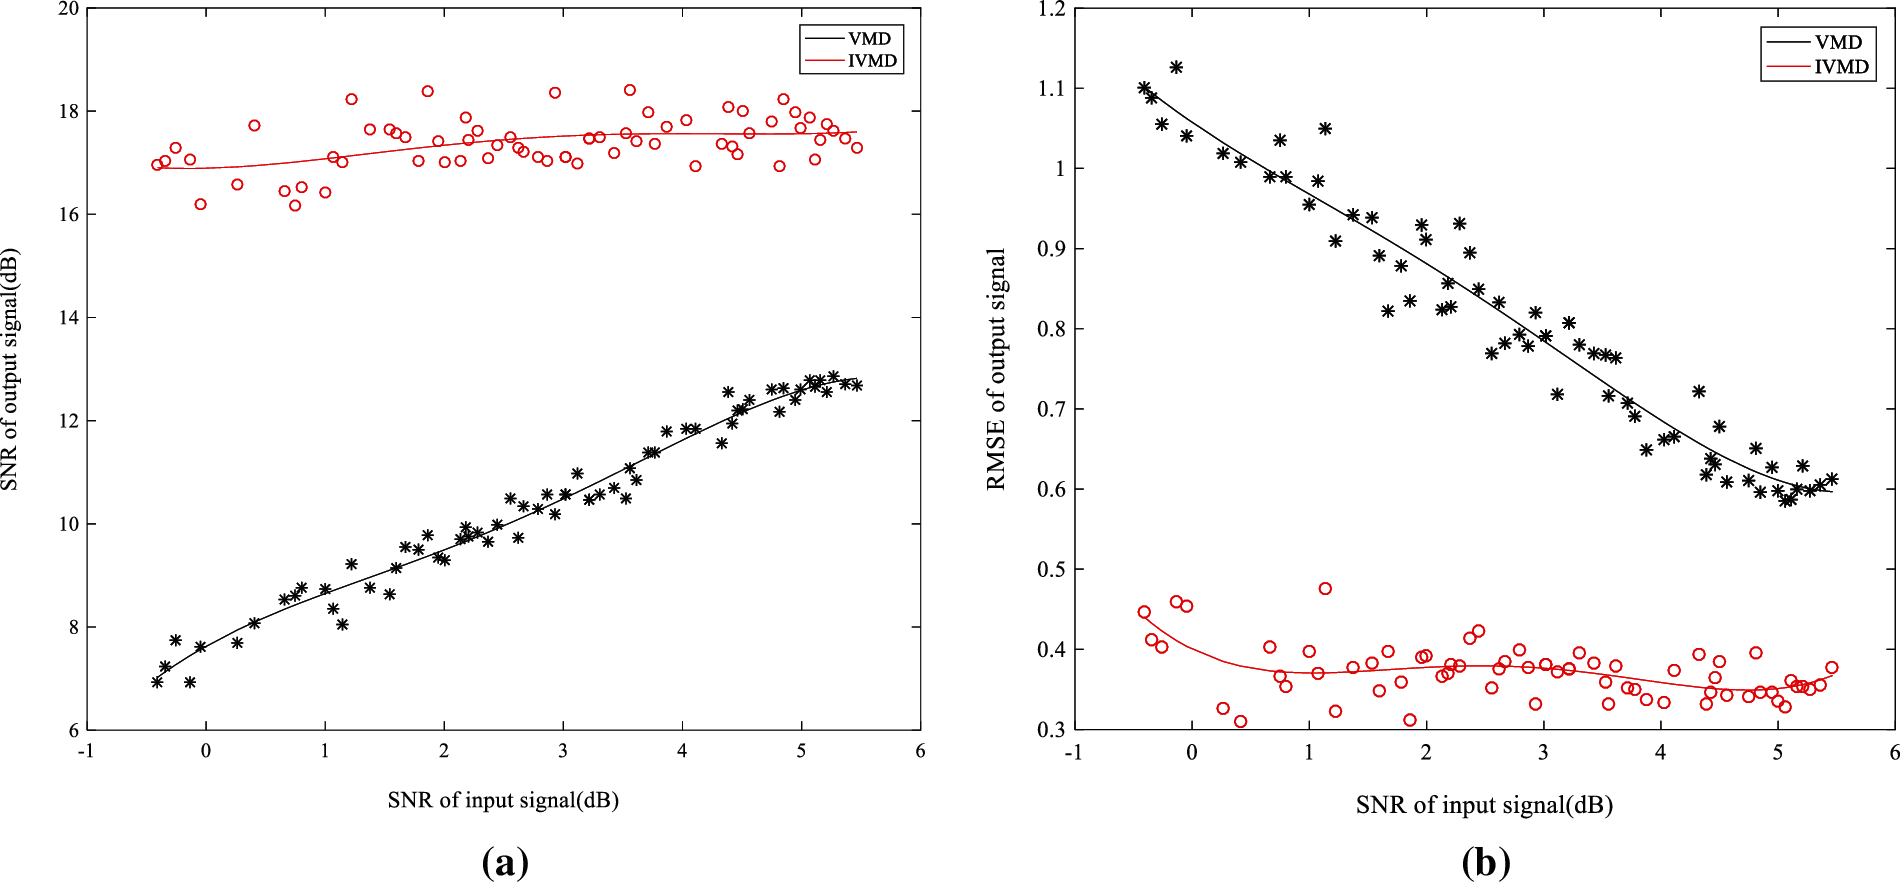
Figure 6: Comparison the denoising effect of two methods under different SNR (a) SNR; (b) RMSE
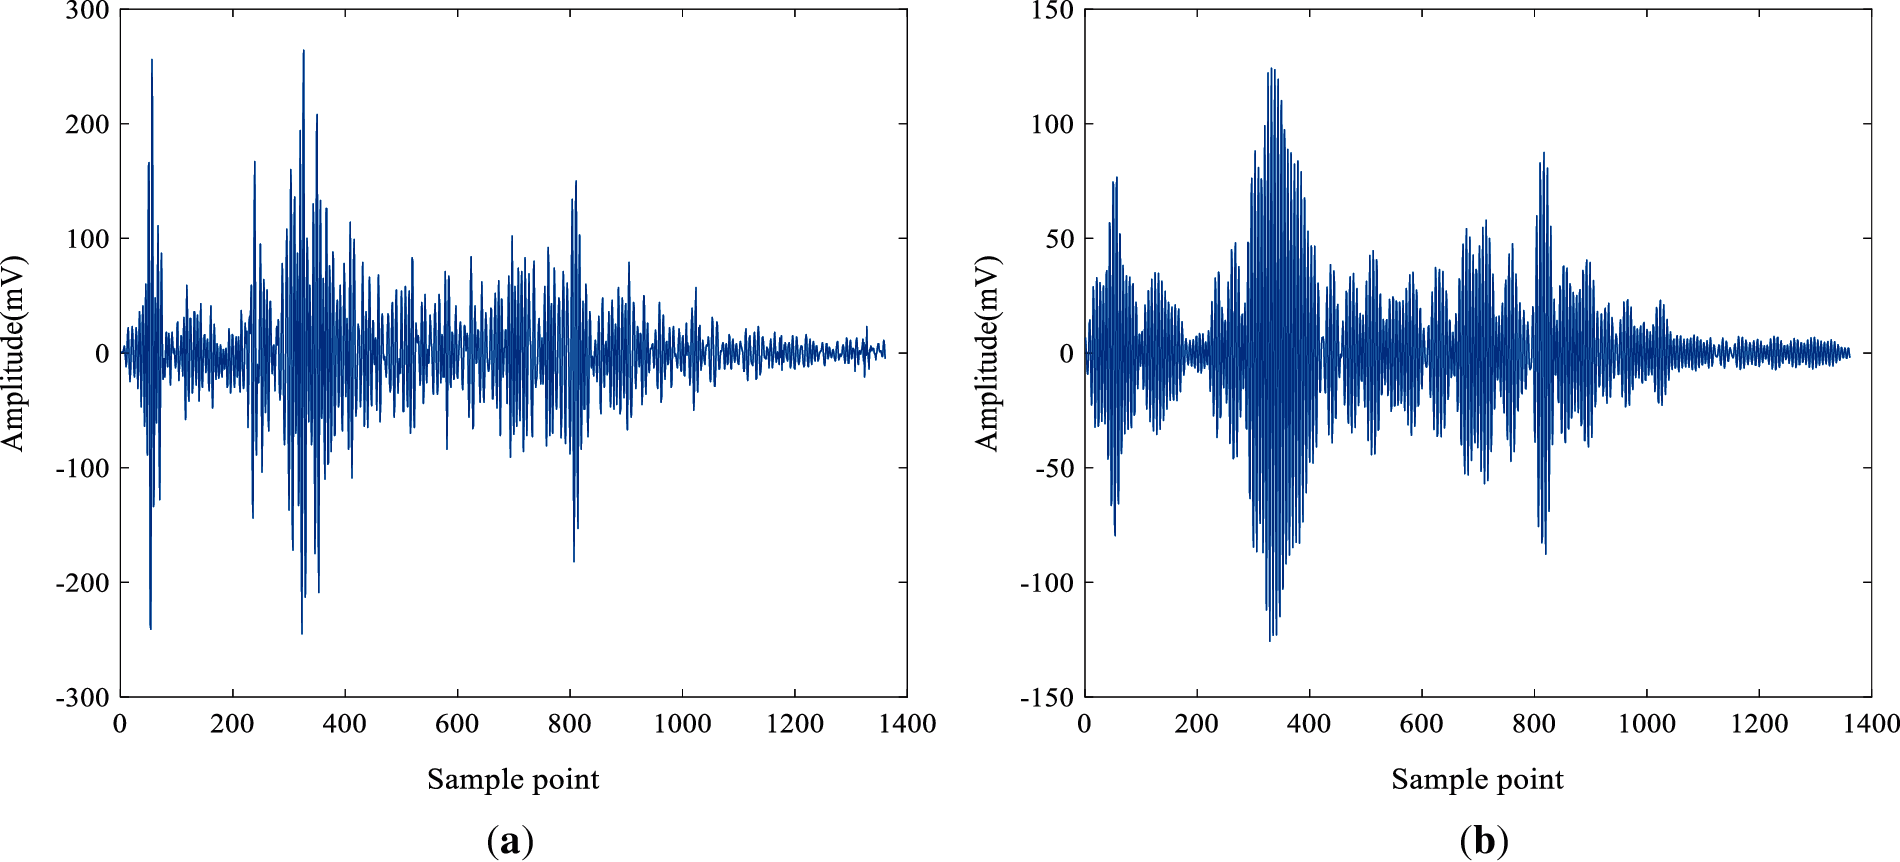
Figure 7: The time-domain waveform of the ultrasonic signal (a) Original signal; (b) Signal reconstructed by IVMD
3.4 Coefficient Selection of AR Model
In AR model analysis, it is very important to determine the order of the AR model. If the order is too low, the resolution of the AR model is not high enough and the parameters of the model are inconsistent with the actual signals. If the order is too large, the model contains false details and the variance of the model will increase [36]. The order of the AR model of the denoised ultrasonic scattered echo signals is determined by AIC, as shown in Fig. 8a. It can be seen that when the order is larger than 20, the AIC value is almost certain, so the 20 order is selected as the optimal order. The 20 order AR coefficients characteristics of the 400 cases of denoised ultrasonic scattered echo signals (including the signals of 200 cases of denatured tissues and 200 cases of normal tissues) are extracted. Then the ROC curves are employed to select the optimal characteristics of the AR coefficient, as shown in Fig. 8b.
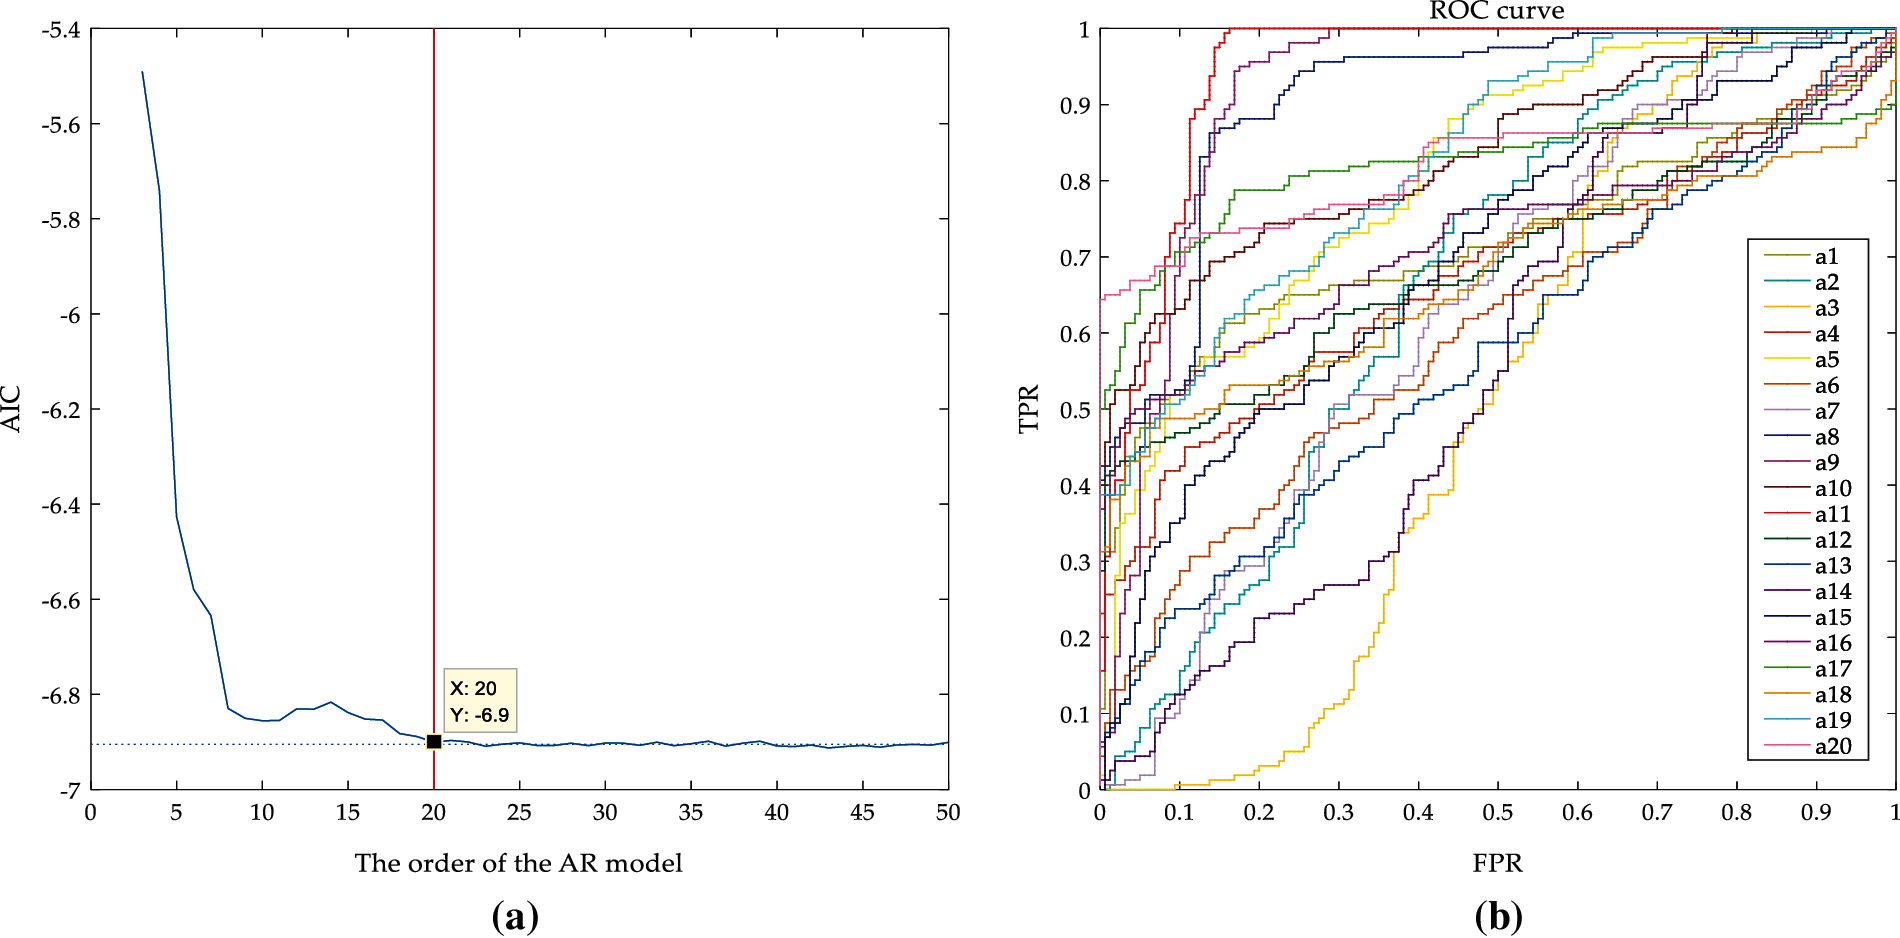
Figure 8: AIC and ROC graph (a) AIC of AR model under different orders; (b) The ROC curve of the different coefficients under the 20 order
Fig. 9 shows that the AUC values and standard errors of the various coefficients characteristics of the 20 order AR coefficients are calculated according to the ROC curve diagrams. It can be observed that the AUC of the a11 is the largest and its standard errors are the smallest, with values of 0.9391 and 0.0145, respectively. This means that the a11 coefficients characteristics have better separability and stability in the 20 order AR coefficient. Therefore, the a11 in the 20 order AR coefficients are selected as the characteristics of ultrasonic scattered echo signals.
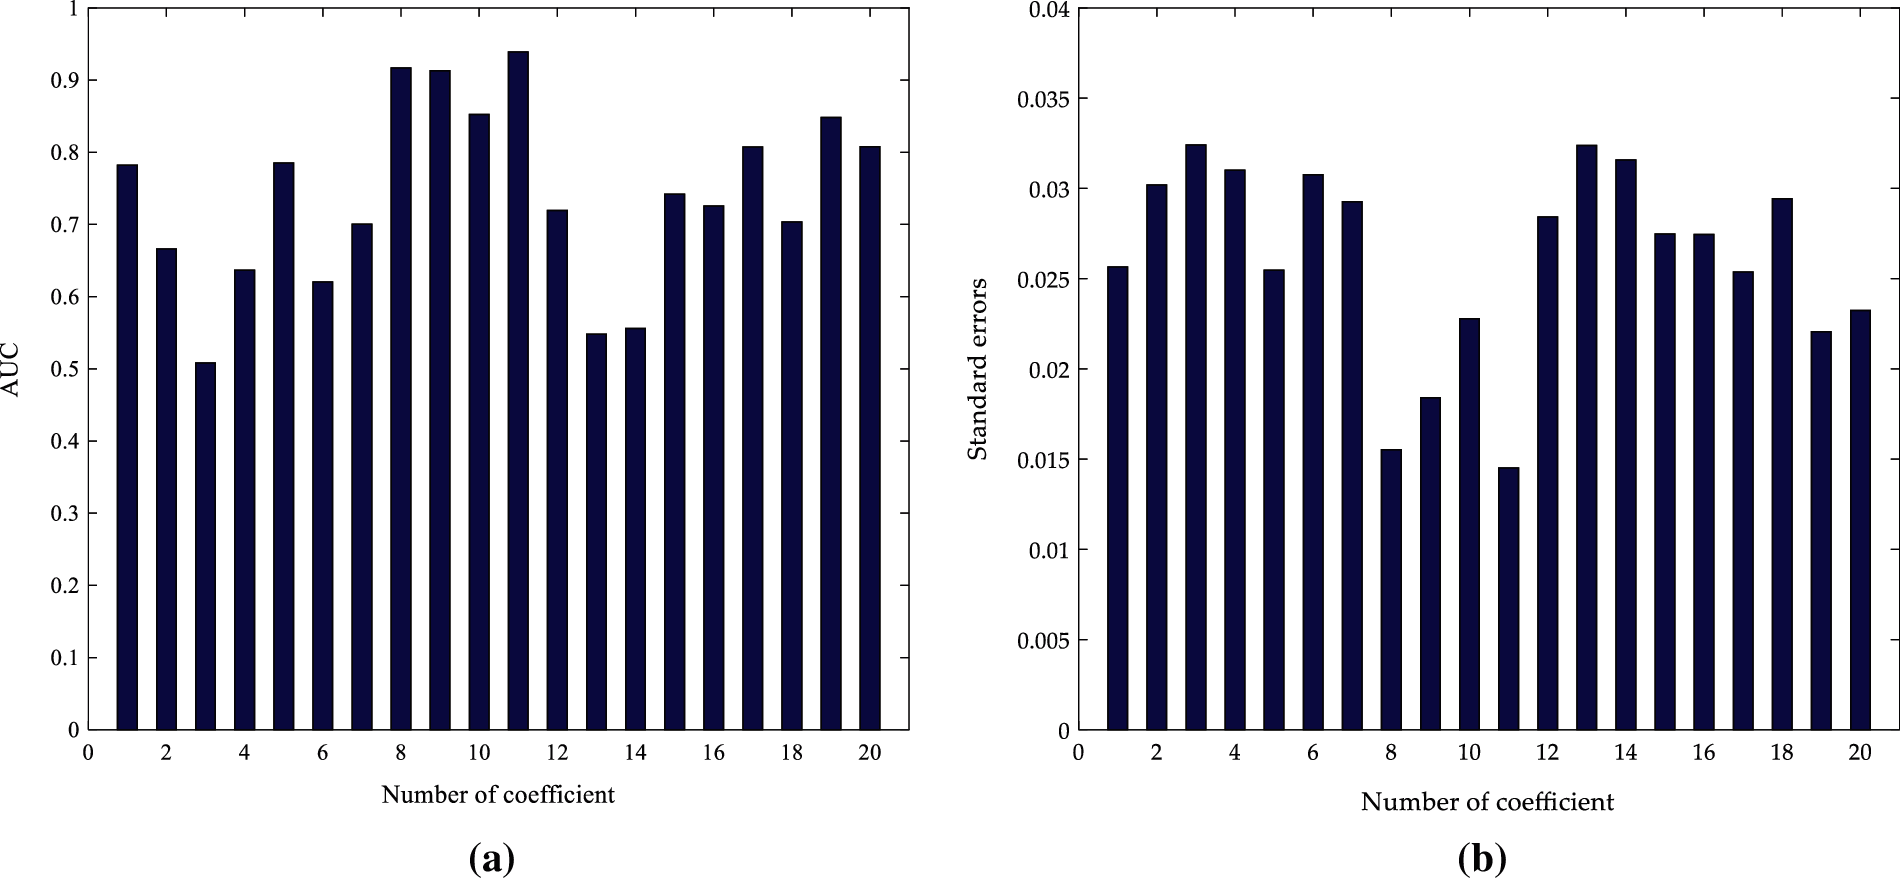
Figure 9: Comparison between the different order coefficients of 20 order AR model (a) AUC; (b) Standard errors
3.5 Comparison of Different Characteristics
The proposed method is applied to the ultrasonic scattered echo signals during HIFU treatment, and support vector machine (SVM) is used for recognition (100 cases of denatured tissues and 100 cases of normal tissue are training, and the rest 200 cases are testing). The radial basis function (RBF) is chosen as the kernel function. According to the results of cross-validation, the kernel parameter is set as 15.26 and the penalty factor is set as 17.24. Fig. 10 shows the recognition results of the IVMD-AR method. Abscissa 1 to 100 are denatured tissue samples, and abscissa 101 to 200 are normal tissue samples. The ordinate Type 1 represents the denatured tissue status, Type 2 represents the normal tissue status. It can be seen that the misidentification samples of denatured tissues are 12, and that of normal tissues are 2. The total recognition rate of denatured biological tissue was 93%.
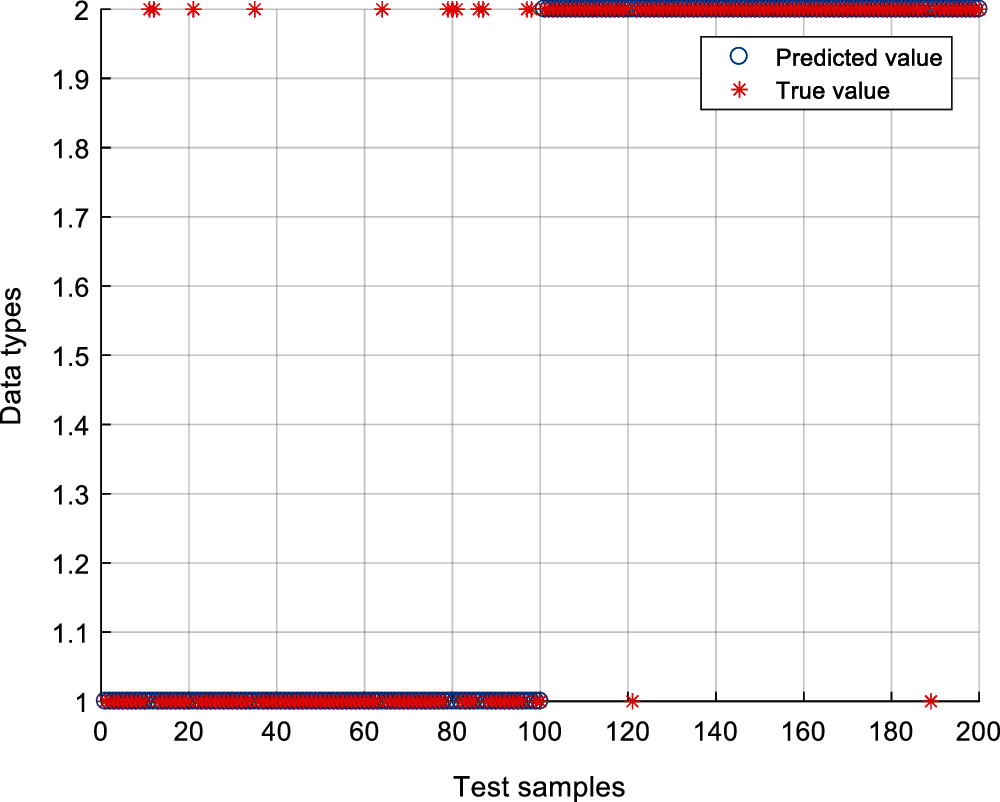
Figure 10: The recognition results of IVMD-AR method
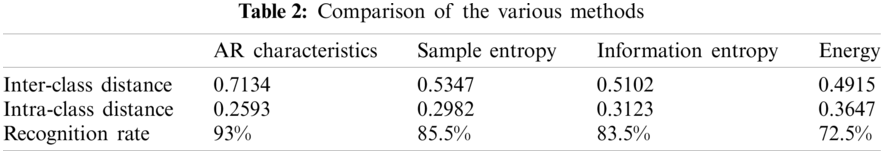
In order to further prove the advantages of the proposed method, the proposed method is compared with the existing methods. The sample entropy, information entropy, and energy characteristics of the denoised ultrasonic scattered echo signals are extracted, respectively. Then SVM is applied to calculate the recognition rate of the various methods. The various methods are compared according to the results of inter-class distance, intra-class distance, and recognition rate indicators, as shown in Table 2. It can be seen that the inter-class distance based on AR characteristics (the a11 in the 20 order AR coefficients) is higher and the intra-class distance is smaller than the existing methods. In addition, the SVM recognition rate based on AR characteristics is the highest in the comparison of various methods. The results show that compared with sample entropy, information entropy and energy characteristics identification methods, the proposed IVMD-AR method can more effectively identify denatured biological tissue.
In this paper, a new method based on the IVMD and AR model to identify denatured biological tissues is proposed. To solve the inherent disadvantages of VMD, a novel mode decomposition technique, IVMD is proposed to denoise ultrasonic scattered echo signals. The experiments show that compared with the VMD method, the IVMD method has the better denoising effect (Figs. 5 and 6). In addition, The AR model coefficients of two kinds of ultrasound scattered echo signals are calculated, the order and the optimal coefficients characteristics of the AR model are determined by AIC and ROC (Fig. 8). Then, The AUC values and standard errors of the various coefficients of the 20 order AR coefficients are calculated according to the ROC curve. The a11 in the 20 order AR coefficients are selected as the characteristics of ultrasonic scattered echo signals according to the results of AUC values and standard errors (Fig. 9). Finally, the various identification methods including AR coefficients, sample entropy, information entropy and energy are used to extract the characteristics of ultrasonic scattered echo signals, respectively. Meanwhile, SVM is applied to calculate the recognition rate of the various methods (Fig. 10). The various methods are compared according to the results of inter-class distance, intra-class distance, and recognition rate indicators. The results show that the inter-class distance of AR coefficients is the largest, and the intra-class distance of AR coefficients is the smallest, and the recognition rate of SVM classification of AR coefficients is the highest, up to 93% (Table 2). The above results support the hypothesis that the proposed IVMD-AR method can obtain a better denoising effect and identification effect in HIFU treatment. However, some parameters in the proposed method need to be set according to manual experience. We consider using the artificial intelligence method to optimize the algorithm parameters in future work.
This paper realizes the identification of denatured tissues based on IVMD and AR models during HIFU treatment. To solve the inherent disadvantages of VMD, the IVMD method is proposed based on VMD. The simulation results show that SNR of IVMD denoised signal is higher than VMD method and RMSE of IVMD denoised signal is lower than VMD method, which means that the IVMD method has a better denoising effect than the VMD method. AR model is used to extract the characteristics of ultrasonic scattered echo signals of biological tissues. The order of the AR model is determined to be 20 according to AIC and the 11th AR model coefficients are selected as the AR characteristics according to ROC curves. The support vector machine (SVM) is used to identify the denatured biological tissue. The results show that compared with sample entropy, information entropy, and energy methods, the proposed method has a better separability to identify whether biological tissues have been denatured and the recognition rate of denatured biological tissues was higher, up to 93.0%.
Funding Statement: The authors thank the financial support of Natural Science Foundation of China (U2031112), Natural Science Foundation of Hunan Province (2021JJ30469), and Natural Science Youth Foundation of Hunan Province (2020JJ5396).
Conflicts of Interest: The authors declare that they have no conflicts of interest to report regarding the present study.
1. Lang, H., Woo, Y., Wong, C. (2017). High-intensity focused ultrasound for treatment of symptomatic benign thyroid nodules: A prospective study. Radiology, 284(3), 897–906. DOI 10.1148/radiol.2017161640. [Google Scholar] [CrossRef]
2. You, Y., Wang, Z., Ran, H., Zheng, Y., Wang, D. et al. (2016). Nanoparticle-enhanced synergistic HIFU ablation and transarterial chemoembolization for efficient cancer therapy. Nanoscale, 8(7), 4324–4339. DOI 10.1039/C5NR08292G. [Google Scholar] [CrossRef]
3. Bailey, M., Khokhlova, V., Sapozhnikov, O., Kargl, S., Crum, L. (2003). Physical mechanisms of the therapeutic effect of ultrasound (A review). Acoustical Physics, 49(4), 369–388. DOI 10.1134/1.1591291. [Google Scholar] [CrossRef]
4. Feijoo, E., Sivaraman, A., Barret, E., Sanchez-Salas, R., Galiano, M. et al. (2016). Focal high-intensity focused ultrasound targeted hemiablation for unilateral prostate cancer: A prospective evaluation of oncologic and functional outcomes. European Urology, 69(2), 214–220. DOI 10.1016/j.eururo.2015.06.018. [Google Scholar] [CrossRef]
5. Yin, N., Hu, L., Xiao, Z., Liu, C., Chen, W. et al. (2018). Factors influencing thermal injury to skin and abdominal wall structures in HIFU ablation of uterine fibroids. International Journal of Hyperthermia, 34(8), 1298–1303. DOI 10.1080/02656736.2018.1433880. [Google Scholar] [CrossRef]
6. Seip, R., Ebbini, E. (1995). Noninvasive estimation of tissue temperature response to heating fields using diagnostic ultrasound. IEEE Transactions on Biomedical Engineering, 42(8), 828–839. DOI 10.1109/10.398644. [Google Scholar] [CrossRef]
7. Dragomiretskiy, K., Zosso, D. (2014). Variational mode decomposition. IEEE Transactions on Signal Processing, 62(3), 531–544. DOI 10.1109/TSP.2013.2288675. [Google Scholar] [CrossRef]
8. Li, J., Zhang, X., Tang, J. T. (2020). Noise suppression for magnetotelluric using variational mode decomposition and detrended fluctuation analysis. Journal of Applied Geophysics, 180(3), 104127. DOI 10.1016/j.jappgeo.2020.104127. [Google Scholar] [CrossRef]
9. Nagineni, S., Taran, S., Bajaj, V. (2018). Features based on variational mode decomposition for identification of neuromuscular disorder using EMG signals. Health Information Science and Systems, 6(1), 3327. DOI 10.1007/s13755-018-0050-4. [Google Scholar] [CrossRef]
10. Mishra, M., Banerjee, S., Thomas, D. C., Dutta, S., Mukherjee, A. (2018). Detection of third heart sound using variational mode decomposition. IEEE Transactions on Instrumentation and Measurement, 67(7), 1713–1721. DOI 10.1109/TIM.2018.2805198. [Google Scholar] [CrossRef]
11. Maheshwari, S., Pachori, R., Kanhangad, V., Bhandary, S., Acharya, U. (2017). Iterative variational mode decomposition based automated detection of glaucoma using fundus images. Computers in Biology and Medicine, 88(5), 142–149. DOI 10.1016/j.compbiomed.2017.06.017. [Google Scholar] [CrossRef]
12. Bhattacharjee, A., Fattah, S., Zhu, W., Ahmad, M. (2018). VMD-RiM: Rician modeling of temporal feature variation extracted from variational mode decomposed EEG signal for automatic sleep apnea detection. IEEE Access, 6, 77440–77453. DOI 10.1109/ACCESS.2018.2883062. [Google Scholar] [CrossRef]
13. Smruthy, A., Suchetha, M. (2017). Real-time classification of healthy and apnea subjects using ECG signals with variational mode decomposition. IEEE Sensors Journal, 17(10), 3092–3099. DOI 10.1109/JSEN.2017.2690805. [Google Scholar] [CrossRef]
14. Sun, G., Chen, T., Wei, Z., Sun, Y., Zang, H. et al. (2016). A carbon price forecasting model based on variational mode decomposition and spiking neural networks. Energies, 9(1), 54. DOI 10.3390/en9010054. [Google Scholar] [CrossRef]
15. Lahmiri, S. (2017). Comparing variational and empirical mode decomposition in forecasting day-ahead energy prices. IEEE Systems Journal, 11(3), 1907–1910. DOI 10.1109/JSYST.2015.2487339. [Google Scholar] [CrossRef]
16. Mensi, W., Hammoudeh, S., Shahzad, S., Shahbaz, M. (2017). Modeling systemic risk and dependence structure between oil and stock markets using a variational mode decomposition-based copula method. Journal of Banking & Finance, 75(9), 258–279. DOI 10.1016/j.jbankfin.2016.11.017. [Google Scholar] [CrossRef]
17. Lahmiri, S. (2016). Intraday stock price forecasting based on variational mode decomposition. Journal of Computational Science, 12, 23–27. DOI 10.1016/j.jocs.2015.11.011. [Google Scholar] [CrossRef]
18. Tang, G., Luo, G., Zhang, W., Yang, C., Wang, H. (2016). Underdetermined blind source separation with variational mode decomposition for compound roller bearing fault signals. Sensors, 16(6), 897. DOI 10.3390/s16060897. [Google Scholar] [CrossRef]
19. Zhang, S., Wang, Y., He, S., Jiang, Z. (2016). Bearing fault diagnosis based on variational mode decomposition and total variation denoising. Measurement Science and Technology, 27(7), 075101. DOI 10.1088/0957-0233/27/7/075101. [Google Scholar] [CrossRef]
20. Zhang, M., Jiang, Z., Feng, K. (2017). Research on variational mode decomposition in rolling bearings fault diagnosis of the multistage centrifugal pump. Mechanical Systems and Signal Processing, 93(1), 460–493. DOI 10.1016/j.ymssp.2017.02.013. [Google Scholar] [CrossRef]
21. Wang, Y., Markert, R., Xiang, J., Zheng, W. (2015). Research on variational mode decomposition and its application in detecting rub-impact fault of the rotor system. Mechanical Systems and Signal Processing, 60(2), 243–251. DOI 10.1016/j.ymssp.2015.02.020. [Google Scholar] [CrossRef]
22. Liu, B., Hu, W. P., Zou, X., Ding, Y. J., Qian, S. Y. (2019). Recognition of denatured biological tissue based on variational mode decomposition and multi-scale permutation entropy. Acta Physica Sinica, 68(2), 028702. DOI 10.7498/aps.68.20181772. [Google Scholar] [CrossRef]
23. Abd-Elhameed, W. M., Asmaa, M. A. (2021). Spectral solutions of linear and nonlinear BVPs using certain jacobi polynomials generalizing third-and fourth-Kinds of chebyshev polynomials. Computer Modeling in Engineering & Sciences, 126(3), 955–989. DOI 10.32604/cmes.2021.013603. [Google Scholar] [CrossRef]
24. Abd-Elhameed, W. M., Youssri, Y. H. (2019). Explicit shifted second-kind chebyshev spectral treatment for fractional riccati differential equation. Computer Modeling in Engineering & Sciences, 121(3), 1029–1049. DOI 10.32604/cmes.2019.08378. [Google Scholar] [CrossRef]
25. Abd-Elhameed, W. M., Youssri, Y. H. (2015). New spectral solutions of multi-term fractional-order initial value problems with error analysis. Computer Modeling in Engineering & Sciences, 105(5), 375–398. [Google Scholar]
26. Samimi, K., White, J., Brace, C., Varghese, T. (2017). Monitoring microwave ablation of ex vivo bovine liver using ultrasonic attenuation imaging. Ultrasound in Medicine & Biology, 43(7), 1441–1451. DOI 10.1016/j.ultrasmedbio.2017.03.010. [Google Scholar] [CrossRef]
27. Zhang, S., Xu, R., Shang, S., Han, Y., Liu, S. et al. (2018). In vivo monitoring of microwave ablation in a porcine model using ultrasonic differential attenuation coefficient intercept imaging. International Journal of Hyperthermia, 34(8), 1157–1170. DOI 10.1080/02656736.2018.1437477. [Google Scholar] [CrossRef]
28. Johnson, S., Dillon, C., Odeen, H., Parker, D., Christensen, D. et al. (2016). Development and validation of a MRgHIFU non-invasive tissue acoustic property estimation technique. International Journal of Hyperthermia, 32(7), 723–734. DOI 10.1080/02656736.2016.1216184. [Google Scholar] [CrossRef]
29. Tsui, P., Wan, Y. (2016). Effects of fatty infiltration of the liver on the shannon entropy of ultrasound backscattered signals. Entropy, 18(9), 341. DOI 10.3390/e18090341. [Google Scholar] [CrossRef]
30. Mobasheri, S., Behnam, H., Rangraz, P., Tavakkoli, J. (2016). Radio frequency ultrasound time series signal analysis to evaluate high-intensity focused ultrasound lesion formation status in tissue. Journal of Medical Signals & Sensors, 6(2), 91–98. DOI 10.4103/2228-7477.181032. [Google Scholar] [CrossRef]
31. Melnyk, I., Matthews, B., Valizadegan, H., Banerjee, A., Oza, N. (2016). Vector autoregressive model-based anomaly detection in aviation systems. Journal of Aerospace Information Systems, 13(4), 161–173. DOI 10.2514/1.I010394. [Google Scholar] [CrossRef]
32. Sh-Hussain, H., Mohamad, M., Zahilah, R., Ting, C., Ismail, K. et al. (2017). Classification of heart sound signals using autoregressive model and hidden markov model. Journal of Medical Imaging and Health Informatics, 7(4), 755–763. DOI 10.1166/jmihi.2017.2079. [Google Scholar] [CrossRef]
33. Abbruzzini, T., Brandani, C., Toledo, F., Cerri, C. et al. (2017). Soil carbon and nitrogen stocks in sugarcane systems by Bayesian conditional autoregressive model-an unbiased prediction strategy. Carbon Management, 8(2), 207–214. DOI 10.1080/17583004.2017.1309204. [Google Scholar] [CrossRef]
34. Akaike, H. (1987). Factor analysis and AIC. Psychometrika, 52(3), 317–332. DOI 10.1007/BF02294359. [Google Scholar] [CrossRef]
35. Hanley, J., McNeil, B. (1982). The meaning and use of the area under a receiver operating characteristic (ROC) curve. Radiology, 143(1), 29–36. DOI 10.1148/radiology.143.1.7063747. [Google Scholar] [CrossRef]
36. Shibata, R. (1976). Selection of the order of an autoregressive model by Akaike’s information criterion. Biometrika, 63(1), 117–126. DOI 10.1093/biomet/63.1.117. [Google Scholar] [CrossRef]
 | This work is licensed under a Creative Commons Attribution 4.0 International License, which permits unrestricted use, distribution, and reproduction in any medium, provided the original work is properly cited. |