| Computer Modeling in Engineering & Sciences |
DOI: 10.32604/cmes.2022.021165
ARTICLE
Rock Strength Estimation Using Several Tree-Based ML Techniques
1School of Resources and Safety Engineering, Central South University, Changsha, 410083, China
2Department of Urban Planning, Engineering Networks and Systems, Institute of Architecture and Construction, South Ural State University, Chelyabinsk, 454080, Russia
3Faculty of Civil Engineering, Semnan University, Semnan, 35131-19111, Iran
4School of Resources and Safety Engineering, Central South University, Changsha, 410083, China
5Department of Urban Planning, Engineering Networks and Systems, Institute of Architecture and Construction, South Ural State University, Chelyabinsk, 454080, Russia
6Department of Geology, Mine Surveying and Mineral Processing, Nosov Magnitogorsk State Technical University, Magnitogorsk, 455000, Russia
7Department of Civil Engineering, College of Engineering, King Khalid University, Abha, 61421, Saudi Arabia
8Department of Civil Engineering, High Institute of Technological Studies, Mrezgua University Campus, Nabeul, 8000, Tunisia
*Corresponding Author: Danial Jahed Armaghani. Email: danialarmaghani@susu.ru
Received: 30 December 2021; Accepted: 21 April 2022
Abstract: The uniaxial compressive strength (UCS) of rock is an essential property of rock material in different relevant applications, such as rock slope, tunnel construction, and foundation. It takes enormous time and effort to obtain the UCS values directly in the laboratory. Accordingly, an indirect determination of UCS through conducting several rock index tests that are easy and fast to carry out is of interest and importance. This study presents powerful boosting trees evaluation framework, i.e., adaptive boosting machine, extreme gradient boosting machine (XGBoost), and category gradient boosting machine, for estimating the UCS of sandstone. Schmidt hammer rebound number, P-wave velocity, and point load index were chosen as considered factors to forecast UCS values of sandstone samples. Taylor diagrams and five regression metrics, including coefficient of determination (R2), root mean square error, mean absolute error, variance account for, and A-20 index, were used to evaluate and compare the performance of these boosting trees. The results showed that the proposed boosting trees are able to provide a high level of prediction capacity for the prepared database. In particular, it was worth noting that XGBoost is the best model to predict sandstone strength and it achieved 0.999 training R2 and 0.958 testing R2. The proposed model had more outstanding capability than neural network with optimization techniques during training and testing phases. The performed variable importance analysis reveals that the point load index has a significant influence on predicting UCS of sandstone.
Keywords: Uniaxial compressive strength; rock index tests; machine learning techniques; boosting tree
The uniaxial compressive strength (UCS) of rock is the maximum compressive stress that rock can bear before failure under uniaxial compressive load [1]. It is one of the most basic mechanical parameters of rock mass in engineering investigation [2,3]. UCS has been widely recognized in rock foundation design [4], tunnel surrounding rock classification [5], rock mass quality evaluation [6], etc. The direct way to obtain the UCS of rock needs to be in accord with the suggestions by the international society for rock mechanics (ISRM) [1], and it is needed to make rock blocks into standard specimens and carry out rock tests in the laboratory. However, this measurement process is restricted by many conditions. For example, rock samples are required to be complete and should not contain joints and fissures. Furthermore, rock sampling and specimen processing and transportation have strict restrictions, and it is challenging to obtain the ideal rock core in highly fractured, weak, and weathered rock masses. Not only that, conducting the rock tests to obtain UCS is time-consuming and expensive [3,7,8]. Accordingly, it is requisite to find an economical and easy method to estimate the UCS of rock accurately [9].
Aladejare et al. [10] summarized the empirical prediction methodologies of UCS in rock. Some empirical equations for predicting UCS are listed in Table 1. The empirical estimation methods adopt the simple regression analysis to fit the correlation between the single or multiple physical or other mechanical parameters and UCS in rock. The physical parameters include Equotip hardness number [11], Schmidt Hammer rebound number (

Apart from empirical equations, multiple regression analyses and their results have been widely suggested in the literature, as shown in Table 2. Jalali et al. [24] applied

With the development of artificial intelligence, intelligent techniques have been widely used to solve problems in science and engineering [32–41]. In civil engineering [42–44], they have been used in different fields such as the estimation of the sidewall displacement of the underground caverns [45], the prediction of water inflow into drill and blast tunnels [46], evaluation of disc cutters life of tunnel boring machine [47], and so on. Additionally, artificial intelligence and machine learning (ML) were highlighted by researchers as effective and relatively accurate in predicting rock mass and material properties [48–52]. Fuzzy inference systems (FIS) is a fuzzy information processing system based on fuzzy set theory and fuzzy inference. The fuzzy logic can reduce the uncertainty caused by unknown and variation and promote the application of FIS in rock mechanics [53]. The FIS widely used to predict the UCS can be divided into the Sugeno FIS [12,54], Mamdani FIS [54–56], and adaptive neuro-fuzzy inference system (ANFIS) [57–59]. FIS is simple in structure and is very effective in uncertain environments. However, the prediction results of FIS are likely to be based on uncertain assumptions, which leads to the inaccuracy of the prediction results under some conditions.
Genetic programming (GP) and gene expression programming (GEP) are parts of evolutionary computation, and they are based on the genetic algorithm (GA). GEP and GP adopt a generalized hierarchical computer program to describe a problem. Individual formation requires terminal and function symbols, which are different from GA. Wang et al. [60] adopted the GEP to build the relationship between
ML is the leading method to implement artificial intelligence, and it can be divided into supervised learning and unsupervised learning. Based on statistics, ML builds the nonlinear mappings of input and output variables by analyzing complex internal relationships behind data. The supervised learning models are frequently used to predict the UCS of rock, and they include artificial neural network (ANN), support vector machine (SVM), k-nearest neighbor (KNN), Gaussian regression, regression tree, and ensemble models. ML has a strong ability to extract information from data, and it has increasingly applied in the prediction of UCS of rock recently. For instance, Rahman et al. [63] adopted the neutral network to fit the relationship between
As the crucial part of ML, the boosting tree models have been increasingly used in geotechnical engineering, such as rockburst prediction [67–71], tunnel boring machine advance prediction [72], blast-induced ground vibration [73], and so on. Boosting trees have more outstanding performance than other models, such as ANN, SVM, etc. [69,74]. However, there are no studies about applying and comparing the application of boosting trees in predicting UCS of rock. To fill this gap, in this paper, three boosting trees models, adaptive boosting machine (AdaBoost), XGBoost, and category gradient boosting machine (CatBoost), are introduced to build the intelligent models for predicting the UCS of sandstone. The three models are developed and evaluated to compare their performance and choose an optimal model for estimating UCS of sandstone.
Boosting is a strategy to build ensemble models, and it trains multiple weak learners according to the training set and combines these weak learners into a strong model. AdaBoost was proposed by Freund et al. [75], which is suitable for regression and classification and can improve the capability of the tree. In this study, there is a detailed introduction about AdaBoost for regression.
As shown in Fig. 1, before performing the regression task, there is needed to determine the number of trees (i.e., the number of iterations). Firstly, the weight of each sample in the training set is initialized. If the number of total samples is

Figure 1: The flowchart to build AdaBoost models
Gradient boosting [76] is the enhancement of AdaBoost, which is applicable to any differentiable loss functions. The negative gradient of the loss function in the current model is used to train a new weak learner, and then the trained weak learner is added to the existing model.
XGBoost is the development of gradient boosting [77], and it employs the Taylor second-order expansion of the loss function and adds the regularization term to control the complexity of the model. Fig. 2 shows the steps to build XGBoost. The loss function in XGBoost can be expressed as Eq. (1).
where

Figure 2: The flowchart to develop XGBoost models
CatBoost was proposed by Yandex in 2017 [78], and it is based on gradient boosting and can deal with the category data. CatBoost converts category data to numeric data to prevent overfitting [79]. CatBoost can effectively process the category data after performing random permutations. By training different base learners with multiple permutations, CatBoost can obtain the unbiased estimation of gradients to reduce the impact of gradient bias and improve the robustness.
Fig. 3 displays the flowchart to construct CatBoost. The oblivious trees are chosen as the base learners in CatBoost, and in the trees, the judgment conditions for each node in each layer are the same. The oblivious trees are relatively simple and can improve the prediction speed when fitting the model. CatBoost has fewer hyperparameters and better robustness, and it is easy to use.

Figure 3: The flowchart to construct CatBoost models
The data used in this study is the same data applied by Armaghani et al. [80]. The data was collected from Dengkil, Selangor, Malaysia. The sandstone composed of 85% mineral quartz and 15% clay is the primary rock in this area. To develop boosting trees, 108 sandstone blocks were sampled in the field, and these blocks were cored and processed into the standard samples according to the suggestions by the ISRM [1]. The prepared samples were subjected to rock mechanics testing in the laboratory. 108 samples with
The database is statistically analyzed, and Table 3 lists the statistical information of the collected database, and the range of variables, mean value, standard deviation, and quantile are listed. UCS is between 23.2 and 66.8 MPa, and the rock belongs to low to medium strength according to ISRM, as shown in Fig. 4. The skew in input and output variables is not zero, indicating that the data distribution is asymmetrical. The kurtosis is less than zero, demonstrating that the database is dispersive. The scatter distributions between any two variables are displayed in Fig. 5. Fig. 6 shows the box plots of four parameters. The mean values of the four variables are greater than the median, and the box plots are right-skewed distributions. Eq. (2) is applied to calculate the correlation coefficient among all parameters. Fig. 7 exhibits the heatmap of the calculation results. In the heatmap, darker colors indicate higher correlations. It can be seen that four parameters are positively correlated. UCS has a strong correlation with


Figure 4: The rock classification based on UCS suggested by ISRM [81]


Figure 5: The scatter and histogram distributions of the database

Figure 6: The box plots of four variables

Figure 7: The heatmap of the correlation coefficients between variables
3.3 Step-by-Step Study Flowchart
The database was established to construct the tree-base models for foretelling the UCS of sandstone. According to Fig. 8, the database is randomly split into two portions, one portion accounted for 80% of the database is adopted to train the tree-based models, and another portion accounted for 20% is utilized to evaluate the capabilities of models. The regression trees are developed, and three different boosting strategies are implemented to combine these trees for obtaining the final ensemble models. A ranking system composed of five regression metrics is introduced to evaluate the performance of three models during the training and testing stages. AdaBoost, XGBoost, and CatBoost are ranked and compared according to the ranking system. Finally, the relative importance of input parameters in the three models is calculated based on the principles of trees growth.

Figure 8: The technique flowchart to build tree-based models for predicting UCS in sandstone
For developing the tree-based models, the database is divided into the training parts (80%) and the testing parts (20%). The training parts include 86 datasets and are used to train AdaBoost, XGBoost, and CatBoost. Eq. (3) is adopted to process the input data. Three Python libraries, Scikit-learn [82], XGBoost [78], and CatBoost [77], are applied to develop AdaBoost, XGBoost, and CatBoost models, respectively.
where
The regression trees are the base learners in the three models, and the number of trees controls the potential and complexity of the model. The number of trees needs to be reasonably determined to prevent overfitting, and for simplicity, other hyperparameters utilize the default value in Python libraries. In AdaBoost, the distribution of 86 training datasets is initialized, and the first tree is developed. Then, the linear loss function is used to evaluate the error between the predicted and actual UCS. The learning rate is set to 1, indicating no shrinkage when updating the model. Afterward, the tree is added to the AdaBoost to minimize the error continuously. Fig. 9 shows the R2 variation with the increase of trees. When the number of trees reaches 95, AdaBoost has the highest R2 and lowest error. Accordingly, the number of trees in AdaBoost is set to 95. Table 4 lists the primary hyperparameters of AdaBoost in this study. After building all the trees, AdaBoost combines the outcomes of 95 trees as the final output.

Figure 9: The R2 variation with the increasing of trees during the training process in AdaBoost

The training process of XGBoost is similar to AdaBoost by appending trees in sequence to reduce the error. The learning rate is 0.3, which specifies the shrunk step size when updating the model. The maximum depth in trees controls the complexity, and it is set to 6. Additionally, XGBoost increases regularization terms to prevent overfitting for improving the potential. Table 5 presents these parameters values. From 0 to 100, the tree is added to XGBoost in turn. Fig. 10 shows the R2 variation, and the curve is smooth. After the number of trees gets to 35, training R2 does not vary. Therefore, the number of trees is 35.


Figure 10: The R2 variation with the increasing of trees during the training process in XGBoost
Compared to XGBoost and AdaBoost, CatBoost can automatically determine the learning rate according to the training set and iteration number, and the automatically determined value is close to the optimal. Additionally, the oblivious tree is adopted as the base learners, and its depth is set to 6. CatBoost also adds random strength, which is used to avoid overfitting. The default iterations are 1000 in the Python CatBoost library. To find an appropriate iterations number, the iterations increases from 10 to 1000 in steps of 10. Fig. 11 depicts the R2 variation during the training process in CatBoost. When the iterations reach 1000, the R2 is the maximum. Accordingly, the number of iterations is set to 1000, and the automatically determined learning rate is 0.25. Table 6 lists the primary parameters to develop the CatBoost model for predicting UCS in sandstone.

Figure 11: The R2 variation with the increasing of trees during the training process in CatBoost

5.1 Model Performance Evaluation
AdaBoost, XGBoost, and CatBoost are built according to the 86 training samples and their corresponding parameters. The remaining 22 testing samples are utilized to evaluate the performance of the three models. R2, root mean square error (RMSE), mean absolute error (MAE), variance account for (VAF), and A-20 index are calculated according to the predicted and measured UCS. These five indicators are widely recognized as the regression evaluation index [83–87]. Eqs. (4)–(7) show the equations for computing the RMSE, MAE, VAF, and A-20 index, respectively.
where
Figs. 12–14 exhibit the training and testing results in AdaBoost, XGBoost, and CatBoost, respectively. In these figures, the horizontal axis represents the actual UCS, and the vertical axis means the predicted UCS. When the predicted value is equal to the actual, the corresponding point falls in the red line. The points are closer to the red line, and the model has better estimation performance. The points representing XGBoost are closest to the red line, and XGBoost has the optimal capability. Additionally, the points between two purple dotted lines mean their predicted values are graters than 0.8 times the actual values and less than 1.2 times the actual values. Only the points predicted by Adaboost are outside the two purple dotted lines, and its performance is worst.

Figure 12: The training and testing results in AdaBoost
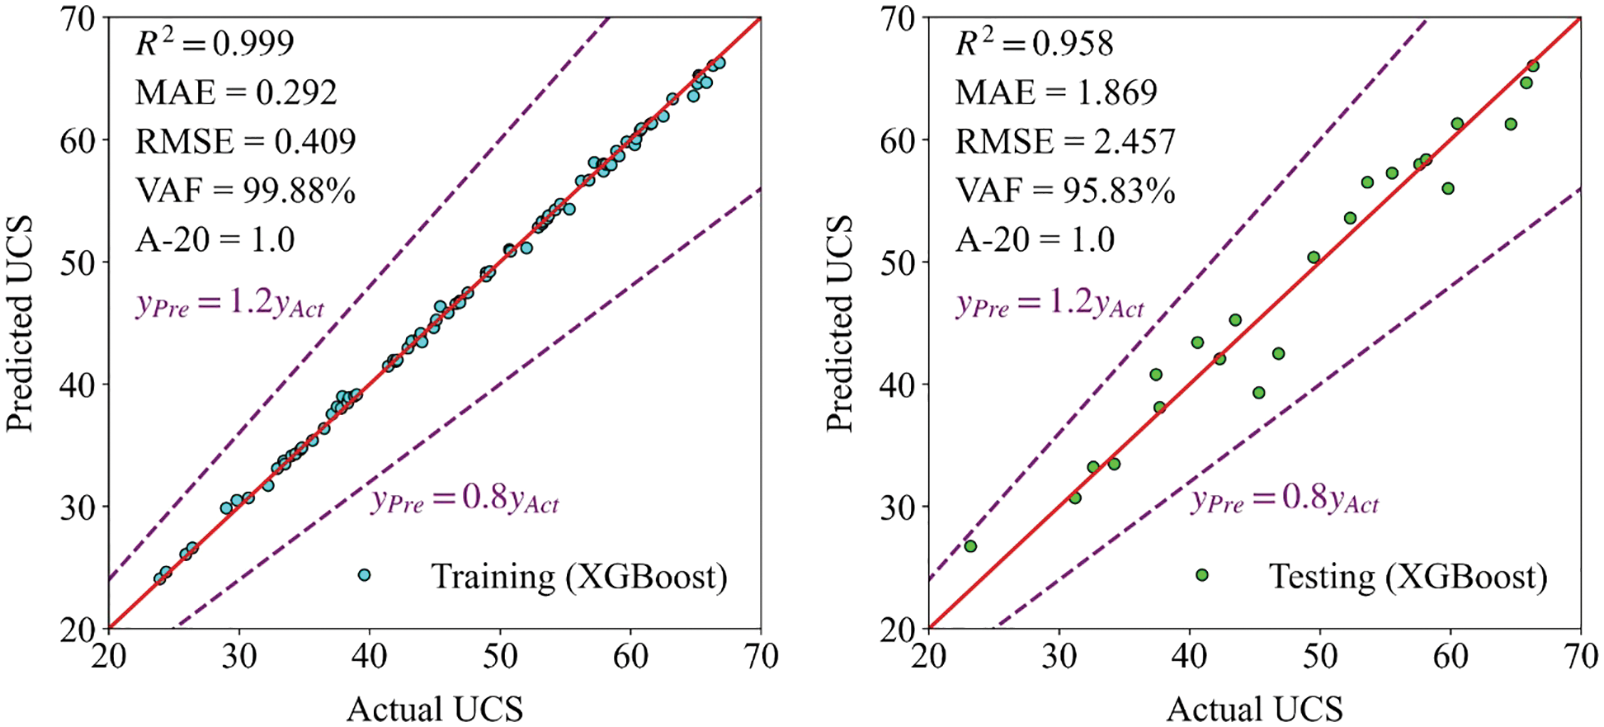
Figure 13: The training and testing results in XGBoost

Figure 14: The training and testing results in CatBoost
The Taylor diagrams [88] are introduced to analyze the training and testing results of three models, as shown in Fig. 15. Taylor diagrams combine the correlation coefficient, centered RMSE, and standard deviation into one polar diagram according to their cosine relationship (Eq. (8)). In Fig. 15, the distance from the origin means the standard deviation, and the angle from clockwise represents the correlation coefficient. It can be seen that the standard deviations of predicted UCS by three models are lower than that of actual UCS. Furthermore, the reference point with pentastar shape reflects the actual UCS, and other points nearer to the reference indicate that their predicted values have lower centered RMSE and their corresponding models have the superior capability. In the training and testing stages, XGBoost performs best, followed by CatBoost, and finally AdaBoost.
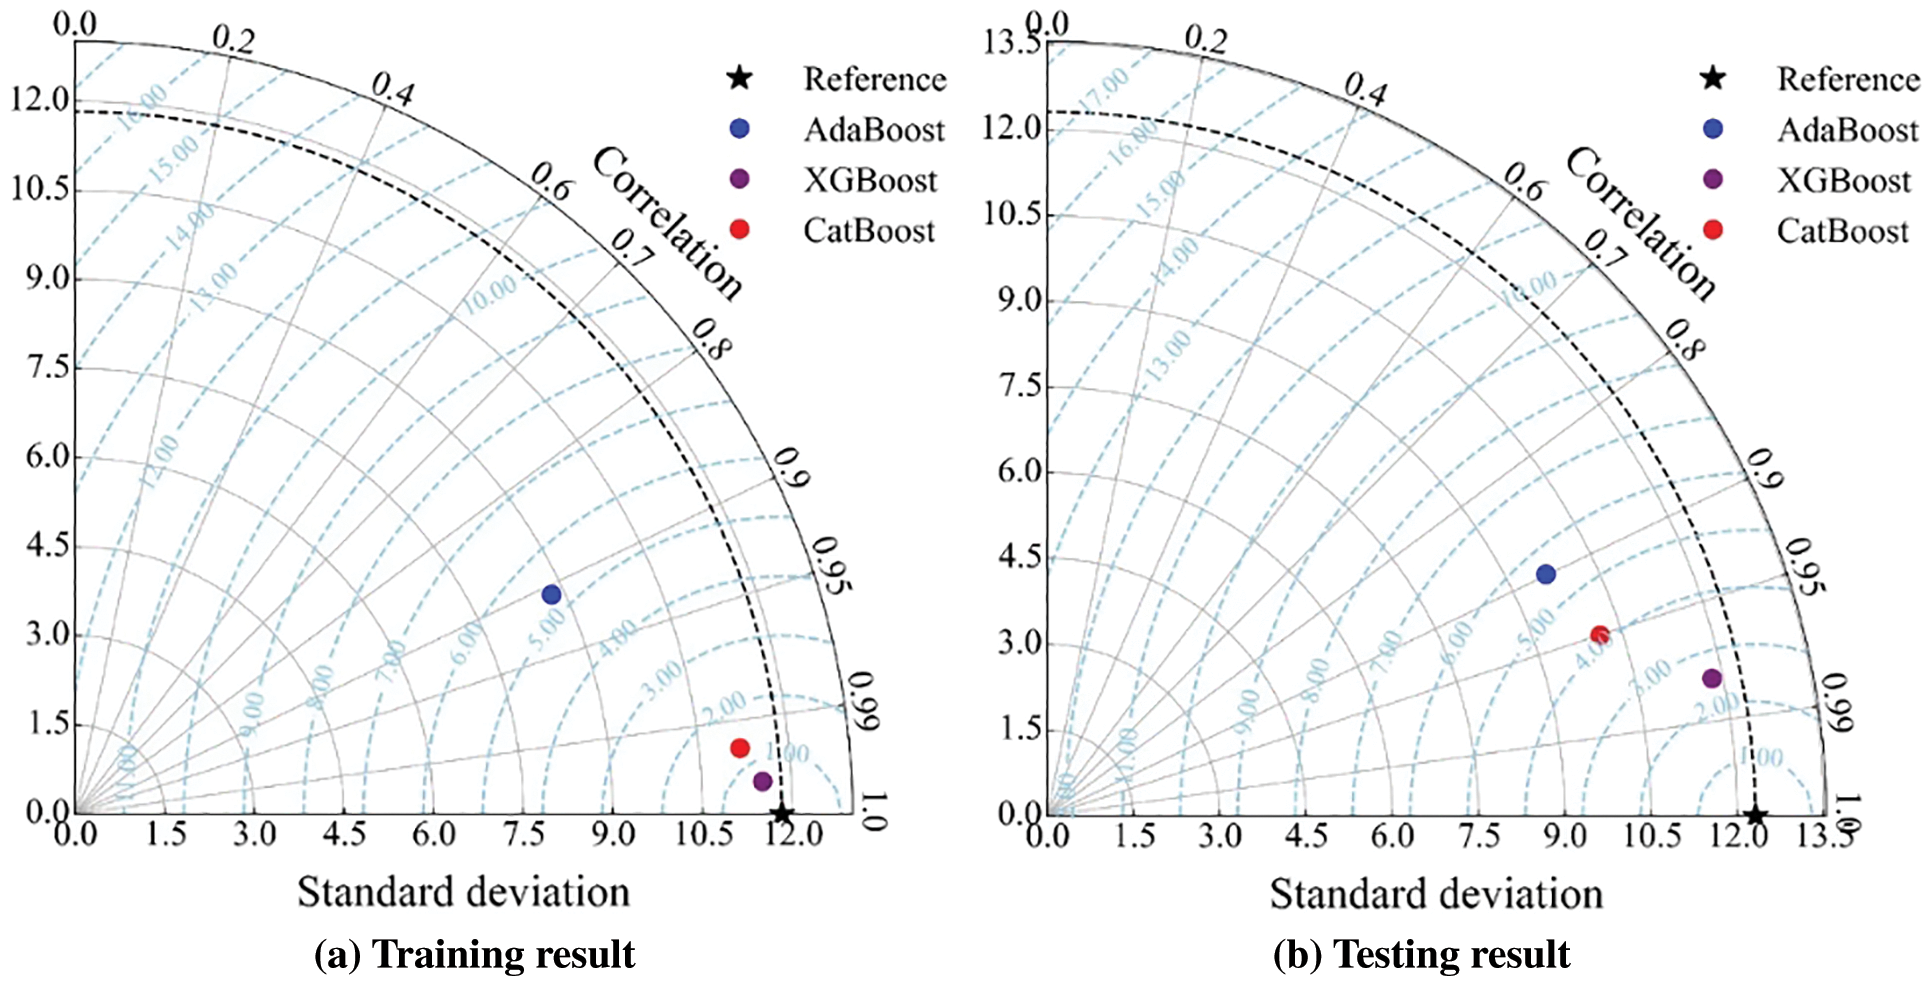
Figure 15: The Taylor diagrams of training and testing results
where
A ranking system comprised of R2, RMSE, MAE, VAF, and A-20 index is implemented to rank the three models comprehensively, considering the performance in the training and testing processes. Table 7 presents the ranking system. There are three models, the score is from 3 to 1, and the model with better performance can get a higher score. For training or testing datasets, the total score is the sum of scores in five metrics. The final score of a model is the sum of scores in training and testing sets. The model with a higher final score has a preferable potential in both training and testing samples. The comprehensive performance ranking is: XGBoost > CatBoost > AdaBoost.

In the previous section, XGBoost was selected as the most accurate model in this research to predict sandstone strength. In this section, XGBoost is compared with the best model proposed by Armaghani et al. [80], as shown in Table 8. In terms of R2, RMSE, and VAF in training and testing sets, XGBoost can perform better than the imperialist competitive algorithm (ICA)-ANN. Not only that, ICA-ANN utilized the ICA to tune the weights and biases of ANN and had better ability than ANN, but the optimization process done by Armaghani et al. [80], was complicated and time-consuming. By contrast, XGBoost has fewer parameters to tune and is easy to use, and it has more strength to predict the UCS of sandstone samples. It is important to note that the ultimate aim of a predictive model for rock strength is to develop a model which should have several features, i.e., be accurate enough, easy to apply as well as applicable in practice. Additionally, the performance of XGBoost for predicting UCS of rock is compared with other models proposed by other scholars recently, as shown in Table 9. XGBoost has more powerful ability to predict UCS than other models.


To validate the application of the proposed boosting trees, 14 sandstone blocks were processed into standard specimens, and

Figure 16: The predicted results of 14 validation datasets
7 The Relative Importance of Input Parameters
The relative importance of input features can be calculated during the growth of the tree [91]. The significant parameters have a crucial impact on the performance of the model. Obtaining the relative importance of input parameters is beneficial to understanding the development principle behind the model. Fig. 17a shows the relative importance of

Figure 17: The relative importance of input parameters: (a) The variable importance in three models; (b) The mean importance of variables

Figure 18: The ICE plot to analyze the dependence of variables on UCS
In this research, 108 samples were used to investigate physical and mechanical properties in sandstone. Tree-based models are implemented to build intelligent models for predicting UCS of sandstone based on the established database. Considering the training and testing performance by Taylor diagrams and ranking system, XGBoost is the outstanding tree model to predict UCS in sandstone. The proposed XGBoost model has more strong learning ability to build the relationship between considered factors and UCS than other models developed by other researchers. Additionally, XGBoost has fewer parameters to tune than other models, such as ANN and GEP, and it is simple to use. The developed boosting trees solution is suitable for practical engineering, such as mine, quarry, tunnel, etc., which need to evaluate the UCS of rock with non-destructive methods accurately and timely. However, the considered variables are limited, and only three parameters are applied to foretell UCS. Besides, the combination of XGBoost and optimization techniques can improve the capacity to estimate UCS.
Funding Statement: The research was funded by Act 211 Government of the Russian Federation, Contract No. 02.A03.21.0011.
Conflicts of Interest: The author declare that they have no conflicts of interest to report regarding the present study.
References
1. Ulusay, R. (2014). The ISRM suggested methods for rock characterization, testing and monitoring: 2007--2014. Switzerland: Springer. [Google Scholar]
2. He, M., Zhang, Z., Zhu, J., Li, N. (2022). Correlation between the constant mi of Hoek-Brown criterion and porosity of intact rock. Rock Mechanics and Rock Engineering, 55(2), 923–936. DOI 10.1007/s00603-021-02718-2. [Google Scholar] [CrossRef]
3. Xiao, P., Li, D., Zhao, G., Liu, M. (2021). Experimental and numerical analysis of mode I fracture process of rock by semi-circular bend specimen. Mathematics, 9(15), 1769. DOI 10.3390/math9151769. [Google Scholar] [CrossRef]
4. Rezazadeh, S., Eslami, A. (2017). Empirical methods for determining shaft bearing capacity of semi-deep foundations socketed in rocks. Journal of Rock Mechanics and Geotechnical Engineering, 9(6), 1140–1151. DOI 10.1016/j.jrmge.2017.06.003. [Google Scholar] [CrossRef]
5. Xue, Y., Kong, F., Li, S., Zhang, L., Zhou, B. et al. (2020). Using indirect testing methods to quickly acquire the rock strength and rock mass classification in tunnel engineering. International Journal of Geomechanics, 20(5), 5020001. DOI 10.1061/(ASCE)GM.1943-5622.0001633. [Google Scholar] [CrossRef]
6. Wang, H., Lin, H., Cao, P. (2017). Correlation of UCS rating with Schmidt hammer surface hardness for rock mass classification. Rock Mechanics and Rock Engineering, 50(1), 195–203. DOI 10.1007/s00603-016-1044-7. [Google Scholar] [CrossRef]
7. He, M., Zhang, Z., Zhu, J., Li, N., Li, G. et al. (2021). Correlation between the rockburst proneness and friction characteristics of rock materials and a new method for rockburst proneness prediction: Field demonstration. Journal of Petroleum Science and Engineering, 205(12), 108997. DOI 10.1016/j.petrol.2021.108997. [Google Scholar] [CrossRef]
8. Yang, B., He, M., Zhang, Z., Zhu, J., Chen, Y. (2022). A new criterion of strain rockburst in consideration of the plastic zone of tunnel surrounding rock. Rock Mechanics and Rock Engineering, 55(3), 1777–1789. [Google Scholar]
9. Aladejare, A. E. (2020). Evaluation of empirical estimation of uniaxial compressive strength of rock using measurements from index and physical tests. Journal of Rock Mechanics and Geotechnical Engineering, 12(2), 256–268. DOI 10.1016/j.jrmge.2019.08.001. [Google Scholar] [CrossRef]
10. Aladejare, A. E., Alofe, E. D., Onifade, M., Lawal, A. I., Ozoji, T. M. et al. (2021). Empirical estimation of uniaxial compressive strength of rock: Database of simple, multiple, and artificial intelligence-based regressions. Geotechnical and Geological Engineering, 39(6), 4427–4455. [Google Scholar]
11. Corkum, A., Asiri, Y., El Naggar, H., Kinakin, D. (2018). The Leeb hardness test for rock: An updated methodology and UCS correlation. Rock Mechanics and Rock Engineering, 51(3), 665–675. DOI 10.1007/s00603-017-1372-2. [Google Scholar] [CrossRef]
12. Heidari, M., Mohseni, H., Jalali, S. H. (2018). Prediction of uniaxial compressive strength of some sedimentary rocks by fuzzy and regression models. Geotechnical and Geological Engineering, 36(1), 401–412. DOI 10.1007/s10706-017-0334-5. [Google Scholar] [CrossRef]
13. Dinçer, İ., Acar, A., Ural, S. (2008). Estimation of strength and deformation properties of Quaternary caliche deposits. Bulletin of Engineering Geology and the Environment, 67(3), 353–366. DOI 10.1007/s10064-008-0146-1. [Google Scholar] [CrossRef]
14. Aliyu, M. M., Shang, J., Murphy, W., Lawrence, J. A., Collier, R. et al. (2019). Assessing the uniaxial compressive strength of extremely hard cryptocrystalline flint. International Journal of Rock Mechanics and Mining Sciences, 113(11), 310–321. DOI 10.1016/j.ijrmms.2018.12.002. [Google Scholar] [CrossRef]
15. Fereidooni, D. (2016). Determination of the geotechnical characteristics of hornfelsic rocks with a particular emphasis on the correlation between physical and mechanical properties. Rock Mechanics and Rock Engineering, 49(7), 2595–2608. DOI 10.1007/s00603-016-0930-3. [Google Scholar] [CrossRef]
16. Rahman, T., Sarkar, K. (2021). Lithological control on the estimation of uniaxial compressive strength by the P-wave velocity using supervised and unsupervised learning. Rock Mechanics and Rock Engineering, 54(6), 3175–3191. DOI 10.1007/s00603-021-02445-8. [Google Scholar] [CrossRef]
17. Uyanık, O., Sabbağ, N., Uyanık, N. A., Öncü, Z. (2019). Prediction of mechanical and physical properties of some sedimentary rocks from ultrasonic velocities. Bulletin of Engineering Geology and the Environment, 78(8), 6003–6016. DOI 10.1007/s10064-019-01501-6. [Google Scholar] [CrossRef]
18. Török, Á., Vásárhelyi, B. (2010). The influence of fabric and water content on selected rock mechanical parameters of travertine, examples from Hungary. Engineering Geology, 115(3–4), 237–245. DOI 10.1016/j.enggeo.2010.01.005. [Google Scholar] [CrossRef]
19. Sharma, L., Vishal, V., Singh, T. (2017). Developing novel models using neural networks and fuzzy systems for the prediction of strength of rocks from key geomechanical properties. Measurement, 102(4), 158–169. DOI 10.1016/j.measurement.2017.01.043. [Google Scholar] [CrossRef]
20. Najibi, A. R., Ghafoori, M., Lashkaripour, G. R., Asef, M. R. (2015). Empirical relations between strength and static and dynamic elastic properties of Asmari and Sarvak limestones, two main oil reservoirs in Iran. Journal of Petroleum Science and Engineering, 126(1), 78–82. DOI 10.1016/j.petrol.2014.12.010. [Google Scholar] [CrossRef]
21. Mohamad, E. T., Armaghani, D. J., Momeni, E., Abad, S. V. A. N. K. (2015). Prediction of the unconfined compressive strength of soft rocks: A PSO-based ANN approach. Bulletin of Engineering Geology and the Environment, 74(3), 745–757. DOI 10.1007/s10064-014-0638-0. [Google Scholar] [CrossRef]
22. Kallu, R., Roghanchi, P. (2015). Correlations between direct and indirect strength test methods. International Journal of Mining Science and Technology, 25(3), 355–360. DOI 10.1016/j.ijmst.2015.03.005. [Google Scholar] [CrossRef]
23. Tandon, R. S., Gupta, V. (2015). Estimation of strength characteristics of different Himalayan rocks from Schmidt hammer rebound, point load index, and compressional wave velocity. Bulletin of Engineering Geology and the Environment, 74(2), 521–533. DOI 10.1007/s10064-014-0629-1. [Google Scholar] [CrossRef]
24. Jalali, S. H., Heidari, M., Mohseni, H. (2017). Comparison of models for estimating uniaxial compressive strength of some sedimentary rocks from Qom Formation. Environmental Earth Sciences, 76(22), 1–15. DOI 10.1007/s12665-017-7090-y. [Google Scholar] [CrossRef]
25. Armaghani, D. J., Safari, V., Fahimifar, A., Monjezi, M., Mohammadi, M. A. (2018). Uniaxial compressive strength prediction through a new technique based on gene expression programming. Neural Computing and Applications, 30(11), 3523–3532. DOI 10.1007/s00521-017-2939-2. [Google Scholar] [CrossRef]
26. Teymen, A., Mengüç, E. C. (2020). Comparative evaluation of different statistical tools for the prediction of uniaxial compressive strength of rocks. International Journal of Mining Science and Technology, 30(6), 785–797. DOI 10.1016/j.ijmst.2020.06.008. [Google Scholar] [CrossRef]
27. Aboutaleb, S., Behnia, M., Bagherpour, R., Bluekian, B. (2018). Using non-destructive tests for estimating uniaxial compressive strength and static Young’s modulus of carbonate rocks via some modeling techniques. Bulletin of Engineering Geology and the Environment, 77(4), 1717–1728. DOI 10.1007/s10064-017-1043-2. [Google Scholar] [CrossRef]
28. Madhubabu, N., Singh, P., Kainthola, A., Mahanta, B., Tripathy, A. et al. (2016). Prediction of compressive strength and elastic modulus of carbonate rocks. Measurement, 88(3–4), 202–213. DOI 10.1016/j.measurement.2016.03.050. [Google Scholar] [CrossRef]
29. Ng, I. T., Yuen, K. V., Lau, C. H. (2015). Predictive model for uniaxial compressive strength for Grade III granitic rocks from Macao. Engineering Geology, 199(2), 28–37. DOI 10.1016/j.enggeo.2015.10.008. [Google Scholar] [CrossRef]
30. Çobanoğlu, İ., Çelik, S. B. (2008). Estimation of uniaxial compressive strength from point load strength, Schmidt hardness and P-wave velocity. Bulletin of Engineering Geology and the Environment, 67(4), 491–498. DOI 10.1007/s10064-008-0158-x. [Google Scholar] [CrossRef]
31. Azimian, A., Ajalloeian, R., Fatehi, L. (2014). An empirical correlation of uniaxial compressive strength with P-wave velocity and point load strength index on marly rocks using statistical method. Geotechnical and Geological Engineering, 32(1), 205–214. DOI 10.1007/s10706-013-9703-x. [Google Scholar] [CrossRef]
32. Huang, J., Zhang, J., Gao, Y. (2022). Evaluating the clogging behavior of pervious concrete (PC) using the machine learning techniques. Computer Modeling in Engineering & Sciences, 130(2), 805–821. DOI 10.32604/cmes.2022.017792. [Google Scholar] [CrossRef]
33. Asteris, P. G., Douvika, M. G., Karamani, C. A., Skentou, A. D., Chlichlia, K. et al. (2020). A novel heuristic algorithm for the modeling and risk assessment of the COVID-19 pandemic phenomenon. Computer Modeling in Engineering & Sciences, 125(2), 815–828. DOI 10.32604/cmes.2020.013280. [Google Scholar] [CrossRef]
34. Luo, W., Yuan, D., Jin, D. L., Lu, P., Chen, J. (2021). Optimal control of slurry pressure during shield tunnelling based on random forest and particle swarm optimization. Computer Modeling in Engineering & Sciences, 128(1), 109–127. DOI 10.32604/cmes.2021.015683. [Google Scholar] [CrossRef]
35. Asteris, P. G., Rizal, F. I. M., Koopialipoor, M., Roussis, P. C., Ferentinou, M. et al. (2022). Slope stability classification under seismic conditions using several tree-based intelligent techniques. Applied Sciences, 12(3), 1753. DOI 10.3390/app12031753. [Google Scholar] [CrossRef]
36. Mahmood, W., Mohammed, A. S., Asteris, P. G., Kurda, R., Armaghani, D. J. (2022). Modeling flexural and compressive strengths behaviour of cement-grouted sands modified with water reducer polymer. Applied Sciences, 12(3), 1016. DOI 10.3390/app12031016. [Google Scholar] [CrossRef]
37. Liao, J., Asteris, P. G., Cavaleri, L., Mohammed, A. S., Lemonis, M. E. et al. (2021). Novel fuzzy-based optimization approaches for the prediction of ultimate axial load of circular concrete-filled steel tubes. Buildings, 11(12), 629. DOI 10.3390/buildings11120629. [Google Scholar] [CrossRef]
38. Gavriilaki, E., Asteris, P. G., Touloumenidou, T., Koravou, E. E., Koutra, M. et al. (2021). Genetic justification of severe COVID-19 using a rigorous algorithm. Clinical Immunology, 226(27), 108726. DOI 10.1016/j.clim.2021.108726. [Google Scholar] [CrossRef]
39. Zeng, J., Asteris, P. G., Mamou, A. P., Mohammed, A. S., Golias, E. A. et al. (2021). The effectiveness of ensemble-neural network techniques to predict peak uplift resistance of buried pipes in reinforced sand. Applied Sciences, 11(3), 908. DOI 10.3390/app11030908. [Google Scholar] [CrossRef]
40. Yang, H. Q., Zeng, Y. Y., Lan, Y. F., Zhou, X. P. (2014). Analysis of the excavation damaged zone around a tunnel accounting for geostress and unloading. International Journal of Rock Mechanics and Mining Sciences, 69, 59–66. DOI 10.1016/j.ijrmms.2014.03.003. [Google Scholar] [CrossRef]
41. Yang, H., Wang, Z., Song, K. (2020). A new hybrid grey wolf optimizer-feature weighted-multiple kernel-support vector regression technique to predict TBM performance. Engineering with Computers, 38(3), 2469–2485. [Google Scholar]
42. Mahmoodzadeh, A., Mohammadi, M., Nariman Abdulhamid, S., Hashim Ibrahim, H., Farid Hama Ali, H. et al. (2021). Dynamic reduction of time and cost uncertainties in tunneling projects. Tunnelling and Underground Space Technology, 109(1–2), 103774. DOI 10.1016/j.tust.2020.103774. [Google Scholar] [CrossRef]
43. Mahmoodzadeh, A., Mohammadi, M., Farid Hama Ali, H., Hashim Ibrahim, H., Nariman Abdulhamid, S. et al. (2021). Prediction of safety factors for slope stability: comparison of machine learning techniques. Natural Hazards, 111(2), 1771–1799. [Google Scholar]
44. Mahmoodzadeh, A., Mohammadi, M., Ghafoor Salim, S., Farid Hama Ali, H., Hashim Ibrahim, H. et al. (2022). Machine learning techniques to predict rock strength parameters. Rock Mechanics and Rock Engineering, 55(3), 1721–1741. [Google Scholar]
45. Mahmoodzadeh, A., Mohammadi, M., Hashim Ibrahim, H., Gharrib Noori, K. M., Nariman Abdulhamid, S. et al. (2021). Forecasting sidewall displacement of underground caverns using machine learning techniques. Automation in Construction, 123, 103530. DOI 10.1016/j.autcon.2020.103530. [Google Scholar] [CrossRef]
46. Mahmoodzadeh, A., Mohammadi, M., Gharrib Noori, M., Khishe, K., Hashim Ibrahim, M. et al. (2021). Presenting the best prediction model of water inflow into drill and blast tunnels among several machine learning techniques. Automation in Construction, 127, 103719. DOI 10.1016/j.autcon.2021.103719. [Google Scholar] [CrossRef]
47. Mahmoodzadeh, A., Mohammadi, M., Hashim Ibrahim, H., Nariman Abdulhamid, S., Farid Hama Ali, H. et al. (2021). Machine learning forecasting models of disc cutters life of tunnel boring machine. Automation in Construction, 128, 103779. DOI 10.1016/j.autcon.2021.103779. [Google Scholar] [CrossRef]
48. Li, D., Armaghani, D. J., Zhou, J., Lai, S. H., Hasanipanah, M. (2020). A GMDH predictive model to predict rock material strength using three non-destructive tests. Journal of Nondestructive Evaluation, 39(4), 1–14. DOI 10.1007/s10921-020-00725-x. [Google Scholar] [CrossRef]
49. Armaghani, D. J., Mamou, A., Maraveas, C., Roussis, P. C., Siorikis, V. G. et al. (2021). Predicting the unconfined compressive strength of granite using only two non-destructive test indexes. Geomechanics and Engineering, 25, 317–330. [Google Scholar]
50. Fang, Q., Yazdani Bejarbaneh, B., Vatandoust, M., Jahed Armaghani, D., Ramesh Murlidhar, B. et al. (2021). Strength evaluation of granite block samples with different predictive models. Engineering with Computers, 37(2), 891–908. DOI 10.1007/s00366-019-00872-4. [Google Scholar] [CrossRef]
51. Li, Y., Hishamuddin, F. N. S., Mohammed, A. S., Armaghani, D. J., Ulrikh, D. V. et al. (2021). The effects of rock index tests on prediction of tensile strength of granitic samples: A neuro-fuzzy intelligent system. Sustainability, 13(19), 10541. DOI 10.3390/su131910541. [Google Scholar] [CrossRef]
52. Parsajoo, M., Armaghani, D. J., Mohammed, A. S., Khari, M., Jahandari, S. (2021). Tensile strength prediction of rock material using non-destructive tests: A comparative intelligent study. Transportation Geotechnics, 31(12), 100652. DOI 10.1016/j.trgeo.2021.100652. [Google Scholar] [CrossRef]
53. Gokceoglu, C. (2002). A fuzzy triangular chart to predict the uniaxial compressive strength of the Ankara agglomerates from their petrographic composition. Engineering Geology, 66(1–2), 39–51. DOI 10.1016/S0013-7952(02)00023-6. [Google Scholar] [CrossRef]
54. Barzegar, R., Sattarpour, M., Nikudel, M. R., Moghaddam, A. A. (2016). Comparative evaluation of artificial intelligence models for prediction of uniaxial compressive strength of travertine rocks, case study: Azarshahr area, NW Iran. Modeling Earth Systems and Environment, 2(2), 76. DOI 10.1007/s40808-016-0132-8. [Google Scholar] [CrossRef]
55. Mishra, D., Basu, A. (2013). Estimation of uniaxial compressive strength of rock materials by index tests using regression analysis and fuzzy inference system. Engineering Geology, 160(6), 54–68. DOI 10.1016/j.enggeo.2013.04.004. [Google Scholar] [CrossRef]
56. Saedi, B., Mohammadi, S. D., Shahbazi, H. (2019). Application of fuzzy inference system to predict uniaxial compressive strength and elastic modulus of migmatites. Environmental Earth Sciences, 78(6), 1–14. DOI 10.1007/s12665-019-8219-y. [Google Scholar] [CrossRef]
57. Yesiloglu-Gultekin, N., Sezer, E. A., Gokceoglu, C., Bayhan, H. (2013). An application of adaptive neuro fuzzy inference system for estimating the uniaxial compressive strength of certain granitic rocks from their mineral contents. Expert Systems with Applications, 40(3), 921–928. DOI 10.1016/j.eswa.2012.05.048. [Google Scholar] [CrossRef]
58. Armaghani, D. J., Mohamad, E. T., Momeni, E., Narayanasamy, M. S. (2015). An adaptive neuro-fuzzy inference system for predicting unconfined compressive strength and Young’s modulus: A study on Main Range granite. Bulletin of Engineering Geology and the Environment, 74(4), 1301–1319. DOI 10.1007/s10064-014-0687-4. [Google Scholar] [CrossRef]
59. Jing, H., Nikafshan Rad, H., Hasanipanah, M., Jahed Armaghani, D., Qasem, S. N. (2021). Design and implementation of a new tuned hybrid intelligent model to predict the uniaxial compressive strength of the rock using SFS-ANFIS. Engineering with Computers, 37(4), 2717–2734. DOI 10.1007/s00366-020-00977-1. [Google Scholar] [CrossRef]
60. Wang, M., Wan, W. (2019). A new empirical formula for evaluating uniaxial compressive strength using the Schmidt hammer test. International Journal of Rock Mechanics and Mining Sciences, 123(1), 104094. DOI 10.1016/j.ijrmms.2019.104094. [Google Scholar] [CrossRef]
61. İnce, İ., Bozdağ, A., Fener, M., Kahraman, S. (2019). Estimation of uniaxial compressive strength of pyroclastic rocks (Cappadocia, Turkey) by gene expression programming. Arabian Journal of Geosciences, 12(24), 1–13. DOI 10.1007/s12517-019-4953-4. [Google Scholar] [CrossRef]
62. Özdemir, E. (2021). A new predictive model for uniaxial compressive strength of rock using machine learning method: Artificial intelligence-based age-layered population structure genetic programming (ALPS-GP). Arabian Journal for Science and Engineering, 47(1), 629–639. [Google Scholar]
63. Rahman, T., Sarkar, K. (2021). Lithological control on the estimation of uniaxial compressive strength by the P-wave velocity using supervised and unsupervised learning. Rock Mechanics and Rock Engineering, 54(6), 3175–3191. [Google Scholar]
64. Cao, J., Gao, J., Rad, H. N., Mohammed, A. S., Hasanipanah, M. et al. (2021). A novel systematic and evolved approach based on XGBoost-firefly algorithm to predict Young’s modulus and unconfined compressive strength of rock. Engineering with Computers, 1–17. DOI 10.1007/s00366-020-01241-2. [Google Scholar] [CrossRef]
65. Gowida, A., Elkatatny, S., Gamal, H. (2021). Unconfined compressive strength (UCS) prediction in real-time while drilling using artificial intelligence tools. Neural Computing and Applications, 33(13), 1–12. DOI 10.1007/s00521-020-05546-7. [Google Scholar] [CrossRef]
66. Mahmoodzadeh, A., Mohammadi, M., Ibrahim, H. H., Abdulhamid, S. N., Salim, S. G. et al. (2021). Artificial intelligence forecasting models of uniaxial compressive strength. Transportation Geotechnics, 27(1), 100499. DOI 10.1016/j.trgeo.2020.100499. [Google Scholar] [CrossRef]
67. Zhou, J., Li, X., Mitri, H. S. (2016). Classification of rockburst in underground projects: Comparison of ten supervised learning methods. Journal of Computing in Civil Engineering, 30(5), 4016003. DOI 10.1061/(ASCE)CP.1943-5487.0000553. [Google Scholar] [CrossRef]
68. Wang, S. M., Zhou, J., Li, C. Q., Armaghani, D. J., Li, X. B. et al. (2021). Rockburst prediction in hard rock mines developing bagging and boosting tree-based ensemble techniques. Journal of Central South University, 28(2), 527–542. DOI 10.1007/s11771-021-4619-8. [Google Scholar] [CrossRef]
69. Li, D., Liu, Z., Armaghani, D. J., Xiao, P., Zhou, J. (2022). Novel ensemble intelligence methodologies for rockburst assessment in complex and variable environments. Scientific Reports, 12(1), 1844. DOI 10.1038/s41598-022-05594-0. [Google Scholar] [CrossRef]
70. Li, D., Liu, Z., Armaghani, D. J., Xiao, P., Zhou, J. (2022). Novel ensemble tree solution for rockburst prediction using deep forest. Mathematics, 10(5), 787. DOI 10.3390/math10050787. [Google Scholar] [CrossRef]
71. Li, D., Liu, Z., Xiao, P., Zhou, J., Jahed Armaghani, D. (2022). Intelligent rockburst prediction model with sample category balance using feedforward neural network and Bayesian optimization. Underground Space. DOI 10.1016/j.undsp.2021.12.009. [Google Scholar] [CrossRef]
72. Zhou, J., Qiu, Y., Armaghani, D. J., Zhang, W., Li, C. et al. (2021). Predicting TBM penetration rate in hard rock condition: A comparative study among six XGB-based metaheuristic techniques. Geoscience Frontiers, 12(3), 101091. DOI 10.1016/j.gsf.2020.09.020. [Google Scholar] [CrossRef]
73. Qiu, Y., Zhou, J., Khandelwal, M., Yang, H., Yang, P. et al. (2021). Performance evaluation of hybrid WOA-XGBoost, GWO-XGBoost and BO-XGBoost models to predict blast-induced ground vibration. Engineering with Computers, 1–18. DOI 10.1007/s00366-021-01393-9. [Google Scholar] [CrossRef]
74. Zhou, J., Qiu, Y., Khandelwal, M., Zhu, S., Zhang, X. (2021). Developing a hybrid model of Jaya algorithm-based extreme gradient boosting machine to estimate blast-induced ground vibrations. International Journal of Rock Mechanics and Mining Sciences, 145(4–5), 104856. DOI 10.1016/j.ijrmms.2021.104856. [Google Scholar] [CrossRef]
75. Freund, Y., Schapire, R. E. (1997). A decision-theoretic generalization of on-line learning and an application to boosting. Journal of Computer and System Sciences, 55(1), 119–139. DOI 10.1006/jcss.1997.1504. [Google Scholar] [CrossRef]
76. Friedman, J. H. (2001). Greedy function approximation: A gradient boosting machine. Annals of Statistics, 29(5), 1189–1232. DOI 10.1214/aos/1013203450. [Google Scholar] [CrossRef]
77. Chen, T., Guestrin, C. (2016). In XGboost: A scalable tree boosting system. Proceedings of the 22nd ACM Sigkdd International Conference on Knowledge Discovery and Data Mining, pp. 785–794. Association for Computing Machinery, San Francisco, California, USA. [Google Scholar]
78. Prokhorenkova, L., Gusev, G., Vorobev, A., Dorogush, A. V., Gulin, A. (2017). CatBoost: Unbiased boosting with categorical features. arXiv preprint arXiv:1706.09516. [Google Scholar]
79. Dorogush, A. V., Ershov, V., Gulin, A. (2018). CatBoost: Gradient boosting with categorical features support. arXiv preprint arXiv: 1810.11363. [Google Scholar]
80. Armaghani, D. J., Amin, M. F. M., Yagiz, S., Faradonbeh, R. S., Abdullah, R. A. (2016). Prediction of the uniaxial compressive strength of sandstone using various modeling techniques. International Journal of Rock Mechanics and Mining Sciences, 85(2), 174–186. DOI 10.1016/j.ijrmms.2016.03.018. [Google Scholar] [CrossRef]
81. Ajalloeian, R., Jamshidi, A., Khorasani, R. (2020). Evaluating the effects of mineral grain size and mineralogical composition on the correlated equations between strength and schmidt hardness of granitic rocks. Geotechnical and Geological Engineering, 54(1). DOI 10.1007/s10706-020-01321-6. [Google Scholar] [CrossRef]
82. Pedregosa, F., Varoquaux, G., Gramfort, A., Michel, V., Thirion, B. et al. (2011). Scikit-learn: Machine learning in Python. The Journal of machine Learning research, 12, 2825–2830. [Google Scholar]
83. Mohamad, E. T., Armaghani, D. J., Mahdyar, A., Komoo, I., Kassim, K. A. et al. (2017). Utilizing regression models to find functions for determining ripping production based on laboratory tests. Measurement, 111(3), 216–225. DOI 10.1016/j.measurement.2017.07.035. [Google Scholar] [CrossRef]
84. Huang, L., Asteris, P. G., Koopialipoor, M., Armaghani, D. J., Tahir, M. (2019). Invasive weed optimization technique-based ANN to the prediction of rock tensile strength. Applied Sciences, 9(24), 5372. DOI 10.3390/app9245372. [Google Scholar] [CrossRef]
85. Yang, H., Koopialipoor, M., Armaghani, D. J., Gordan, B., Khorami, M. et al. (2019). Intelligent design of retaining wall structures under dynamic conditions. Steel and Composite Structures, 31(6), 629–640. [Google Scholar]
86. Armaghani, D. J., Asteris, P. G., Fatemi, S. A., Hasanipanah, M., Tarinejad, R. et al. (2020). On the use of neuro-swarm system to forecast the pile settlement. Applied Sciences, 10(6), 1904. DOI 10.3390/app10061904. [Google Scholar] [CrossRef]
87. Jahed Armaghani, D., Hasanipanah, M., Bakhshandeh Amnieh, H., Tien Bui, D., Mehrabi, P. et al. (2020). Development of a novel hybrid intelligent model for solving engineering problems using GS-GMDH algorithm. Engineering with Computers, 36(4), 1379–1391. DOI 10.1007/s00366-019-00769-2. [Google Scholar] [CrossRef]
88. Taylor, K. E. (2001). Summarizing multiple aspects of model performance in a single diagram. Journal of Geophysical Research: Atmospheres, 106, 7183–7192. DOI 10.1029/2000JD900719. [Google Scholar] [CrossRef]
89. Ghasemi, E., Kalhori, H., Bagherpour, R., Yagiz, S. (2018). Model tree approach for predicting uniaxial compressive strength and Young’s modulus of carbonate rocks. Bulletin of Engineering Geology and the Environment, 77(1), 331–343. DOI 10.1007/s10064-016-0931-1. [Google Scholar] [CrossRef]
90. Armaghani, D. J., Mohamad, E. T., Hajihassani, M., Yagiz, S., Motaghedi, H. (2016). Application of several non-linear prediction tools for estimating uniaxial compressive strength of granitic rocks and comparison of their performances. Engineering with Computers, 32(2), 189–206. DOI 10.1007/s00366-015-0410-5. [Google Scholar] [CrossRef]
91. Zhou, Z., Hooker, G. (2021). Unbiased measurement of feature importance in tree-based methods. ACM Transactions on Knowledge Discovery from Data, 15(2), 1–21. DOI 10.1145/3429445. [Google Scholar] [CrossRef]
