DOI:10.32604/csse.2021.014144
| Computer Systems Science & Engineering DOI:10.32604/csse.2021.014144 | |
| Article |
The Measurement of the Software Ecosystem’s Productivity with GitHub
1School of Computer Science and Engineering, Central South University, Changsha, 410075, China
2School of Information Technology and Management, Hunan University of Finance and Economics, Changsha, 410075, China
3Department of Computing, School of Computing, Engineering and Built Environment, Glasgow Caledonian University, Glasgow, G4 0BA, UK
*Corresponding Author: Limin Liu. Email: liulim@csu.edu.cn
Received: 01 September 2020; Accepted: 05 October 2020
Abstract: Software productivity has always been one of the most critical metrics for measuring software development. However, with the open-source community (e.g., GitHub), new software development models are emerging. The traditional productivity metrics do not provide a comprehensive measure of the new software development models. Therefore, it is necessary to build a productivity measurement model of open source software ecosystem suitable for the open-source community’s production activities. Based on the natural ecosystem, this paper proposes concepts related to the productivity of open source software ecosystems, analyses influencing factors of open source software ecosystem productivity, and constructs a measurement model using these factors. Model validation experiments show that the model is compatible with a large portion of open source software ecosystems in GitHub. This study can provide references for participants of the open-source software ecosystem to choose proper types of ecosystems. The study also provides a basis for ecosystem health assessment for researchers interested in ecosystem quality.
Keywords: Software ecosystem; open-source software ecosystem; OSSECO; productivity; productivity model
Open Source Software Ecosystem (OSSECO) is a new ecosystem based on two research fields of open source software and software ecosystem. In the past few years, the OSSECO, as a growing research field in software engineering, has attracted researchers’ attention. Manikas [1] conducted a systematic review of the research status of OSSECO in 2016 and found that 231 research literature related to OSSECO from 2007 to 2014, including ecosystem evolution, ecosystem technology, and ecosystem model. The quality and health of OSSECO is the most critical concern of researchers. Iansiti et al. [2] used Open Source Software Ecosystem Health (OSSECOH) as a performance indicator for OSSECO. Boshuis et al. [3] filled the research gap on the impact of business strategy on software ecosystem health by combining Open Source Ecosystem Health Operation (OSEHO) with the general strategy. In these studies, researchers mostly regard productivity as part of open-source software ecosystem health research, while independent research on the productivity of open source software ecosystems is relatively few.
In fact, in the process of continuous development of OSSECO, productivity has an increasing impact on the health and evolution of OSSECO. The measurement of ecosystem productivity of open source software helps maintain the development efficiency of ecosystem participants and the ecosystem’s stability. How to evaluate and improve ecosystem productivity is a problem that cannot be ignored. Currently, Jansen [4] proposed some factors that affect the productivity of the ecosystem, such as the addition of new participants, the complexity of the bug, the relationship of the mailing list, and the new forks. However, the quantitative analysis of these factors is lacking. Vasilescu et al. [5] made a quantitative study on the impact of continuous integration on the productivity of the OSSECO but lacked a general productivity model. Besides, the definition of ecosystem productivity in these studies is still the consumption ratio of output and input per unit time. However, in GitHub, the composition of OSSECO is diverse, and its productivity has more forms than traditional software engineering. The conventional definition of productivity is not vivid enough.
As the most popular open-source platform, more and more well-known open-source projects conduct production activities in GitHub. To address these issues, we use the open-source software ecosystem’s production characteristics to define open-source software ecosystem productivity. Referring to the influencing factors of traditional software productivity and considering the data characteristics of OSSECO in GitHub, we use more than 200,000 data from 10 popular OSSECO in GitHub to analyze the factors affecting the productivity of OSSECO and draw conclusions. On this basis, the Open Source Software Ecosystem Productivity model and Net Productivity model were constructed respectively. Meanwhile, the models’ validity was verified according to 8 ecosystems in GitHub that did not participate in the model construction. Our research mainly involves the following questions:
RQ1: What is the productivity of the OSSECO?
RQ2: In the OSSECO, what factors can affect ecosystem productivity?
RQ3: Are these factors affecting the OSSECO positive or negative?
RQ4: What is the contribution of these factors affecting the OSSECO in building ecosystem productivity models?
This paper makes the following contributions: (1) Define the productivity concept of OSSECO by combining natural ecosystem and business ecosystem; (2) Analyze and study the influencing factors of productivity of OSSECO; (3) Construct productivity model of OSSECO and validating the validity of the model.
The remainder of this article is structured as follows. Section 2 discusses background of the OSSECO. Section 3 defines the concepts related to the productivity of the OSSECO. Sections 4 to 5 analyzes the factors that influence the open source software ecosystem and constructs a productivity model of the open source software ecosystem. Section 6 validates the validity of the model. Section 7 presents the threats to validity of our study. Section 8 concludes by summarising the main research findings and outlining future work.
In the last century, researchers believed that the focus of software process improvement was to improve software development productivity. A large number of studies discussed the influencing factors and measurement methods of software development productivity. In 1977, Walston et al. [6] introduced the concept of productivity into software engineering for the first time in a large-scale study. They analyzed the factors significantly related to programming productivity, which were cited and referred to in many subsequent studies. Then Albrecht [7] considers that software productivity is affected by both internal developers and external development environments and analyses the correlation between productivity and programming languages, project size, and other factors. Dale [8] have studied software productivity from different perspectives, such as development, user, and management. Jones [9] started a series of productivity studies in 1985. He was the first person to analyze various productivity factors in different fields and predict its average level. His measurement methods mainly focused on function points (FP) and source code lines (SLOC). In 2000, Jones [10] pointed out that the productivity of software projects is affected by about 250 factors, and the productivity of individual projects usually consists of 10 to 20 major issues. Nevertheless, Demarco et al. [11] believe that staff turnover is one of the main factors affecting productivity. Besides, they think that the language used in the development, developers’ experience, the number of defects, and salary have no significant impact on productivity.
Entering the 21st century, the concept of “open source” has gradually been recognized by more and more developers, and the open-source community is developing at an alarming rate. Developers focus more on the quick update and iteration of code. The traditional factors and measures of software products are not suitable for the open-source software ecosystem.
In OSSECO research, researchers mostly regard productivity as a part of Open Source Software Ecosystem Health research. Wahyudin et al. [12] studied the concept of health in the open-source software ecosystem project in 2007. They regarded the health of open source software projects as “viability,” If the software is used by some users and maintained by some developers, the open-source software project is healthy and can survive. Manikas et al. [13] reviewed the existing literature on the health status of open source software ecosystems in 2013. Based on the concepts in natural ecosystems and business ecosystems, defined the health status of software ecosystems as the ecosystem’s ability to continue to develop and maintain high productivity. Jansen [4] described productivity as an essential indicator affecting open source ecosystem health in the study on the ecosystem health model of open-source software released in 2014. Since then, the concept of open-source software ecosystem productivity has been recognized and used by more researchers. Experts have continuously watched the importance of the productivity of the open-source software ecosystem.
More and more researchers regard “productivity” as an essential indicator of OSSECOH. According to the definition of software ecosystem health proposed by Mcgregor et al. [14,15], health indicators such as productivity, robustness, and niche creation, Michael [16] proposed developing a conceptual framework for participants who can actively support SECO health in the public domain through factor analysis and interviews in 2016. Van Den Berk et al. [17] proposed the SECO-SAM model to evaluate the software ecosystem’s strategy based on the measures of productivity, robustness, and niche creation based on the health of the software ecosystem. Liao et al. [18] proposed the definition of ecosystem sustainability and the evaluation index system. They established the measurement model and method of OSE sustainable development status based on the evaluation index system. Liao et al. [19] analyzed the behaviors that affected the health of the GitHub software ecosystem and defined the indicators that affect the health of the software ecosystem in terms of productivity, organizational structure, and resilience.
However, these studies only explain the factors affecting ecosystem productivity at the qualitative level. They do not quantitatively explain the specific results (positive or negative) of these factors on productivity or explain why they affect ecosystem productivity.
As the most popular open-source platform, more and more well-known open-source projects are operating on GitHub. This paper is based on the GitHub open-source platform to conduct open-source ecosystem productivity research. Meanwhile, this section also answers RQ1: What is the productivity of the open-source software ecosystem?
3.1 Open Source Software Ecosystem
It is difficult to make a unified definition, the same as the software ecosystem, on open source software ecosystems, although many researchers study it from various aspects. Virtually in every essay, the author proposes a definition that they reckon to be reasonable. What is certain, however, is that the understanding of the open-source software ecosystem is focused on two main areas: (1) Ecosystem perspective: Researchers believe that open-source software ecosystem is a network consists of participants, organizations, and symbiotic companies. Therefore, one research angle is business target; (2) Program-community perspective: Researchers pay more attention to a set of programs and the community’s technology and social influence. For a better understanding, this paper will study from the perspective of the project-community.
The concept of productivity first appeared in the study of natural ecosystems, which generally refers to organisms’ ability to produce material and energy. Later, when measuring the business ecosystem’s vitality, the researchers used the concept of productivity and defined the business ecosystem’s productivity as the ability of interacting organizations and individuals to solve business problems [20]. In the OSSECO, there are two characteristics of biological output and problem-solving. Thus, by analogy to natural and commercial ecosystems, this paper introduces the concept of OSSECO productivity.
Definition 1: Open Source Software Ecosystem Productivity (OSSEP) refers to the ability of participants, platforms, supporters, etc. to interact with each other to generate information and solve problems in an open source ecosystem. In the GitHub, participants express their doubts by publishing Issues and asking others to review their completed branch work through Pull Request (PR) to conduct information interaction and solve practical problems in the open source community platform.
Also, there is a concept of net productivity in natural ecosystems. Net productivity refers to the accumulation rate of residual organic matter after removing respiratory consumption in natural ecosystems. It is a significant indicator of the ecosystem and represents the actual production of the ecosystem. In the OSSECO, not all Issues and PR can contribute to the final ecosystem. The PR, which has been merged, is the contributor to the final ecosystem product. So we propose the definition of net productivity of OSSECO by analogy with the natural ecosystem.
Definition 2: Open Source Software Ecosystem Net Productivity (OSSENP) refers to the ability of participants, platforms, supporters, etc. to interact with each other to generate valid information in an open source ecosystem. In the GitHub, we use the ratio of the merged PR in the ecosystem to represent the net productivity of the open source ecosystem.
4 Analysis of Influencing Factors
This section mainly studies RQ2 and RQ3. In analyzing the factors affecting the productivity of OSSECO, we first use the API provided by GitHub to obtain the original data needed for the experiment and collate the original data set. Then we conducted correlation analysis and sample covariance experiments and finally got the analysis results. The specific steps are shown in Fig. 1.
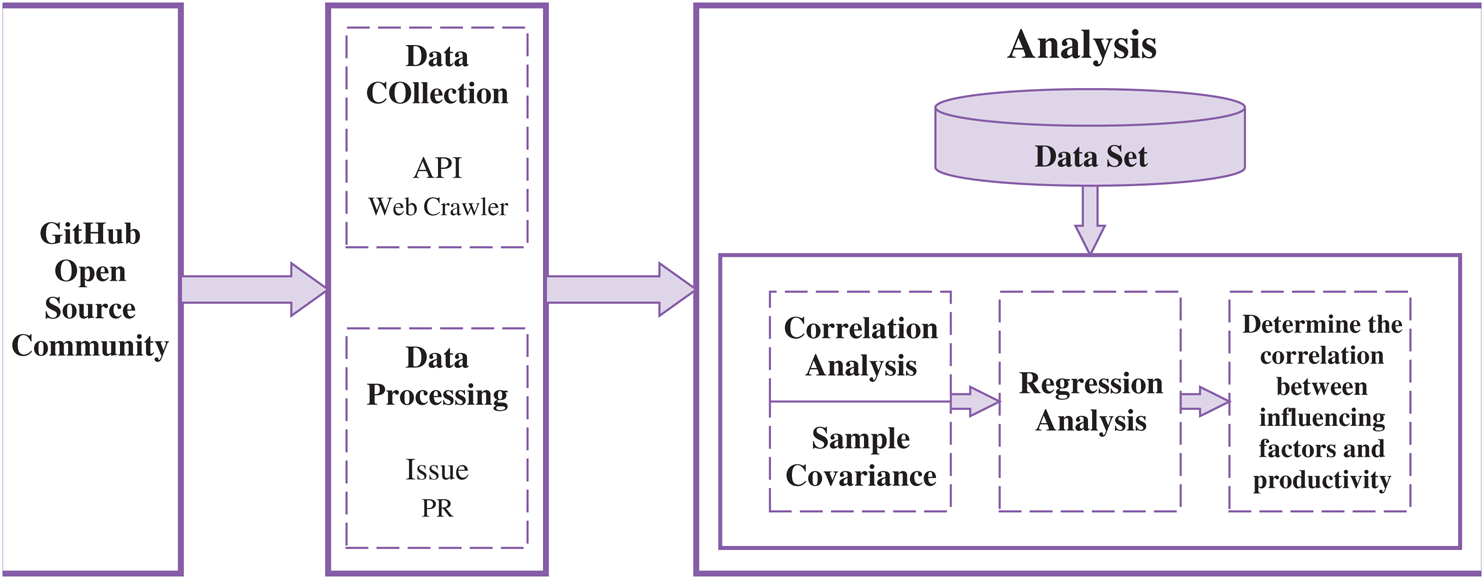
Figure 1: Influencing factors analysis steps
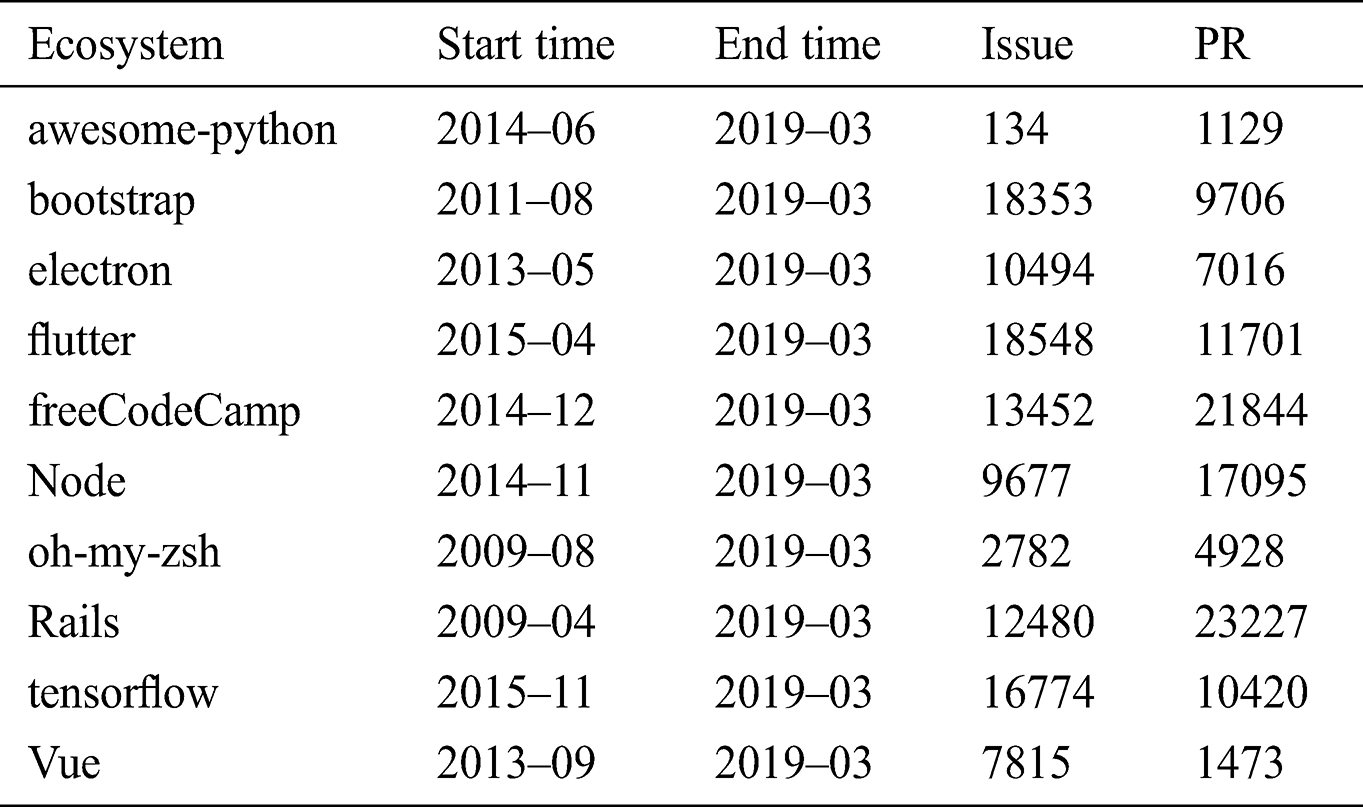
This paper selects ten popular open-source software ecosystems in GitHub as research examples, including bootstrap, awesome-python, rails, node, freeCodeCamp, TensorFlow, vue, oh-my-zsh, electron, flutter, etc. The reasons for selecting these ten ecosystems are: (1) With high popularity and large data scale. All these ecosystems are currently in an active state of development, and the number of starts is more than 30,000; (2) Long life cycle, the earliest was rails released in April 2009, the latest is TensorFlow released in November 2015; (3) The release time and development language of the above, open-source ecosystems are different, so besides the characteristics of ecosystem participants, the characteristics of the ecosystem itself are different. We collected all the ten programs during their lifecycle to determine the impact of program age on ecosystem productivity.
When processing raw data, it is mainly necessary to extract the author, release time, status (Open or Closed), shutdown time, discussion number, and other Issue and PR data. However, during the observation of raw data, we found out that some Issues, visitors’ (those who are not engaged in program development and use) meaningless speech, are invalid and should be left out. Also, new Issue and PR are not generated every day on every program, so we use one month to be a statistics period. Even so, data of 0 still cannot be avoided. Solutions to this problem will be mentioned later. The data set after deleting meaningless data is shown in Tab. 1.
Note that by collecting the information amount produced by the system in a time unit, use one month to be a statistics period. Issue number and PR number are used to represent the ecosystem’s information producing ability. The speed of the Issue and PR closing indicates the ecosystem’s problem-solving ability. We consider a problem that has been solved when an Issue or a PR is shut down. The specific calculation method is 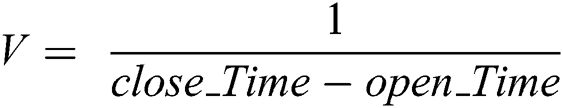 .
.
4.2 Selection of Influencing Factors
Barros [21] summarized the most commonly used productivity factors in software productivity studies from 1970 to 2009. On this basis, we collected 56 people’s opinions on the factors affecting the productivity of OSSECO by questionnaire, 42 of them have been engaged in the research of OSSECO, and the remaining 14 are researchers in other fields of software engineering. The results of the questionnaire are shown in Tab. 2. The respondents generally think that the number of participants and the degree of participants’ communication will affect the ecosystem’s productivity. Moreover, the geographical distribution of participants and the organizational structure of the OSSECO will not have a significant impact on productivity.
Table 2: Statistics of questionnaire results
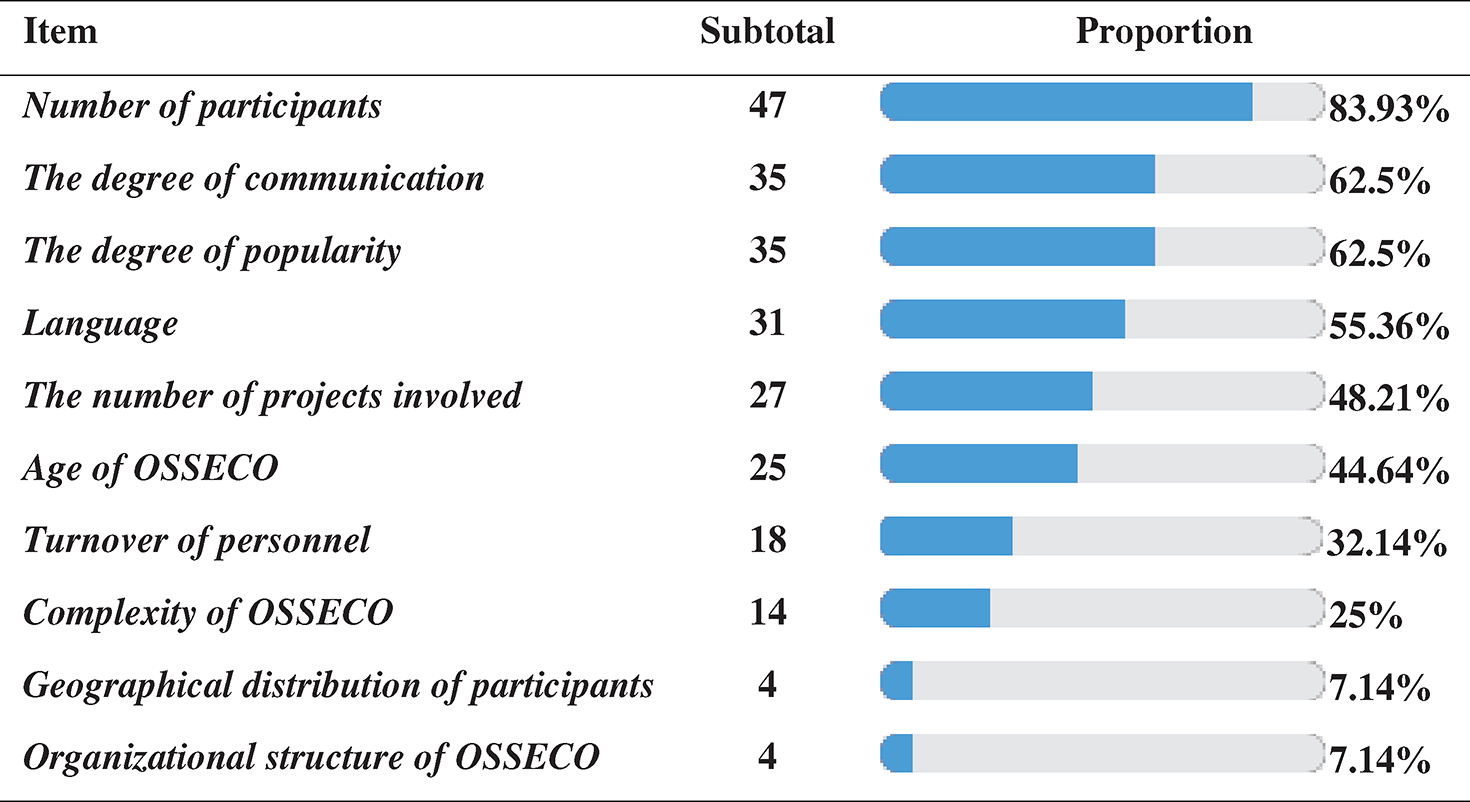
Based on the questionnaire results, we finally selected the top six influencing factors for related research on the productivity of the OSSECO. These factors were chosen because more than 20 survey participants felt they would have an impact on the productivity of the OSSECO. Also these factors are easier to quantify on GitHub for our subsequent research.
1) The number of participants: In software development, the impact of the size of the development team on productivity is clear, and experiments have shown that more developers are not always better on the same project. Does the number of people involved in development in an OSSECO have an impact on ecosystem productivity? This is a fascinating study.
2) The degree of communication: In traditional software development, we know that when faced with a problem, when more people participate in the discussion, the problem will be solved faster because more people’s wisdom will improve team productivity. In the OSSECO, it is significant to explore whether the level of communication among participants can accelerate the speed of solving Issues and PR.
3) The degree of popularity: This factor is unique to the OSSECO. The more popular the ecosystem is, the more people are involved in it, so estimating the popularity of the ecosystem will impact ecosystem productivity.
4) Language: Researchers have demonstrated that the development language does not affect the productivity of software in the study of traditional software products, but in the GitHub, using popular language (such as Java, Python) development project will have more and more attention. Then we guess that ecosystem development language will affect the productivity of ecosystems.
5) The number of projects involved: In traditional software development, productivity increases when developers have more development experience, so it is assumed that the experience of participants in the OSSECO will have an impact on ecosystem productivity.
6) Age of OSSECO: In the natural ecosystem, the age of the ecosystem is one of the main factors determining the productivity of the ecosystem. Considering the similarity between the OSSECO and the natural ecosystem, we speculate that an ecosystem’s age will affect its productivity.
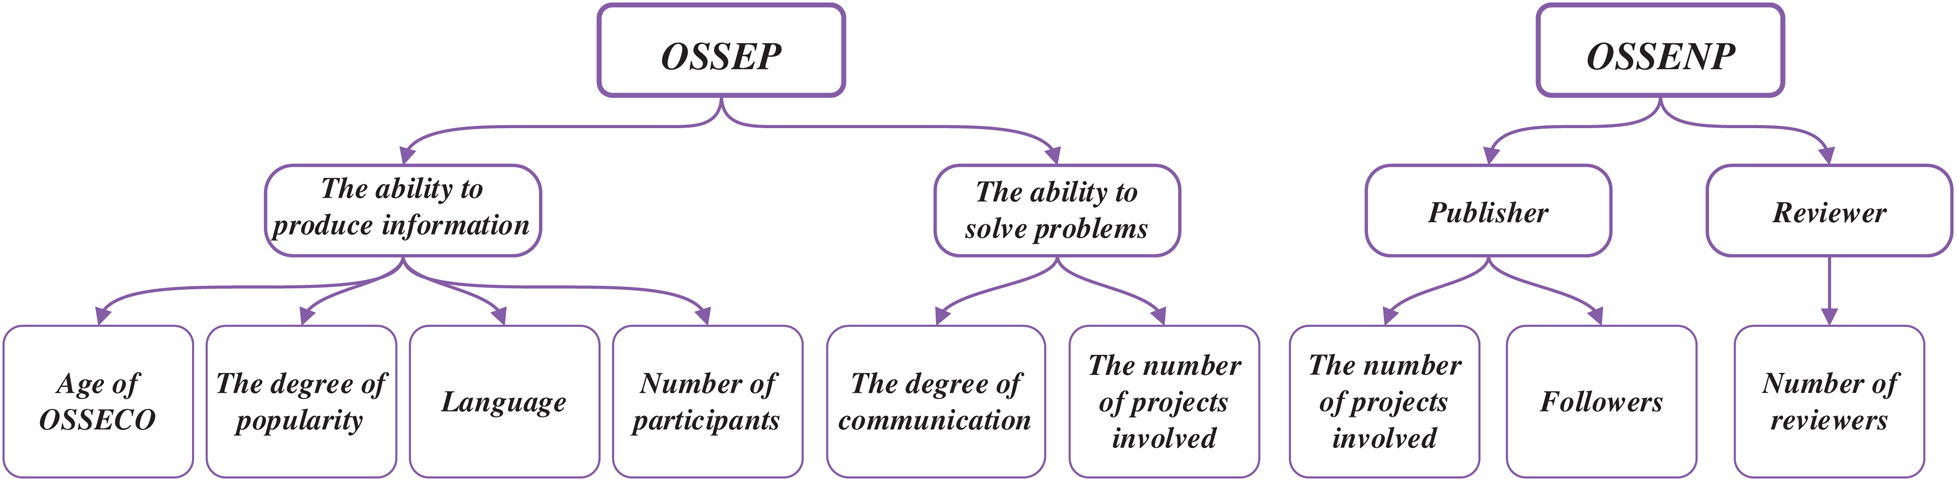
Figure 2: Relationship of influencing factors
Besides, in natural ecosystems, the factors affecting ecosystems’ net productivity are mainly ecosystem producers and consumers. Analogous to natural ecosystems, we suspect that the factors affecting net productivity in the OSSECO are mostly PR publishers (Publisher) and PR reviewers (Reviewer). Fig. 2 shows the relationship between the various influencing factors.
In Section 4.1, we mentioned that some data in our dataset is zero. This is because some projects may not have new Issues or PRs in a month. We adopt a zero-inflated negative binomial regression model [22] to deal with the excess zero counts. This hybrid model can deal with redundant zero counts suitable for data with many zero values and over discrete. The zero-expansion negative binomial regression model is a mixture of the original data set as a zero data set and a data set satisfying the contrary binomial distribution.
This section mainly conducts experimental analysis based on the factors affecting the productivity of the OSSECO selected in Section 4.1. The specific analysis results are as follows:
1) The number of participants: We analyzed the correlation between the number of participants and ecosystem productivity, and the results are shown in Fig. 3.
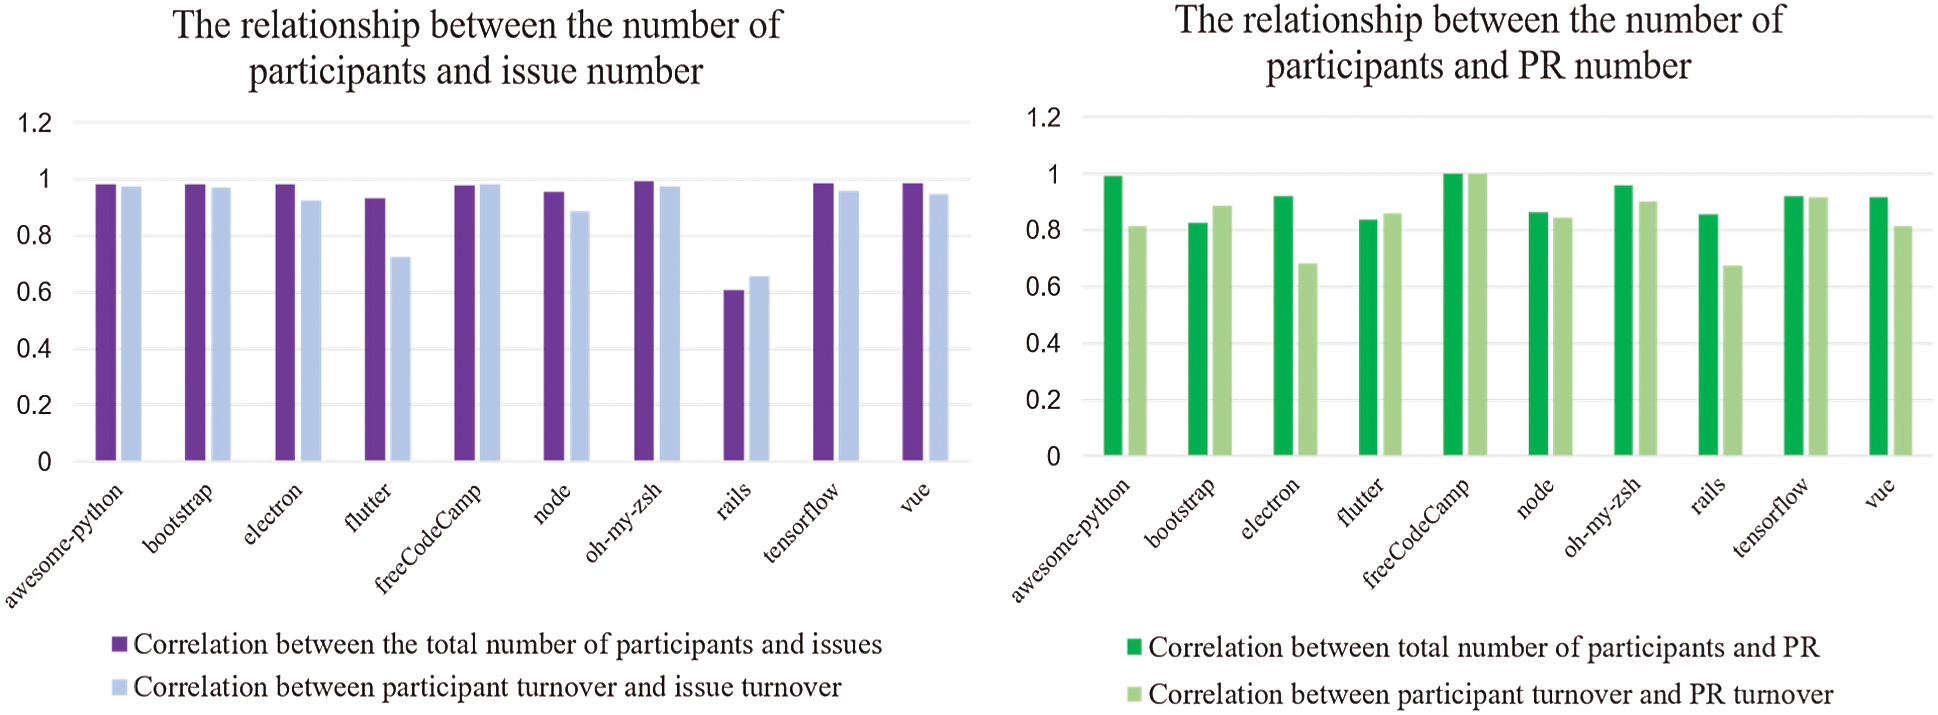
Figure 3: The impact of the number of participants on the ability of an ecosystem to produce information
There is a strong correlation between the total number of participants and the total number of issues. The lowest correlation is rails with a correlation coefficient of 0.608. The correlation coefficient between the total number of participants and the total number of issues in the other nine ecosystems is above 0.9. The monthly change of Issue number also maintains a strong correlation with the flow of participants. The ecosystem with the lowest correlation coefficient is rails, which is 0.657. The highest correlation coefficient was 0.981 for the freeCodeCamp. The correlation coefficients of the total number of participants and the total number of PR in 10 ecosystems are all above 0.8. The correlation coefficients of the flow of participants and the change of PR are all above 0.65. Therefore, the conclusion drawn in this paper is that the flow of participants has a high impact on the capacity of OSSECO to produce information, and the number of participants directly affects the total amount of information produced by the ecosystem.
2) The degree of communication: In order to get accurate conclusions about the influence of participants’ communication levels on productivity, this paper collects the comment data of all issues and PR with closed status in 10 ecosystems. The comment is discussing Issue and PR by ecosystem participants, who discuss a certain Issue with other participants through comments. The primary purpose of this section is to find the relationship between the closing speed V and the number of comments on Issue and PR.
Table 3: Relationship between the degree of communication and the ability of ecosystems to solve problems
Since these two groups of data do not meet the Pearson correlation coefficient calculation requirement, sample covariance of the two groups of data is selected to calculate to prove whether the changing trend of the two groups of data is consistent or the opposite. The experimental results are shown in Tab. 3. The conclusion is that the more participants communicate and discuss with each other, the slower the Issue and PR of the ecosystem will close. Positive communication by participants can hurt the ecosystem’s ability to solve problems.
This conclusion is surprising. To explain this phenomenon, we looked at Issues in the flutter project. We found that when more participants publish comments, other participants in the ecosystem will have to solve more problems related to it to solve the problem more slowly. Of course, it cannot be said that participants’ behavior to post more comments is not suitable for the ecosystem, and more comments can make the Issue be solved with higher quality.
3) The degree of popularity: GitHub provides users with the function of paying attention to a project, that is, labeling star for the project. The number of Star is an important indicator to measure the popularity of the project. After extracting the monthly Issues and PR corresponding to each ecosystem’s star number, the correlation analysis is carried out, and the results shown in Fig. 4 are obtained.
The result is surprising because the number of Star in awesome-python is negatively correlated with productivity. Although the correlation between the two of the remaining nine items is strongly associated (correlation coefficient between the number of stars and the number of Issue in the vue project is even as high as 0.89), the negative correlation still needs to be further explored.
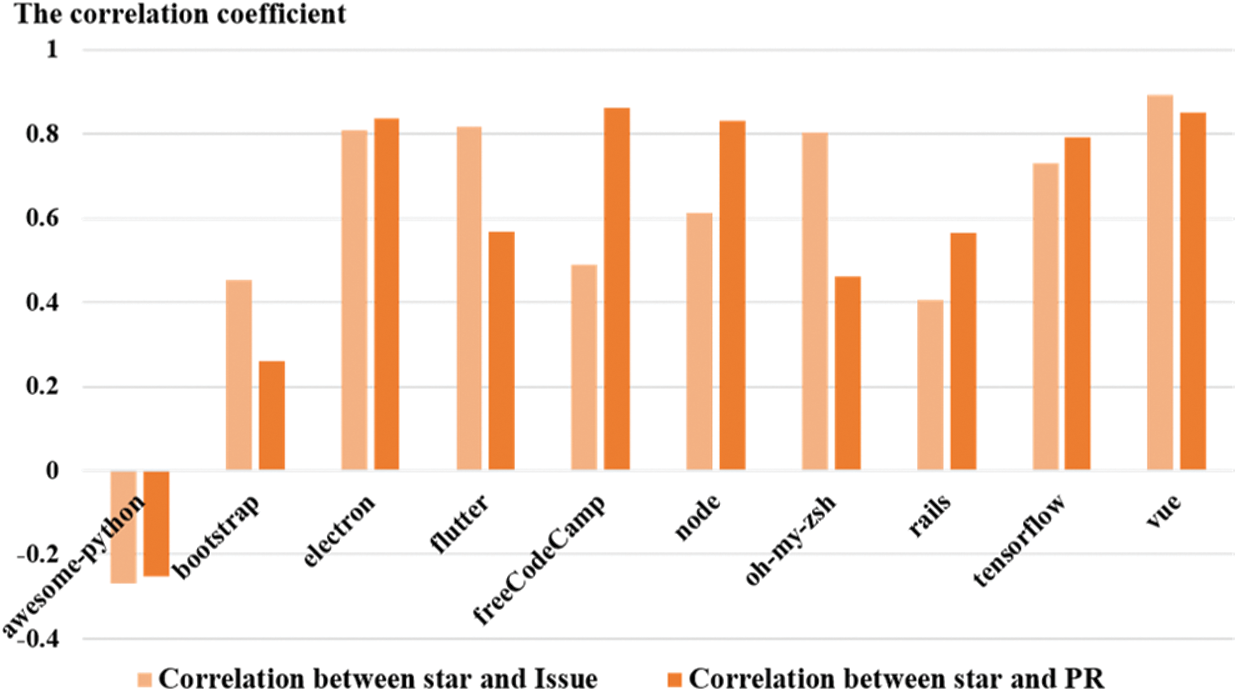
Figure 4: The effect of star number on the ability of the ecosystem to produce information. (The ordinate in the figure shows the correlation coefficient between the change of star number and the shift in Issue and PR number)
After observing the Issue and PR of awesome-python one by one, we found that although the number of stars in the ecosystem is linearly and steadily increasing, the person who publishes Issue and PR every month is a fixed participant. In order to explain this phenomenon, it is necessary to know more about the nature of the awesome-python ecosystem. It turns out that awesome-python is a python resource list initiated and maintained by vinta. Users will not have too many questions about the project, and the resource list will not change much. It is enough for users just to use it. So even if the number of awesome-python stars is negatively correlated with its productivity, it can still be determined according to the situation of the remaining nine ecosystems that the number of stars has a positive impact on the ability of ecosystem production information.
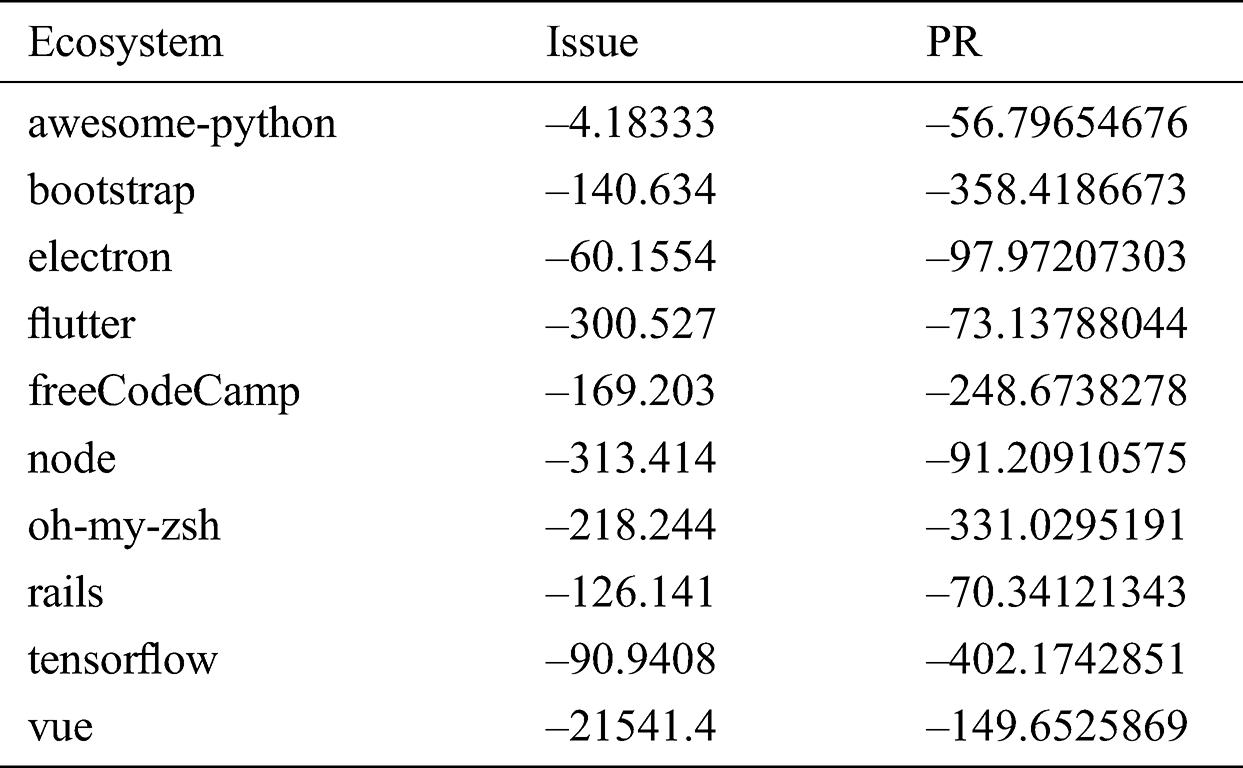
4) Language: Tab. 4 is shows the correlation between development languages and productivity. The absolute value of the correlation coefficient between the development language and the Issue number of the ecosystem is between 0 and 0.3, proving that the development language has no effect on Issue number in the open-source ecosystem. The highest correlation coefficient between ecosystem development language and PR number is the electron, whose correlation coefficient is 0.467. However, the correlation of other projects is weak, so it cannot be explained that ecosystem development language will affect the PR number. This paper concludes that developing languages does not affect the ability of ecosystems to produce information, which is the same as traditional software productivity studies.
Table 4: The impact of development languages on the ability of ecosystems to produce information

5) The number of projects involved: In the GitHub, participants have more experience when involved in more projects, so the number of participants involved in the ecosystem represents their experience. We guess that when participants have more experience, the ecosystem is more capable of solving problems. However, as can be seen from Tab. 5, the experimental results have deviated from expectations.
Table 5: The relationship between the number of ecosystems involved and the ability of ecosystems to solve problems

The number of participants involved in the ecosystem did not positively affect the Issue and PR’s closing speed. On the contrary, the more participants involved in the ecosystem, the slower the closing speed of the Issue and PR is. This rule can also be found in the scatter diagram of Issue and PR closing speed changing with the number of participants participating in the project. Fig. 5(a) is the scatter diagram of the relationship between Issue closing speed and the number of participants participating in the ecosystem, and Fig. 5(b) is the scatter diagram of the relationship between PR closing speed and the number of participants participating in the ecosystem.
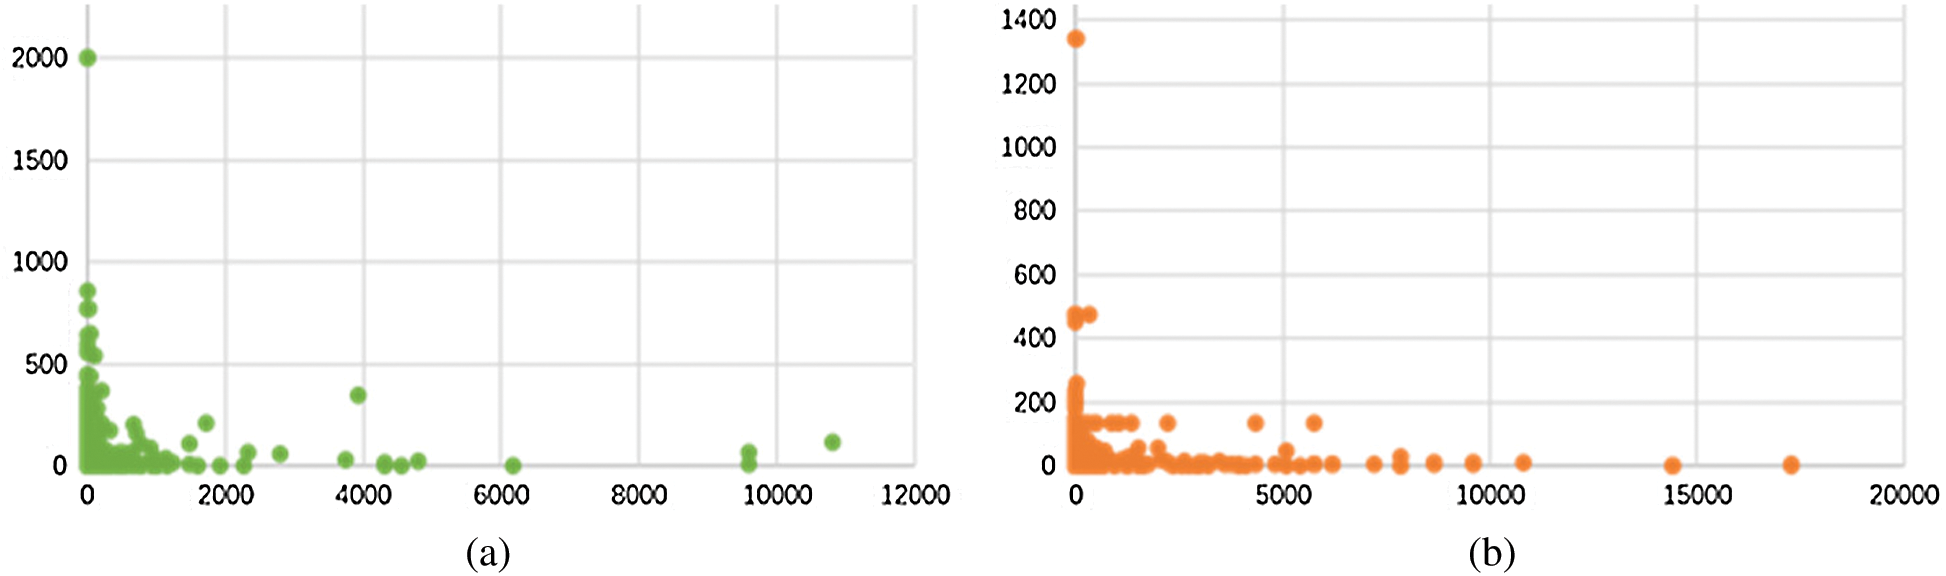
Figure 5: Scatter diagram of the relationship between the closing speed of Issue and PR and the number of participants participating in the project
GitHub allows users to simultaneously participate in multiple ecosystems, which is quite different from traditional software production environments. Although participants’ experience is improving as they participate in more ecosystems, the development of numerous ecosystems at the same time makes participants less focused. Based on this, this paper concludes that the more participants participate in the project, the less attention will be focused on one project, and the ecosystem’s ability to solve problems will be reduced. However, this does not mean that participants’ experience will harm the productivity of the ecosystem. In the follow-up research, a more comprehensive way can be chosen to represent participants’ experiences for further study.
6) Age of OSSECO: In the research on software products, we found that software productivity will gradually decrease after reaching a peak with the development of the project development cycle. This indicates that the project’s age impacts productivity, whether the impact is positive or negative. It is worth studying whether there is a significant change in the effect of ecosystem age on productivity in open source software ecosystems. In this paper, Issues and PR of 10 ecosystems in the data set were counted by month, and the statistical results were shown in Fig. 6.
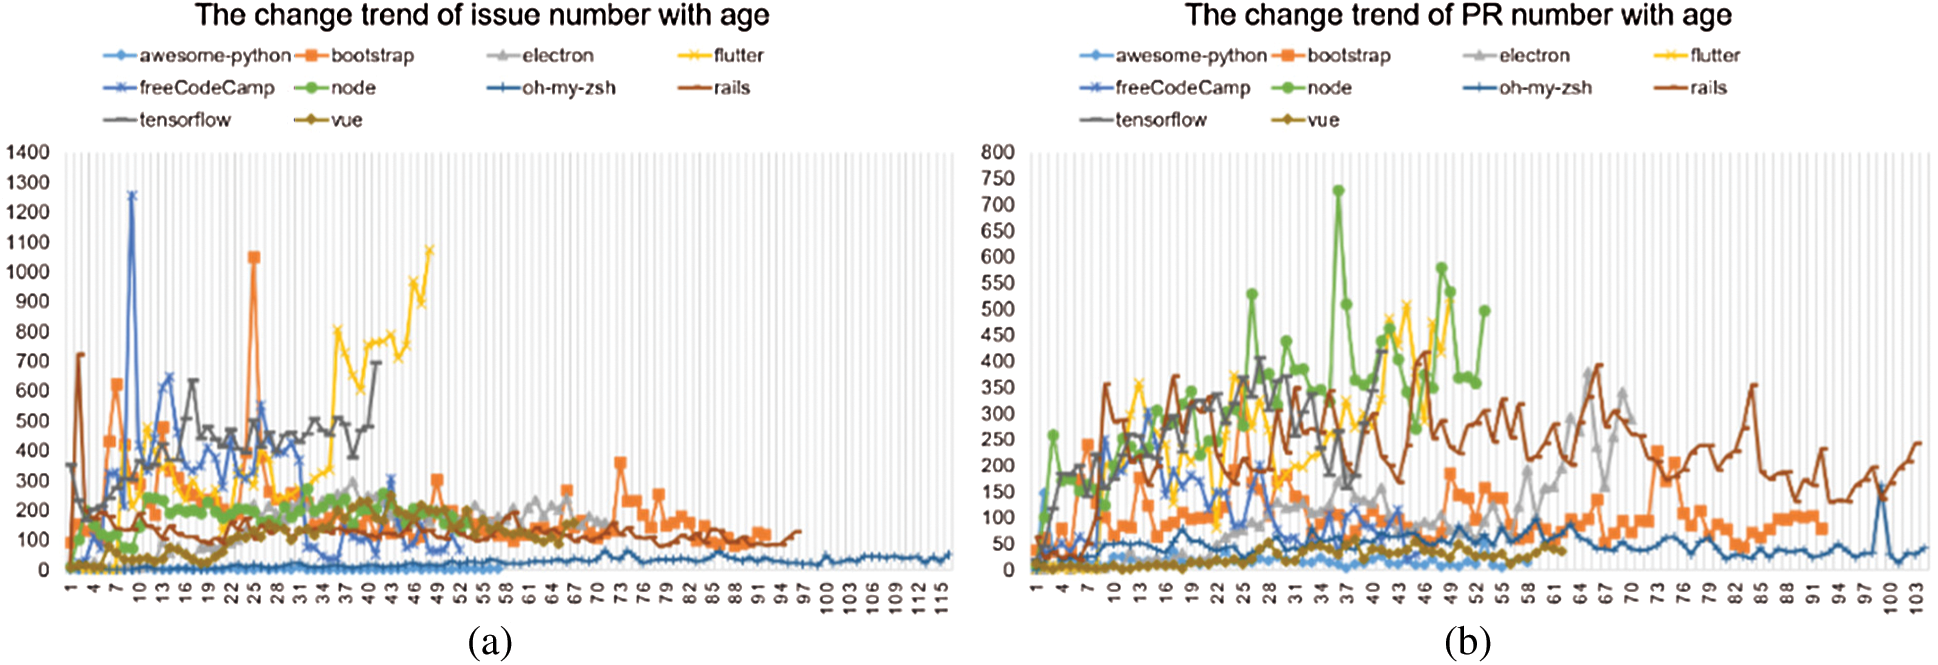
Figure 6: Effect of ecosystem age on the ability of ecosystem production information. (Fig. 6(a) is the statistics of the number of Issues released per month in 10 ecosystems in the dataset, and (b) is the statistics of the number of PRs released per month in 10 ecosystems. From the figure above, it can be seen that the number of issues and PRs of the ecosystem changes with the age of the ecosystem.)
It can be seen from Fig. 6 that there are three different trends of the number of Issue and PR per month with the age of the ecosystem: (1) The numbers have remained steady, such as oh-my-zsh, which remained around 30 PR per month as the ecosystem ages; (2) Increasing gradually, such as flutter, with the increase of ecosystem age, the number of Issue and PR published per month is also growing; (3) Gradually increases and then becomes stable after reaching a peak, such as bootstrap, whose monthly number of Issues increases slowly at first, when the ecosystem is released in the 25th month, the number of Issues is the largest. Then the number of Issues released monthly gradually stabilizes at about 150 per month.
The reason for these three different trends is that the ten ecosystems selected in this paper are currently at different stages. Awesome- python, electron, vue, and oh-my-zsh are presently in the early stage of development. Users have not discovered many problems with the project, so users will not release many Issues. Meanwhile, the release of PR is more about the participation of core members of the ecosystem, so the number of PR releases is relatively stable. Node, flutter, and TensorFlow are in the active development stage. More and more users are involved in the development of the project. They are willing to put forward more issues to help develop the ecosystem and contribute their PR to the ecosystem. Rails, freeCodeCamp, and bootstrap are in a stable development stage. More Issues have been solved after a period of active development, and the project functions are relatively complete. Much PR is not needed, only a few bugs need to be fixed, and the ecosystem gradually enters a more stable development stage.
However, it can still be determined that no matter what stage the ecosystem is in, the ecosystem’s age will impact its productivity.
7) PR Publisher: According to the experimental data, the characteristics of PR publishers in the OSSECO mainly include the number of publishers participating in the ecosystem and their followers.
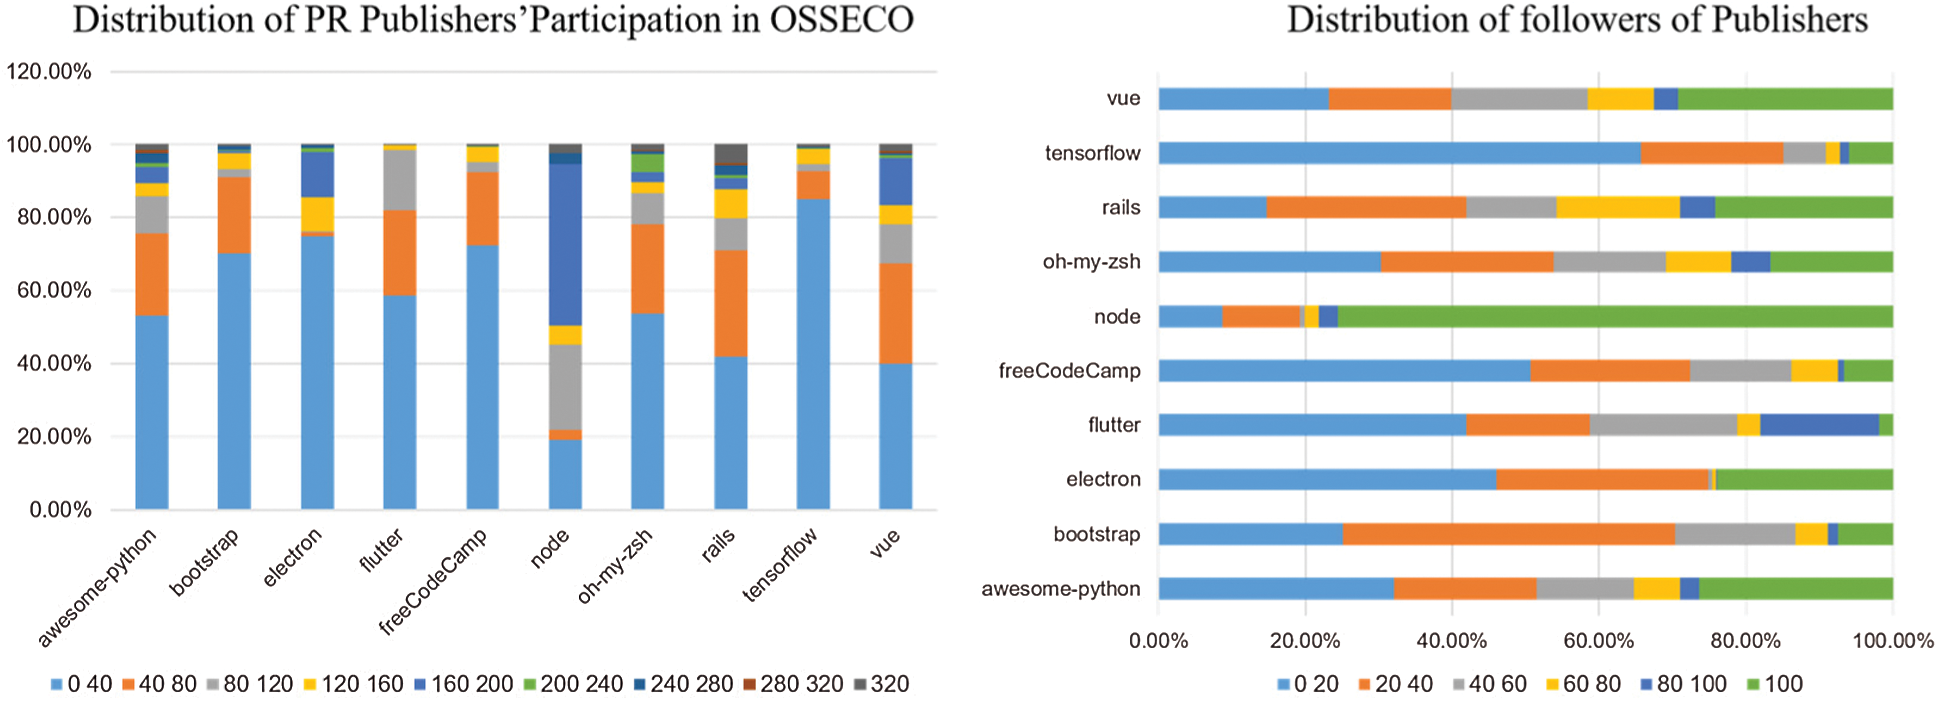
Figure 7: The impact of PR publishers on the net productivity of the OSSECO (The figure on the left of the figure above shows the proportion of the number of publishers involved in the ecosystem in the adopted PR of the ecosystem, and the figure on the right shows the proportion of the number of publishers’ followers in the adopted PR of the ecosystem)
The distribution of the number of PR publishers involved in the ecosystem and the number of followers of the publishers in 10 ecosystems are calculated, as shown in Fig. 7. In the adopted PR of the node ecosystem, more publishers are involved in 160–200 projects simultaneously. In other ecosystems, the number of publishers involved in the ecosystem is more distributed in 0–40. This shows that the ecosystem is more willing to accept the PR issued by publishers with less participation in the ecosystem because this PR’s quality is higher. Similarly, the more people who follow the publisher, although the publisher’s influence is stronger, the publisher’s identity may not allow him to devote more energy to an ecosystem, so in the adopted PR, more publishers do not have too many followers.
In summary, this paper concludes that when PR participates in more ecosystems or is followed by more people, publishers cannot invest too much energy in an ecosystem. Hence, the number of publishers participating in ecosystems and the number of followers harm ecosystems’ net productivity.
8) PR Reviewer: Traditional experience shows that when more people participate in software quality audits, stricter standards will be adopted. Therefore, this paper statistics the number of reviewers responsible for the PR audit in the ecosystem and statistics whether PR’s adoption rate will decline when more users participate in the audit of the ecosystem PR. The statistical results are shown in Fig. 8.
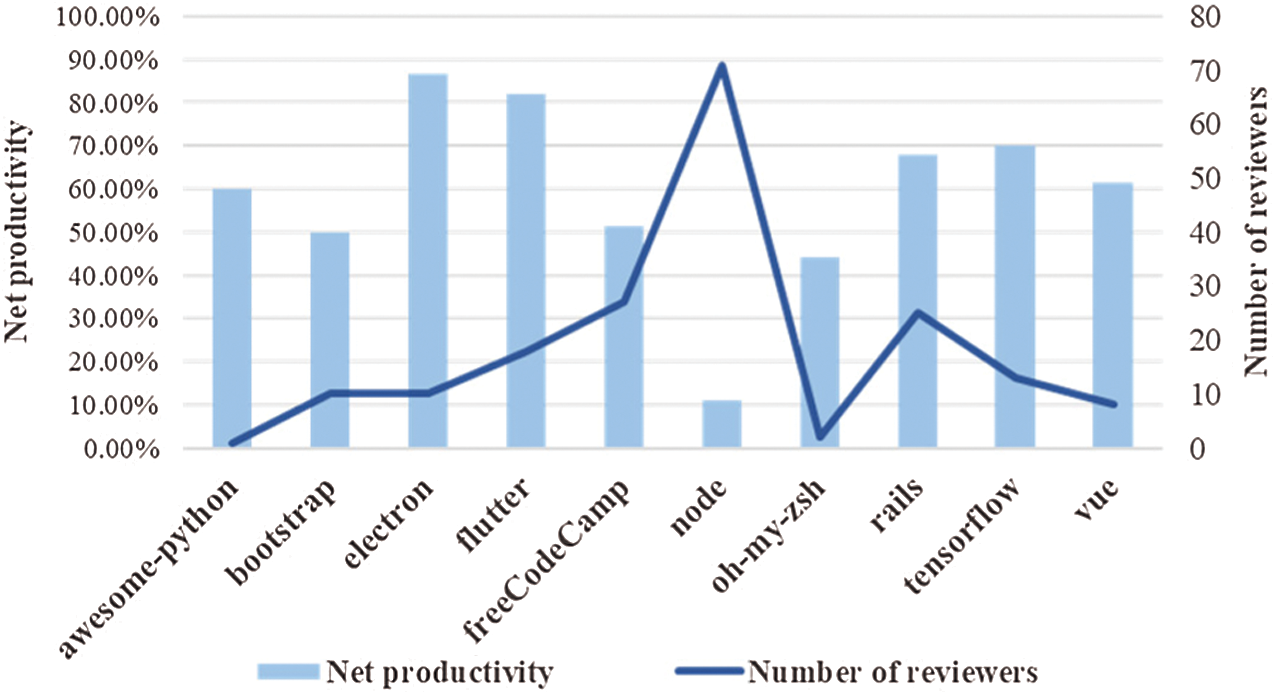
Figure 8: The relationship between the probability of PR adoption and the number of reviewers
It can be seen that the more people involved in the PR audit in the ecosystem, the lower the probability of PR adoption. Pearson correlation coefficient was used to analyze the correlation between the two groups of data. The analysis result was –0.648, indicating that the two groups of data had a robust negative correlation. This paper concludes that the net productivity of an ecosystem is lower when there are more reviewers. The net productivity of an ecosystem is highest when there are between 10 and 20 reviewers.
Based on the analysis of the above factors, we got Fig. 9, which summarizes each factor’s impact on ecosystem productivity. It can be seen that (a) Age of OSSECO, The degree of popularity and number of participants have a positive effect on ecosystem productivity; (b) Language does not affect productivity; (c) The other factors will harm the ecosystem productivity.
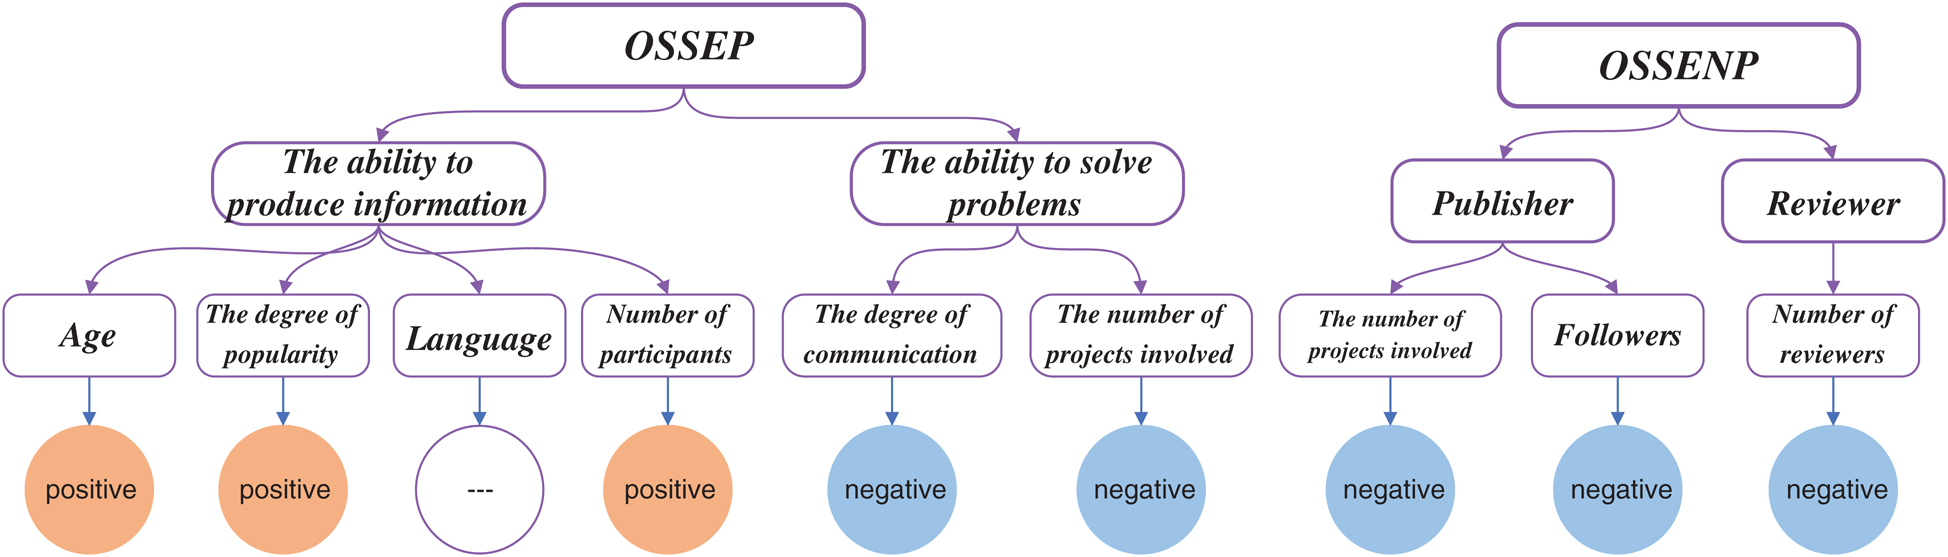
Figure 9: Analysis results of factors influencing the productivity of OSSECO
In order to help us understand the results of quantitative analysis better, we interviewed 36 researchers in the OSSECO based on quantitative analysis. The interview results show that the impact of factors such as Age of OSSECO, The degree of popularity, the number of projects involved, and the number of reviewers on productivity has been consistent with our analysis.
Besides, 91.7% of researchers believed that the use of popular development languages would positively impact the productivity of the OSSECO. In contrast, three people believed that language development would not affect the productivity of open-source software. They explained that in project development using GitHub, developers tend to be more willing to participate in projects they are good at and like. However, once they enter the project, the development language will not affect the participants’ production activities. That is to say, development languages will only affect the ecosystem’s ability to attract participants, but not the productivity of the ecosystem. This explains why the popularity of development languages in our analysis does not affect the productivity of the OSSECO.
Secondly, 83.3% of the researchers think that when the participants communicate more, the open-source software ecosystem will have a more vital ability to solve problems. However, our analysis results show that when the participants publish comments, other participants in the ecosystem will have to solve more questions related to this issue, so the speed of the Issue will be slower. That is to say, the communication degree of participants will harm ecosystem productivity. Six researchers accepted the results. Because in the ecosystem they participate in, they also encounter the same situation. A comment often leads to a series of more difficult problems. When the Issue or PR is solved with high quality, it takes more time.
This section answers RQ2 and RQ3. Combined with quantitative and qualitative research, we have determined that the factors that affect ecosystem productivity and the effects of these factors on productivity are both positive and negative.
This section builds an OSSECO productivity model based on the analysis results in Section 4. Since the analysis of the factors affecting productivity in Section 4 deals only with the relationship between the factors and productivity, it does not consider whether the factors affect each other. Therefore, the collinearity among various influencing factors should be considered when constructing the productivity model, and some variables should be eliminated. This also answers RQ4: What is the contribution of these factors affecting the OSSECO in building ecosystem productivity models?
In Section 4, it was found that the number of participants, age of ecosystems, and the degree of popularity all affected the ability of ecosystems to produce information. The number of participants involved in ecosystems and the degree of communication impact the ability of the ecosystem to solve problems.
Firstly, we use multiple linear regression to build the model of information production capacity of the ecosystem. Data such as the number of participants, ecosystem age, and the degree of popularity are added to the multivariate regression model. Then check whether there is a linear relationship between two independent variables. If there is a linear relationship, remove one of the variables, and the coefficient of this parameter is 0 in the final regression equation. After multiple linear regression was performed on all ten ecosystems, ten multiple regression equations were obtained (see in Tab. 6).
Table 6: Linear regression equations of influencing factors and productivity

It can be found that the regression equations of ecosystems are different, and the coefficient of the degree of popularity in 10 ecosystems is small, which does not contribute much to the ecosystem productivity model. At the same time, this paper needs to find a regression model suitable for most ecosystems, so for the coefficients of age and number of participants, this paper uses the real discovery algorithm [23] to calculate the coefficients the final regression equation.
The real discovery algorithm takes the mean or median of data sources as the center point. It uses a similarity (distance) algorithm to calculate the weight of the credibility of each data source for other data. Recalculate the center point’s position according to the weight, iterating several times until the center point is not changing. The process is shown in Fig. 10.
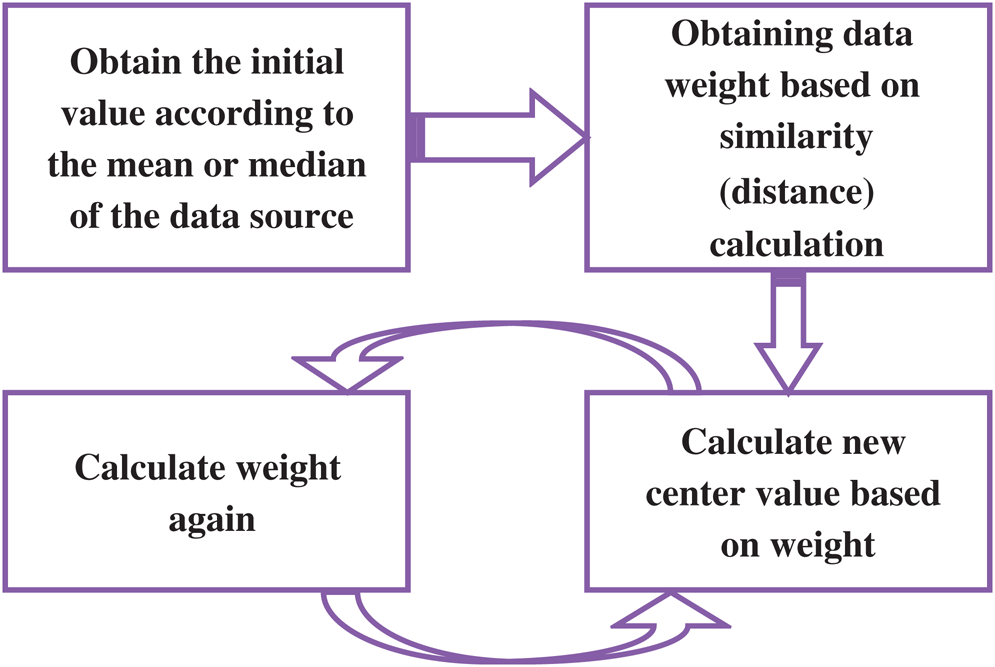
Figure 10: The computational process of real discovery algorithm
In Section 4, it should be noted that ecosystem productivity gradually reaches a peak and stabilizes with age. So the ecosystem age will no longer affect ecosystem productivity after reaching a specific value. The final regression equation is Formula 1. OSSEP_N represents the ability of the OSSECO to produce information, A represents the ecosystem age, and NP represents the number of participants.
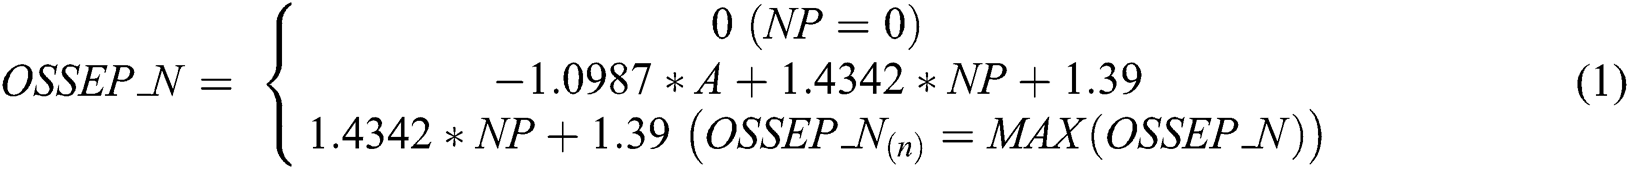
when  ,
,  . However, in Section 4, we know that the number of participants directly affects the amount of information, so when NP = 0, OSSEP_N = 0.
Then we model the ability of the ecosystem to solve problems. The relationship between the degree of communication, the number of participants participating in the ecosystem, and the problem-solving ability of the ecosystem are nonlinear. Therefore, multiple linear regression cannot be directly used for modeling. Combining with the definition of closing speed of Issue in Section 4, we can make a regression analysis on the variables of 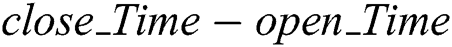 , the degree of communication and the number of participants participating in the project. Then we take the reciprocal of the formula. Finally, a computational model representing the closing speed of Issues in most ecosystems is obtained, as shown in Formula 2:

OSSEP_V represents the ability of the OSSECO to solve problems, C is the degree of communication (comment number of Issue and PR), and N is the number of participants participating in the ecosystem. Formula 1 and Formula 2 together constitute the productivity model of OSSECO.
In Section 4, the factors affecting the net productivity of the OSSECO have been analyzed. The analysis results show that the more projects PR publishers participate in and the more people follow PR publishers, the lower the net productivity of the ecosystem. At the same time, the net productivity of the ecosystem decreases with more PR reviewers. The influence of PR publisher related factors and reviewers related factors are summarized as shown in Fig. 11. In the figure, 0–40 refers to the proportion of the number of PR publishers participating in the project between 0–40 in the total number of PR publishers, and 0–20 refers to the number of followers in the total number of PR publishers.
However, Fig. 11 does not show the impact of the number of publishers participating in projects and other intervals of publishers’ followers on the net productivity of the ecosystem. Therefore, when constructing the net productivity model of OSSECO, this paper only selects the variable of the number of auditors to measure the net productivity of the ecosystem and adopts the least square method to obtain the regression equation of net productivity and the number of auditors.
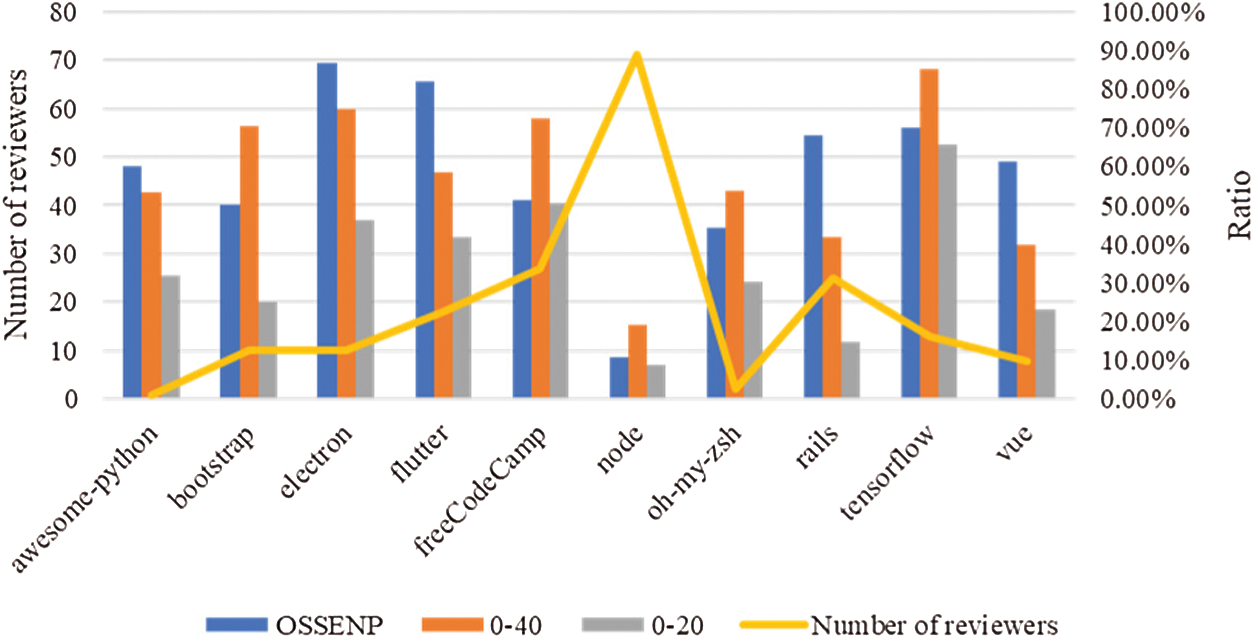
Figure 11: The relationship between the probability of PR adoption and the number of reviewers
The obtained model is Formula 3

In the formula, OSSENP refers to the net productivity of the OSSECO, that is, the ratio at which PR is adopted. NR refers to the number of people participating in the PR audit in the ecosystem.
This section answers RQ4. In the construction of the productivity model, we eliminated the collinearity variables through multiple linear regression, and finally only retained the age of OSSECO, the number of participants, the degree of communication, the number of participants participating in the ecosystem, and the number of PR reviewers. That is, these factors contribute more to the construction of the productivity model.
To verify the effectiveness of the productivity model constructed in this paper, we use the ecosystems not involved in the model construction, such as react-nation, backbone, meteor, angular, jquery, axios, express, and puppeter. The dataset for the validation experiments includes all Issue, PR, and STAR data for the above ecosystem from the start of publication until April 2019. This includes the release time, close time, and publisher attributes for Issue and PR, as well as the marker and mark time attributes for star.
The  model is validated first. Fig. 12 shows the
  model values compared with the actual production information capacity of the ecosystem. It can be seen that the
  model has excellent performance.
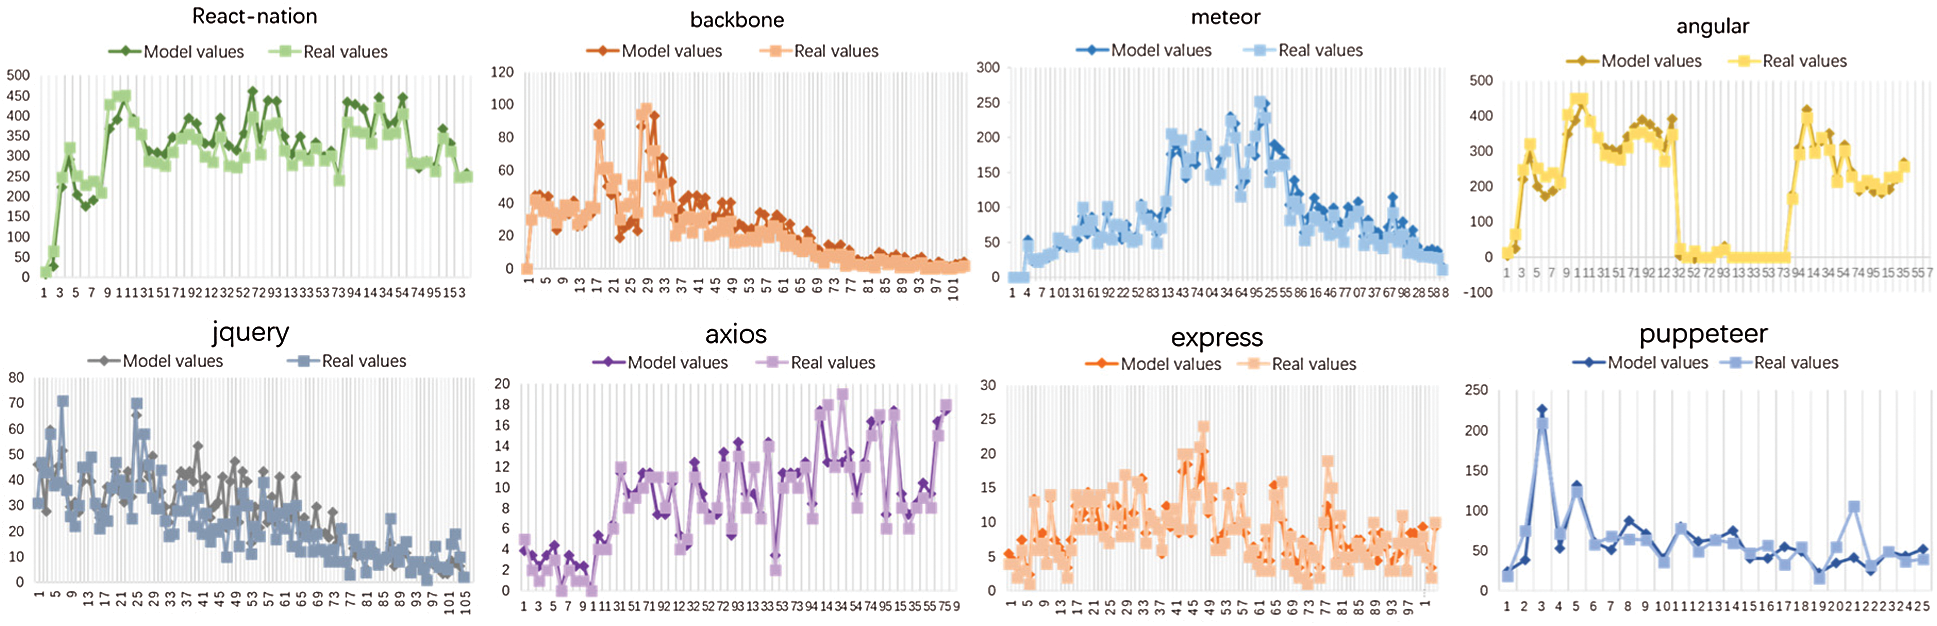
Figure 12: Productivity model verification results
The difference between the model value and the real value of the high ecosystem productivity is tested. The results show that the P-values of each group of data is more significant than 0.05. The F values are less than the F crit value, indicating no significant difference between the actual productivity of the ecosystem and the data calculated by the model.
Then, the  model was verified, and the data of the ecosystem were substituted into Formula 2 in turn. The difference test results between the model value and the actual data were shown in Tab. 7. Obviously, the P-values of data is more significant than 0.05. The F values are less than the F crit value. Therefore, there is no significant difference between the OSSEP_V model value and the ecosystem’s actual problem-solving ability. The
  model performs well.
Table 7: Difference test results

Frustratingly, when the  model was validated, there were currently 2491 closed PRs in the meteor ecosystem, of which 1066 were used by auditors, resulting in net ecosystem productivity of 42.79% to 13 PR auditors in that ecosystem. The model calculates net productivity of 62.1%, a significant discrepancy between the model value and the actual value.
To explain why this is the case, we looked at the specific properties of the PR data for all closed PRs in the meteor. We found that in the early ecosystem release period (before October 2015), only 13.1% of the PR in the ecosystem was merged. The net productivity of this period drags down the net productivity of the ecosystem throughout its life cycle. This is not the case for the 10 ecosystems involved in constructing the open source software ecosystem net productivity model, which is why there is a large gap between the modeled and actual values.
Therefore, the OSSECO productivity model constructed in this paper is good and can be applied to most open-source software ecosystems in the GitHub. However, the ecosystem net productivity model can only be applied to the ecosystem with uniform net productivity distribution. More work needs to be done on the performance of the model.
There are two primary threats to the validity of this study. Firstly, we choose the ecosystem with the highest star number in GitHub to obtain enough real and practical data sets. These ecosystems are mature and can ensure stable productivity. However, it can not ignore that many ecosystems are in the initial stage of development, and how different their characteristics are from those of the ecosystems that construct models. Although young ecosystems and ecosystems with few stars are also selected for model validation, the validation results are ideal. However, the ecosystem characteristics of the model have affected the scope of application of the model. We need to select a broader ecosystem and use the research methods in this paper to build more accurate models to evaluate our research work’s internal effectiveness.
Secondly, the data of GitHub are used in our research in the process of model construction and verification. This is because GitHub open source community is the largest open-source platform at present, and the production data of the ecosystem is sufficiently perfect. However, the same ecosystem often develops in many open source communities. Although the factors we choose to build the model can be measured by relevant data obtained in each open-source platform, the validity of this model in other open source communities has not been verified. In future work, we need to integrate production data from multiple platforms in the same ecosystem to optimize the model further to ensure our work’s external validity.
Firstly, this paper defines the concept of open-source software ecosystem productivity by analogizing the related research and concepts of the natural ecosystem and business ecosystem and analyzes the influencing factors of open source software ecosystem productivity by referring to traditional software research productivity. Then this paper builds an open source software ecosystem productivity model. Based on the GitHub open-source platform, this productivity model measures the number of Issue and PR in the ecosystem and how quickly Issue and PR are resolved (closed). Finally, the validity of the model is verified. It is verified that the ecosystem productivity model constructed in this paper has excellent performance, and the different test results are ideal. However, the net productivity model needs to be further optimized.
Although this paper has done much analysis of the factors affecting the productivity of the open-source software ecosystem and built a productivity model on this basis, however, there are still many shortcomings in this paper. It is necessary to conduct more in-depth and active research in future research work: (1) Firstly, as mentioned in Section 6 of this paper, the net productivity model of the open-source software ecosystem constructed in this paper does not perform well in the ecosystem with an uneven distribution of net productivity. In order to improve the universality, validity, and fault tolerance of the ecosystem net productivity model, more factors affecting net productivity need to be taken into account in subsequent studies. (2) Secondly, the experimental data selected in this paper are all from GitHub, but many production activities of open source software ecosystems are often synchronized on multiple open-source platforms. The final model built by analyzing and modeling only using the data in the GitHub platform can only be applied to GitHub. In future research, we need to consider using data from multiple platforms to study open source software ecosystems’ productivity from a more comprehensive perspective.
Funding Statement: This work was supported in part by the National Key R&D Program of China under Grant No. 2018YFB1003800.
Conflicts of Interest: The authors declare that they have no conflicts of interest to report regarding the present study.
1. K. Manikas. (2016). “Revisiting software ecosystems research: A longitudinal literature study,” Journal of Systems and Software, vol. 117, no. 1, pp. 84–103. [Google Scholar]
2. M. Iansiti and R. Levien. (2004). “Collective behavior,” in The Keystone Advantage: What the New Dynamics of Business Ecosystems Mean for Strategy, Innovation, and Sustainability. 1st edition. Boston, USA: Harvard Business Press, 41–67. [Google Scholar]
3. S. Boshuis, T. B. Braam and A. P. Marchena. (2018). “The effect of generic strategies on software ecosystem health: The case of cryptocurrency ecosystems,” in 2018 IEEE/ACM 1st Int. Workshop on Software Health (SoHeal). Gothenburg, Sweden, 10–17. [Google Scholar]
4. S. Jansen. (2014). “Measuring the health of open source software ecosystems: Beyond the scope of project health,” Information and Software Technology, vol. 56, no. 11, pp. 1508–1519. [Google Scholar]
5. B. Vasilescu and Y. Yu. (2015). “Quality and productivity outcomes relating to continuous integration in GitHub,” in Proc. of the 2015 10th Joint Meeting on Foundations of Software Engineering, New York, NY, USA, pp. 805–816. [Google Scholar]
6. C. E. Walston and C. P. Felix. (1977). “A method of programming measurement and estimation,” IBM Systems Journal, vol. 16, no. 1, pp. 54–73. [Google Scholar]
7. A. J. Albrecht. (1979). “Measuring application development productivity,” in Proc. of the Joint SHARE, GUIDE, and IBM Application Development Sym., Monterey, USA, pp. 83. [Google Scholar]
8. C. Dale. (1992). “Software productivity metrics: Who needs them?,” Information and Software Technology, vol. 34, no. 11, pp. 731–738. [Google Scholar]
9. C. Jones. (1986). “Introduction,” in Programming Productivity, 1st edition. New York, USA: McGraw-Hill College, pp. 4–6. [Google Scholar]
10. C. Jones. (2000). “Identifying software best and worst practices,” in Software Assessments, Benchmarks, and Best Practices, 1st edition. New Jersey, USA: Addison-Wesley, pp. 89–109. [Google Scholar]
11. T. Demarco and T. Lister. (2013). Productivity measurement and unidentified. in Peopleware: Productive Projects and Teams. 3rd edition. New Jersey, USA: Addison-Wesley, 57–61. [Google Scholar]
12. D. Wahyudin, K. Mustofa and A. Schatten. (2007). “Monitoring the ‘health’ status of open source web-engineering projects,” International Journal of Web Information Systems, vol. 3, no. 1/2, pp. 116–139. [Google Scholar]
13. K. Manikas and K. M. Hansen. (2013). “Reviewing the health of software ecosystems—A conceptual framework proposal,” in Proc. of the 5th Int. Workshop on Software Ecosystems (IWSECOPotsdam, Germany, pp. 33–44. [Google Scholar]
14. J. D. Mcgregor. (2016). “Software ecosystems architectural health: Challenges x practices,” in Proc. of the 10th European Conf. on Software Architecture Workshops, New York, NY, United States, pp. 4. [Google Scholar]
15. M. Iansiti and R. Levien. (2004). “Strategy as ecology,” Harvard Business Review, vol. 82, no. 3, pp. 68–81. [Google Scholar]
16. L. Michael. (2004). “The keystone advantage: What the new dynamics of business ecosystems mean for strategy, innovation, and sustainability,” Academy of Management Perspectives, vol. 20, no. 2, pp. 88–90. [Google Scholar]
17. I. Van Den Berk, S. Jansen and L. Luinenburg. (2010). “Software ecosystems: A software ecosystem strategy assessment model,” in Proc. of the Fourth European Conf. on Software Architecture: Companion Volume, Copenhagen, pp. 127–134. [Google Scholar]
18. Z. Liao, L. Deng and X. Fan. (2018). “Empirical research on the evaluation model and method of sustainability of the open source ecosystem,” Symmetry, vol. 10, no. 12, pp. 747. [Google Scholar]
19. Z. Liao, M. Yi and Y. Wang. (2019). “Healthy or not: A way to predict ecosystem health in GitHub,” Symmetry, vol. 11, no. 2, pp. 144. [Google Scholar]
20. X. Li, X. Jie and Q. Li. (2013). “Research on the evaluation of business ecosystem health,” in Proc. of the Sixth Int. Conf. on Management Science and Engineering Management, Islamabad, Pakistan, pp. 1009–1020. [Google Scholar]
21. E. A. Barros. (2010). “A review of productivity factors and strategies on software development,” in Fifth Int. Conf. on Software Engineering Advances. Nice, France, 169–204. [Google Scholar]
22. D. Lambert. (1992). “Zero-inflated Poisson regression, with an application to defects in manufacturing,” Technometrics, vol. 34, no. 1, pp. 1–14. [Google Scholar]
23. Q. Li, Y. Li and J. Gao. (2014). “Resolving conflicts in heterogeneous data by truth discovery and source reliability estimation,” in Proc. of the 2014 ACM SIGMOD Int. Conf. on Management of Data, New York, NY, US, pp. 1187–1198. [Google Scholar]
 | This work is licensed under a Creative Commons Attribution 4.0 International License, which permits unrestricted use, distribution, and reproduction in any medium, provided the original work is properly cited. |