DOI:10.32604/csse.2021.014327
| Computer Systems Science & Engineering DOI:10.32604/csse.2021.014327 | |
| Article |
Impact of Distance Measures on the Performance of AIS Data Clustering
1Department of Maritime Telecommunications, Gdynia Maritime University, Morska 81-87, 81-225, Gdynia, Poland
2Department of Information Systems, Gdynia Maritime University, Morska 81-87, 81-225, Gdynia, Poland
*Corresponding Author: Marta Mieczyńska. Email: m.mieczynska@we.umg.edu.pl
Received: 13 September 2020; Accepted: 01 November 2020
Abstract: Automatic Identification System (AIS) data stream analysis is based on the AIS data of different vessel’s behaviours, including the vessels’ routes. When the AIS data consists of outliers, noises, or are incomplete, then the analysis of the vessel’s behaviours is not possible or is limited. When the data consists of outliers, it is not possible to automatically assign the AIS data to a particular vessel. In this paper, a clustering method is proposed to support the AIS data analysis, to qualify noises and outliers with respect to their suitability, and finally to aid the reconstruction of the vessel’s trajectory. In this paper, clustering results have been obtained using selected algorithms, including k-means, k-medoids, and fuzzy c-means. Based on the clustering results, it is possible to decide on the qualification of data with outliers and on their usefulness in the reconstruction of the vessel trajectory. The main aim of this paper is to answer how different distance measures during a clustering process can influence AIS data clustering quality. The main core question is whether or not they have an impact on the process of reconstruction of the vessel trajectories when the data are damaged. The research question during the computational experiments asked whether or not distance measure influence AIS data clustering quality. The computational experiments have been carried out using original AIS data. In general, the experiment and the results confirm the usefulness of the cluster-based analysis when the data include outliers that are derived from the natural environment. It is also possible to monitor and to analyse AIS data using clustering when the data include outliers. The computational experiment results confirm that the k-means with Euclidean distance has the best performance.
Keywords: AIS; SAT-AIS; AIS data stream; clustering; maritime data analysis
Automatic Identification System (AIS) is a tracking system that aims to provide the exchange of data among neighbouring ships, AIS base stations and satellites. The AIS has been proposed for the transmission of a ship’s position, so that other ships are aware of it and can possibly avoid a collision. AIS messages are not addressed to a particular unit, but are instead broadcast and received by anyone with a receiver within range.
The AIS was introduced in the late-1990s. According to the International Maritime Organization’s International (IMO) Convention for the Safety of Life at Sea (SOLAS), ships with 300 or more gross tonnage (GT) and all passenger ships regardless of size [1] are required to be fitted with AIS.
AIS improves the safety of navigation as a means of support in collision avoidance (ship to ship). AIS is also a means for littoral states to obtain information about a ship and its cargo. The system can also assist in the effective navigation of ships and the operation of a Vehicle Tracking System (VTS), which is software that collects AIS data and assures their graphic presentation together with vessel tracking.
AIS is effective in a range of other applications, including [2]:
• Fishing fleet monitoring and control,
• Maritime security,
• Fleet and cargo tracking,
• Aids to navigation,
• Search and rescue,
• Area monitoring to support environmental protection.
Based on AIS, the IMO also controls the navigational lanes that can be used by vessels. The rules that regulate general directions in the specific regions for the vessels to navigate are called Traffic Separation Schemes (TSS) [3].
AIS devices broadcast the location of a vessel along with other information, including identity, course and speed. In total, 400,000 ships worldwide are equipped with AIS transponders, which generate 80 million messages per day [4]. Position reports are broadcast frequently (between 2–10 seconds, depending on the vessel’s speed, or every 3 minutes if at anchor), while static and voyage related reports are sent every 6 minutes. Thus, the AIS data can be viewed as big data and as a data stream.
Originally, terrestrial AIS was a time-sharing broadcast system based on a very high frequency (VHF), where vessels take turns to transmit in discrete time slots. In general, the information broadcast by each vessel can be received by other vessels or land-based receivers within just tens of miles in a line-of-sight range. This is due to the nature of VHF waves. However, VHF technology is susceptible to environmental conditions, obstacles, as well as AIS network overload, thereby reducing the AIS signal successful reception rate and the correctness of the messages [5].
The terrestrial AIS limitation follows also from the Earth’s curvature, which limits its potential horizontal range to about 74 km from shore. This means that AIS traffic information is only available around coastal zones or in direct view of the ships. Thus, AIS can be classified as a system for exchange of information at a local scale.
The Satellite–Automatic Identification System (SAT-AIS) was introduced as an alternative system for the exchange of information but at a global scale [6,7]. SAT-AIS uses receivers that are mostly located on low-earth-orbit (LEO) satellites, which then send the AIS message to ground stations for further processing and distribution.
The general coverage of the AIS system has been increased by the use of LEO satellites. While the SAT-AIS poses a coverage advantage over terrestrial AIS, a satellite-based AIS is more expensive, and is not entirely free of issues.
SAT-AIS has been introduced based on generic assumptions of AIS. Consequently, it generates a number of problems for a satellite system. The main problem of SAT-AIS is called a data packet collision. When two or more units try to use the same transmission time slot, the messages are garbled and lost. The AIS receiver, which is installed on-board of a satellite, records signals transmitted by ships located in different areas, but in the satellite field-of-view (FOV) (see for example Fig. 1). Transponders from different terrestrial AIS service areas, being in the satellite FOV, are not synchronized between themselves or with the satellite, and they try to use the same transmission time slot. As a result, the packages contain errors [8]. The probability of collisions grows with the increasing number of transmitters in an area and when the service area of the satellite receiver is increased.
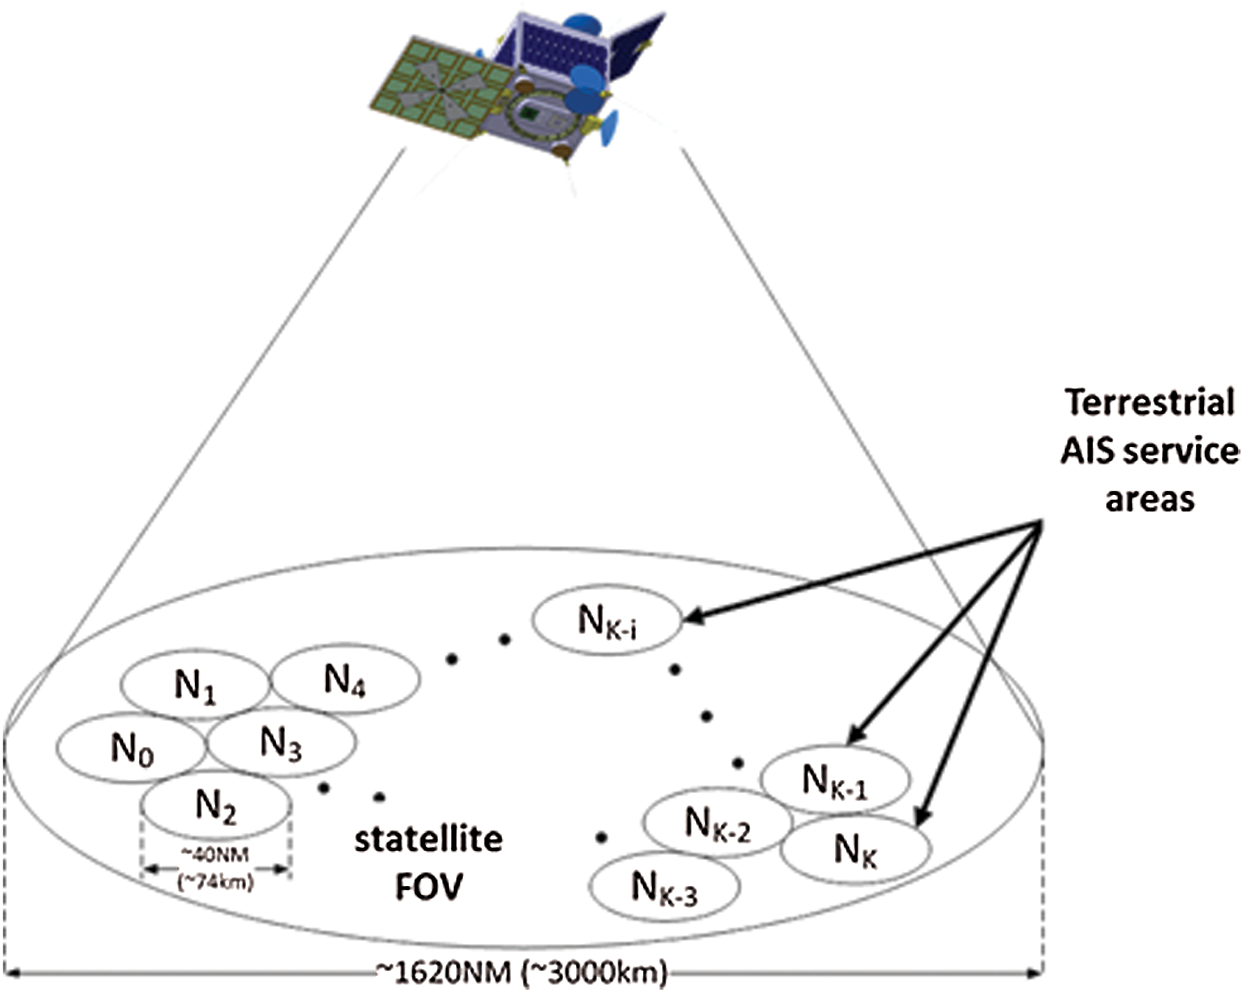
Figure 1: AIS service areas in a satellite field-of-view [9]
In summary, the limitations of AIS, as well as SAT-AIS, result in the fact that the AIS messages can be incomplete, garbled or can include so-called outliers. When such AIS messages are further analysed, observed vessels’ trajectories are likely to be incomplete, difficult to understand and introduce informative noise by anomaly. These outliers can have a negative influence on a quality of navigation analyses. It can also mean that the principle functionalities based on AIS cannot be realized.
This paper considers the problem of reconstruction of vessels’ routes when the AIS data stream consists of outliers and the vessel’s trajectories do not conform to expected behaviours. In this paper, we assume that a general information about vessels in given area are known. However, a part of AIS information (AIS data) can contain outliers and errors. With respect to the information quality, these outliers are a source of an information noise, this means that this AIS data cannot be automatically assigned to the set of AIS data of particular vessel. The aim of the paper is to show that a clustering analysis can be helpful in AIS data analysis in such way that when the data contain outliers, it is possible to determine the membership of such data to an appropriate vessel’s trajectory.
In this paper, for clustering AIS data, a set of selected algorithms (i.e., k-means, k-medoids, fuzzy c-means) has been used. In general, the clustering algorithm has been used as a tool for AIS data analysis assuming occurrence of the outliers within the data. Thus, assuming that the number of vessels in a particular area is known, then clustering of the available AIS data from such area on number of clusters, equal to the number of vessels, should help in deciding on qualification of data with outliers. This qualification can result in reconstruction of the vessel trajectory. While the aim of the research was to evaluate the suitability of clustering algorithms to work with AIS data containing noise for which the initial results has been presented previously in [10], the main aim of the current computational experiments was to answer how different distance measures during a cluster process can influence AIS data clustering quality, and whether they have impact on the process of reconstruction of the vessel trajectories when the data are damaged. So, in this paper the main research question is whether distance measure influences AIS data clustering quality.
The rest of this paper is organized as follows: Section 2 contains a discussion of AIS data structure and motivation on implementation of the clustering approach in the considered problem. The utilized AIS data, clustering algorithms and distance measures are presented in Section 3. The experiment results are presented and discussed in Section 4. Finally, our conclusions and suggestions for future research are included in the last section.
2 AIS Data and Problem Formulation
The AIS data are transmitted as data of two categories; that is, static and dynamic. The static data are included into the read-only memory of the AIS device and include the IMO number, Maritime Mobile Service Identity (MMSI) number, vessel call sign, vessel type, vessel dimensions (length and beam). The dynamic data are updated automatically and are up to date. They include the ship’s location (longitude and latitude), Course Over Ground (COG), Speed Over Ground (SOG), true heading, Rate of Turn (ROT), time in UTC (Coordinated Universal Time), navigational status, etc. [11].
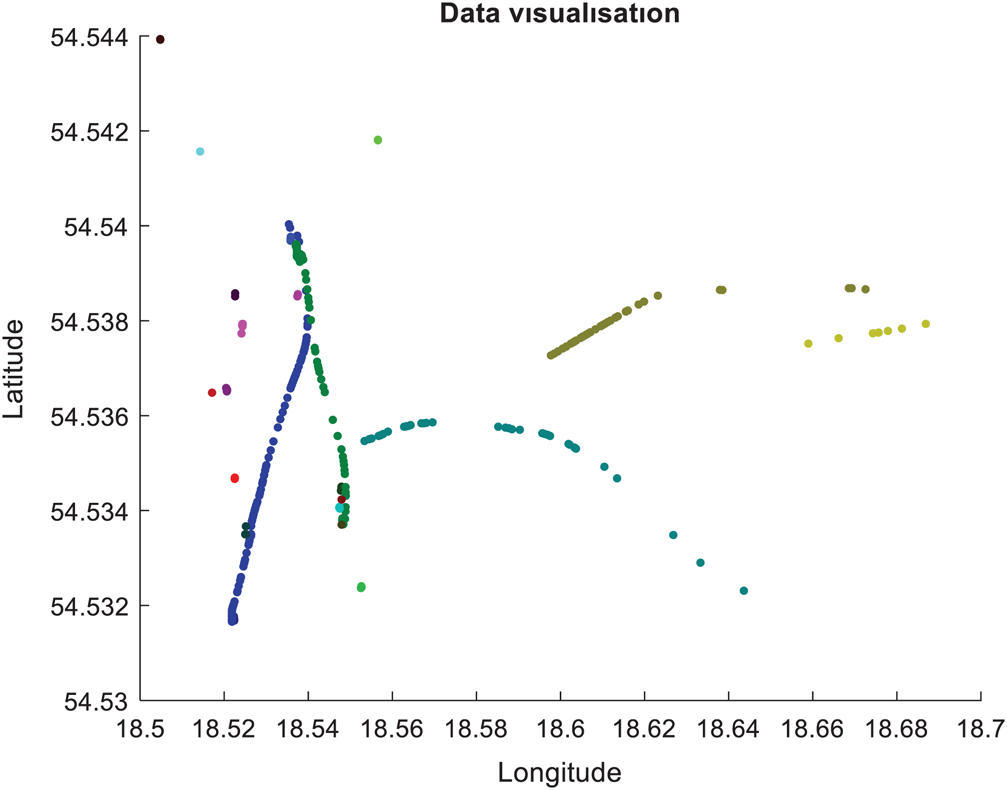
Figure 2: Visualization of collected ship trajectories on a 2-D plot (each marked with a different colour)
In the AIS system, the dynamic information regarding the trajectory of a ship is exchanged in three types of messages, as follows: Type 1 (scheduled position reports), Type 2 (assigned position reports) and Type 3 (special position reports). All of them are 168-bits binary messages. To reconstruct the vessel’s trajectory, a set of messages from those types that needs to be recorded and analysed. A sample of those data, in a form of changes of longitude and latitude of 22 ships in a 35-min time period, is presented in Fig. 2.
2.2 Representing Trajectory Data
From the technical point of view, AIS is a system that produces streams of data. For example, for position reports, each vessel transmits information about its current location at time intervals that are predefined by the technical specifications [11]. Collecting such data allows a ship’s trajectories to be analysed.
A vessel’s trajectory can be defined as a finite sequence  , where i represents an individual vessel, tM is a time for which the trajectory is observed, tm is the time-stamp (where m = 1,…,M),
  corresponds to a multidimensional vector of a vessel at time tm and can be expressed by a set of the following vectors:

where x1, x2, …, xN are the features derived from AIS messages Types 1–3 and N is a number of features.  can be also called as a trajectory point (or data point).
Table 1: AIS reporting intervals for Class A transponders (Source: [11])

However, the intervals between consecutive position reports may vary and this can be noted as follows: Δtm = tm–tm−1. They depend on several factors, such as the type of a ship, its speed or current behaviour (e.g., whether the ship is changing course or not). Tab. 1 shows the nominal reporting intervals to exchange dynamic conditions (e.g., position) by Class A transponders in the AIS system, the intervals vary from 2 s to 3 min.
2.3 Clustering Approach to AIS Data Analysis
A potential set of AIS data includes data points that belong to a given vessel. These data points can form a movement trajectory of the vessel. This means that the data points are similar in some sense. According to clustering theory, this means that they belong to the same cluster. A given data point that does not belong to any movement trajectory in a specific area can be classified as an outlier.
In general, clustering is an example of an unsupervised machine learning technique that divides the input dataset into a certain number of groups. It is done, for instance, by finding the most similar data points and then assuming that they can be put into one group, with any selected metric being the measure of their similarity.
Thus, the problem of outlier identification within a set of trajectory points can be formulated in the following formal manner: given a data set T of moving trajectory points in a specific area, and C1,…,Ck are the clusters of T with respect to assumed measure of similarity d, then the outliers are trajectory points in T which do not belong to any cluster Ci:i=1,..,k or least match to the identified groups.
In this paper, the cluster-based approach to AIS data analysis has been proposed. Clustering the AIS data is one possible approach to find abnormal, either damaged or incomplete, outliers. Clustering can also help in the reconstruction of AIS messages. In this sense, the main purpose of AIS data clustering is to distinguish data points that originate from each of the vessels, even if the message bits corresponding to the ship identifier were damaged. Therefore, ideally, such a cluster would contain messages from only one ship. Meanwhile, it is desirable that the messages originating from one ship have not been split into multiple clusters.
The following parts of this paper describe the details of the proposed approach and computational experiment, where the clustering approach has been applied, which focuses on the choice of the optimal distance metric to make the AIS data clustering as accurate as possible.
The AIS data have been used to create a dataset that served as the input of clustering algorithms. The dataset consists of decoded information from 850 AIS messages, Types 1–3, that were collected from the area of the Gulf of Gdańsk in a 35-min-long time period. During this time, the messages from 22 different vessels were recorded. Therefore, the initial number of clusters that the data have been divided into was equal to 22 (to ideally achieve the results of grouping messages from only one ship in one cluster).
The data represent a small part of a data stream, although they describe trajectories of 22 vessels in a given period time including nearly one thousand different AIS packages. Because the time period is not relatively long, it can be assumed that the problem can be considered with respect to the batch problem (batch mode), which has been done in this paper and which is a simplification.
The numerical features that have been used are longitude, latitude, SOG, COG and true heading. The categorical data (i.e., navigational status, special manoeuvre indicator, ship identifier and country identifier) have been converted by one-hot-encoding method to binary vectors (with only one “true” value in the entire vector, corresponding to its category).
In summary, the features in the proposed model are set as follows:
• x1–longitude,
• x2–latitude,
• x3–x18–navigational status,
• x19–speed over ground,
• x20–course over ground,
• x21–true heading,
• x22–x25–special maneuver indicator,
• x26–x85–ship identifier, and
• x86–x115–country identifier,
that gives the total number 115 features.
In the majority of conducted experiments the data have been standardized.
For the computational experiments, the selected data have been artificially damaged and mistakes have been introduced on random selected trajectory points (i.e., outliers have been introduced within the data).
There are many different clustering algorithms. The following three are considered in this paper:
K-means [12], which is an iterative algorithm for unsupervised clustering. Given the number of potential clusters, k, it selects k so-called centroids that are supposed to take the role of centres of newly formed groups. In the next step, the distances (using a defined metric) between data points and each of the centroids are calculated, so that the data point can be assigned to the specific cluster with the centroid closest to that data point. The means of all of the data points grouped into each cluster are then computed to form new centroids. The process of assigning data points to clusters and moving centroids is repeated until either there is no change in re-assigning the data points (i.e., they eventually belong to the correct cluster) or the maximum number of iterations have been achieved.
K-medoids [13], which are very similar to k-means in the sense of consecutive steps of the algorithm. The main difference is that the centroids (called medoids) of the clusters must overlap with one of the points assigned to that cluster (i.e., the data point closest to the calculated mean is chosen to be the next medoid).
Fuzzy c-means [14]. In both of the previous clustering algorithms the data are divided into separated clusters and each data point can only belong to exactly one cluster. In fuzzy clustering, the data points can belong to multiple clusters and for each data point its membership grade is calculated. The membership grade indicates the degree to which a data point belongs to a cluster. The fuzzy c-means algorithm works similar to k-means. The difference is that it calculates the membership grade. A basic difference is that fuzzy c-means automatically determines the number of clusters.
In this paper, several distance metrics have been applied to evaluate which one is the best for clustering of AIS data [8]. The experiment aimed at evaluating among the following metrics:
Euclidean distance, which is also called squared Euclidean, calculates the distance between two points by summing the squared difference between each variable:

It is the default metric for most of the algorithms. It is sensitive for the discrepancy in one of the variables, hence it is better for data to be standardized first.
Manhattan distance, which computes the distance between two points by summing the absolute difference between each variable:

If two points have similar values in most of the variables but significantly vary in one of them, then the Manhattan metric focuses on the closeness of the similar ones, contrary to the Euclidean metric. Meanwhile, both those metrics are sensitive to outliers.
Cosine distance, which calculates the cosine of an angle between vectors created by the data points:

Chebychev distance, which chooses the maximum of the absolute differences between the variables in a couple of data points (5):

Hamming distance, which can be used if the dataset consists only of binary or categorical data. Hamming metric compares the data points variable by variable and computes the number of mismatches between them.
Note: In these formulas, d represents the calculated distance, p and q are n-dimensional points which the distance is measured between, while pi is ith feature of point p.
3.4 Quality of the Clustering Results
To evaluate the correctness of the clustering, the following metrics have been used in this paper.
Silhouette [15], which is used to roughly verify the quality of clustering, without the insight if the clustering results fit the needs of further applications (i.e., anomaly detection). The silhouette is calculated by checking whether each data point is truly closest to other data points in the same cluster, rather than to data points from any other cluster. It takes values from −1 (worst clustering) to 1 (best).
Correctness coefficient (CC), which is an original, new indicator that we created during this experiment strictly to assess the correctness of AIS data grouping for a further anomaly detection phase. It calculates not only to which extent the data points gathered in one cluster consist of data originated from one particular vessel but also if data originated from one particular vessel are not split into several clusters. It is computed with the use of formula (6):

where CHC is called Clusters’ Homogeneity Coefficient (it is a weighted average of percentages of how many points in each cluster originated from one particular vessel) and VHC is Vessel’s Homogeneity Coefficient (another weighted average of percentages of how many points originated from one particular vessel have been grouped into one cluster). CC is a harmonic mean of those two means and ranges from 0 (worst clustering) to 1 (best).
To measure the impact that different distance metrics and clustering algorithms have on the results of clustering the AIS data, the following experiment has been conducted: using the dataset described in part A of the previous section, the clustering process has been repeated several times. Each time the data have been divided into 22 groups, which is the number of vessels that the data originated from. The aim of the experiments has been to evaluate whether and to what extent the grouping algorithms identify the same ships described on the AIS data. In the case of outliers, which are the effect of introduction of mistakes on individual trajectory points, the question was to allocate the points with the outliers to the proper clusters (i.e., identify the vessels and their trajectory points despite the outliers).
With each iteration, three major changes to the clustering process have been implemented. The first change was made to the clustering algorithm. Here, one of the following has been chosen: k-means, k-medoids or fuzzy c-means. The second change was the distance metric taken from the list from part C of the previous section: Euclidean, Manhattan, cosine, Chebychev or Hamming. (Note: With Hamming distance, the original binary messages have been put as the input of the clustering algorithm, not their decoded forms described in part A of the previous section). Finally, using the k-means and fuzzy c-means algorithms, in several cases the data have not been standardized before clustering to see the influence of the standardization itself.
Finally, with each iteration, the results of clustering have been collected, not only the visual representation of clustering (which will be presented and discussed further in Fig. 3) but also the numerical values in a form of silhouette and CC described earlier.
Table 2: Results of the experiment

By examining the silhouette values in Tab. 2 and Fig. 3a, it can be noticed that the Euclidean distance metric that provides the best clustering in overall (either for k-means or k-medoids algorithm, as well as fuzzy c-means), resulting in silhouette values above 0.9.
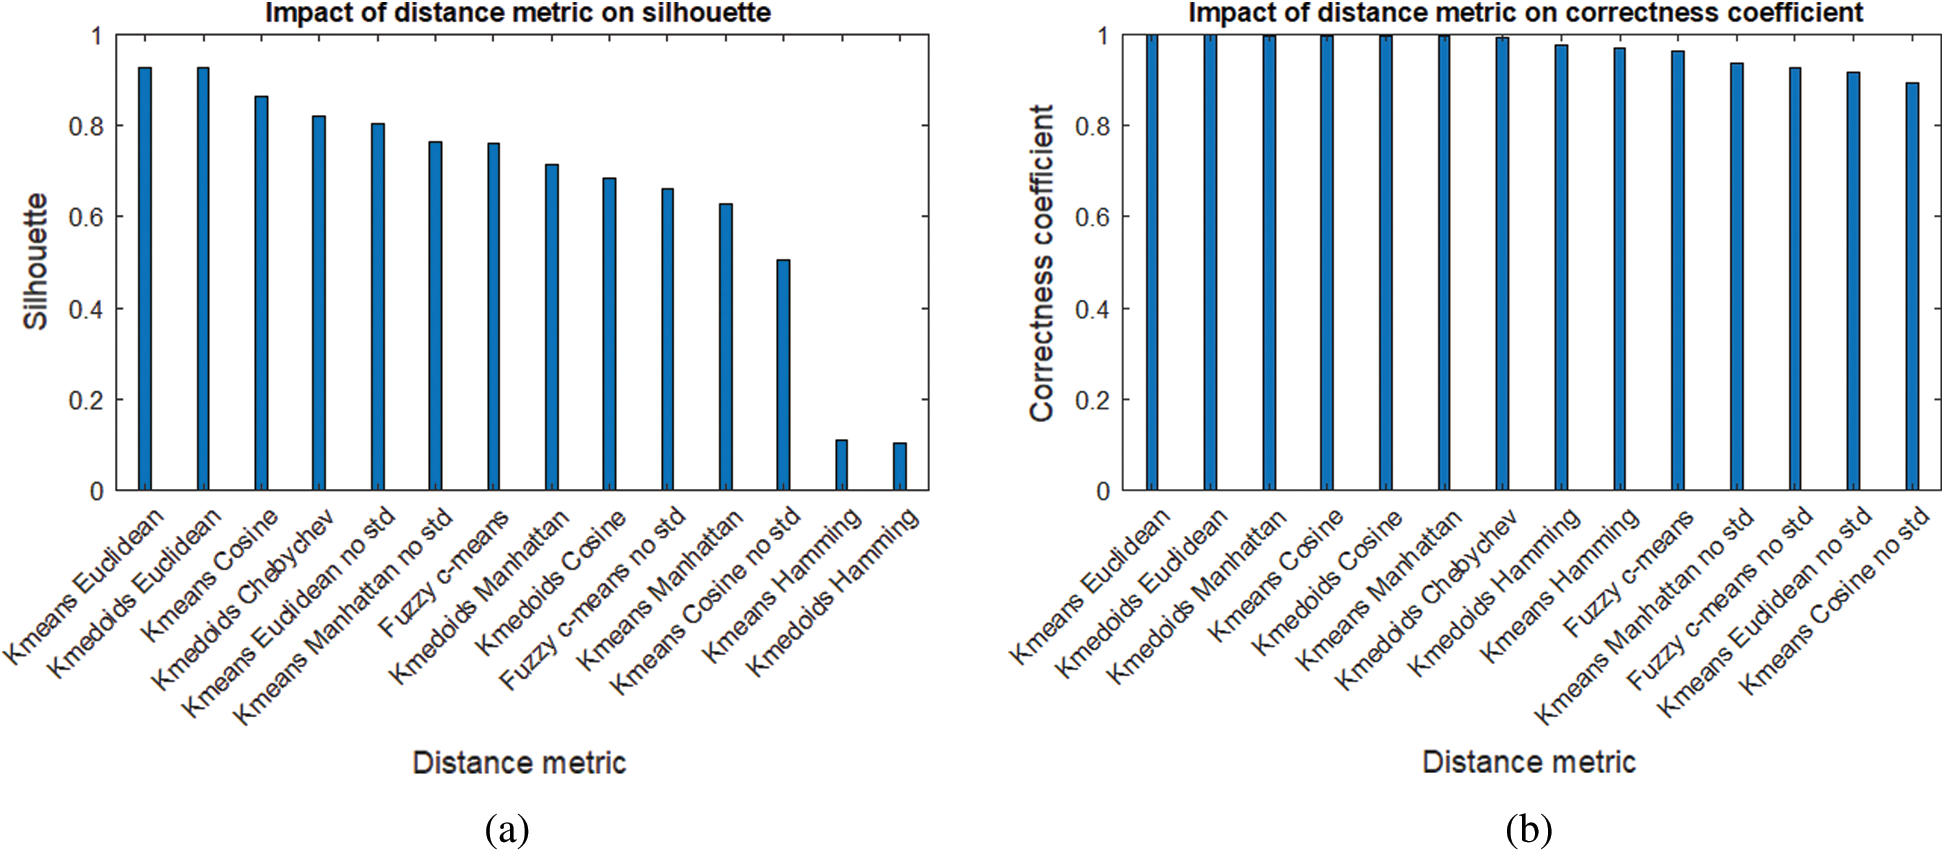
Figure 3: Impact of different distance metrics and algorithms on AIS data clustering–bar chart. a) Impact on silhouette. b) Impact on CC
Chebychev metric for k-medoids also gives a decent result (above 0.8). The metric that clearly stands out in a negative way is the Hamming metric, which provides AIS binary data clustering with the lowest silhouette value of around 0.1 (slightly better for k-medoids that k-means algorithm).
Analysis of Tab. 2 and Fig. 3b shows that when it comes to CC value, the k-means and k-medoids algorithms give very similar results. In both cases, when data have been standardized, most of the distance metrics (i.e., Euclidean, Manhattan, cosine and Chebychev) provide acceptable high value of CC (above 0.99). Only the use of the Hamming metric gives worse results, even worse for k-means (0.968) than k-medoids (0.977). This implies that working on pure binary AIS data should be avoided. In case of fuzzy c-means, the results are acceptable and comparable to others.
The experiment also shows that AIS data should be standardized before clustering. The results from k-means clustering with no standardization are significantly worse than their standardized counterparts, either in the form of silhouette or CC values. The same is observed for fuzzy c-means.
As shown in Figs. 4–6, the use of various distance metrics and algorithms provided slightly different clustering results. In each iteration of the experiment, the algorithms divided the same data points into different clusters. The difference comes from the fact that each metric formulates the “closeness” between points in a diverse manner. Therefore, points that are considered close according to one metric may appear distant when another metric has been used.

Figure 4: Results of clustering the collected AIS data into 22 groups with fuzzy c-means: a) with standardization, b) no standardization. Each cluster has been marked with a different colour

Figure 5: Results of clustering the collected AIS data into 22 groups with k-means: a) Euclidean metric, b) Manhattan metric, c) Cosine metric, d) Hamming metric (on binary data), e) Euclidean metric, no standardization, f) Manhattan metric, no standardization. Each cluster marked with a different colour

Figure 6: Results of clustering the collected AIS data into 22 groups with k-medoids: a) Euclidean metric, b) Manhattan metric, c) Cosine metric, d) Chebychev metric, e) Hamming metric (on binary data). Each cluster marked with a different colour
The majority of distance metrics correctly separated trajectories of each ship, so each cluster consists mostly of data points related to one ship (only Hamming metric failed in this task). However, in several cases (e.g., with the cosine metric or when the data have not been standardized prior to the clustering process) some of the trajectories have been divided into several clusters. Further research might be conducted to ascertain whether this behaviour influences the desired application of the whole AIS data analysis system (i.e., the detection of abnormal messages received from AIS system).
This paper focuses on the problem of evaluation of selected clustering algorithms used on the AIS data stream, when the data contain noise, and on the problem of reconstruction of vessels trajectories, when these data are damaged using the clustering. The main research aim was to determine the impact of distance measures on the performance of AIS data clustering. Selected clustering algorithms and distance measures have been evaluated. The computational experiment results show that the best results have been provided by k-means with the Euclidean distance. However, the basic conclusion is that it is possible to monitor and to analyse AIS data when the data include outliers.
The experiment has been carried out on a selected but original AIS data, which confirms the usefulness of the cluster-based analysis when the data include outliers derived from the natural environment.
Our future research will focus on study of the influence of the data streams’ length on the quality of grouping-based analysis and possibly on establishing the size of time window for the AIS data stream, where batch mode clustering can be carried out. Our other research direction will be an investigation of the performance of selected online clustering algorithms on the quality of AIS data analysis. Based on the presented results, it is likely that the clustering algorithm used in further research will be online k-means, as well as its variants.
Acknowledgement: Our special thanks to Mr Marcin Waraksa from Gdynia Maritime University for sharing the raw data that we used in our experiment.
Funding Statement: The authors received no specific funding for this study.
Conflicts of Interest: The authors declare that they have no conflicts of interest to report regarding the present study.
1. AIS transponders. (2019). “International Maritime Organisation Website,” . [Online]. Available: https://www.imo.org/en/OurWork/Safety/Pages/AIS.aspx. [Google Scholar]
2. Playing hide & seek at sea: A deep dive into AIS. (2019). “Pole Star Website,” . [Online]. Available: https://www.polestarglobal.com/news-events/playing-hide-seek-at-sea-a-deep-dive-into-ais. [Google Scholar]
3. Ships’ routeing. (2019). “International Maritime Organisation Website,” . [Online]. Available: http://www.imo.org/en/OurWork/Safety/Pages/ShipsRouteing.aspx. [Google Scholar]
4. H. Ball. (2013). Satellite AIS for Dummies. Mississauga, ON: Wiley. [Google Scholar]
5. T. Xu, Q. Hu, Z. Xiang, C. Yang and D. Wang. (2016). “The comparison study on AIS signal reception rate with directional antenna and omni antenna,” TransNav, International Journal on Marine Navigation and Safety of Sea Transportation, vol. 10, no. 2, pp. 205–211. [Google Scholar]
6. Satellite–automatic identification system (SAT-AIS) overview. (2020). “European Space Agency Website,” . [Online]. Available: https://artes.esa.int/sat-ais/overview. [Google Scholar]
7. R. Wawrzaszek, M. Waraksa, M. Kalarus, G. Juchnikowski and T. Górski. (2019). “Detection and decoding of AIS navigation messages by a low earth orbit satellite,” in J. Sasiadek (eds). Aerospace Robotics III. GeoPlanet: Earth and Planetary Sciences, Cham: Springer, pp. 45–62. [Google Scholar]
8. D. R. Chatterjee. (2019). “Log book–guide to distance measuring approaches for k-means clustering,” Towards Data Science Website. [Online]. Availvable: https://towardsdatascience.com/log-book-guide-to-distance-measuring-approaches-for-k-means-clustering-f137807e8e21. [Google Scholar]
9. G. M. Swetha, K. Hemavathy and S. Natarajan. (2018). “Overcome message collisions in satellite automatic id systems,” Microwaves & RF Website, . [Online]. Available: https://www.mwrf.com/systems/overcome-message-collisions-satellite-automatic-id-systems. [Google Scholar]
10. M. Mieczynska and I. Czarnowski. (2019). “A cluster-based approach for AIS data analysis and vessel trajectory reconstruction,” in Polskie Porozumienie na rzecz Rozwoju Sztucznej Inteligencji, PP-RAI’2019. Proceedings: Wroclaw University of Science and Technology, Wrocław, Poland, pp. 103–106. [Google Scholar]
11. Recommendation ITU-R M.1371-5. (2014). “International Telecommunications Union Website,” . [Online]. Available: https://www.itu.int/dms_pubrec/itu-r/rec/m/R-REC-M.1371-5-201402-I!!PDF-E.pdf. [Google Scholar]
12. A. Jain. (2010). “Data clustering: 50 years beyond k-means,” Pattern Recognition Letters, vol. 31, no. 8, pp. 651–666. [Google Scholar]
13. L. Kaufman and P. Rousseeuw. (1990). Finding Groups in Data: An Introduction to Cluster Analysis. New York: John Wiley & Sons. [Google Scholar]
14. J. C. Dunn. (1973). “A fuzzy relative of the ISODATA process and its use in detecting compact well-separated clusters,” Journal of Cybernetics, vol. 3, no. 3, pp. 32–57. [Google Scholar]
15. P. J. Rousseeuw. (1987). “Silhouettes: A graphical aid to the interpretation and validation of cluster analysis,” Journal of Computational and Applied Mathematics, vol. 20, pp. 53–65. [Google Scholar]
 | This work is licensed under a Creative Commons Attribution 4.0 International License, which permits unrestricted use, distribution, and reproduction in any medium, provided the original work is properly cited. |