DOI:10.32604/csse.2021.014376
| Computer Systems Science & Engineering DOI:10.32604/csse.2021.014376 | |
| Article |
A Model Transformation Approach for Detecting Distancing Violations in Weighted Graphs
Department of Computer Science, University College of Al Jamoum, Umm Al Qura University, Makkah, 21421, Saudi Arabia
*Corresponding Author: Ahmad F. Subahi. Email: AFSubahi@uqu.edu.sa
Received: 17 September 2020; Accepted: 24 October 2020
Abstract: This work presents the design of an Internet of Things (IoT) edge-based system based on model transformation and complete weighted graph to detect violations of social distancing measures in indoor public places. A wireless sensor network based on Bluetooth Low Energy is introduced as the infrastructure of the proposed design. A hybrid model transformation strategy for generating a graph database to represent groups of people is presented as a core middleware layer of the detecting system’s proposed architectural design. A Neo4j graph database is used as a target implementation generated from the proposed transformational system to store all captured real-time IoT data about the distances between individuals in an indoor area and answer user predefined queries, expressed using Neo4j Cypher, to provide insights from the stored data for decision support. As proof of concept, a discrete-time simulation model was adopted for the design of a COVID-19 physical distancing measures case study to evaluate the introduced system architecture. Twenty-one weighted graphs were generated randomly and the degrees of violation of distancing measures were inspected. The experimental results demonstrate the capability of the proposed system design to detect violations of COVID-19 physical distancing measures within an enclosed area.
Keywords: Model-driven engineering (MDE); Internet-of-Things (IoTs); model transformation; edge computing; system design; Neo4j graph databases
Indoor tracking and monitoring systems have witnessed increased interest recently because of potential technological advancements in the domain of the Internet of Things (IoT), wireless networks, and pervasive computing. As a result of the current trend of artificial intelligence (AI) and computer vision, different localization, positioning, and tracking techniques and mechanisms have been introduced, providing indoor localization services to users. From a data engineering perspective, AI and machine learning systems that deal with a massive amount of data, or “big data”, require appropriate architecture for a data pipeline system design to collect, clean, transform, and route the source data, which are captured from multiple resources, to the backend data storage of the system [1,2]. The data pipeline can be designed in the form of layered architecture consisting of an ingestion layer and transformation layers. In the context of this work, data are collected from various IoT devices and represented in an initial format at the ingestion layer. Then, a number of transformations, including filtering, aggregation, and enriching steps, are applied to the source data forming the final format of the target storage (relational-based, document-based, or graph-based data) [1,2]. These stored data are retrieved using several predefined queries that report results to users.
Model-driven engineering (MDE) is a software development methodology that considers—rather than general purpose codes—the use of models constructed using appropriate modelling languages to develop software systems. Model transformation mechanisms and code generators are two key principles or components in the MDE software system’s development lifecycle. Model transformation plays important roles in database reengineering, including data migration, schema construction, and normalization [3,4].
This study considers a model transformation approach, which is an aspect of the overall proposed system design, to generate the executable graph data model and related queries from the sensor-based data captured in the real-world situation. This research adopts MDE principles to introduce a lightweight model transformational approach that detects the degree of violation of social distancing measures based on personal space in groups. The mathematical foundation of the presented system is a complete weighted graph model of a restricted network size consisting of groups of individuals who represent a real-world crowd in an indoor scenario.
The system design supports capturing the status of individuals in a group according to determined distancing measures. The system analyzes the distances between group individuals and decides the degree to which the social distancing measure is being violated in a covered place. When a violation is detected, the system sends a message to the authorized person of the area to take the appropriate corresponding action when required. Because various applications of graph theory exist in the domain of crowd control systems (e.g., [5–9], a wireless sensor network (WSN) technology based on Bluetooth Low Energy (BLE) was considered the design choice for the infrastructure of the proposed system design. BLE provides an efficient method of transferring data in a WSN using low energy, which helps mobile Bluetooth beacons produce data for extremely long durations.
Additionally, as a result of ongoing global spread and the absence of a known treatment, the cumulative total of confirmed cases of coronavirus (COVID-19) reached 6 million by June 2020. Consequently, various Internet of Things (IoT)–based initiatives have been introduced using energy efficient communication technologies and smart devices to automate physical distancing detection, tracking, and monitoring [4,10]. Hence, a case study on detecting violations of the COVID-19 physical distancing measures was designed as proof of concept to evaluate the introduced system architecture.
The reminder this paper is organized as follows. Section 2 briefly highlights the techniques and technologies related to current trends that might be considered when designing an automated solution for detecting the implementation of physical distancing measures based on IoT and wireless networks. Section 3 theoretically presents a weighted graph-based model for detecting violation of social distancing measures, including the model’s mathematical foundation and implementation. Section 4 discusses our vision of the architecture of the system’s major components based on MDE model transformation, the IoT, and edge computing. Section 5 highlights the adopted strategy of the model-to-code transformation approach as a middleware layer of the proposed data pipeline architecture. Section 6 evaluates the proposed system design using a case study and a basic discrete-time simulation, based on real-world actions taken by international retail supermarkets in selected countries. Finally, Section 7 concludes our proposed work.
2 Related Techniques and Technologies
This section briefly highlights the domains related to the implementation of COVID-19 social distancing measures using the theories and applications of computer science from five main perspectives: Application domains, device/sensor technologies, communication technologies, overall system architectures, and background theories or algorithms.
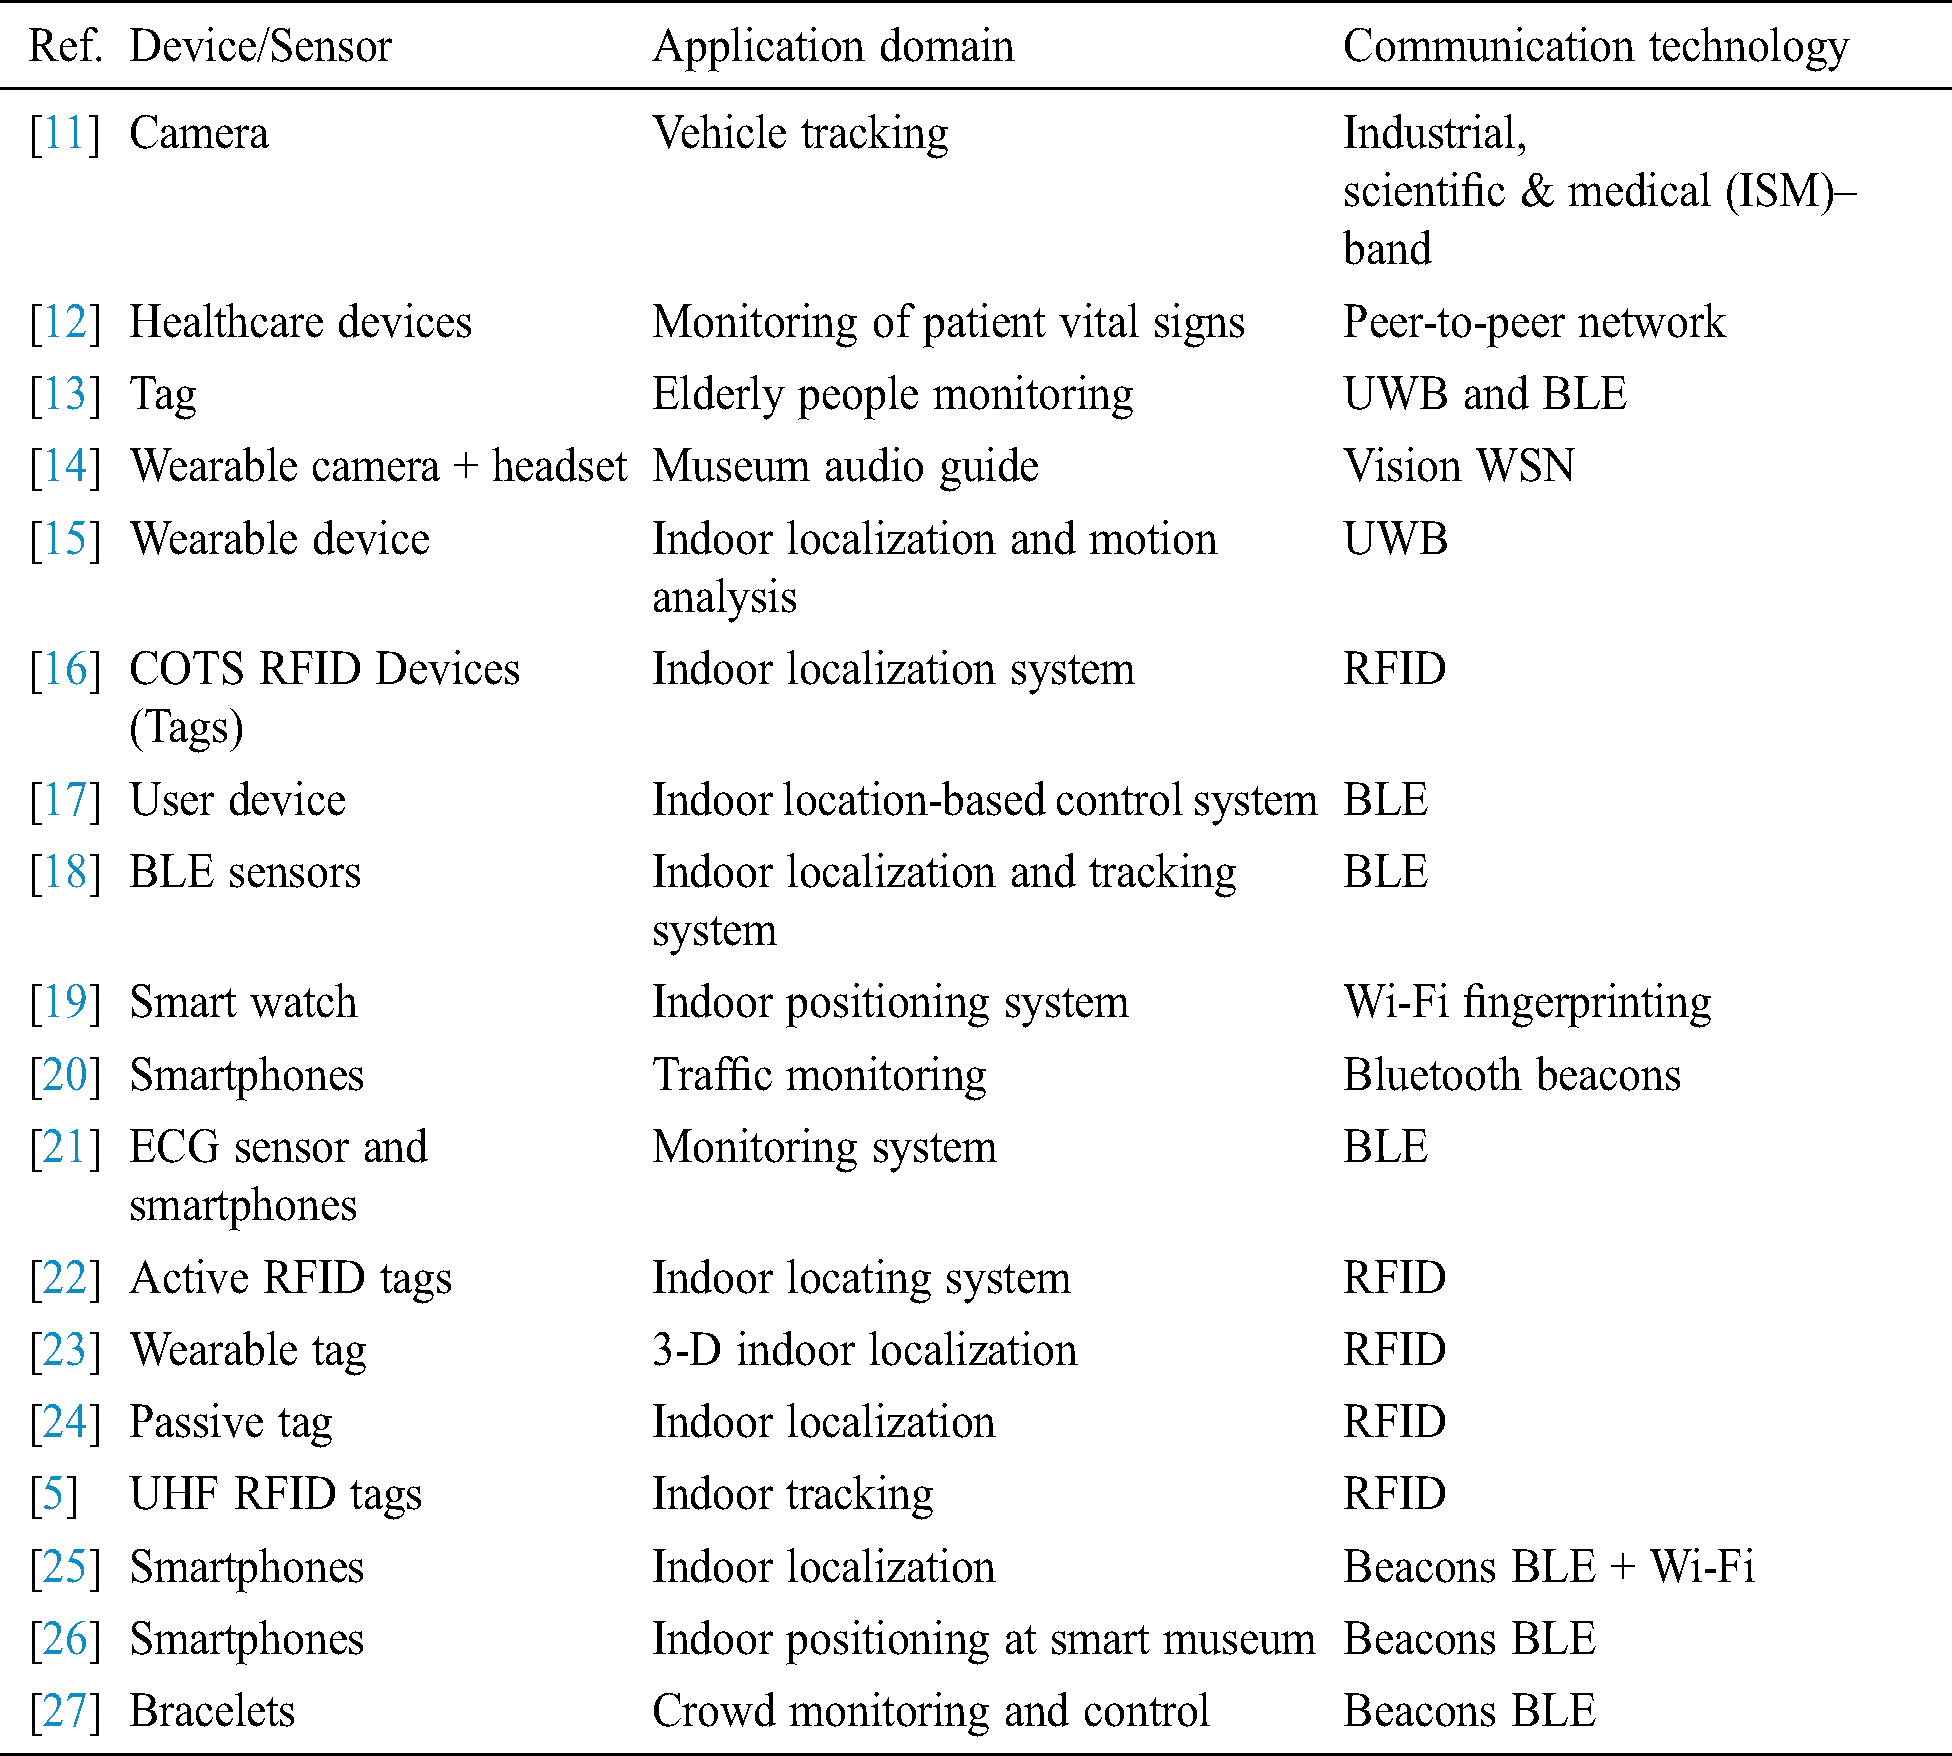
To explore the internet technology (IT) and computer-based approaches and systems most relevant to the automatic implementation of COVID-19 distancing measures, a literature survey was conducted using different research databases available in the following globally recognized academic collections: Scopus and ISI Web of Science, Institute of Electrical and Electronics Engineers (IEEE Xplore), Association for Computing Machinery (ACM) Digital Library, Multidisciplinary Digital Publishing Institute (MDPI), ScienceDirect, and Springer. Technical terms, including wireless sensor network (WSN), Internet of Things (IoT), wireless fidelity (Wi-Fi), ultrawideband (UWB), radio frequency identification device (RFID), Bluetooth Low Energy (BLE), indoor tracking, positioning localization, monitoring, and crowd control were utilized as search strings. Tab. 1 provides a summary of the research articles reviewed.
Table 1: A summary of research articles reviewed in the literature
Indoor tracking, positioning, localization, and monitoring systems can be described as a collection of networked devices used for locating or tracking objects. This includes people inside buildings, train stations, airports, underground garages, and other locations sharing aspects of systems to detect violation of distancing measures. These systems are related to this study’s design aim.
Different types of indoor localization applications exist that utilize various sensor and communication technologies. For example, according to Jamil et al. [12], in the domain of e-health a localization system for monitoring elderly people was introduced. Two kinds of communication technologies (UWB and BLE) were used with two algorithms, hybrid localization and a TDOA-based algorithm (time difference of arrival), to enable the evaluation of elderly behaviors, monitoring of health status and wellbeing, and detection of emergency situations. Further, an economical design of wearable devices for indoor localization and motion analysis using data fusion algorithms is presented in zhang et al. [15] as another example. An interesting integration between an inertial measurement unit and UWB localization was introduced using a Mahony filter and quaternions as a solution that achieved high-accuracy, signal stability, and motion tracking capability.
Technologies and techniques related to outdoor monitoring and tracking approaches were omitted from the review conducted for this study. These approaches are considered more complex than required for the current study’s aim and normally involve more than one communication interface attached to the utilized IoT devices to cover both short- and long-range communication [11,18,20]. At this stage of development, introducing a detection system of distancing measures with wide coverage capability for highly movable objects is not part of our aim.
2.2 Sensors and Communication Technologies in the Related Approaches
During the review, we found four main alternative technologies were used when designing wearable devices for indoor localization systems, namely, RFID, BLE and UWB, smart devices [19–21,24–26], and visual detection cameras. These alternatives strongly relate to the kinds of communication technologies used in the systems. As the basis of these technologies, a WSN was found a suitable communication technology adopted in the systems reviewed in this work. According to Nikodem et al. [11], for instance, detection cameras for monitoring road traffic and detecting and classifying vehicles were utilized and connected to a WSN. These cameras were installed on the sides of roads to track and monitor vehicles. In another study, wearable devices equipped with cameras and headsets and connected via a low-power Wi-Fi module could recognize paintings in a museum from the image captured by the camera using computer vision techniques and transfer the captured data to audio [14].
In addition, accuracy and energy consumption are critical factors that must be considered when designing wearable IoT devices and selecting their intercommunication technology. BLE is used to address energy consumption issues in many IoT applications [13,17,18,22]. However, UWB technology provides a high accuracy WSN for IoT systems [14,15]. In Kolakowski et al. [13], for instance, a balance between these two factors was discussed for the proposed system. UWB- and BLE-enabled devices were utilized in the proposed radio positioning system. UWB consumed higher energy during packet transmission than did BLE, although BLE provided more accurate detection results. A hybrid algorithm that offers the benefits of both technologies was designed and used for object detection and tracking [13].
In addition, a real-time intelligent crowd engineering analytical approach using mobility characterization and energy-efficient BLE to enhance mobility characterization and signal analysis (ICE-MoCha) was proposed in Jabbari et al. [27]. Crowd individuals wear the BLE tracker bracelets to manage the power consumption on the bracelet. Each tracker bracelet has a unique identification code for identifying each pedestrian in the crowd. The communication system of ICE-MoCha supports various messaging techniques for sending and receiving messages or probes from or to the tracker bracelets based on type: active or passive. Generally, the approach works to translate the BLE beacon signals from various transmitters into group semantics for tracking the status of the crowd and predicting potential accidents using a smart video surveillance technology.
Further, RFID-based wearable devices were utilized in several IoT indoor localization systems [5,16,22,23]. RFID technology can transmit wearable device IDs and data captured by the attached sensor to an RFID reader over a range of about 100–200 m with low power consumption because it works on radio frequency signals [25–28]. The RFID-based devices are normally attached by RFID tags. Each tag consists mainly of two major components: an electronic chip for storing data corresponding to the individual object attached to it and an electronic antenna for transmitting sensed data to the associated readers [29].
For instance, the research discussed in Zhang et al. [22] introduced an active RFID-based indoor locating system that uses a frequency-hopping technique to reduce the noise of the captured RSSI fingerprinting data. Two kinds of low-cost tags, with a tag–tag communication protocol, are utilized: virtual reference tags and object tags. The reference tags are distributed in the covered area to improve accuracy, whereas the object tags present RFID coordinates to RFID readers. Further, an RFID-based 3D indoor tracking system for eHealth was presented in Paolini et al. [23]. The study introduced a customized low-cost reader that is remotely controllable and supported by real-time 3D scanning features to detect the dynamic location of a patient within an indoor area. The algorithm developed retrieves the reader–tag distance and its height. The approach demonstrated high accuracy detection in the tags’ height, with an error rate below 20 cm in all the simulation experiments conducted, in which the average error of 10 experiments performed was less than 18 cm for distances up to 4.50 m [23].
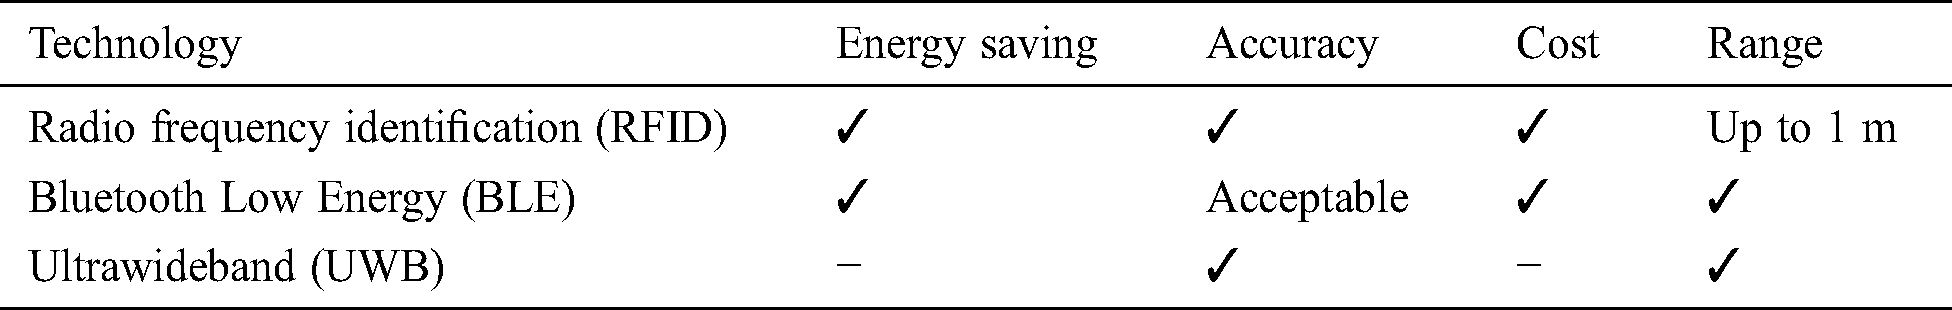
Various sensors and existing communication technologies for indoor tracking and positioning systems were reviewed and investigated based on four main factors: energy-saving capability, accuracy, costs, and coverage range. The following table (Tab. 2) summarizes each technology considered in the review and its features regarding these four factors.
Table 2: A comparison between selected communication technologies regarding four factors
2.3 Related Graph-Based Approaches
Graph theory played a significant role in developing collective adaptive systems (CASs). CASs can be defined as complex systems with a massive number of heterogeneous entities that interact with each other without a central control to achieve an individual or shared goal. In [30], a model of pedestrian movement was introduced as a CAS using an expressive process calculus language (CARMA). The model is based on graph structure representing a network of pedestrian paths. Each individual entity, which represents a pedestrian, acts as a decision-making element when it produces probabilistic choices about the next movement in the future and how that affects other pedestrian movements. Pedestrians are expressed as graph nodes in the model, whereas the current paths of each pedestrian are expressed via graph edges and determined by the pedestrian’s current and next position.
In Allam et al. [5], the design of a wearable wireless sensor is presented to ensure crowd safety in high density situations. The device communicates with other devices in its sensing range to send simple warning and safety messages or status notifications across devices. This approach is based on the theory of graph density, in which each device in a crowd counts the number of surrounding devices and then calculates the density around it. Consequently, the previously determined threshold is examined to decide whether the device is in a safe situation. If not, an appropriate warning message is propagated to other devices within range, and guidance and instructions through messages are provided to prevent overcrowding and dangerous situations. The technique is based on an existing agent-based crowd simulation model called Multi-Agent Simulator of Neighborhoods (MASON), which is written in Java and used in 2D environment simulation tools.
Additionally, graph theory applications have a long history in the domain of crowd analysis, monitoring and control. In Matthias et al. [29], for instance, a graph-based framework for detecting and tracking pedestrians, dense crowds, and events is proposed using hidden Markov models. The framework requires a short sequence of images for effective pedestrian tracking and location of possible danger areas in a crowd. All results are implemented and demonstrated using a simulation model.
Further, in Angela et al. [7], a graph-based approach obtains indoor dense locations from tracking data using the semantic location. The dense location queries, processing, and indexing are performed using a proposed technique called the Dense Location Time Index, which combines the information of locations with time points. In another approach [8], a decision graph finds the cluster centers in the proposed pre-screening method. This method is presented to the density-based clustering algorithm to obtain possible shapes of the clusters and the internal density between each point in the graph [8].
Moreover, Xu et al. [9] introduces an approach for analyzing and recognizing crowd dynamics based on a static proximity graph. The proximity graph data structure represents crowd textures as graph vertices. Spatial closeness relationships between persons in the crowd are recognized in terms of their texture over time. The graph is supported by annotation extension attached to the vertices to add further semantics representing crowd context. Thereby, it provides a precise picture for the decision maker. Wearable devices on graph individuals collect information and are connected via a Bluetooth-based wireless communication technology and utilized as a network infrastructure.
3 The Mathematical Graph Model
Graphs are an appropriate data structure for managing and processing connected data. They enable tracing of interconnections between data entities to understand dependencies between them. In regard to the context of this work, tracing links among persons who spend time together as a group in public places, representing this in a graph data structure, and identifying possible clusters might provide deeper insights into the spread of the COVID-19 virus in the community.
Unlike the construction of direct simulations and predictions or video tracking systems, which are based on substantial processing of images and videos, and complex AI techniques for detecting abnormal events in crowds, the proposed graph-based mathematical model is defined here as a formal basis for all utilized concepts that are stored in the backend database. The proposed approach only requires information such as locations, distances, and other attributes associated with a group of people that are modelled using graph theory.
3.1 Foundation of the Graph Model
In previous research, a substantial number of real-world problems are represented mathematically and formalized using either directed or undirected graph theory. The cyber security knowledge (directed) graph and route planning (directed) graph presented in Jia et al. [31] and [32], respectively, are examples of the variety of applications of graph theory. In this study, it is assumed that the direction of each individual is not vital information in the model. Thus, the (undirected) complete weighted graph model is considered a theoretical base of this work.
In this section, the notation of first-order predicate logic (FOPL), with extensions for equality ( ), and membership (
 ), is employed to express the mathematical foundation of the graph concepts used in the proposed system design. A syntactic sugar notation is used for a unary predicate to assign a type to a variable, for example,
  is re-expressed as
  . Further, the notation (
 ) is utilized to shorten and replace the logical
  operator.
In the proposed FOPL formalization system, there are four basic types of variables, namely  and
and  . Each variable is utilized to represent concepts of graph theory in the system. The following formal definition describes the notation of the computational graph model adopted in this work:

 :A finite set of all vertices in graph
  . Vertices correspond to individuals within a specific place who form a crowd. A vertex is expressed using the following formula:

 :A finite set of all edges in graph
  . Edges are undirected and correspond to the actual distances between the graph vertices. This is expressed in the formula:

The notation  is used to represent an edge between two vertices
  and
and  , where
  and
and  are called the endpoints of
  .
.
 : A set of all attributes that belong to the value of a vertex
  expressed as a pair of keys. Similarly, some edges may also have attributes in the model. The notation
  is used to represent the set of all attributes of the edge
  . The pair of keys’ values is described by the following formula:


 {
{
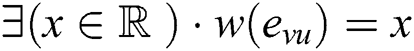
 : When modelling a distance between individuals in the crowd, it is important to determine a weight function
  , where
  is a real number associated with each edge
  in the graph. This is represented via the following expression:

The weight is computed using the traditional distance formula as:

where  and
and  are two points that have x and y coordinates
  .
.
Unlike other crowd modelling approaches that consider including all edges in the model, only edges between individuals that reflect the social distancing rules for reducing the transmission rate of COVID-19 are included in the current study. Thus, the range of distance considered in the approach falls between 0 m and 4 m. Thus, it is unnecessary to represent all of the connections between individuals in the crowd that have distances (weights) over 4 m. Function  is used to indicate that two individuals (vertices),
  and
and  in the model, fall within the range of interest for evaluation of COVID-19 physical distancing measures. Therefore, edge
  links the pair
  and
and  . This is expressed using the formula:

The convention  is adopted to represent each edge that connects the pair of vertices
  and appears in
  for simplicity, where
  and
and  are said to be the end vertices of an edge
  . The following formula describes this concept of the model:

3.2 The Creation of the Graph Model
The graph model of the crowd in a determined place is created by locating each individual as a graph point (vertex) within a specific area at an exact time using appropriate technology, for example, BLE. Each graph vertex, in the real-world set, has attributes to store the intersection of latitude and longitude lines, which represent the coordinates of that vertex. The coordinates are used to identify the exact location of the vertex in the place.
The proposed model focuses on modelling the distance between crowd individuals to observe the violation of social distancing rules. The distance (in meters) between each pair of vertices is calculated to be the weight of the undirected edge between that pair. Times and dates are other possible pieces of information (attributes) that might be assigned to each edge.
The type of graph model based on a related technology for capturing vertex locations is a complete undirected weighted graph. Graph  is considered a complete graph if there is a unique edge connecting every pair of its distinct vertices. If
  has
has  vertices the graph is called
  and the number of its edges is
  .
.
Mathematically, graphs can be represented in several ways, such as via adjacency lists and adjacency matrices. The adjacency matrix is considered one of the graph representation alternatives adopted in this work. To create a corresponding adjacency matrix  of the complete graph
  , suppose the total number of vertices is
  ; then, the definition of the adjacency matrix
  can be expressed with the following formula:


4 Conceptual Design and Implementation Choice
This section presents a conceptual view of the system’s major components. Our vision of the overall system architecture falls within the scope of IoT edge-based architecture. The traditional IoT edge-based architecture consists of four layers: A sensing layer, an edges layer, a communication layer, and a cloud layer [33].

Figure 1: High-level architecture of the proposed system design
The high-level architecture of the core system components, shown in Fig. 1, consists of three main layers, namely, the sensing layer, middleware layer, and data storage layer. Fig. 1 demonstrates the communication between these three layers in terms of their inputs and outputs. The following subsections briefly describe each layer, focusing mainly on the detail of the data storage layer.
4.1 Implementation of the Graph Model
Managing a massive amount of stored data (big data) requires a type of data model that can support its characteristics, namely, volume, velocity, variety, and veracity. These characteristics are not fully supported in the traditional relational data models. However, owing to the dynamic nature of the NoSQL data model, it is suitable to deal with critical issues of big data that are related to its characteristics, such as efficiency, scalability, and availability [33,34]. A graph database, as a form of the data model, has demonstrated the ability to express and manage connected sensor-based data in various IoT systems [35,36], and is an example of a dynamic big data schema.
This study introduces a Neo4j graph database implementation of the complete weighted graph data model, discussed previously in Section 3, to model the violation of distancing regulations within a particular place. Neo4j is one of the most popular Java-based open-source native graph database systems and is used to implement the property graph data model efficiently. In the Noe4j graph model, data are structured as nodes, relationships, and properties attached to the nodes or relationships. It provides robust transactional storage of big data and supports full ACID features (atomicity, consistency, isolation, durability) to maintain the integrity of stored data. Neo4j also supports deep graph analysis and querying using a query language named “Cypher” [37]. It is a reliable graph database system for large and rich graph modelling of crowds. Consequently, Neo4j is considered an appropriate implementation platform for the proposed weighted graph model presented in this paper.
Noe4j’s declarative query language, Cypher, is similar to SQL but specialized for graphs. The Cypher language is considered a simple and easy to learn language that allows users to store, retrieve, and manipulate data stored in a graph database. The Cypher syntax is declarative and is expressed in a logical way for matching patterns of nodes and relationships in graphs. For example, the keywords “MATCH/ RETURN” work similarly to the “SELECT” statement in SQL to project nodes or relationships that satisfy given constraints. Additionally, the keywords “CREATE/ MERGE” are used to create new nodes in the graph, similarly to the “INSERT” statement in SQL. The following figure (Fig. 2) provides an example of a complete directed weighted graph consisting of 11 nodes and 54 relationships.
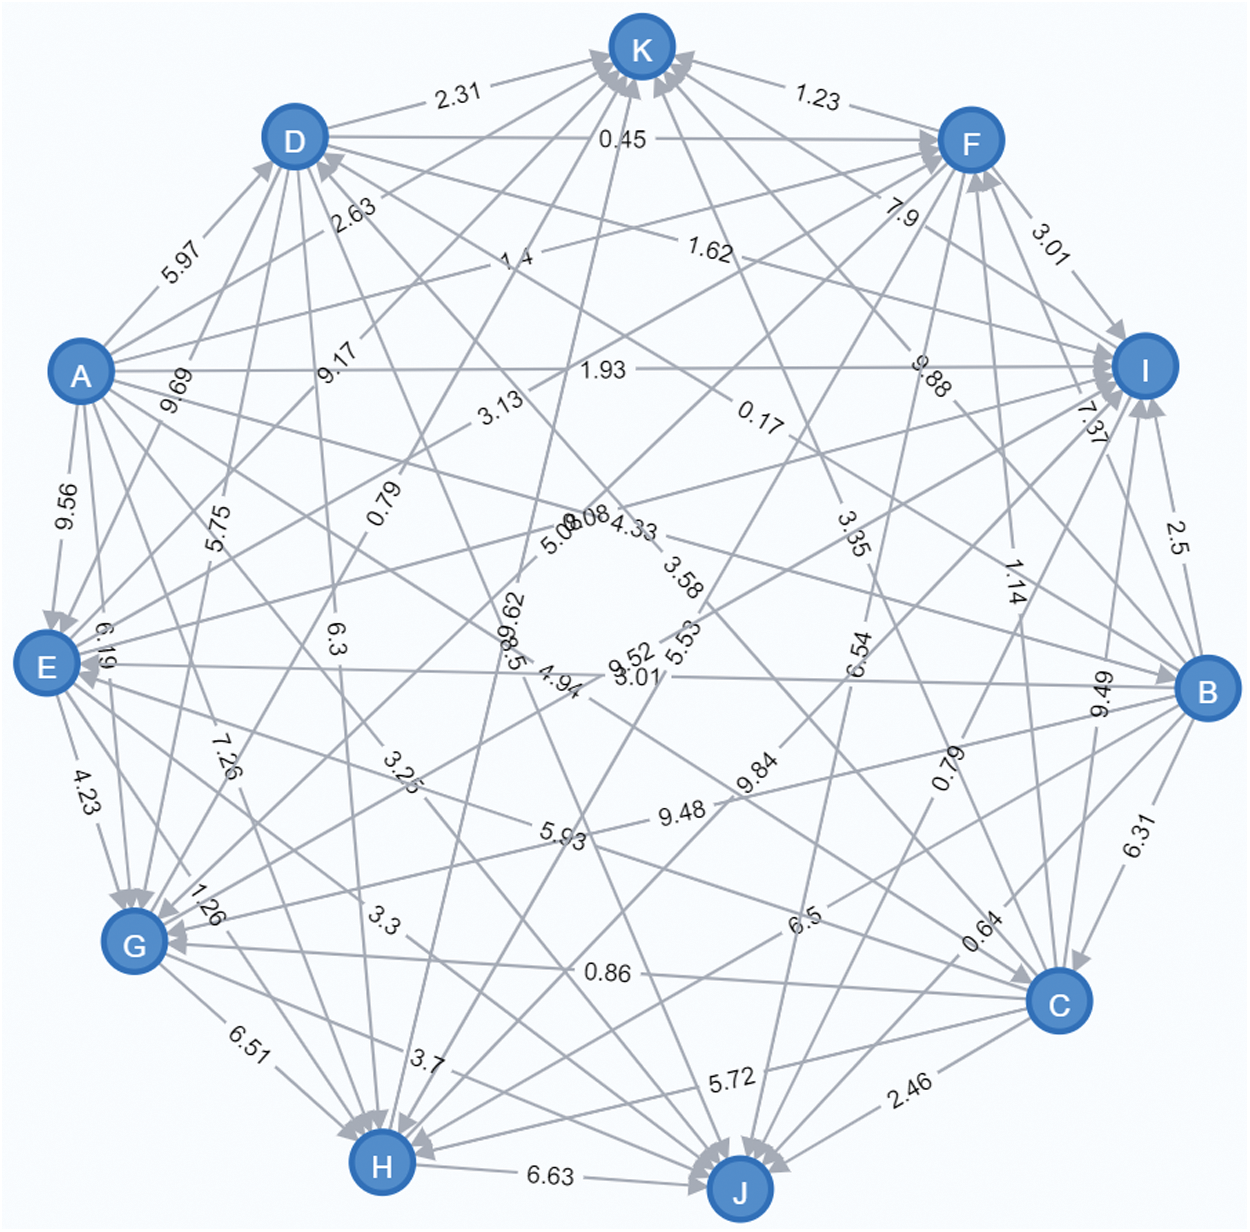
Figure 2: A complete directed weighted graph used to represent a group of individuals and the physical distances between them
Because the output of the proposed transformational system in the middleware layer, discussed in the following subsections, is an executable Neo4j Cypher query script file, the Noe4j database engine can run Cypher script files to construct, or update, the graph representation of the real-world group in the system. Then, several predefined queries that support decision makers might be executed on the stored graph to retrieve insight results. The following snapshot of the Cypher script (Listing 1) illustrates the executable code used to generate three graph nodes, A, B, and C, using CREATE statements, in addition to three undirected and weighted relationships with a randomly computed distance weight between them, using MERGE statements.
Listing 1: A snapshot of the Neo4j Cypher script used to create three nodes including their interrelations

Nodes of the Neo4j crowd graph represent people (individuals) in a crowd, whereas undirected and weighted edges represent the actual distances between individuals at a corresponding time point. Thus, the graph created at a specific time interval represents the status of the social distancing rule application at that given point in time. In the real world, the person node holds properties to represent the location of an individual who wears a sensor or is attached to a communication device.
Each person node in the crowd graph is located near another person node within a particular distance. The distance between them is represented in the graph by a relationship between two person nodes. Each distance relationship has a calculated weight property to represent the measure between each pair of individuals. The weight of each distance is computed using Formula 7, as mentioned previously in Section 3.1 and Section 3.2.
4.2 Technology and Connectivity of the Sensing Layer
This layer consists of wearable devices connected to a wireless network. In this layer, a WSN (e.g., Wi-Fi and Bluetooth, Zonal Intercommunication Global-standard [ZigBee], and fifth generation cellular wireless [5G]) and a suitable tag-based detection technology were combined to collect required information about physical distancing between individuals during a corresponding time interval. Thus, the physical distancing was tracked using wearable devices or tracker badges and transmitted to the nearest edge point for analysis and processing.
As a design choice, Bluetooth smart badges were considered IoT wearable devices. These cost-effective badges are based on BLE technology, which facilitates short-range communication and offers an adequate level of indoor tracking accuracy. Additionally, beacon devices were used to expand the Bluetooth coverage range of the closed area because the standard beacons have an approximate range of 70 m. Thus, based on the dimensions of the closed area, the number of required beacons could be determined. Fig. 3 shows the Bluetooth network infrastructure using multiple BLE beacons and cloud beacons that were connected to the proposed IoT edge-based cloud system.
Because one of the objectives of the proposed design was to introduce a social distancing tracking solution, cloud beacons, which have the capability of data backup, configuration, and application of updated settings to all other connected BLE beacons, were employed to monitor other BLE beacons and send their collected data over the Internet to the cloud backend data storage. They were also used to increase the collection of distancing data for more than one closed area. Owing to the Wi-Fi connectivity feature available in cloud beacons, they can upload data to the edge server and then to the centralized cloud storage over Wi-Fi. It is worth mentioning that the range of Wi-Fi networks can be up to 200 m greater than the standard Bluetooth range.
As a result, each person approaching the area covered by the proposed physical distancing monitoring system is asked to wear the Bluetooth smart badge assigned by a previously configured unique ID to sense and report distance changes within the group to the decision maker via the wireless network infrastructure. The assigned ID of each badge represents a specific location and direction (if required) of an individual within the group inside the closed area. The approximate distances within the group of individuals and a timestamp are detected and transferred via the Wi-Fi connection to the edge point and then stored in the backend data storage.
This approach also considers information security issues and individual privacy since the distributed Bluetooth badges and the cloud beacons only monitor and record anonymous data at each point in the area, excluding any information that can identify an individual. It should be noted that detailed specification regarding algorithms and techniques used for detecting distances between individuals is outside the scope of this paper.
4.3 Defined Structure and Queries of the Data Storage Layer
The collected and processed information in the middleware layer is stored in the system using a centralized cloud database that supports big data storage, future processing, and retrieval. The stored data might be used for real-time or post processing, archiving, querying, analysis, or prediction.
The graph-oriented database system was selected as a backend data model to gain the benefits of the graph data structure. This is because of the nature of the sensed data stored in the database and the capability of graph databases to perform efficient query processing and deep graph analytics. Importantly, the data storage is physically located in the cloud storage as a centralized cloud database.

Figure 3: Bluetooth-based (BLE) network infrastructure
To enable the system to calculate the degree to which the existing group is violating the social distancing regulation, the number of edges, with distance values < = 2 m, is counted and compared with the total number of edges between group individuals (with distance > 2 m and < = 4 m). Additionally, the number of individuals involved in the graph is considered to examine the size of the graph. In the proposed proof of concept, this can be achieved using several simple Neo4j Cypher query statements:
Q1: What is the number of attached nodes in the graph?
MATCH (n:person)-[r:DISTANCE]->(m:person) WHERE toFloat(r.weight) < 4.0
RETURN COUNT(n)
Q2: What is the number of the considered edges in the graph?
MATCH (n:person)-[r:DISTANCE]->(m:person) WHERE toFloat(r.weight) < 4.0
RETURN COUNT(r)
Q3: What is the number of edges with no violation of distancing measure in the graph?
MATCH (n:person)-[r:DISTANCE]->(m:person) WHERE toFloat(r.weight) >= 2
AND toFloat(r.weight) < 4.0
RETURN COUNT(r)
Q4: What is the number of edges with mild violation of distancing measure in the graph?
MATCH (n:person)-[r:DISTANCE]->(m:person) WHERE toFloat(r.weight) > 1.40
AND toFloat(r.weight) < 2.0
RETURN COUNT(r)
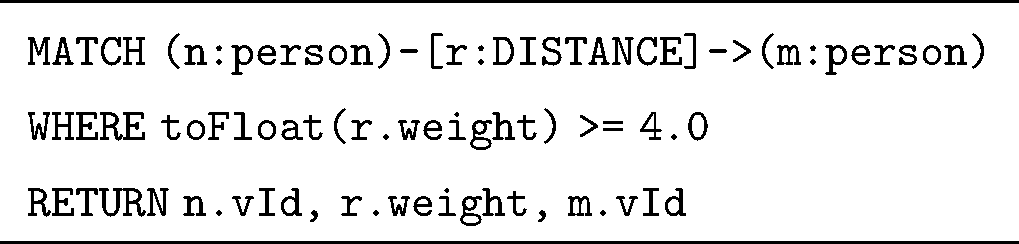
Q5: What is the number of edges with high violation of distancing measure in the graph?
MATCH (n:person)-[r:DISTANCE]->(m:person) WHERE toFloat(r.weight) > 0.01
AND toFloat(r.weight) <= 1.39
RETURN COUNT(r)
Based on the results returned from these queries, simple calculations are required to allow the decision support system to generate an appropriate message to send to the decision maker:
1. The percentage of individuals who are involved in the group:
% involved = (total nodes - no of nodes out of the group) / total nodes)*100
2. The percentage of individuals who violated the social distancing measures:
% violation = (no of edges with distance less than 2 meters / total nodes)*100
5 Overview of Transformation Approach
A major contribution of this study is the design of a model transformation layer, which is considered a middleware layer of the proposed architecture. Three main operations are performed in this layer, namely, constructing a source model that conforms to a defined source metamodel, translating the source model into a target model that conforms to a defined target metamodel, and executing the target model and generating insight reports for decision makers. It is worth mentioning that the mapping rules were implemented using Atlas Transformation Language (ATL). Further details about ATL are presented in Subsection 5.2. The following figure (Fig. 4) illustrates the model transformation approach adopted in the proposed system design.
5.1 Constructing the Source Model
Two main steps are considered for creating the source model. The first step is to construct a complete graph structure on the fly by gathering all the sensed data, captured at a specific time from IoT sensors, and manipulated as a density matrix in memory based on edges. The second step is to create an eXtensible Markup Language (XML) memory model of the captured complete graph. During the process of building the XML memory model, all nodes that are outside the range of distancing violations are eliminated. This XML memory model implementation [37] represents the simplified matrix and is considered the source of the translation operation in the form of a graph structure.
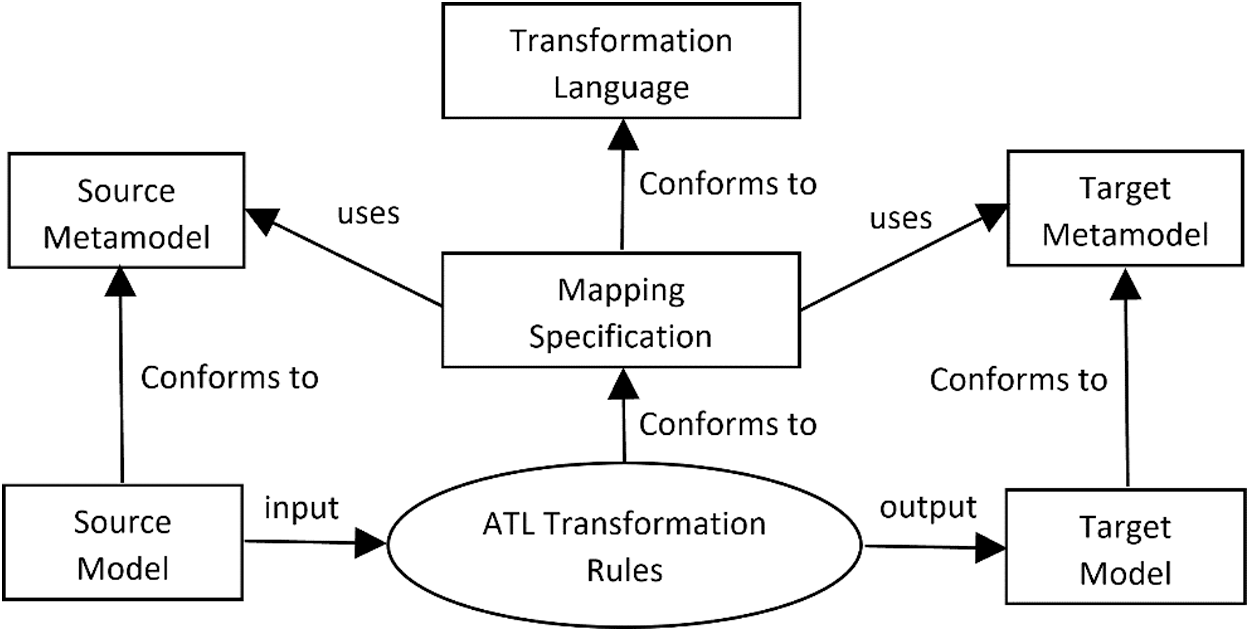
Figure 4: The ATL approach of model transformation
A common method to represent and parse XML memory models is to use a Document Object Model (DOM) or Java Document Object Model (JDOM) package. Moreover, options other than XML might be used for data formatting and serialization standards, namely JavaScript Object Notation (JSON) and YAML Ain’t Markup Language (YAML). XML has the advantage of describing the structure of data using a human-readable and friendly format and it has a flat learning curve. In addition, the XML format relies on a standard means of representing models using the XML Metadata Interchange (XMI) format in the model transformation strategy adopted in this work, as explained in the following subsection. The following algorithm (Listing 2) describes the rules of translating the complete in-memory graph model into the simplified intermediate source graph model of the core transformation step.
Listing 2: Algorithm of building the intermediate graph model for the complete graph density matrix

This output source model is considered an intermediate textual domain specific language (DSL) for describing the structure of a graph using XML and conforming to a defined metamodel of a source model (Fig. 5). Listing 3 provides a snapshot of the graph model produced. It is important to note that constructing an intermediate representation, using a language similar to the structure of graph databases, is considered a critical step in the design because it leads to simplifying the process of generating the executable Neo4j Cypher in the transformation chain.
5.2 The Core Transformation Strategy
To present transformation rules applied to the final executable Neo4j Cypher queries for the intermediate XML graph model, the ATL language was used to express each matching rule of this transformation component in the middleware layer [38]. ATL is a hybrid model transformation language that contains a mix of declarative and imperative constructs to describe rules of transformation in a simple manner. One of the main reasons for adopting the hybrid approach of model transformation is to simplify mapping rules to be easier to read and understand, which is crucial in larger transformation modules from a software engineering perspective.
Listing 3: A snapshot of the generated XML graph model

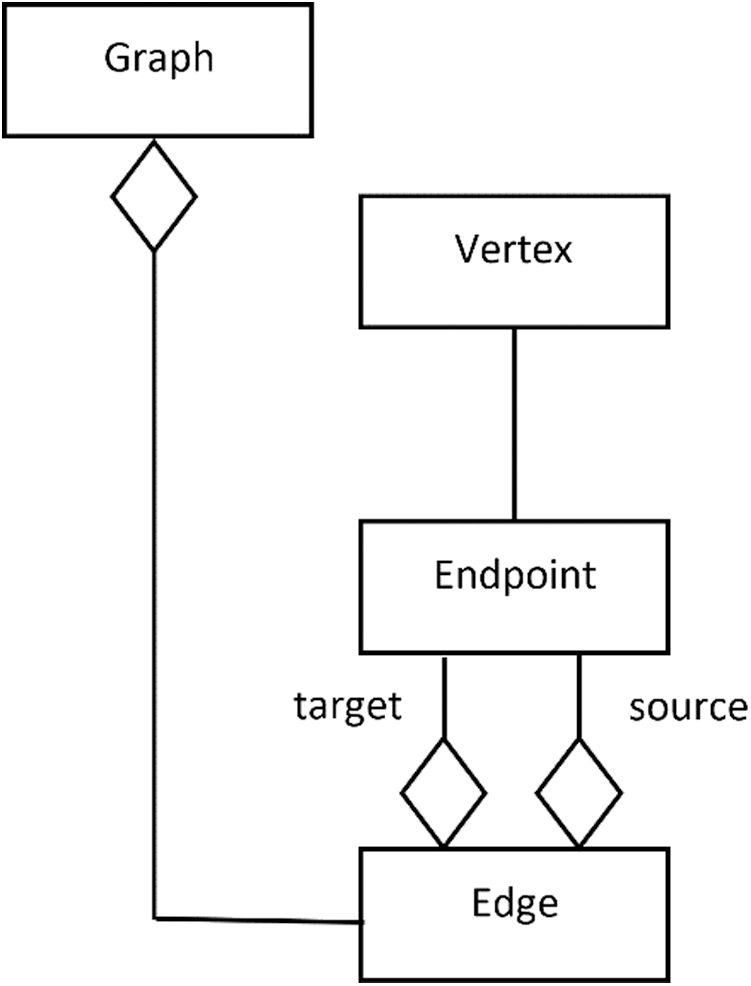
Figure 5: The source graph metamodel
The transformational approach of ATL is based on pattern matching, in which a pattern of a source model, expressed using XMI standards, is evaluated and transformed using a set of declarative ATL matching rules into a pattern of a target model, also expressed using XMI format. The approach maintains traceability links between elements in a source model, rules, and the created elements in the target model. The imperative side of ATL can be seen when the developer needs to encode or customize control flows explicitly for complex parts of transformational algorithms. These imperative definitions of mapping rules are used to support the declarative mapping rules in the transformation module. This is implemented in ATL using helper functions, as shown in Listing 4, which demonstrates the definition of two ATL declarative matching rules, Vertex2CreateNodeStmt and Edge2MergeStmt, used to transform the intermediate graph XML model into an executable Neo4j Cypher script. In each rule, one-to-one mapping statements are declared. For instance, each vertex v is mapped into a generated CREATE Cypher script statement for creating a new Neo4j graph node with the same properties of v. Additionally, to specify the concrete syntax of the generated script, helper functions are utilized to express the detailed syntax of the target script. A detailed description of the syntax and semantics of the ATL language are outside the scope of this work but can be found in Jouault et al. [38].
In this work, the case study presented was based on a real-world example of actions taken by various global supermarket and grocery store chains around the world, such as Tesco, Waitrose, and Dunnes, to slow the transmission of the COVID-19 virus. As an example of common implemented physical distancing measures, the governments of the United Kingdom and the Republic of Ireland advise maintaining a gap of at least 2 m (6 feet) from others in public places, specifically those who are coughing, sneezing or have a fever [16–19]. In more detail, these rules restrict the number of customers allowed in medium-sized stores at a given time to between 10 and 25 persons, which represents 40% of the stores’ normal capacity. A supermarket consists of one main entrance, several aisles, shelves, fridges, and four cashier desks.
Consequently, initial criteria were defined for categorizing distance properties in the weighted graph model. It can be concluded that an individual is considered out of a group when he or she is located at a distance of more than 4 m from all other individuals in the same group. The distancing rule for reducing the transmission of COVID-19 is based on maintaining a space between individuals of over 2.5 m as much as possible. Thus, to represent the group of people within the crowd that are closer than 2.5 m to each other, an undirected weighted subgraph  is extracted from the original complete graph
  . The weight of each edge
  represents the actual distance between each pair of individuals that violate the social distancing measure to a particular degree (high, low, or safe). Similarly, another adjacency matrix
  is extracted from
  in which
  implements the undirected weighted subgraph
  . The following formula describes the definition of
  :
:


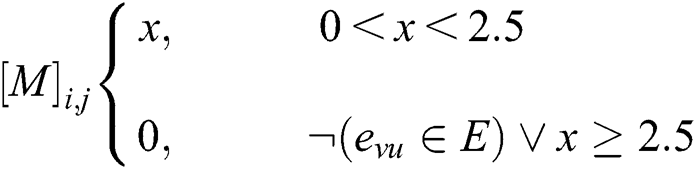
From the constructed matrix  , all individuals in the place who are violating the distancing rule for that place, at a specific time, are captured. The matrix
  is considered a submatrix of
  after eliminating all vertex entries that have a weight equal to zero or greater than 4.
As proof of concept, a discrete-time simulation model is adopted. It is assumed that the changes in distances between individuals occur only at each discrete time tick. Consequently, a simple algorithm for generating multiple weighted graphs with random distances between their nodes is implemented using Noe4j Cypher script. The Neo4j built-in random function rand() is used to generate random weights for all edges in each complete graph to represent distances between individuals rather than to detect real-world locations of individuals inside the store at a specific time. In the simulation, 21 weighted graphs are generated randomly. After inspecting the weights on their edges, all edges with distances of > 4 m are eliminated from the graph and their end-point nodes are considered unattached. Listing 4 illustrates the Cypher script used to return the updated graph after eliminating edges with weights > 4 m.
Listing 4: ATL matching rules for mapping the intermediate model into an executable Cypher script
The simulation then answers the five queries, presented in Subsection 4.3.1, for each of the generated graphs (Tab. 3). The Neo4j 3.5.14 database system is used to run the script, thus producing 21 graphs with a total of 176 nodes, 1040 properties, and 864 relationships, completed after 103 ms. Fig. 6 provides a snapshot of the creation of the weighted graphs used in the simulation.
A second round of inspection is applied, and it is noted that the simulation results showed three different cases. These cases can be categorized based on the number of nodes falling in the distancing range as no violation, mild violation, and high violation cases. Generated graphs belonging to the no violation case represent the possible potential ideal situation, captured by the system at a specific time tick, when there is no detected violation of social distancing measures inside the store; that is, the majority of distances between individuals range between 2 m and 4 m.
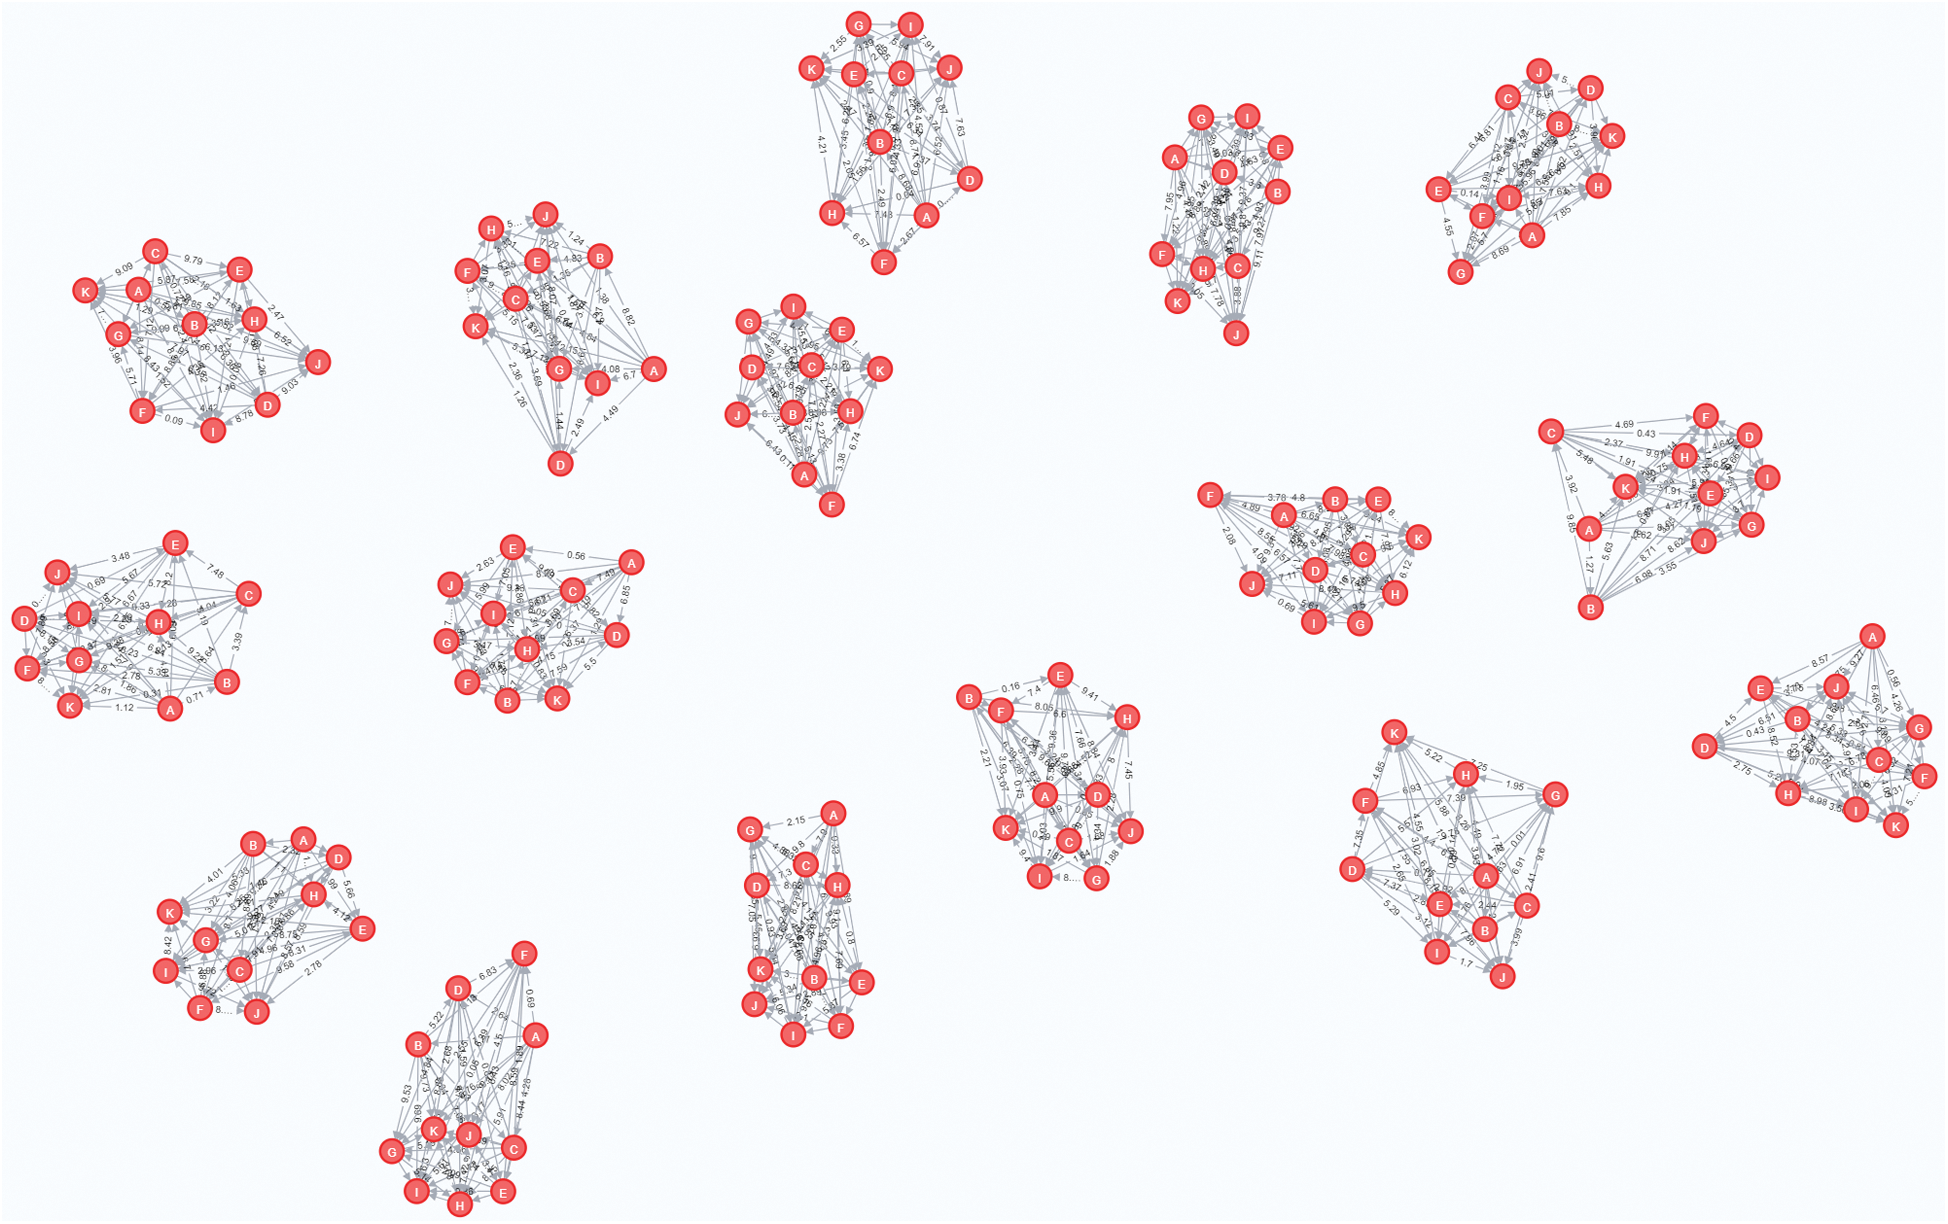
Figure 6: A snapshot of the generated graph networks used in the simulation
Graphs belonging to the mild violation cases demonstrate a situation where some minor or moderate violations of the distancing measures in the store are detected. The group of persons has a small number of nodes falling in the range of 1.4 m and 2 m, whereas the remainder fall in the greater range. However, graphs belonging to the high violation cases show major violations of distancing measures captured by the system. A larger number of nodes violates the social distancing rules inside the store, with distancing ranges starting from 0 m to about 1.39 m.
Table 3: Simulation results of the 21 generated graphs and their classifications
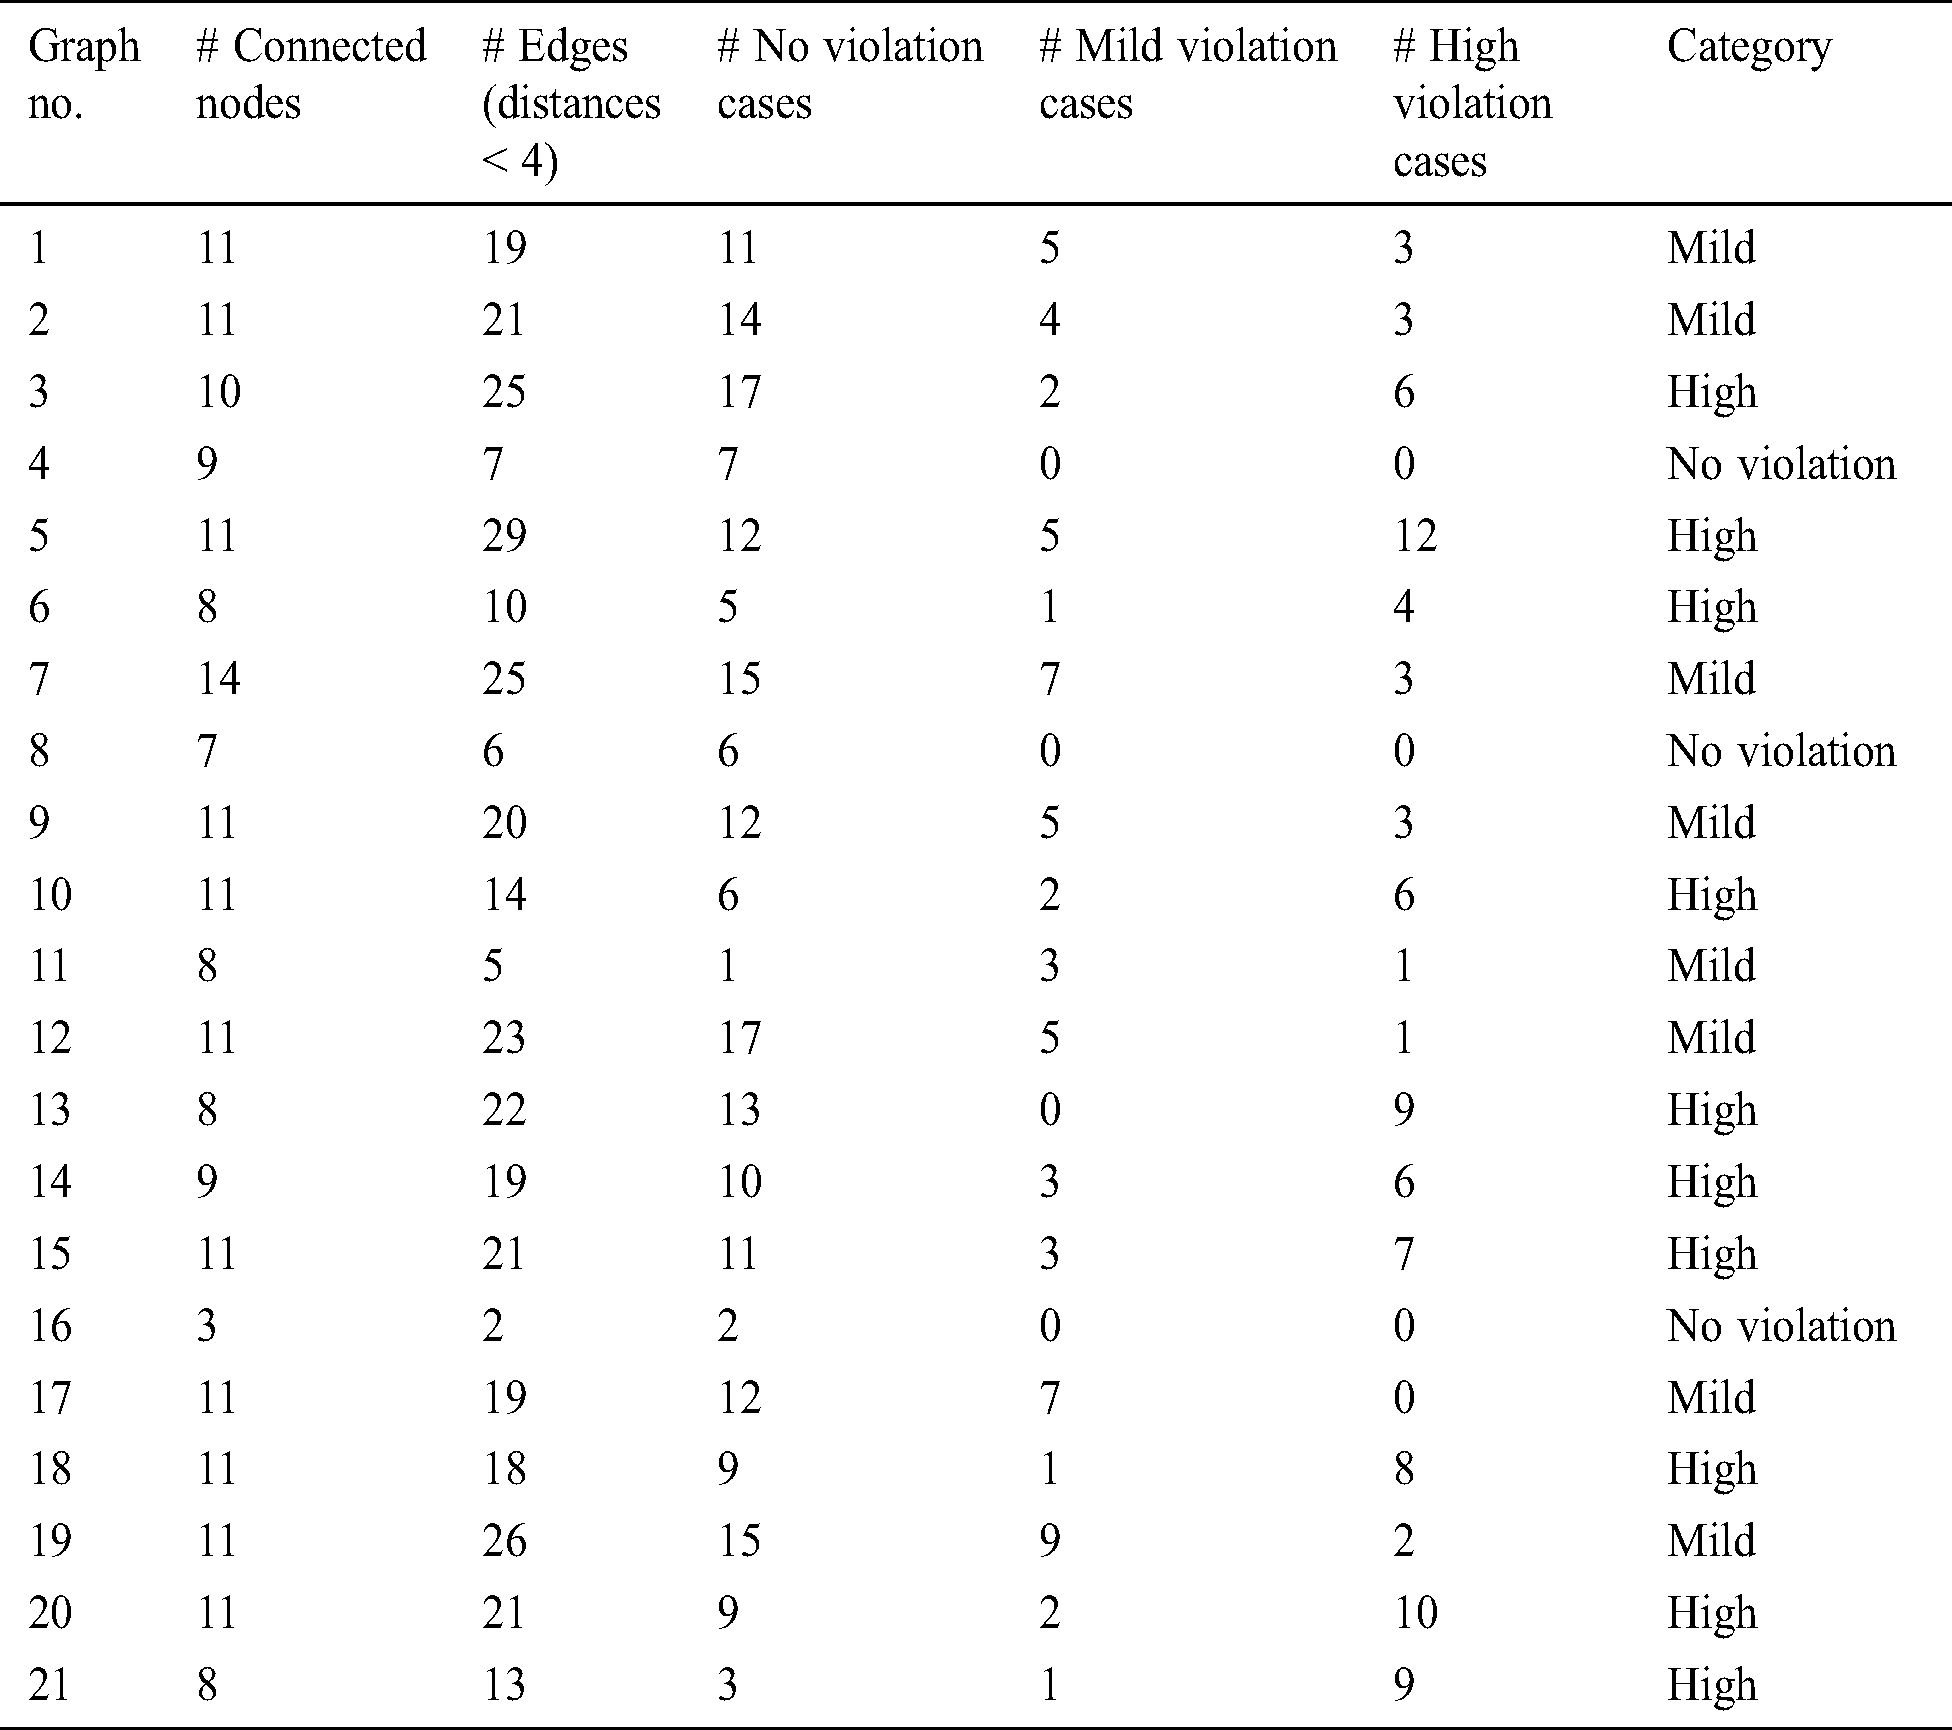
According to the simulation results demonstrated in Tab. 3, it is possible at this stage of system development to detect the distancing measure violations for a group of individuals using simple graph database queries, rather than machine learning and computer vision techniques. From the 21 randomly generated graphs, the system detects the class of violation and its degree, as demonstrated in the following chart. Fig. 7 summarizes the results showing the difference in violation of social distancing measures for each case. The simulation produces results of 10 high violation, 8 mild violation, and 3 no violation cases. For simplicity, a selected graph from each category, represented in Tab. 3, is considered in the following subsections to demonstrate in more detail the simulation results of Graphs 4, 11, and 21.
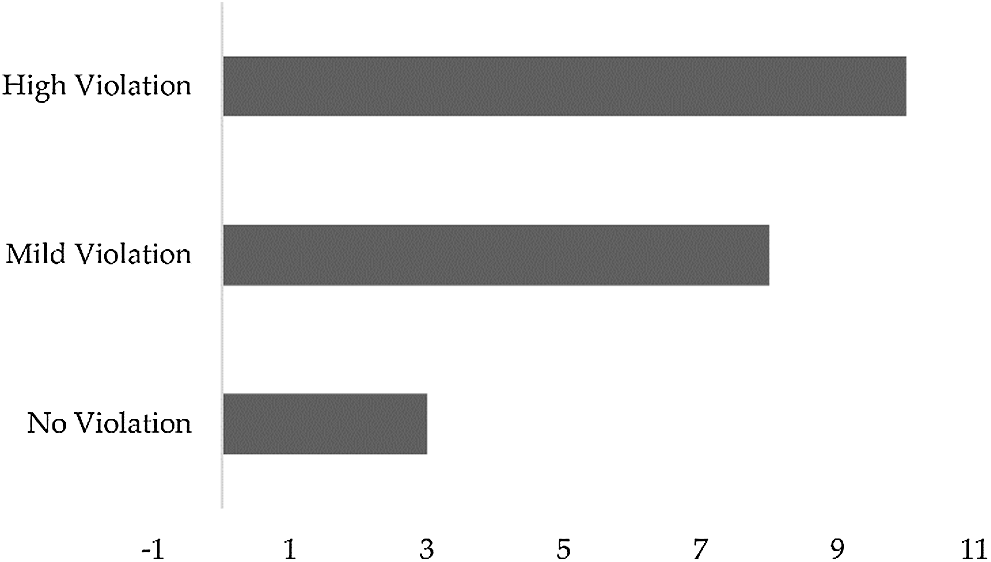
Figure 7: A summary of the experiment results
6.2.1 Detecting No Violation of Social Distancing Measures
The graph generated in case 4 is considered for demonstrating the detection of no violation of distancing measures. A subgraph representation of individuals inside the store and their distances that range between 2 m and 4 m only are considered.
This range of distances is considered a safe and acceptable measure for coronavirus and the need to maintain separation between the customers in the store as much as possible. For illustration only, the graph nodes are positioned manually in possible locations inside the store sketch, maintaining the distances generated between them, to present a possible visualization in this proof of concept. In Fig. 8, it is evident that the original completed graph has become two subgraphs. The first graph consists of four vertices and three edges, whereas the second graph contains five nodes and four relationships only.
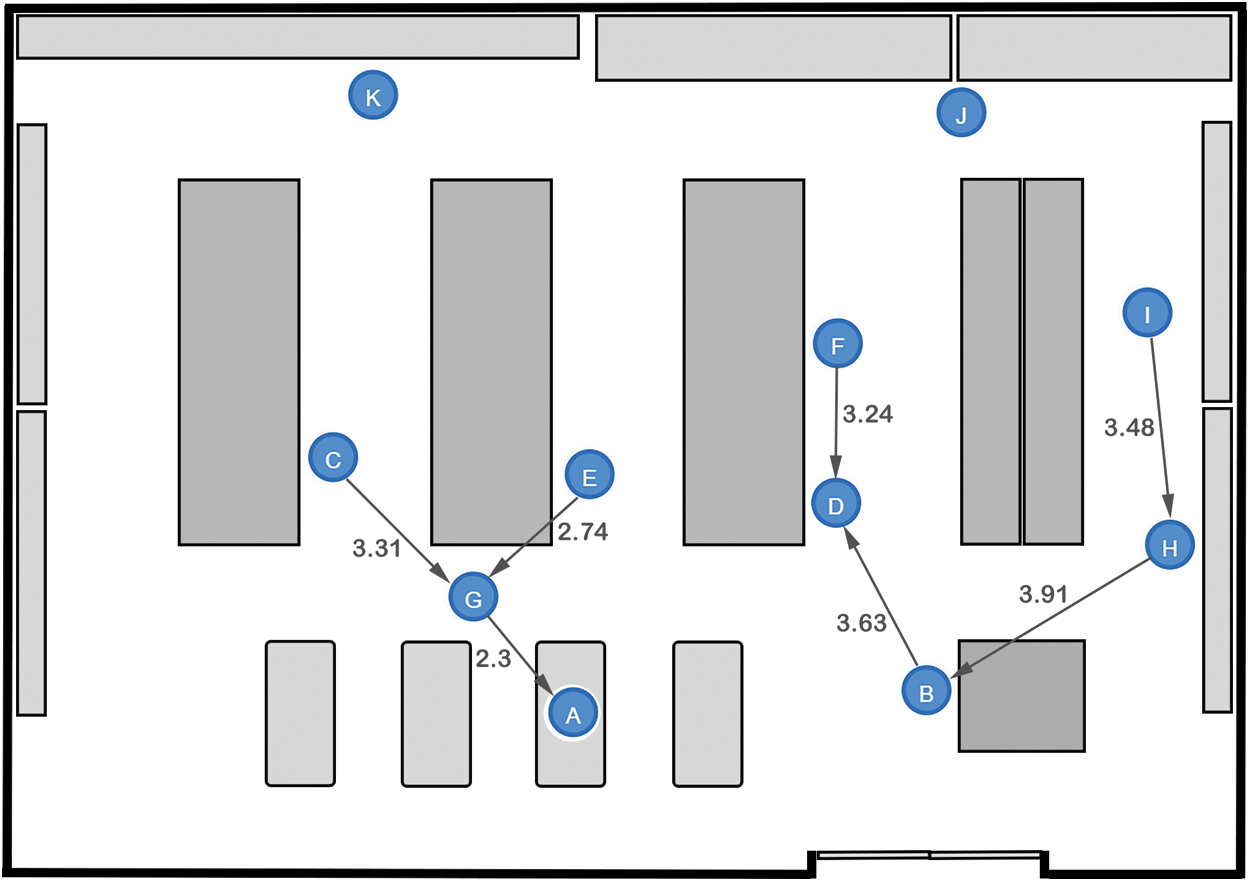
Figure 8: A case representing no violation of social distancing measures inside a supermarket
Based on the simulation results illustrated in Tab. 3, which provide the answers to the predefined queries Q1–Q5, the system should output the message shown in Tab. 4 to the decision maker.
Table 4: Results of generated Graph 4 and the output message to decision support

6.2.2 Detecting a Moderate (Mild) Violation of Social Distancing Measures
Like the steps applied to the first case, the generated graph in case 11 is considered to demonstrate the detection of a mild violation of distancing measures. Subgraphs of persons in the store in which some nodes fall in the range of 1.4 m and 2.0 m are considered, while the remainder exceed that range.
The chosen distance range in this case is considered to represent a low degree of transmission of the COVID-19 virus in public. Like the first case, the graph vertices are located manually inside the store sketch, maintaining the distances generated between them, to provide a visualization for decision makers. Fig. 9 shows three small subgraphs derived from the original graph. The first graph consists of two nodes and an edge, and each of the second and third graphs has three nodes and two relationships.
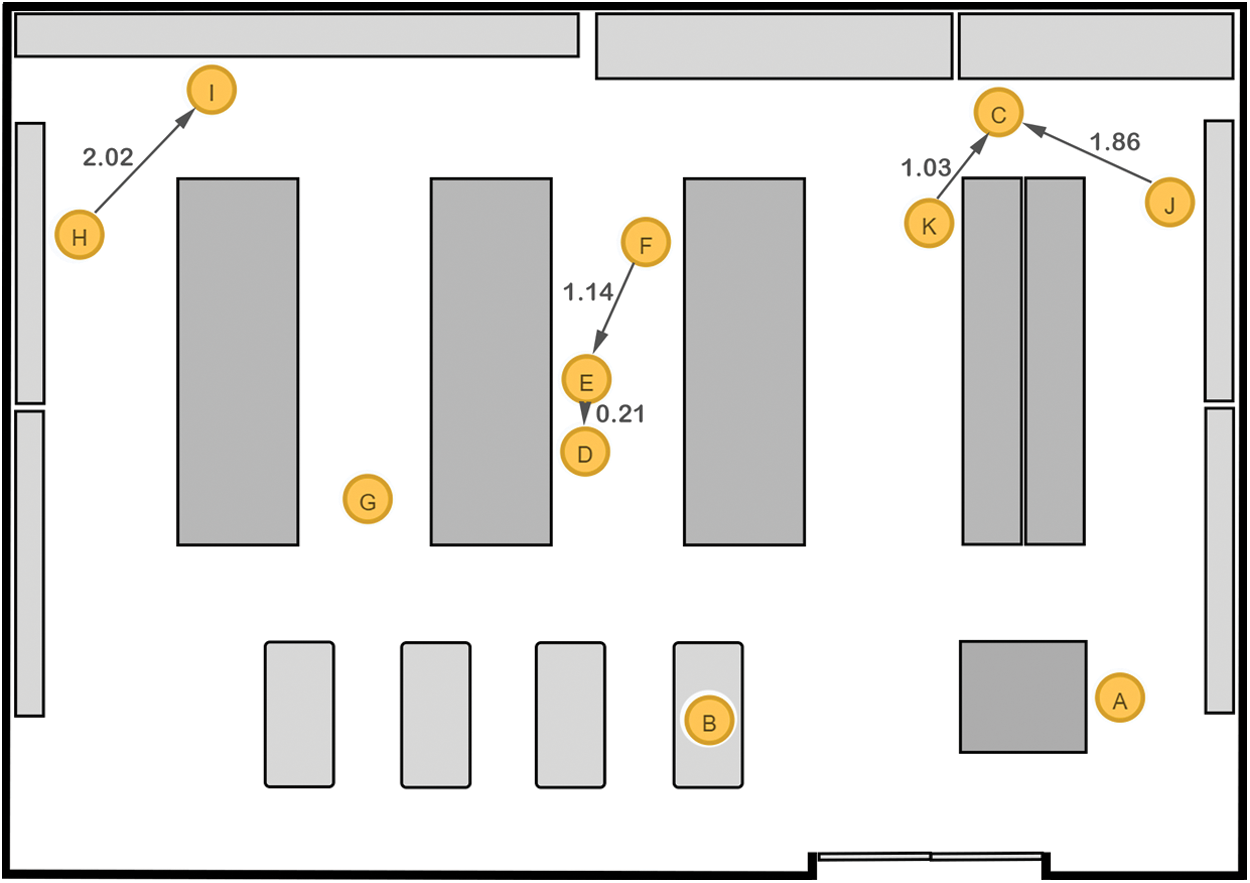
Figure 9: A case representing mild/moderate (limited) violation of social distancing measures inside a supermarket
Like the previous case, based on the simulation results and answers to the predefined queries Q1–Q5 in Tab. 3, the system should output the message shown in Tab. 5 to the decision maker.
Table 5: Results of generated Graph 11 and the output message to decision support

6.2.3 Detecting a High Violation of Social Distancing Measures
Like the steps applied in the previous cases, the generated graph in case 21 is considered for demonstrating the detection of a high violation of social distancing rules that leads to a high degree of transmission of the virus. Subgraphs for this situation with a distancing range between 0.01 m and 1.39 m are considered.
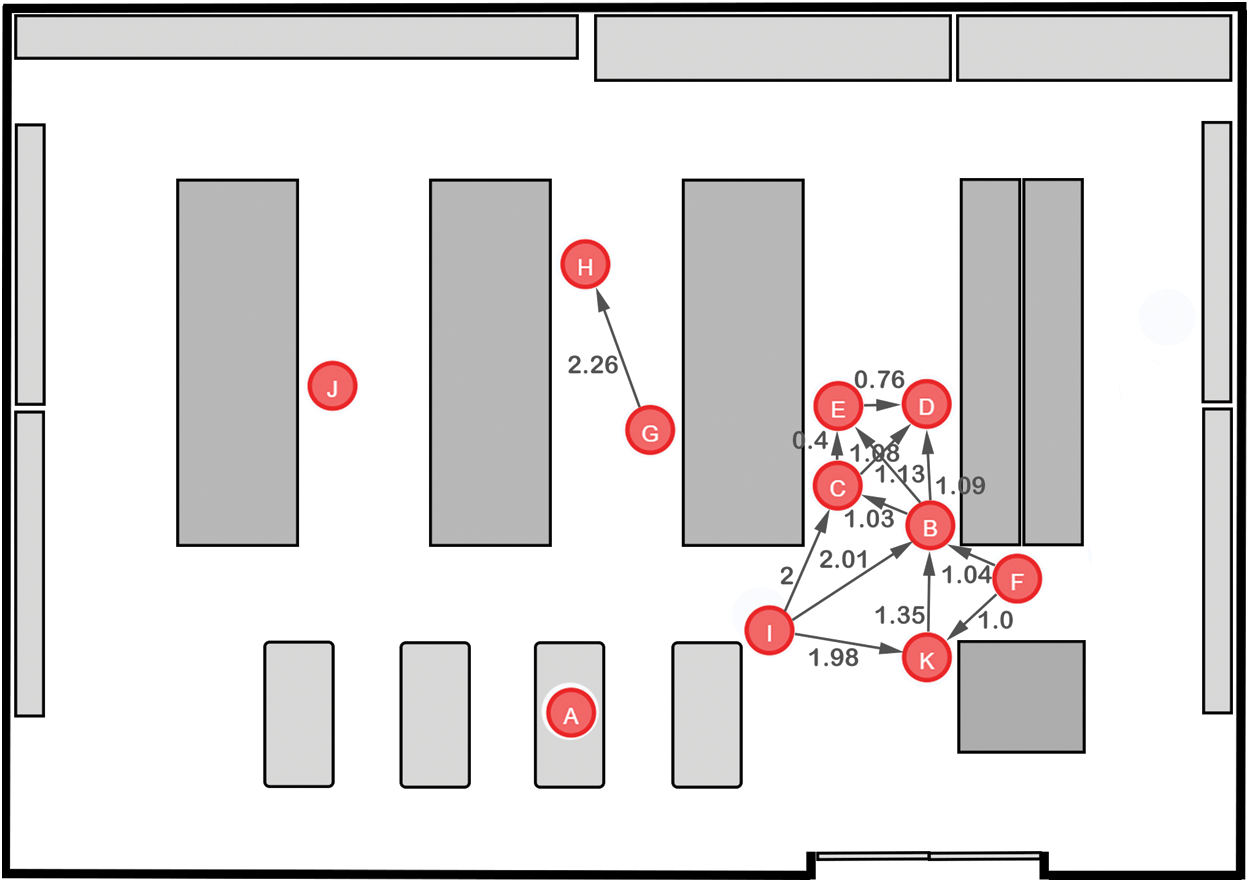
Figure 10: A case representing high violation of social distancing measures inside a supermarket
As for the previous cases, Fig. 10 demonstrates that there are two subgraphs that violate the distancing measures inside the virtual store. The first graph is considered a large graph and accounts for about 64% of the total number of the nodes in the original graph (7 nodes and 12 relationships). The second subgraph is a smaller graph with two vertices and one relationship. Like the past cases, based on the simulation results and the answers to the predefined queries Q1–Q5 in Tab. 3, the system should output the message shown in Tab. 6 to the decision maker.
Table 6: Results of generated graph 21 and the output message to decision support

6.3 Scalability and Limitation of the Proposed Approach
Before discussing the scalability details of the proposed design, it should be recalled that the main objective of the system is to detect violations of COVID-19 physical distancing measures. To evaluate scalability, a larger test case to detect distancing violations of a crowd of people (121 persons) was designed. The Neo4j 3.5.14 database system was utilized to run the Cypher script, shown in Listing 5, to produce a larger graph with 121 nodes and 2020 relationships (edges) in 176 ms.
Listing 5: Neo4j Cypher script used to generate a larger graph with 121 nodes
Tab. 7 shows the number of generated elements of the graph, including the number of created nodes and the number of created or matched edges. It also lists the time the system took to assess the graph structure and edges with weights > 4 m.
Table 7: Total number of elements in the generated graph and the time of their creation

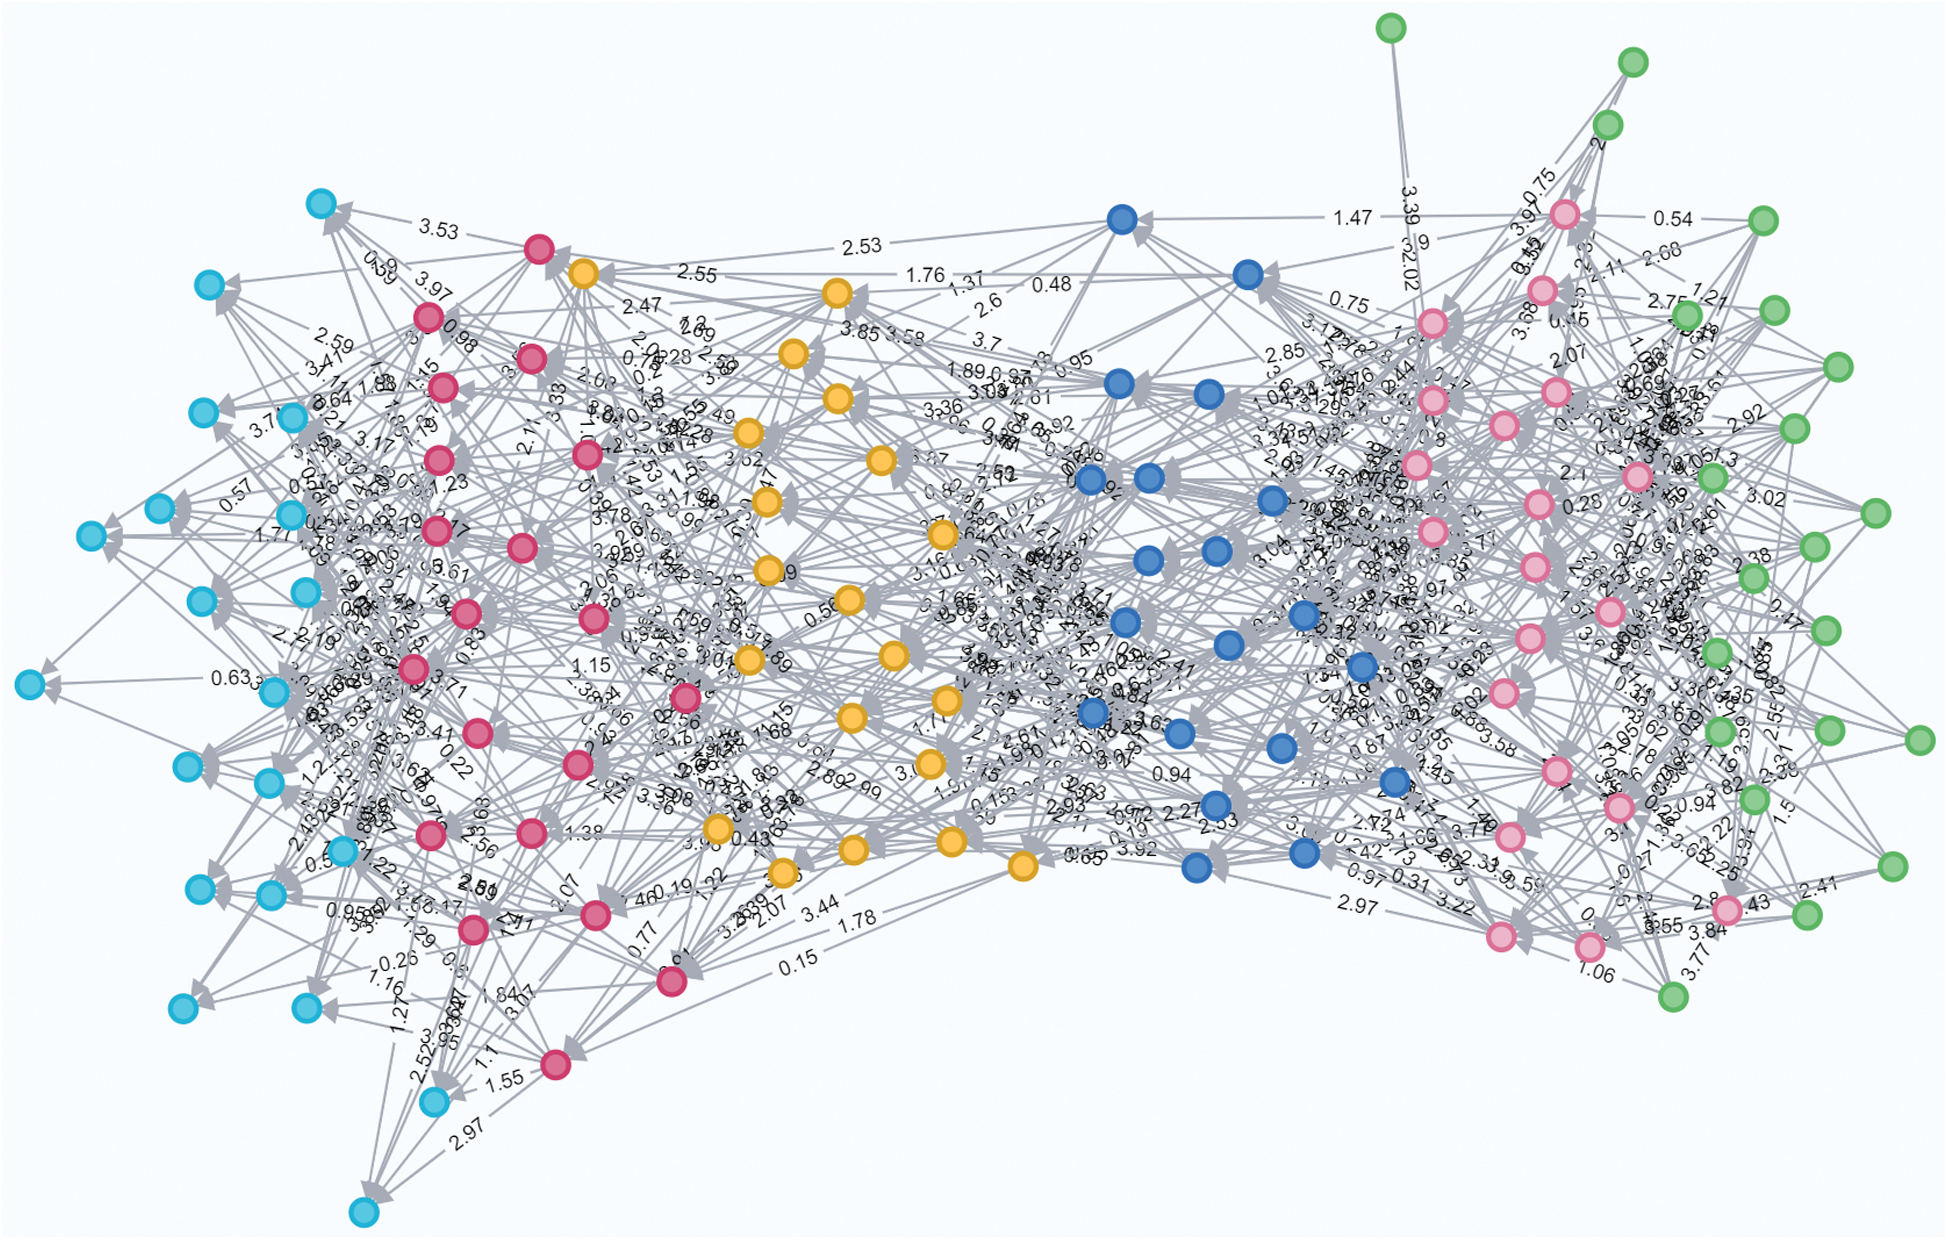
Figure 11: Snapshot of the larger graph for evaluating the scalability of the proposed approach
The concept of connected graphs was considered in orchestrating the generation of edges between nodes to make this case more realistic. The 121 nodes were distributed into five groups of nodes, each of which represented a subgraph. Then, edges were defined between nodes in every pair of neighboring graphs. This strategy is illustrated in Fig. 11.
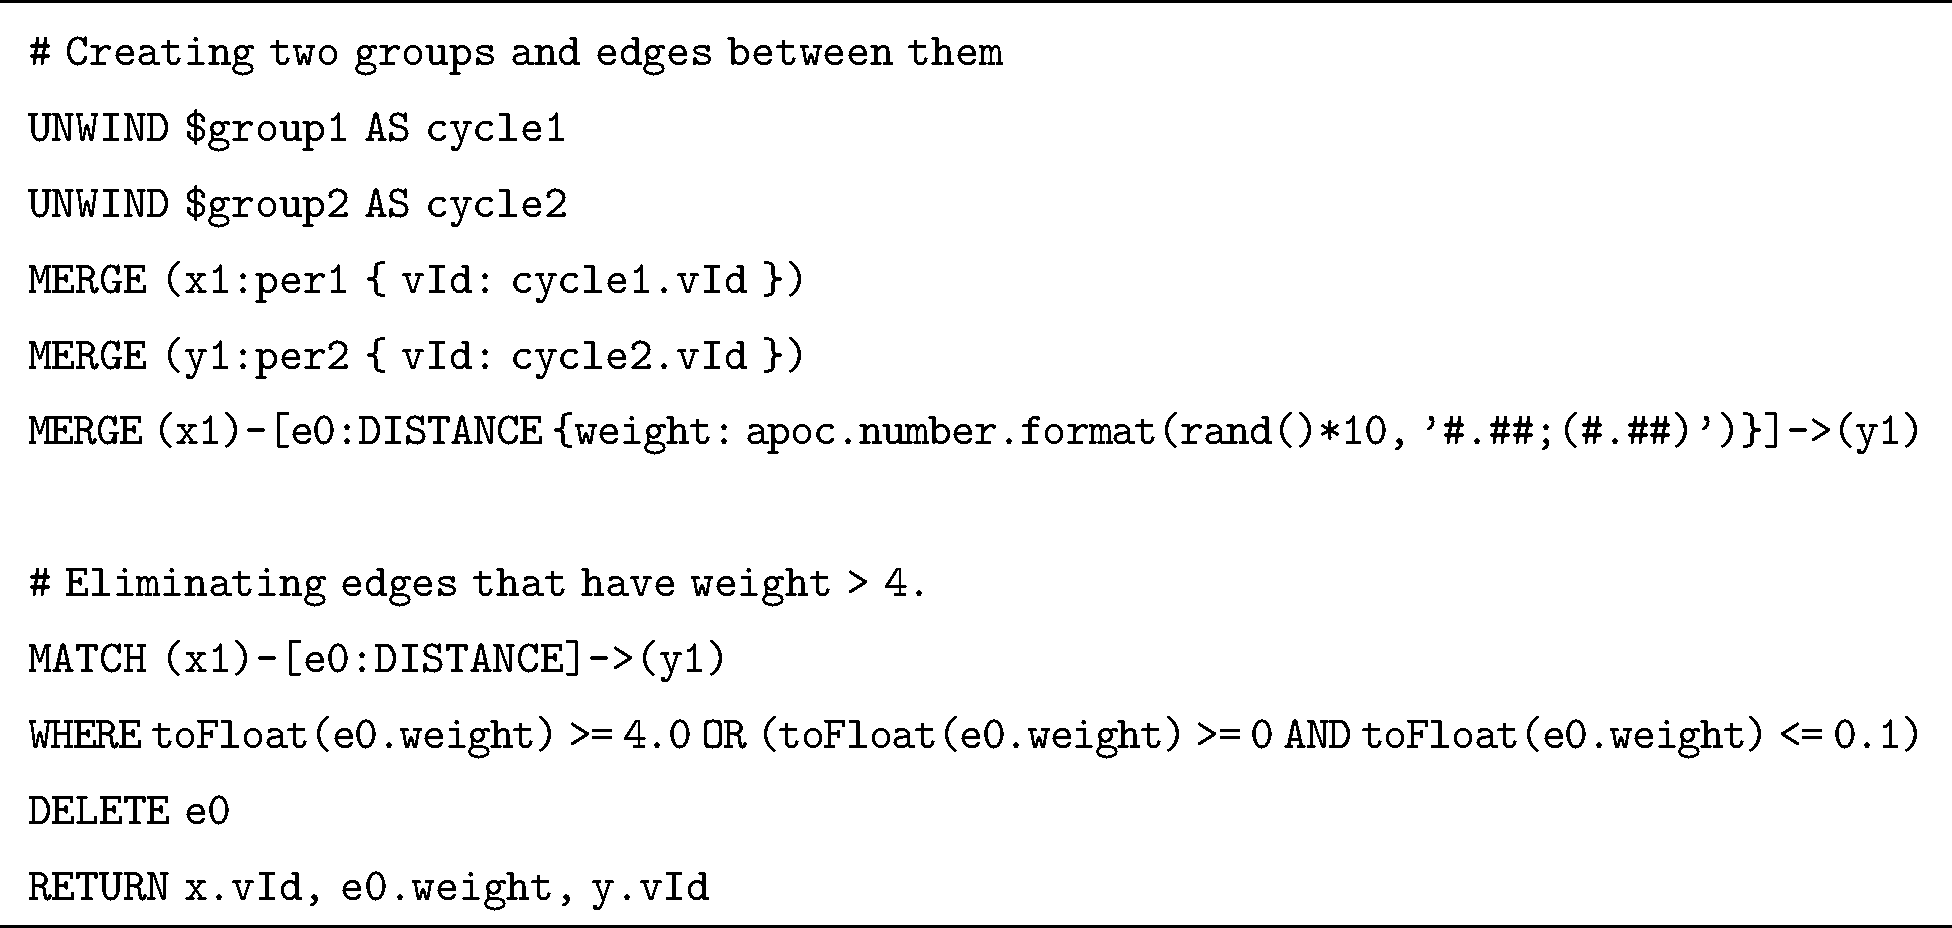
Like the strategy of assessing graphs in the original cases discussed in Section 6.2, the predefined queries Q1–Q5 were considered to determine the level of distancing violation. For simplicity, Tab. 8 shows the triples of Group1 and Group2, including their connected nodes and edges. These triples are presented following the format: (NODE EDGE[weight] NODE).
Table 8: Resulting graph triples of the simulation of the large graph

Based on the results shown in Tab. 7 and Tab. 8, no problems are apparent with the horizontal scaling of the proposed system design. As with any expansion of the graph size, the system is able to record all of the triples to be assessed using the predefined queries Q1Q5 and provide the percentage of violations to output an appropriate message to the decision maker, as shown in Tab. 9.
Table 9: Results of the generated larger graph and the output message to decision support

Overall, the proposed approach employed various utilizations of IoT devices, edge/cloud computing, and BLE beacons for indoor localization, detection, and monitoring. Consequently, the main objective of the system design presented is achievable. An advantage of the proposed design is the ability to use the recorded data in the closed area to analyze and understand group behavior inside that area using only simple graph database query processing. For deeper analysis, the Neo4j Graph Data Science library introduced by Neo4j enables data scientists to make valuable predictions.
Another advantage is that the proposed design can be considered vertically scalable by increasing the number of IoT devices, including BLE beacons and Bluetooth badges, to accommodate larger crowds and coverage areas. A potential extension of the proposed system architecture is the adoption of smartphones or smart watches as alternatives to Bluetooth badges because all smart devices are currently equipped with Bluetooth connectivity. This would enable the design presented to be expanded to include, for instance, a mobile application installed in smart devices to notify individuals about the status of their current location, which could also apply to outdoor areas.
This paper presented a conceptual design for an indoor physical distancing monitoring system based on a graph database and edge processing. The IoT edge-based system architecture introduced consists of several components; each of the components is responsible for performing and managing a variety of tasks. These components comprise wearable devices and WSN infrastructure (sensing layer), data processing at edge points (middleware layer), and a cloud graph database (data storage layer). By using the BLE beacon technology in the proposed design for indoor detecting physical distancing, the network infrastructure presented has the advantages of low energy consumption, signal range and accuracy of BLE standards, and cloud beacons. A graph database is used to represent the distancing between individuals in a group, and distancing measures are implemented via graph database queries as an alternative solution to that of the traditional tracking and localization system. A Neo4j graph database system was used to conduct several experiments as proof of concept of the overall design idea. These system layers are glued by a strategy of model transformation aimed at generating the final executable Neo4j Cypher script code from a high-level graph model (intermediate). The mapping rules are implemented using the commonly known hybrid transformation language, ATL.
Experimental results indicate the proposed design would allow decision makers to detect COVID-19 social distancing measures within an enclosed area. The proposed system includes a notification sent to an authorized person informing them about the status of physical distancing measures at a specific time and advising when urgent action is required. Based on the recorded and analyzed data, the number of individuals permitted to be inside the monitored area at a specific time of the day or on a particular day of the week can be reduced. Conversely, the permitted number of individuals can be increased in areas in which rules of social distancing have been followed without violation.
Funding Statement: The author(s) received no specific funding for this study.
Conflicts of Interest: The authors declare that they have no conflicts of interest to report regarding the present study.
1. G. Pal, G. Li and K. Atkinson. (2018). “Multi-agent big-data lambda architecture model for e-commerce analytics,” Data, vol. 3, no. 4, pp. 58. [Google Scholar]
2. B. Leang, S. Ean, G. Ryu and K. H. Yoo. (2019). “Improvement of kafka streaming using partition and multi-threading in big data environment,” Sensors, vol. 19, no. 1, pp. 134. [Google Scholar]
3. G. J. Milne, S. Xie and D. Poklepovich. (2020). “A modelling analysis of strategies for relaxing COVID-19 social distancing,” MedRxiv, vol. 2020, pp. 1–17. [Google Scholar]
4. A. Polenta, P. Rignanese, P. Sernani, N. Falcionelli, D. N. Mekuria et al. (2020). , “An internet of things approach to contact tracing—the bubbleBox system,” Information, vol. 11, no. 7, pp. 347. [Google Scholar]
5. Z. Allam, G. Dey and D. S. Jones. (2020). “Artificial intelligence (AI) provided early detection of the coronavirus (COVID-19) in china and will influence future urban health policy internationally,” AI, vol. 1, no. 2, pp. 156–165. [Google Scholar]
6. A. Bekkali and M. Matsumoto. (2007). “RFID indoor tracking based on inter-tags distance measurement,” Wireless Telecommunications Symposium, IEEE, Pomona, CA, pp. 1.
7. T. Y. H. Angela, V. Viswanathan, M. Lees and W. Cai. (2014). “Analyzing the effectiveness of wearable wireless sensors in controlling crowd disasters,” In Procedia Computer Science, vol. 29, Elsevier, Netherlands, pp. 1590–1599. [Google Scholar]
8. T. Ahmed, T. B. Pedersen and H. Lu. (2014). “Finding dense locations in indoor tracking data,” in IEEE 15th Int. Conf. on Mobile Data Management, vol. 1, IEEE, Brisbane, Australia, pp. 189–194. [Google Scholar]
9. X. Xu, S. Ding and T. Sun. (2018). “A fast density peaks clustering algorithm based on pre-screening,” in IEEE Int. Conf. on Big Data and Smart Computing (BigComp), IEEE, Shanghai, China, pp. 513–516. [Google Scholar]
10. C. Martella, M. Van Steen, A. Van Halteren, C. Conrado and J. Li. (2014). “Crowd textures as proximity graphs,” IEEE Communications Magazine, vol. 52, no. 1, pp. 114–121. [Google Scholar]
11. M. Nikodem, M. Słabicki, T. Surmacz, P. Mrówka and C. Dołęga. (2020). “Multi-camera vehicle tracking using edge computing and low-power communication,” Sensors, vol. 20, no. 11, pp. 1–16. [Google Scholar]
12. F. Jamil, S. Ahmad, N. Iqbal and D. H. Kim. (2020). “Towards a remote monitoring of patient vital signs based on IoT-based blockchain integrity management platforms in smart hospitals,” Sensors, vol. 20, no. 8, pp. 1–26. [Google Scholar]
13. J. Kolakowski, V. Djaja-Josko, M. Kolakowski and K. Broczek. (2020). “UWB/BLE tracking system for elderly people monitoring,” Sensors, vol. 20, pp. 6. [Google Scholar]
14. N. Vallez, S. Krauss, J. L. Espinosa-Aranda, A. Pagani, K. Seirafi et al. (2020). , “Automatic museum audio guide,” Sensors, vol. 20, no. 3, pp. 779. [Google Scholar]
15. H. Zhang, Z. Zhang, N. Gao, Y. Xiao, Z. Meng et al. (2020). , “Cost-effective wearable indoor localization and motion analysis via the integration of UWB and IMU,” Sensors, vol. 20, no. 2, pp. 1–23. [Google Scholar]
16. L. Shen, Q. Zhang, J. Pang, H. Xu, P. Li et al. (2019). , “ANTspin: Efficient absolute localization method of RFID tags via spinning antenna,” Sensors, vol. 19, no. 9, pp. 1–20. [Google Scholar]
17. J. H. Huh and K. Seo. (2017). “An indoor location-based control system using bluetooth beacons for IoT systems,” Sensors, vol. 17, no. 12, pp. 1–22. [Google Scholar]
18. F. S. Daniş and A. T. Cemgil. (2017). “Model-based localization and tracking using bluetooth low-energy beacons,” Sensors, vol. 17, no. 11. [Google Scholar]
19. O. Belmonte-Fernández, A. Puertas-Cabedo, J. Torres-Sospedra, R. Montoliu-Colás and S. Trilles-Oliver. (2017). “An indoor positioning system based on wearables for ambient-assisted living,” Sensors, vol. 17, no. 12, pp. 36. [Google Scholar]
20. M. Lewandowski, B. Płaczek, M. Bernas and P. Szymała. (2018). “Road traffic monitoring system based on mobile devices and Bluetooth low energy beacons,” Wireless Communications and Mobile Computing, Egypt, vol. 2018, pp. 12. [Google Scholar]
21. B. Yu, L. Xu and Y. Li. (2012). “Bluetooth low energy (BLE) based mobile electrocardiogram monitoring system,” in IEEE Int. Conf. on Information and Automation, IEEE, Chengdu, China, pp. 763–767. [Google Scholar]
22. D. Zhang, L. T. Yang, M. Chen, S. Zhao, M. Guo et al. (2014). , “Real-time locating systems using active RFID for internet of things,” IEEE Systems Journal, vol. 10, no. 3, pp. 1226–1235. [Google Scholar]
23. G. Paolini, D. Masotti, F. Antoniazzi, T. S. Cinotti and A. Costanzo. (2019). “Fall detection and 3-D indoor localization by a custom RFID reader embedded in a smart e-health platform,” IEEE Transactions on Microwave Theory and Techniques, vol. 67, no. 12, pp. 5329–5339. [Google Scholar]
24. M. El-Absi, A. A. H. Abbas, A. Abuelhaija, K. Solbach and T. Kaiser. (2018). “Distance and tag aware localization in indoor terahertz systems,” in First International Workshop on Mobile Terahertz Systems (IWMTS), IEEE, Duisburg, Germany, pp. 1–5. [Google Scholar]
25. P. Kriz, F. Maly and T. Kozel. (2016). “Improving indoor localization using Bluetooth low energy beacons,” Mobile Information Systems, vol. 2016, pp. 1–11. [Google Scholar]
26. P. Spachos and K. N. Plataniotis. (2020). “BLE beacons for indoor positioning at an interactive IoT-based smart museum,” IEEE Systems Journal, vol. 14, no. 3, pp. 3483–3493. [Google Scholar]
27. A. Jabbari, K. J. Almalki, B. Y. Choi and S. Song. (2019). “ICE-MoCha: Intelligent crowd engineering using mobility characterization and analytics,” Sensors, vol. 19, no. 5, pp. 1025. [Google Scholar]
28. F. Zafari, A. Gkelias and K. K. Leung. (2019). “A survey of indoor localization systems and technologies,” IEEE Communications Surveys & Tutorials, vol. 21, no. 3, pp. 2568–2599. [Google Scholar]
29. B. Matthias, F. Burkert, F. Schmidt, S. Hinz, D. Hartmann et al. (2011). , “Integrating pedestrian simulation, tracking and event detection for crowd analysis,” in IEEE Int. Conf. on Computer Vision Workshops (ICCV Workshops), IEEE, Barcelona, Spain, pp. 150–157. [Google Scholar]
30. V. Galpin, N. Zoń, P. Wilsdorf and S. Gilmore. (2018). “Mesoscopic modelling of pedestrian movement using carma and its tools,” ACM Transactions on Modeling and Computer Simulation (TOMACS), vol. 28, no. 2, pp. 1–26. [Google Scholar]
31. Y. Jia, Y. Qi, H. Shang, R. Jiang and A. Li. (2018). “A practical approach to constructing a knowledge graph for cybersecurity,” Engineering, vol. 4, no. 1, pp. 53–60. [Google Scholar]
32. K. Jiang, D. Yang, C. Liu, T. Zhang and Z. Xiao. (2018). “A flexible multi-layer map model designed for lane-level route planning in autonomous vehicles,” Engineering, vol. 5, no. 2, pp. 305–318. [Google Scholar]
33. A. F. Subahi. (2019). “Edge-based IoT medical record system: Requirements, recommendations and conceptual design,” in IEEE Access, vol. 7, IEEE, USA, pp. 94150–94159. [Google Scholar]
34. M. Younas. (2019). “Research challenges of big data,” Service Oriented Computing and Applications, vol. 13, no. 2, pp. 105–107. [Google Scholar]
35. A. F. Subahi and K. E. Bouazza. (2020). “An intelligent IoT-based system design for controlling and monitoring greenhouse temperature,” in IEEE Access, vol. 8, IEEE, USA, pp. 125488–125500. [Google Scholar]
36. I. Robinson, W. Jim and E. Emil. (2015). Graph Databases: New Opportunities for Connected Data, O’Reilly Media, USA. [Google Scholar]
37. Y. W. Chiou. (2002). “APIs for XML: DOM, SAX, and JDOM,” in Perspectives on Information Systems Development, Boston, MA: Springer, pp. 299–308. [Google Scholar]
38. F. Jouault and I. Kurtev. (2005). “Transforming models with ATL,” in Int. Conf. on Model Driven Engineering Languages and Systems, Berlin, Heidelberg: Springer, pp. 128–138. [Google Scholar]
 | This work is licensed under a Creative Commons Attribution 4.0 International License, which permits unrestricted use, distribution, and reproduction in any medium, provided the original work is properly cited. |