DOI:10.32604/csse.2021.014764
| Computer Systems Science & Engineering DOI:10.32604/csse.2021.014764 | |
| Article |
The Bivariate Transmuted Family of Distributions: Theory and Applications
Department of Statistics, Faculty of Science, King Abdulaziz University, Jeddah, Saudi Arabia
*Corresponding Author: Muhammad Qaiser Shahbaz. Email: mkmohamad@kau.edu.sa
Received: 14 October 2020; Accepted: 06 November 2020
Abstract: The bivariate distributions are useful in simultaneous modeling of two random variables. These distributions provide a way to model models. The bivariate families of distributions are not much widely explored and in this article a new family of bivariate distributions is proposed. The new family will extend the univariate transmuted family of distributions and will be helpful in modeling complex joint phenomenon. Statistical properties of the new family of distributions are explored which include marginal and conditional distributions, conditional moments, product and ratio moments, bivariate reliability and bivariate hazard rate functions. The maximum likelihood estimation (MLE) for parameters of the family is also carried out. The proposed bivariate family of distributions is studied for the Weibull baseline distributions giving rise to bivariate transmuted Weibull (BTW) distribution. The new bivariate transmuted Weibull distribution is explored in detail. Statistical properties of the new BTW distribution are studied which include the marginal and conditional distributions, product, ratio and conditional momenst. The hazard rate function of the BTW distribution is obtained. Parameter estimation of the BTW distribution is also done. Finally, real data application of the BTW distribution is given. It is observed that the proposed BTW distribution is a suitable fit for the data used.
Keywords: Transmuted Distributions; (T−X) family of distributions; bivariate transmuted family of distributions; Weibull distribution; maximum likelihood estimation
The probability distributions are widely used in several areas of life. Certain situations arise where the standard probability models are not capable of capturing complex behavior of the data and hence some extensions are required. Numerous methods are available in literature to extend a univariate probability distribution by adding some new parameters. These developments provide more flexible statistical distributions by adding new parameters to the baseline distribution. A simple method to extend any baseline distribution is proposed by Shaw et al. [1] and is known as the transmuted family of distributions. The cumulative distribution function  of this family is

where  is the
  of the baseline distribution and
  is the transmutation parameter such that
  .
.
Various researches have extended the transmuted family of distributions by using the  family of distributions proposed by Alzaatreh et al. [2]; see for example the transmuted-G family of distributions [3], the Kumaraswamy transmuted-G family of distributions by Afify et al. [4], the beta transmuted-H family by Afify et al. [5] and the T-transmuted X family of distributions by Jayakumar et al. [6].
Different situations arise where the joint modeling of two variables is required and in such cases the bivariate distributions are required. The development of bivariate distributions from univariate marginals has been an area of interest. Several methodologies have been proposed to develop the bivariate distribution from given univariate marginals. A classical method has been proposed by Gumbel [7] which generated a bivariate distribution from given univariate marginals and is known as Gumbel family of distributions. The joint  of Gumbel bivariate distribution is given as

where  and
and  are any marginal cdf’s and
  is an association parameter. This family has been studied by various authors. For example, the bivariate Kumaraswamy distribution has been studied by Barreto-Souza et al. [8], the bivariate Pareto distributions by Sankaran et al. [9] among others. Sarabia et al. [10] has extended the
  family of distributions to the bivariate case by using bivariate beta distribution as baseline distribution. This method has opened horizons for development of new bivariate distributions. In this article a bivariate transmuted family of distributions is proposed and some of its properties are studied. The family of distributions is proposed in the following sections.
2 The Bivariate Transmuted Family of Distributions
Alzaatreh et al. [2] have proposed a new method to derive families of distributions using two different distributions. The proposed family is referred to as the T–X family of distributions. The  of this family is

where  is some function of
  such that

The probability density function ( ) corresponding to (1) is

The transmuted family of distributions, proposed by Shaw et al. [1], can be obtained from (1) by using a suitable  with support on
  and
and  . Alizadeh et al. [11] has shown that the transmuted family of distribution can be obtained by using
  and
and  in (1).
In this article our focus is to extend the transmuted family of distributions to bivariate case. It is, therefore, suitable to discuss the bivariate T–X family of distributions and then use it to propose a new family of distribution called the bivariate transmuted family of distributions.
A simple bivariate extension of  family of distributions is defined by the joint cdf.

where  and
and  have usual properties and
  is any bivariate distribution with suitable support for random variables
  and
and  . If
. If  is a bivariate distribution such that the support of u1 and u2 is
  then a simpler version of bivariate T – X family is given as

It can be seen that the Gumbel bivariate family of distributions can be obtained from (2) by using

The bivariate transmuted family of distributions is obtained by using

in (2) and the joint cdf of the proposed bivariate transmuted family is

where  and
and  are any marginal cdf’s and
  are the transmutation parameters such that
  ,
,  and
and  .
.
The density function corresponding to (3) is

We will, now, give some properties of the bivariate transmuted family of distributions.
3 Properties of Bivariate Transmuted Family of Distributions
In this section some important properties of the bivariate transmuted family of distributions are studied. These properties include the marginal and conditional distributions, conditional moments, product and ratio moments, bivariate reliability and bivariate hazard rate functions. Maximum likelihood estimation of the parameters of the family is also given when all the parameters of the baseline distribution are known.
3.1 The Marginal and Conditional Distributions
The marginal cdf’s of X and Y are readily written from (3) as

and

where  and
and  are the cdf’s of baseline distributions and
  ,
,  and
and  . It is easy to see that (5) and (6) are cdf’s of transmuted family of distributions. The marginal density functions of X and Y are

and

where  and
and  are the pdf’s of baseline distributions corresponding to
  and
and  , respectively.
The conditional distribution of  given
given  and
and  given
given  for the bivariate transmuted family of distributions are readily written as

and

where  and
and  The conditional distributions can be studied for any baseline distribution.
The rth conditional moment of  given
given  is obtained by using

Now using the conditional distribution of  given
given  , given in (9), the rth conditional moment of
  given
given  is
is

where  ,
,  is rth raw moment of
  and
and  is rth raw moment of larger observation in a sample of size 2 from
  .
.
Again the sth conditional moment of  given
given  is defined as

Using (10), the sth conditional moment of  given
given  is
is

where  is sth raw moment of
  and
and  is sth raw moment of larger observation in a sample of size 2 from
  .
.
3.3 The Product and Ratio Moments
The product and ratio moments are defined as

and
The product moments for the bivariate transmuted family of distribution are obtained as

which on simplification becomes

Similarly, the  th ratio moments for the bivariate transmuted family of distributions are obtained as

which on simplification becomes

where  is sth negative moment of
  and
and  is sth negative moment of larger observation in a sample of size 2 from
  .
.
3.4 The Bivariate Reliability and Hazard Rate Functions
The reliability function indicates the probability that a patient, device or other element of interest has ability to survive after some specific time (for more details see [12,13]). The bivariate reliability function for random variables X and Y is defined as

Now using (5), (6) and (3) in above equation, the bivariate reliability function for the bivariate transmuted family of distributions is

which can be obtained for different baseline cdf’s  and
and  .
.
The hazard rate function is important in reliability studies. It describes the instantaneous rate of failure at any given time. The bivariate hazard rate function (see for example [14]) is defined as

The bivariate hazard rate function for the bivariate transmuted family of distributions is obtained by using (4) and (15) in above equation and is

The bivariate hazard rate function can be computed for  and
and  .
.
The dependence between two random variables is an important measure to study the relationship between two variables. In this section two improtant dependence measures for the bivariate transmuted family of distributions are obtained. These dependence measures include Kendall’s tau and Spearman’s rho. The Kendall’s tau coefficient for two continuous random variables is computed by using

which for the bivariate transmuted family of distributions is

Again, the Spearman’s rho for two continuous random variables is obtained as

which for the bivariate transmuted family of distributions is given as

We can readily see that the Kendall’s tau will always be larger than the Spearman’s rho for the bivariate transmuted family of distributions.
3.6 Estimation of the Parameters
In this section the maximum likelihood estimation of the parameters is done for the bivariate transmuted family of distributions under the assumption that all the parameters of baseline distributions  and
and  are known. For this, suppose
  is a random sample of size
  from the bivariate transmuted family of distributions. The likelihood function is

and the log-likelihood function is

The derivatives of log-likelihood function with respect to  ,
,  and
and  are
are


and

The maximum likelihood estimators of  ,
,  and
and  are obtained by equating (20), (21) and (22) to zero and numerically solving the resulting equations.
The bivariate transmuted family of distributions can be explored for any baseline distribution. In the following section we will study a member of the bivariate transmuted family of distributions for baseline Weibull distribution. The resulting distribtuion is named as bivariate transmuted Weibull distribution.
4 The Bivariate Transmuted Weibull Distribution
The Weibull distribution is a widely used distribution in statistical analysis, especially in the field of reliability. The Weibull distribution, introduced by Weibull [15], has been explored by several authors. Various extensions of the Weibull distribution have been proposed from time-to-time. The transmuted Weibull ( for short) distribution has proposed by Aryal and Tsokos [16].
In the following we will propose the bivariate transmuted Weibull distribution by using  of Weibull distribution in the bivariate transmuted family of distributions. Distributional properties of the proposed distribution will be studied. Parameter estimation of the proposed distribution will also be discussed alongside real data application.
The bivariate transmuted Weibull distribution is obtained by using following  of Weibull distribution for X and Y

in (3). The  of bivariate transmuted Weibull (BTW for short) distribution is

The density function of the distribution is
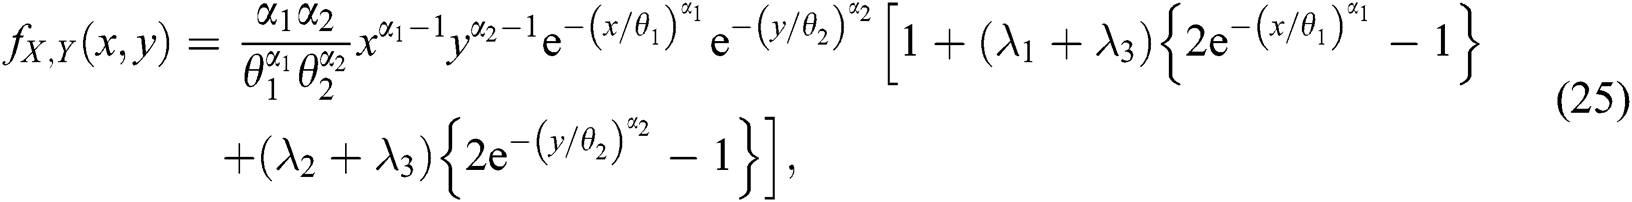
where  are scale parameters,
  are shape parameters and
  are the transmutation parameters such that all λ’s
 .
.
5 Properties of Bivariate Transmuted Weibull Distribution
In this section some statistical properties of the BTW distribution are studied.
5.1 The Marginal and Conditional Distributions
The marginal cdf’s of  and
and  are immediately written from (24) as

and

It can be easily seen that both of the marginal cdf’s are transmuted Weibull distributions. The marginal pdf’s of  and
and  are obtained from (25) as

and

The conditional  of
of  given
given  for the BTW distribution is obtained by using the density and distribution function of Weibull random variable in (9) and is

Similarly, the conditional  of
of  given
given  for the BTW distribution is obtained by using density and distribution function of Weibull distribution in (10) and is

where  and
and  . The conditional distributions are useful in obtaining the conditional moments of the distribution which will be obtained in the following subsection.
We have seen in (11) and (12) that the conditional moments for the bivariate transmuted family of distributions involve raw moments and moments of order statistics for the baseline distribution. We know that the rth raw moment and rth moment of larger observation in a sample of size 2 from Weibull distribution are, respectively, given as

and

Now using (32) and (33) in (11), the rth conditional moment of  given
given  for the BTW distribution is

Similarly, the sth conditional moment of  given
given  is
is

where  and
and  . The conditional moments are useful to obtain the conditional mean and conditional variance of the distribution.
5.3 The Product and Ratio Moments
The  th product moment for the BTW distribution are obtained by using simple moments and moments of maximum in a sample of size 2 from the Weibull distribution in (13). Now, using these moments, the expression for
  th product moment for the BTW distribution is

Again using the raw moments and moments of order statistics from Weibull distribution in (14), the  th ratio moment for the BTW distribution is obtained as

where  , b and c are defined earlier.
5.4 The Bivariate Reliability and Hazard Rate Functions
The bivariate reliability function of  and
and  can be obtained by using (15). The expression for bivariate reliability function for the BTW distribution is

Now using the bivariate density function (25) and bivariate reliability function (38) in (16), the bivariate hazard rate function for the BTW distribution is obtained as

where b and c are defined earlier. The plots of bivariate hazard rate function for  and
and  at varios combinations of
  and
and  are given in Fig. 1 below.

Figure 1: Hazard rate function of bivariate transmuted Weibull distribution
We can see that the distribution has decreasing hazard rate for  and has increasing hazard rate for
  . The bivariate reliability and bivariate hazard rate functions can be computed and plotted for different other combinations of the parameters.
6 Parameter Estimation for Bivariate Transmuted Weibull Distribution
In this section the maximum likelihood estimation of the parameters of BTW distribution is given. For this, let  be a random sample of size
  from the BTW distribution. The likelihood function is

The log-likelihood function is

The  of the parameters in
  are obtained by maximizing the log-likelihood function (40). The derivatives with respect to unknown parameters are


and

The maximum likelihood estimators of components of parameter vector  are obtained by equating above derivatives to zero and numerically solving the resulting equations.
In this section two real data applications of the bivariate transmuted Weibull distribution are given. We have modeled two data sets by using the BTW distribution alongside three other bivariate distributions. The distributions that we have used, for comparison, are bivariate Pseudo exponential propose by Mohsin et al. [17], bivariate Weibull propose by Hanif Shahbaz et al. [18] and Gumbel bivariate Weibull distribution. The distributions are fitted by obtaining the maximum likelihood estimates of the parameters. The maximum likelihood estimates of the model parameters are obtained by using the R-package “maxLik” [19]. In order to assess the performance of the BTW with the competing distributions the Akaike’s information criterion (AIC) and Bayesian information criterion (BIC) are computed.
7.1 Optical Data
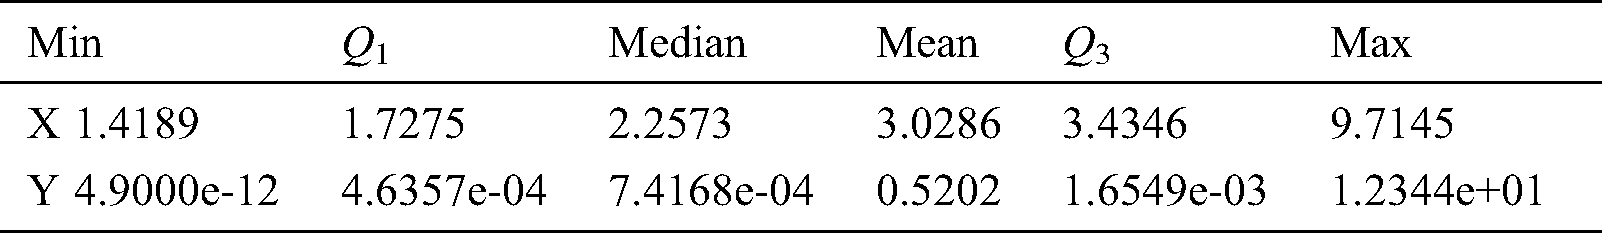
The first data set is related to abortion index. The random variable X in the data set represents the Time and random variable Y represents the Absorption Index. Tab. 1 contains the summary statistics for the data set.
Table 1: Summary statistics for optical data
The results of maximum likelihood estimates are given in Tab. 2. The computed values of AIC and BIC are given in Tab. 3. From Tab. 3, we can see that the bivariate transmuted Weibull distribution has smallest values of AIC and BIC and hence is considered as the best fit for this data.
Table 2: 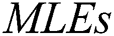 and
and  for the selected models
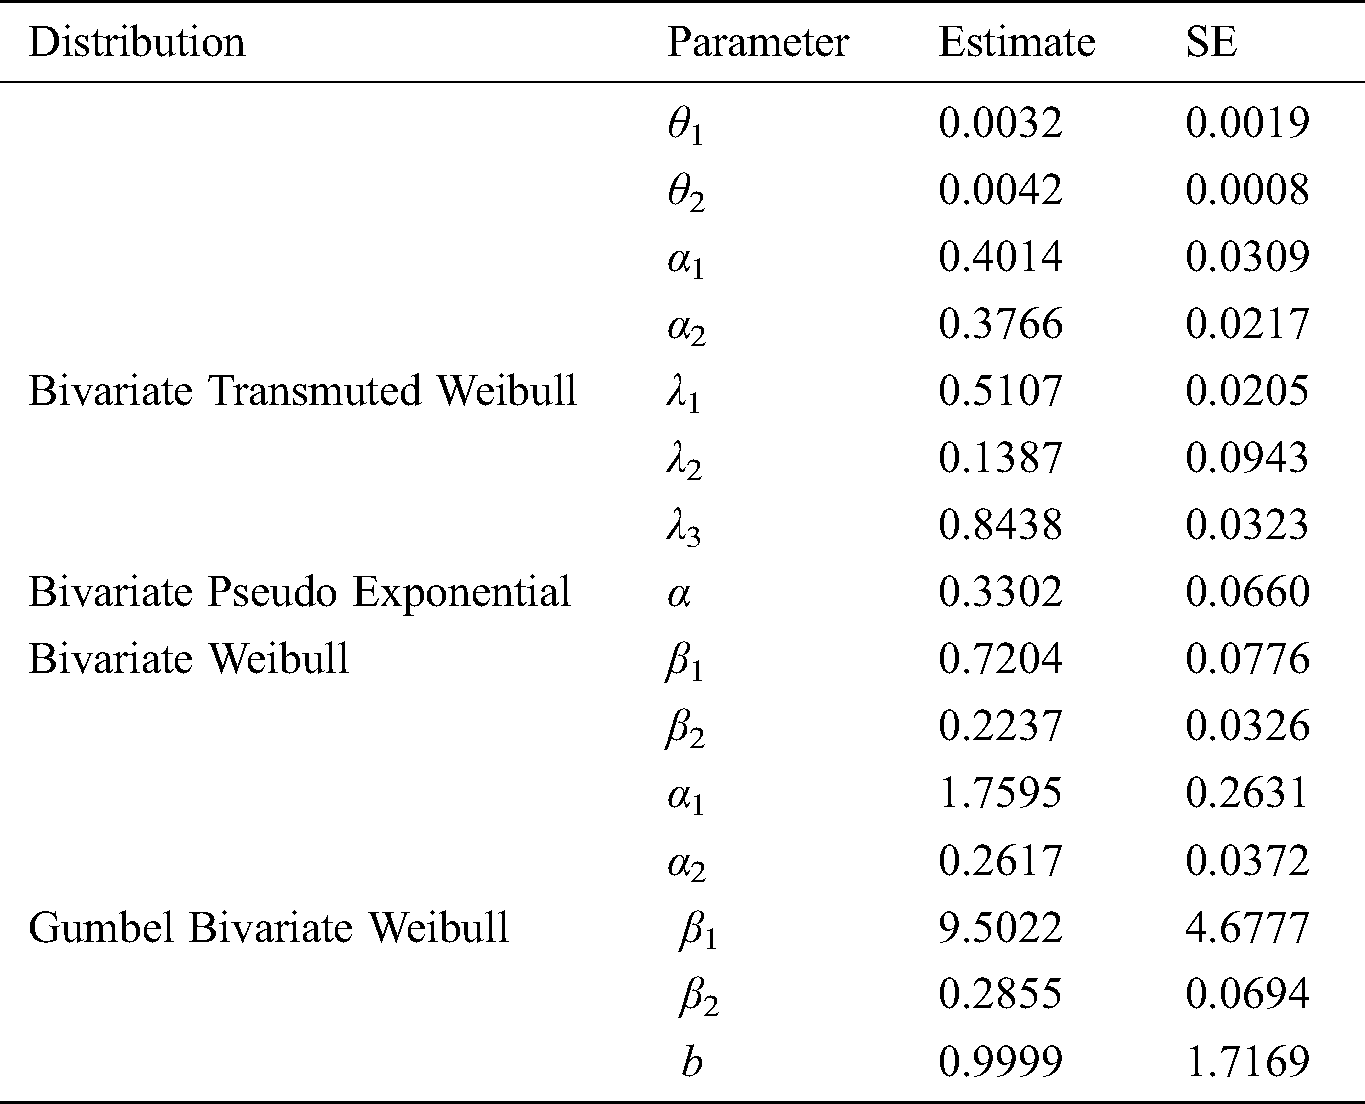
Table 3: Selection criteria for the selected models
In the second data set X represents the Light Emissions and Y represents the Dipole Blockade of atom arrays. Tab. 4 gives some descriptive statistics of the data. The results of maximum likelihood estimates are given in Tab. 5 and computed values of AIC and BIC are listed in Tab. 6. According to Tab. 6, it is obvious that the bivariate transmuted Weibull distribution is the best fit for the second data as it has the smallest values of AIC and BIC.
Table 4: Summary statistics for atom array data

Table 5: MLEs and SEs for the selected models

Table 6: Selection criteria for the selected models

In this paper we have introduced a new bivariate family of transmuted distributions. The proposed family has been studied for Weibull baseline distribution giving rise to bivariate transmuted Weibull distribution. Various properties of the proposed family and bivariate transmuted Weibull distribution have been studied. We have also applied the bivariate transmuted Weibull distribution on two real data sets. We have seen that the proposed bivariate Weibull distribution turned out to be the best fit for modeling of the data used. The proposed bivariate transmuted family of distributions can be further explored for different other baseline distributions which can be useful in modeling of complex bivariate data.
Funding Statement: The author(s) received no specific funding for this study.
Conflicts of Interest: The authors declare that they have no conflicts of interest to report regarding the present study.
1. W. T. Shaw and I. R. C. Buckley. (2007). “The alchemy of probability distributions: Beyond Gram-Charlier expansions, and a skew-kurtotic-normal distribution from a rank transmutation map,” University College London Discovery Repository. [Google Scholar]
2. A. Alzaatreh, C. Lee and F. Famoye. (2013). “A new method for generating families of continuous distributions,” METRON, vol. 71, no. 1, pp. 63–79. [Google Scholar]
3. Z. M. Nofal, A. Z. Afify, H. M. Yousof and G. M. Cordeiro. (2016). “The generalized transmuted-G family of distributions,” Communications in Statistics-Theory and Methods, vol. 46, no. 8, pp. 4119–4136. [Google Scholar]
4. Z. Afify, G. M. Cardeiro, H. M. Yousof, A. Alzaatreh and Z. M. Nofal. (2016). “The Kumaraswamy transmuted-G family of distributions: Properties and applications,” Journal of Data Science, vol. 14, pp. 245–270. [Google Scholar]
5. A. Afify, H. Yousof and S. Nadarajah. (2017). “The beta transmuted-H family for lifetime data,” Statistics and Its Interface, vol. 10, no. 3, pp. 505–520. [Google Scholar]
6. K. Jayakumar and M. Girish Babu. (2017). “T-transmuted X family of distributions,” Statistica, vol. LXXVII, pp. 251–276. [Google Scholar]
7. E. J. Gumbel. (1960). “Multivariate distributions with given margins and analytical examples,” Bulletin de l’Institut International de Statistique 37, vol. 3, pp. 363–373. [Google Scholar]
8. W. Barreto-Souza and A. J. Lemonte. (2013). “Bivariate Kumaraswamy distribution: Properties and a new method to generate bivariate classes,” A Journal of Theoretical and Applied Statistics, vol. 47, pp. 1321–1342. [Google Scholar]
9. P. G. Sankaran, N. U. Nair and P. John. (2014). “A family of bivariate Pareto distributions,” Statistica, vol. LXXIV, pp. 199–215. [Google Scholar]
10. J. M. Sarabia, P. Faustino and V. Jorda. (2014). “Bivariate beta-generated distributions with applications to well-being data,” Journal of Statistical Distributions and Applications, vol. 1, no. 15, pp. 15. [Google Scholar]
11. M. Alizadeh, F. Merovci and G. G. Hamedani. (2017). “Generalized transmuted family of distributions: Properties and applications,” Hacettepe Journal of Mathematics and Statistics, vol. 46, pp. 645–667. [Google Scholar]
12. D. F. Moore. (2016). Applied Survival Analysis Using R. Cham: Springer. [Google Scholar]
13. M. Modarres, M. P. Kaminskiy and V. Krivtsov. (2017). Reliability Engineering and Risk Analysis: A Practical Guide. Third edition, Taylor & Francis Group, UK. [Google Scholar]
14. A. P. Basu. (1971). “Bivariate failure rate,” Journal of the American Statistical Association, vol. 66, pp. 103–104. [Google Scholar]
15. W. Weibull. (1951). “A statistical distribution function of wide applicability,” Journal of Applied Mechanics, vol. 18, pp. 293–297. [Google Scholar]
16. G. R. Aryal and C. P. Tsokos. (2011). “Transmuted Weibull distribution: A generalization of the Weibull probability distribution,” European Journal of Pure and Applied Mathematics, vol. 4, pp. 89–102. [Google Scholar]
17. M. Mohsin, J. Pilz, S. Gunter, S. Hanif Shahbaz and M. Q. Shahbaz. (2010). “Some distributional properties of the concomitants of record statistics for bivariate pseudo-exponential distribution and characterization,” Journal of Prime Research in Mathematics, vol. 6, pp. 32–37. [Google Scholar]
18. S. H. Shahbaz, M. Al-Sobhi, M. Q. Shahbaz and B. Al-Zahrani. (2018). “A new multivariate Weibull distribution,” Pakistan Journal of Statistics and Operation Research, vol. 14, no. 1, pp. 75–88. [Google Scholar]
19. A. Henningsen and O. Toomet. (2011). “maxLik: A package for maximum likelihood estimation in R,” Computational Statistics, vol. 26, no. 3, pp. 443–458. [Google Scholar]
 | This work is licensed under a Creative Commons Attribution 4.0 International License, which permits unrestricted use, distribution, and reproduction in any medium, provided the original work is properly cited. |