DOI:10.32604/csse.2021.014495
| Computer Systems Science & Engineering DOI:10.32604/csse.2021.014495 | |
| Article |
Efficient Anti-Glare Ceramic Decals Defect Detection by Incorporating Homomorphic Filtering
1Southeast Digital Economic Development Institute, Quzhou, 324000, China
2School of Mechanical and Electronic Engineering, Jingdezhen Ceramic Institute, Jingdezhen, 333400, China
3School of Data and Computer Science, Sun Yat-Sen University, Canton, 510000, China
*Correspondence Author: Junxiang Wang. Email: wjx851113851113@163.com
Received: 23 September 2020; Accepted: 17 November 2020
Abstract: Nowadays the computer vision technique has widely found applications in industrial manufacturing process to improve their efficiency. However, it is hardly applied in the field of daily ceramic detection due to the following two key reasons: (1) Low detection accuracy as a result of ceramic glare, and (2) Lack of efficient detection algorithms. To tackle these problems, a homomorphic filtering based anti-glare ceramic decals defect detection technique is proposed in this paper. Considering that smooth ceramic surface usually causes glare effects and leads to low detection results, in our approach, the ceramic samples are taken in low light environment and their luminance and details restored by a homomorphic filtering based image enhancement technique. With relatively high quality preprocessed images, an effective ceramic decal defect detection algorithm is then designed to rapidly locate those out-of-bounds defects and further estimate their size. The experimental results show that the proposed scheme could achieve its desired performance.
Keywords: Ceramic glaring; homomorphic filtering; ceramic decal border extraction; out-of-bounds detection
In general, traditional ceramic production has several disadvantages, such as low ductility, special production architecture, and uncontrolled quality of batch production, among others. During the ceramic production process, most existing daily ceramic detection techniques depend on manual operation, which leads to several problems, i.e., low efficiency, high-labor intensity, unstable products quality and high error rate.
Recently, Non-Destructive Testing (NDT) technique [1–4] has been developed. Most approaches, e.g., ultrasonic detection, radiographic detection, eddy current detection, penetration detection and magnetic particle detection, are already developed. Among them, ultrasonic detection and radiographic detection are used to detect the defect inside the object according to the result of reflection and transmission of sound waves or rays on objects. The eddy current detection, penetration detection and magnetic particle detection utilize other features, i.e., induction eddy distribution, permeability characteristics, and leakage magnetic filed, to detect those object surface defects. However, the above-mentioned detection techniques are employed for object structural defect detection and should be cautiously chosen according to the detected object material. In addition, the out-of-bounds defect of ceramic decals is an appearance defect rather than a structural defect, which is not suitable for the above mentioned ways.
With the rapid development of computers, machine vision detection technique [5,6] has developed as a high-precision NDT, which could save human labor costs, improve productive automation [7–9] and achieve quality tracking [10,11]. However, the technique has not been widely applied to the ceramic industry, especially in the field of daily ceramics. Based on our best knowledge, just the paper [12] and our previously published paper [13] proposed a roundness detection algorithm for daily ceramics. Evidently, during the daily ceramics based NDT process, glare phenomenon is a significant factor to hinder the application of machine vision detection technique due to its glaze surface. It might cause some blurry areas in the image, leading to inaccurate detection results. In addition, some special defects exist in the daily ceramic production, such as the out-of-bounds defect of ceramic decals, which could not be effectively resolved by the current detection algorithms.
Based on the above analysis, how to effectively solve both glare and out-of-bound decal defect detection problems are significant for daily ceramics. Therefore, our manuscript is proposed. The contributions of this paper should be summarized as follows:
(1) An effective daily ceramic anti-glare technique is proposed, which acquires some images under low light environment, and then employ a specially designed homomorphic filtering technique to increase its luminance and meanwhile maintain their details. (2) Based on above recovered images without glare phenomenon, a novel decal defect detection algorithm is developed, which could rapidly locate the out-of-bound defect and further estimate their size.
The rest of this paper is organized as follows. Our proposed algorithm is presented in Section 2. Experiment results and discussions are listed in Section 3. Conclusions are offered in Section 4.

Figure 1: The chart of ceramic detection process
As shown in Fig. 1, a homomorphic filtering based anti-glare ceramic out-of-bound defect defection algorithm is proposed in this paper. As shown in Fig. 1, the algorithm includes two modules: (1) Image enhancement. Ceramic images are sampled under low light circumstance to avoid glare phenomenon. However, it might cause blurry areas. Therefore, the homomorphic filtering-based image enhancement technique is employed to restore the luminance and details. (2) Defect detection. The detection algorithm includes the following steps, i.e., decal border extraction, indicative curve design, defect determination and defect size estimation. Both modules are described detailedly as follows.

Figure 2: Sampling image with glare

Figure 3: Sampling image in low light circumstance
2.2 Module1—Homomorphic Filtering Based Anti-Glare Image Enhancement Technique
2.2.1 The Advantage of Homomorphic Filtering
As shown in Fig. 2, ceramic sampling image obtained in strong light circumstance might cause glare phenomenon due to its glaze surface. Therefore, those ceramic sampling images are captured in low light circumstance. However, this would cause low contrast and some indistinct details, as shown in Fig. 3.
As shown in Fig. 3, those images should be pre-processed to improve their visual quality. In general, both requirements should be met. Firstly, the dark background is desired to be unchanged since no ceramic defects are included in it. Secondly, other ceramic areas (except the dark background) should be enhanced to improve those details, which facilitates subsequent ceramic defect detection.
The pre-processing stage is performed with homomorphic filtering technique [14–16] and the process is mentioned as follows. In general, it is considered that a pixel gray value in one image is composed of two components, i.e., irradiation component and reflection component as shown in Eq. (1), where irradiation component represents slow change and corresponds to the low-frequency element and luminance information. While the reflection component is denoted as the sharp variation and means high-frequency elements and detail information. Therefore, to satisfy above-mentioned both requirements, those components should be discriminatively treated, such as the reflection component is desired to be enhanced to intensify those ceramic details and the irradiation component might be unchanged to keep the background information.
In this paper, the homomorphic filtering technique is employed to meet above requirements and discriminatively treat variable components. Specific algorithm is described as follows.
2.2.2 Homomorphic Filtering Process
In the subsection, a homomorphic filtering based anti-glare scheme for daily ceramics is designed. Among the scheme, a transfer function is involved and its parameters should be optimized. The process is mentioned as follows.
Step 1: Suppose a pixel  in the spatial domain based image could be composed of two components, i.e., irradiation component
  and reflection component
  .
.

where  and
and  present the horizontal and vertical coordinates of one image respectively.
Step 2: Separate both components, i.e.,  and
and  by using Logarithmic operations on Eq. (1).

where  .
.
Step 3: Perform Fourier transform on Eq. (2) and obtain their elements in the frequency domain.

Step 4: Construct a frequency domain-based transfer function  to acquire

Step 5: Through the inverse Fourier transform, some processed components in the spatial domain, i.e.,  , are obtained as follows.

Step 6: Then,

Finally, Eq. (6) could be represented as

where  , respectively.
According to above steps, original image  could be operated to be the enhanced image
  .
.
2.2.3 Transfer Function Design and Parameters Optimization
During above-mentioned process, the enhanced image visual quality mainly depends on the specially designed transfer function  in Step 4. Therefore, to achieve desired enhanced anti-glare images, those parameters in
  should be optimized. Firstly, based on our requirements, the design of transfer function
  in homomorphic filtering process could refer to the traditional high pass filtering transfer function [17] as shown in Fig. 4a. However, traditional high pass filtering technique is generally used to weaken low-frequency and keep high-frequency unchanged. While our designed homomorphic filtering technique is designed to keep low frequency unchanged and enhance the high frequency. Therefore, the high pass filtering transfer function should be adjusted as shown in Fig. 4b.
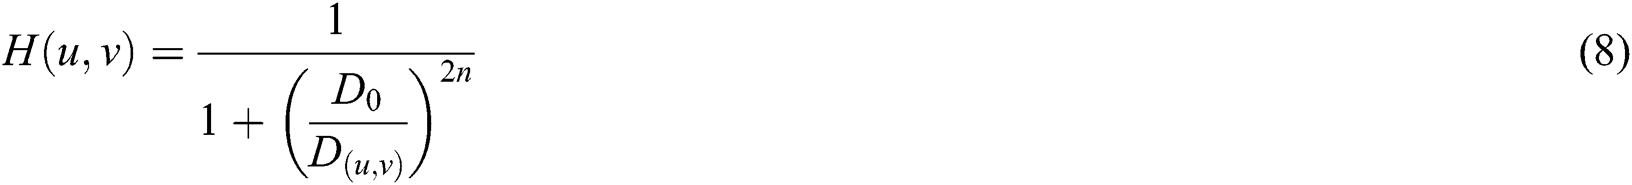
As shown in Fig. 4a, traditional Butterworth high pass filtering transfer function is designed as follows:
Transfer function  in homomorphic filtering process could be designed as follows and shown in Fig. 4b.
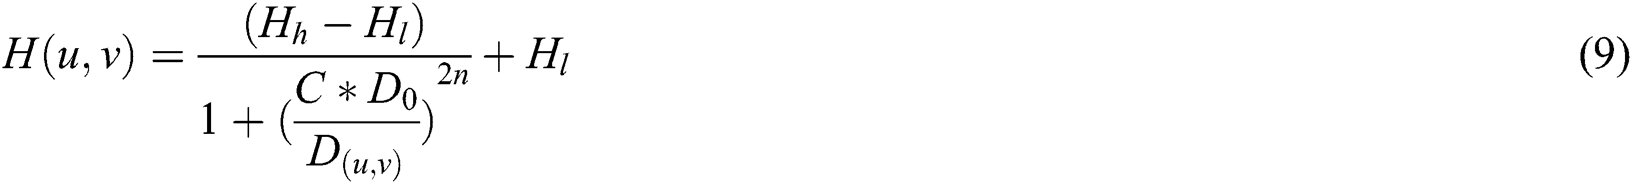
where  is the high-frequency weight to indicate the enhanced effect for high-frequency;
 is the low-frequency weight to denote the weaken effect for low-frequency;
  is the sharpening coefficient.
  is pre-defined threshold to distinguish those low-frequency and high-frequency. In order to achieve desired performance, these parameters in Eq. (9) should be optimized. In general, to strengthen the details,
  is set as
  . To maintain background unchanged,
 is set as
 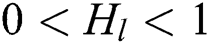 and slightly less than 1. In addition, to enhance the luminance of ceramic part,
  is generally set to be a small value.

Figure 4: Comparison between different transfer functions (a) Butterworth high pass filter transfer function; (b) transfer function in homomorphic filtering process
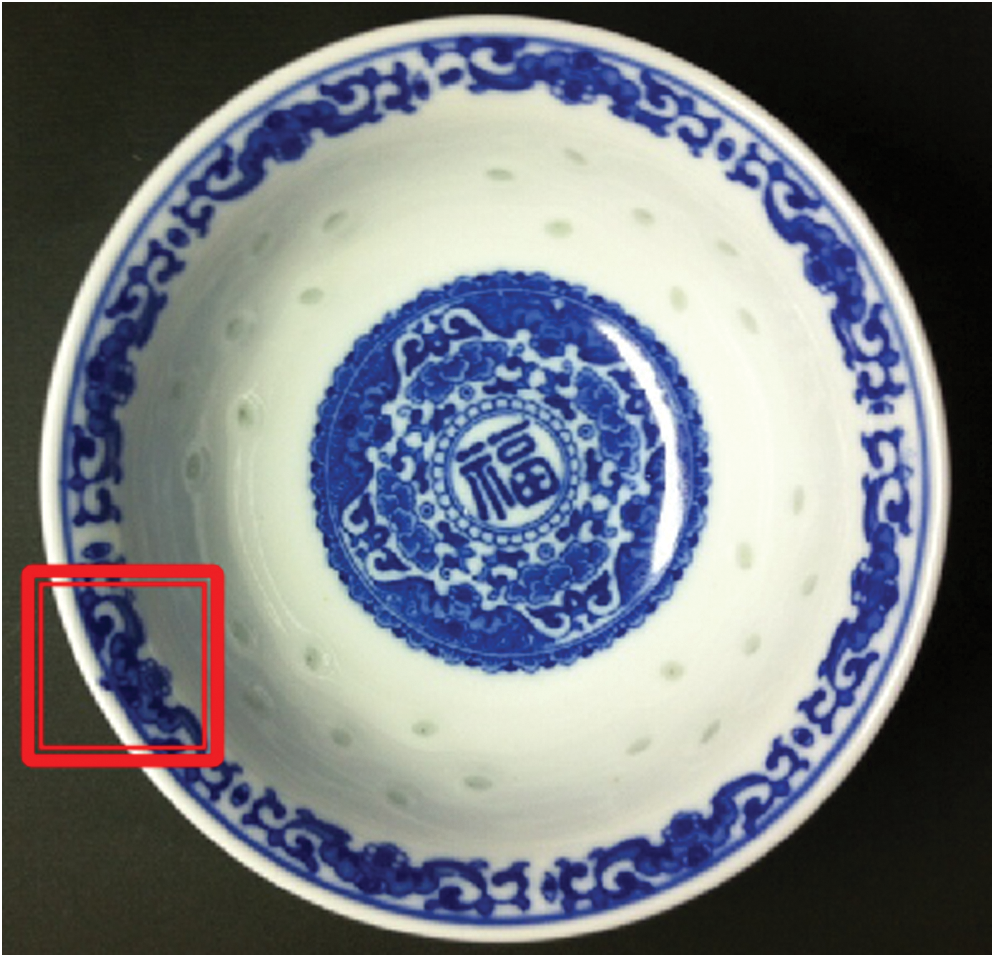
Figure 5: An example of out-of-bound defect in daily ceramic
2.3 Module2—Ceramic Decal Out-of-Bound Detection
Based on the anti-glare image by using homomorphic filtering technique, ceramic decal defect detection algorithm is given in this section to determine those out-of-bound defects as shown in Fig. 5 and then estimate their sizes. Details are described as follows.
2.3.1 Ceramic Decal Region Extraction
In general, decal ceramics have two boundaries, i.e., the outermost boundary and the second outer boundary as shown in Fig. 6a, and the out-of-bound defect is normally located at the second outer boundary. To detect those defects, it needs to firstly extract the second outer boundary. Based on the idea, a residual based second outer boundary extraction algorithm is proposed and described as follows.
(1) To highlight these boundaries in an image, the binarization operation is performed. Among it, a binarization threshold T is calculated as follows.

where  is the pixel gray value,
  are the width and length of the given image respectively. The parameter
  is set to be 1.25.
After binarization process, the outermost border and the second outer border of the image are stood out as shown in Fig. 6a.
(2) Performing the filling operation based on the outermost border to remove those inner details as shown in Fig. 6b.
(3) By subtracting the binarization image from the filling image, a residual image is acquired to highlight the second outer border as shown in Fig. 6c.
(4) Based on the similar filling operation for Fig. 6c, those inner details in the second outer border of the residual image are covered as shown in Fig. 6d. Then a typical boundary extraction operator, i.e., Canny operator, could be employed to extract the second outer border, namely the decal border, as shown in Fig. 6e.
Figure 6: The process of ceramic decal border extraction (a) ceramic binarization image; (b) binarization filling image; (c) residual image; (d) residual filling image; (e) decal border
2.3.2 Decal Defect Detection for Out-of-Bound Defect
Based on the extracted decal border image as shown in Fig. 6e, namely the second outer border, a decal defect detection technique is proposed to locate the out-of-bound defect and then estimate its size. The process includes several steps: (1) Determine the circle center. (2) Design indicative curves. (3) Locate the decal out-of-bound defect (4) Estimate its size.
1. Determine the Circle Center
For the second outer border with a circular contour, a novel circle center determination algorithm is proposed as follows. Firstly, randomly select three points on the circular contour, and then collect their horizontal and vertical coordinates in the image, denoted as  . Based on those three coordinates, the triangular circumcenter is determined, denoted as
  ,
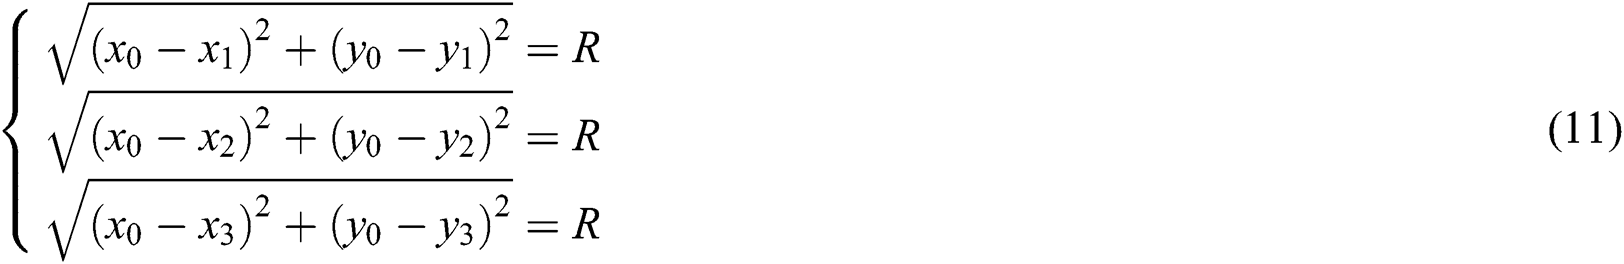
, . Evidently, if the ceramic second outer border is a standard circle, the triangular circumcenter is just the circle center. According to the principle that distances from the circle center to points on the circle edge are identical, the circle center coordinates could be calculated by
Apparently, the special cases, i.e., non-standard circular contour, might cause inaccurate circle center, which have been discussed in our previous work [11].
2. The Design of Indicative Curve
a) Radius Curve
Based on the calculated circle center coordinates 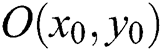 , employ
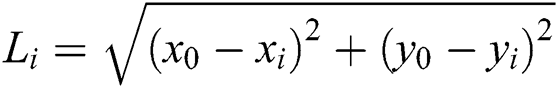 to generate the radius array, denoted as
 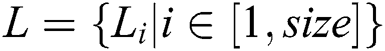 ,where size means the number of points in the second outer border. Then those elements in
  are utilized to draw a curve, denoted as radius curve.
As shown in Fig. 7, it is observed that some out-of-bound defects on the circular border will cause sudden mutation, which guides our defect detection. If the decal border is a standard circle, it is obvious that the radius curve should be a straight line. However, current ceramic industrial technique could not produce the ceramics with ideal circular decal border, which would cause unstable trend on the curve, as shown in Fig. 7. In addition, digital operations in the image acquisition device would cause jagged decal border, which could cause local dithering on the curve. Above interference might cause inaccurate defect detection. In the paper, the radius residual is introduced in the next subsection to restrain those undesired interference.
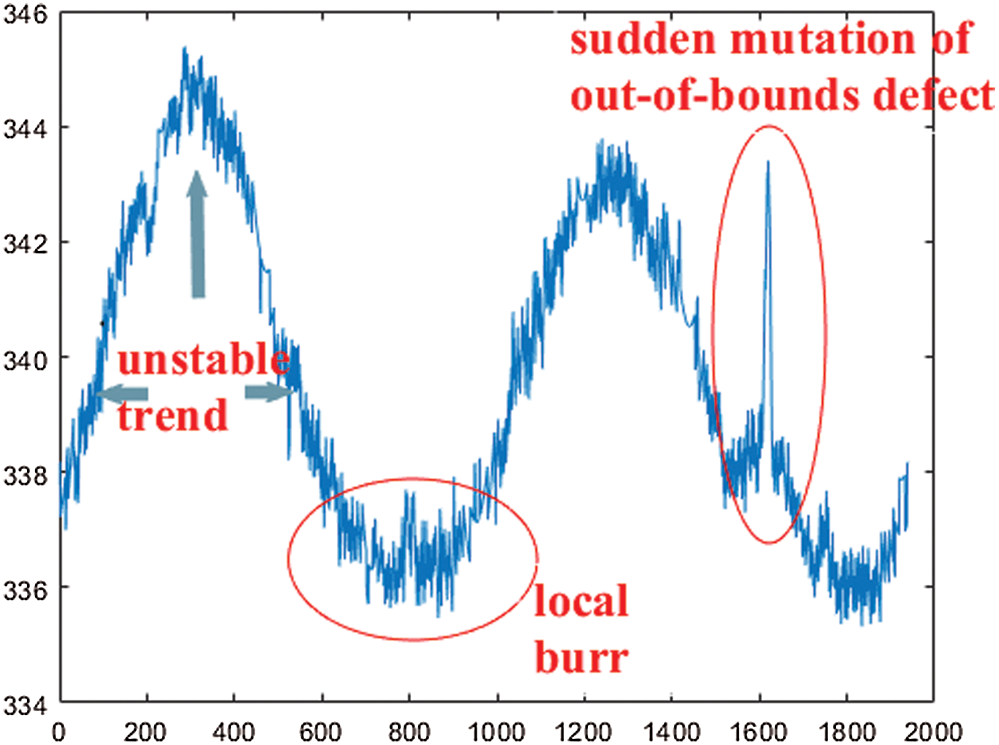
Figure 7: Radius curve
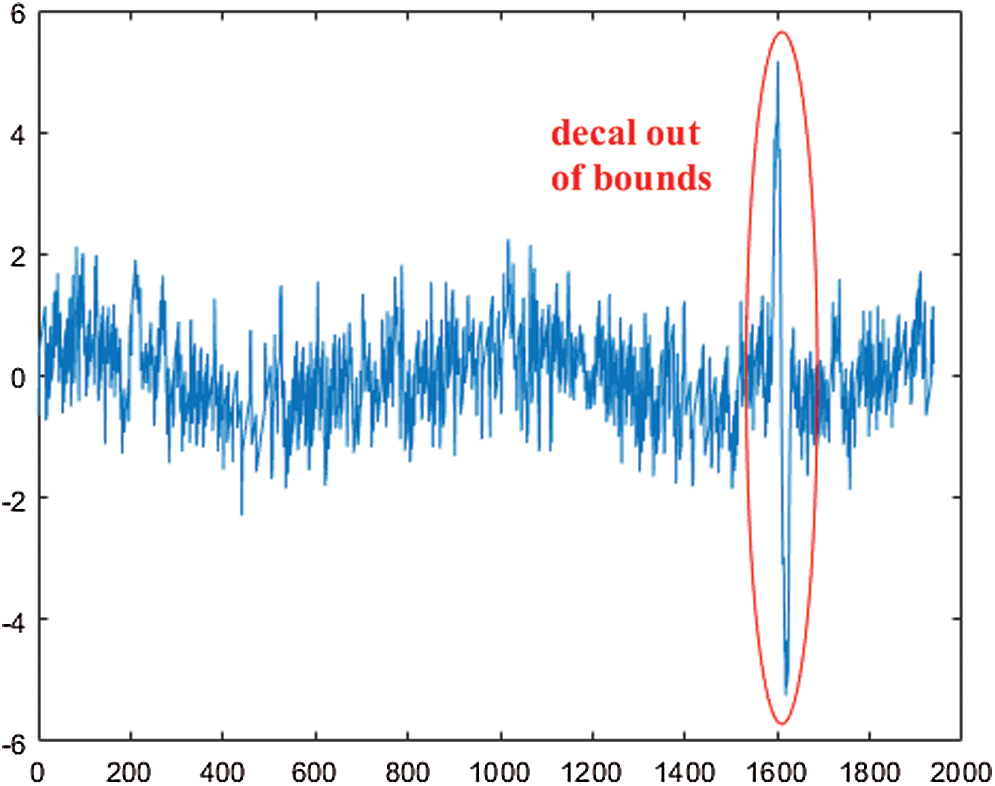
Figure 8: Radius residual curve
(b) Radius Residual Curve
To reduce those interference, i.e., overall unstable trend and local dithering for the radius curve, and meanwhile emphasize the sudden mutation for the out-of-bound defect, radius residual array is defined as  and calculated by

where  presents the length of adjacent chosen points.
 denotes the number of boundary points. According to those elements in
  , the curve is drew as shown in Fig. 8 and denoted as radius residual curve. Due to strong correlation between those adjacent elements in array L, the unstable trend and local dithering in radius residual curve can be efficiently restrained by Eq. (12). Meanwhile, the sudden mutation is emphasized.
(c) Radius Residual Exponential Curve
From Fig. 8, it is observed that some slight residual local dithering also exists, which might interfere the decal out-of-bound defect location and its size estimation. Consequently, an improved radius residual curve, namely radius residual exponential curve, is introduced to further limit those local dithering. In addition, since exponential operation could enlarge the difference between normal areas and sudden mutation one, radius residual exponential curve could further emphasize those decals out-of-bound defect location. The radius residual exponential curve is calculated by

where superscript  represents the power of radius residual curve.
When  and
and  , the corresponding radius residual exponential curves are drawn in Fig. 9. Apparently, with the increase of
  , sudden mutation is better emphasized.
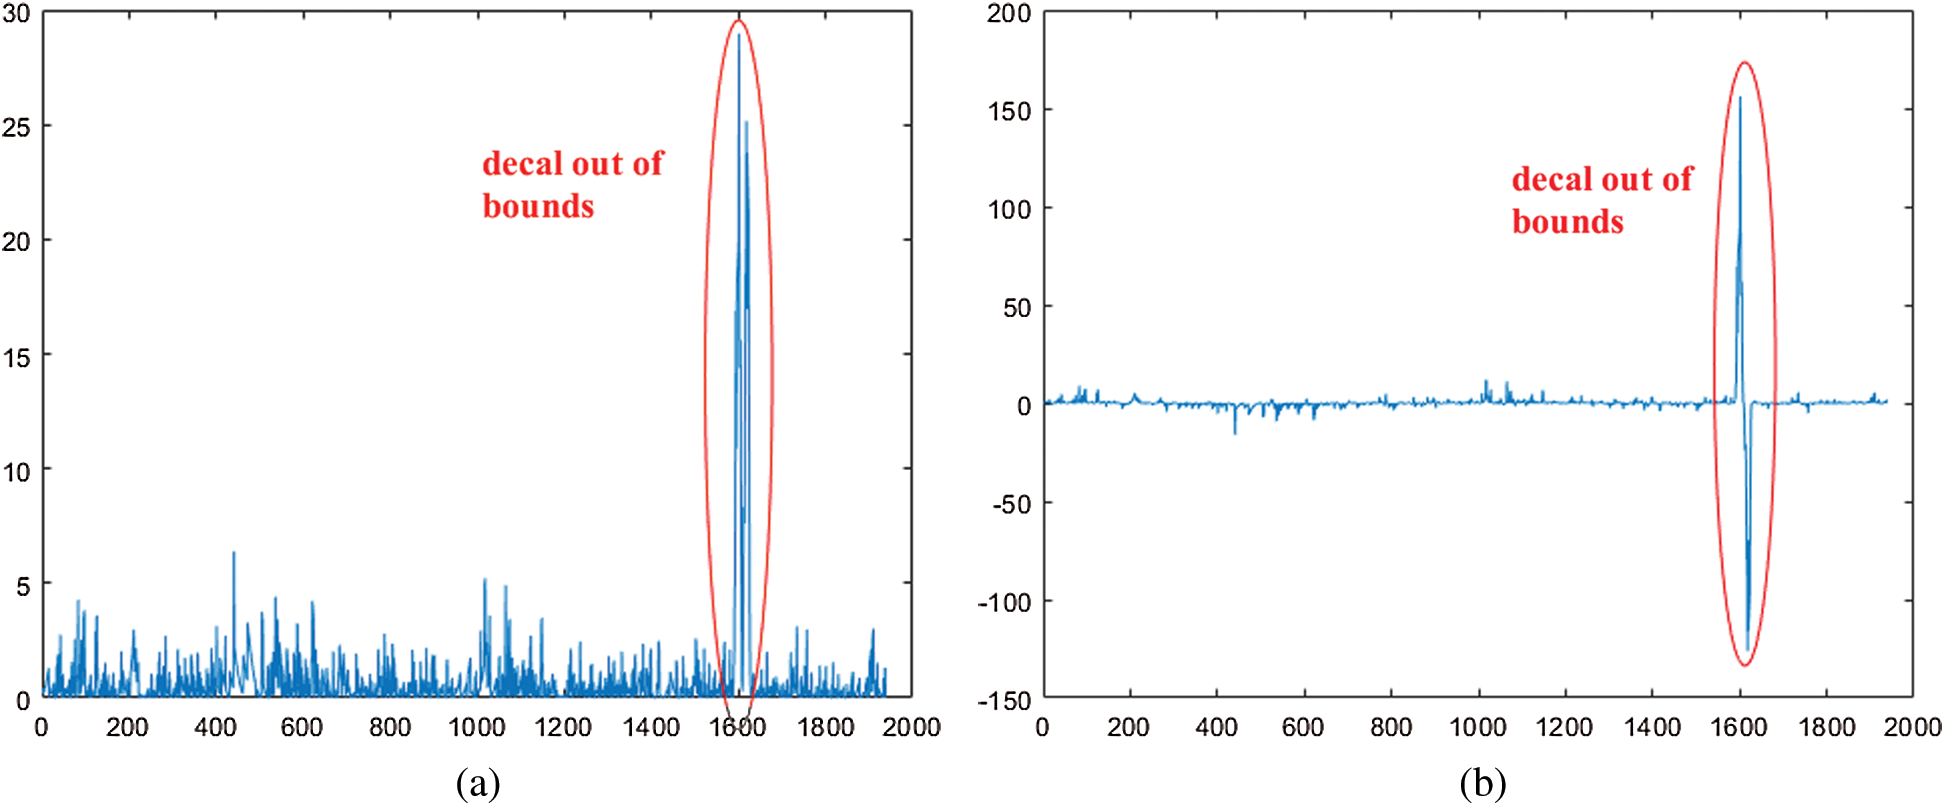
Figure 9: Radius residual exponential curve (a)  ; (b)
; (b) 
3. Decal Out-of-bound Defect Location
Both kinds of radius residual exponential curves are provided to indicate different cases respectively, i.e., with the out-of-bound defect and without out-of-bound defect, as shown in Fig. 10. It is known that some concentrated pulses mean the sudden mutation and indicate the case with decal out-of-bound defect. By contrast, disperse pulse denotes the case without decal out-of-bound.
Based on the idea, we calculate the maximum value of radius residual exponential array  , denoted as
  . Then those coordinates which are larger than
  in array
  are recorded to construct an array
  and denoted as pulse coordinate array.

Later, the differences of adjacent elements in array  are calculated to construct one array
  and denoted as pulse coordinate difference array.

When the number of those elements which are smaller than a preset threshold  in
in  is larger than 80% of the number of
  , it is considered that there are out-of-bound defects in the concentrated pulse regions. Otherwise the defect does not exist.
Above process could be utilized repeatedly to indicate multiple defects.

Figure 10: Different kinds of radius residual exponential curves (a) with out-of-bound defect; (b) without out-of-bound defect
4. Size Estimation for Decal Out-of-bound Defect
If the out-of-bound defect size estimation is operated on radius curve, the width of the defect could be measured by using the distance between the start horizontal coordinate and the end one in the defect region as shown in Fig. 11a. Meanwhile, the height of the defect could be calculated by the difference between the maximum and minimum of vertical coordinates in the defect area. Due to unstable trend and large local dithering in radius curve, those coordinates could not be easily determined and thus the size estimation result could be interfered. To achieve better performance, the size could be estimated in radius residual curve.
As show in Fig. 11b, in the radius residual curve, the width of out-of-bound defect is similarly calculated by using the distance between the start horizontal coordinate and the end. However, the sudden mutation corresponding to the out-of-bound defect will generate two symmetrical pulses, i.e., positive peak  and negative peak
  . In the case, the height of out-of-bound defect could be approximately expressed as
  . It is noted that the similar operation could be employed in the radius residual exponential curve.

Figure 11: Sketch map for size estimation (a) size estimation in radius curve; (b) size estimation in radius residual curve
To verify the efficiency of proposed algorithm, some experimental results are provided.
3.1 The Effectiveness of Homomorphic Filtering Technique
To avoid glare phenomenon, a ceramic bowl image is gained under low light circumstance as shown in Fig. 12a. It is clear that the image with low luminance would cause some indistinct details. Therefore, the proposed homomorphic filtering technique is employed to implement enhancement operation to restore luminance and details. Now, both kinds of different enhancement operations, i.e., proposed homomorphic filtering technique and traditional spatial-domain histogram equalization scheme, are performed for comparison to verify the superiority of our proposed scheme. The results are listed in Figs. 12b and 12c, respectively. It is observed that proposed homomorphic filtering technique achieves better visual quality. The reason is that homomorphic filtering technique could perform an adaptive enhancement for different regions in the image. For example, the background part is kept unchanged, and the detailed ceramic part is enhanced without anti-glare phenomenon.

Figure 12: The effectiveness of homomorphic filtering technique (a) Image captured in low light. (b) Image enhancement with homomorphic filtering technique. (c) image enhancement with histogram equalization algorithm
3.2 Analysis of Decal Out-of-Bound Defect Detection
To determine the out-of-bound defects, the second outer border (decal border) should be completely extracted from the ceramic. As shown in Fig. 5, proposed scheme could exactly extract the second outer border. Then the efficiency of proposed defect detection algorithm is further verified as follows.
As shown in Fig. 13, two kinds of samples and correspond radius residual exponential curves are listed to indicate different situations, i.e., without out-of-bound defect and with out-of-bound defect respectively.
It is observed that one ceramic sample without out-of-bound defect generates a radius exponential curve with disperse pulse, as shown in Fig. 13a. In comparison, as shown in Fig. 13b, the radius residual exponential curve for a ceramic sample with out-of-bound defect leads to the concentrated pulse and the sudden mutation caused by defect is apparent. The phenomenon verifies our conclusion as mentioned in Section 2.3.2-(3).
Finally, according to the number of elements which are smaller than the threshold  in
in  , it is easy to determine adaptively the out-of-bound defects. In addition, if the out-of-bound defects exist, their size could be estimated by using above proposed algorithm in Section 2.3.2-(4).
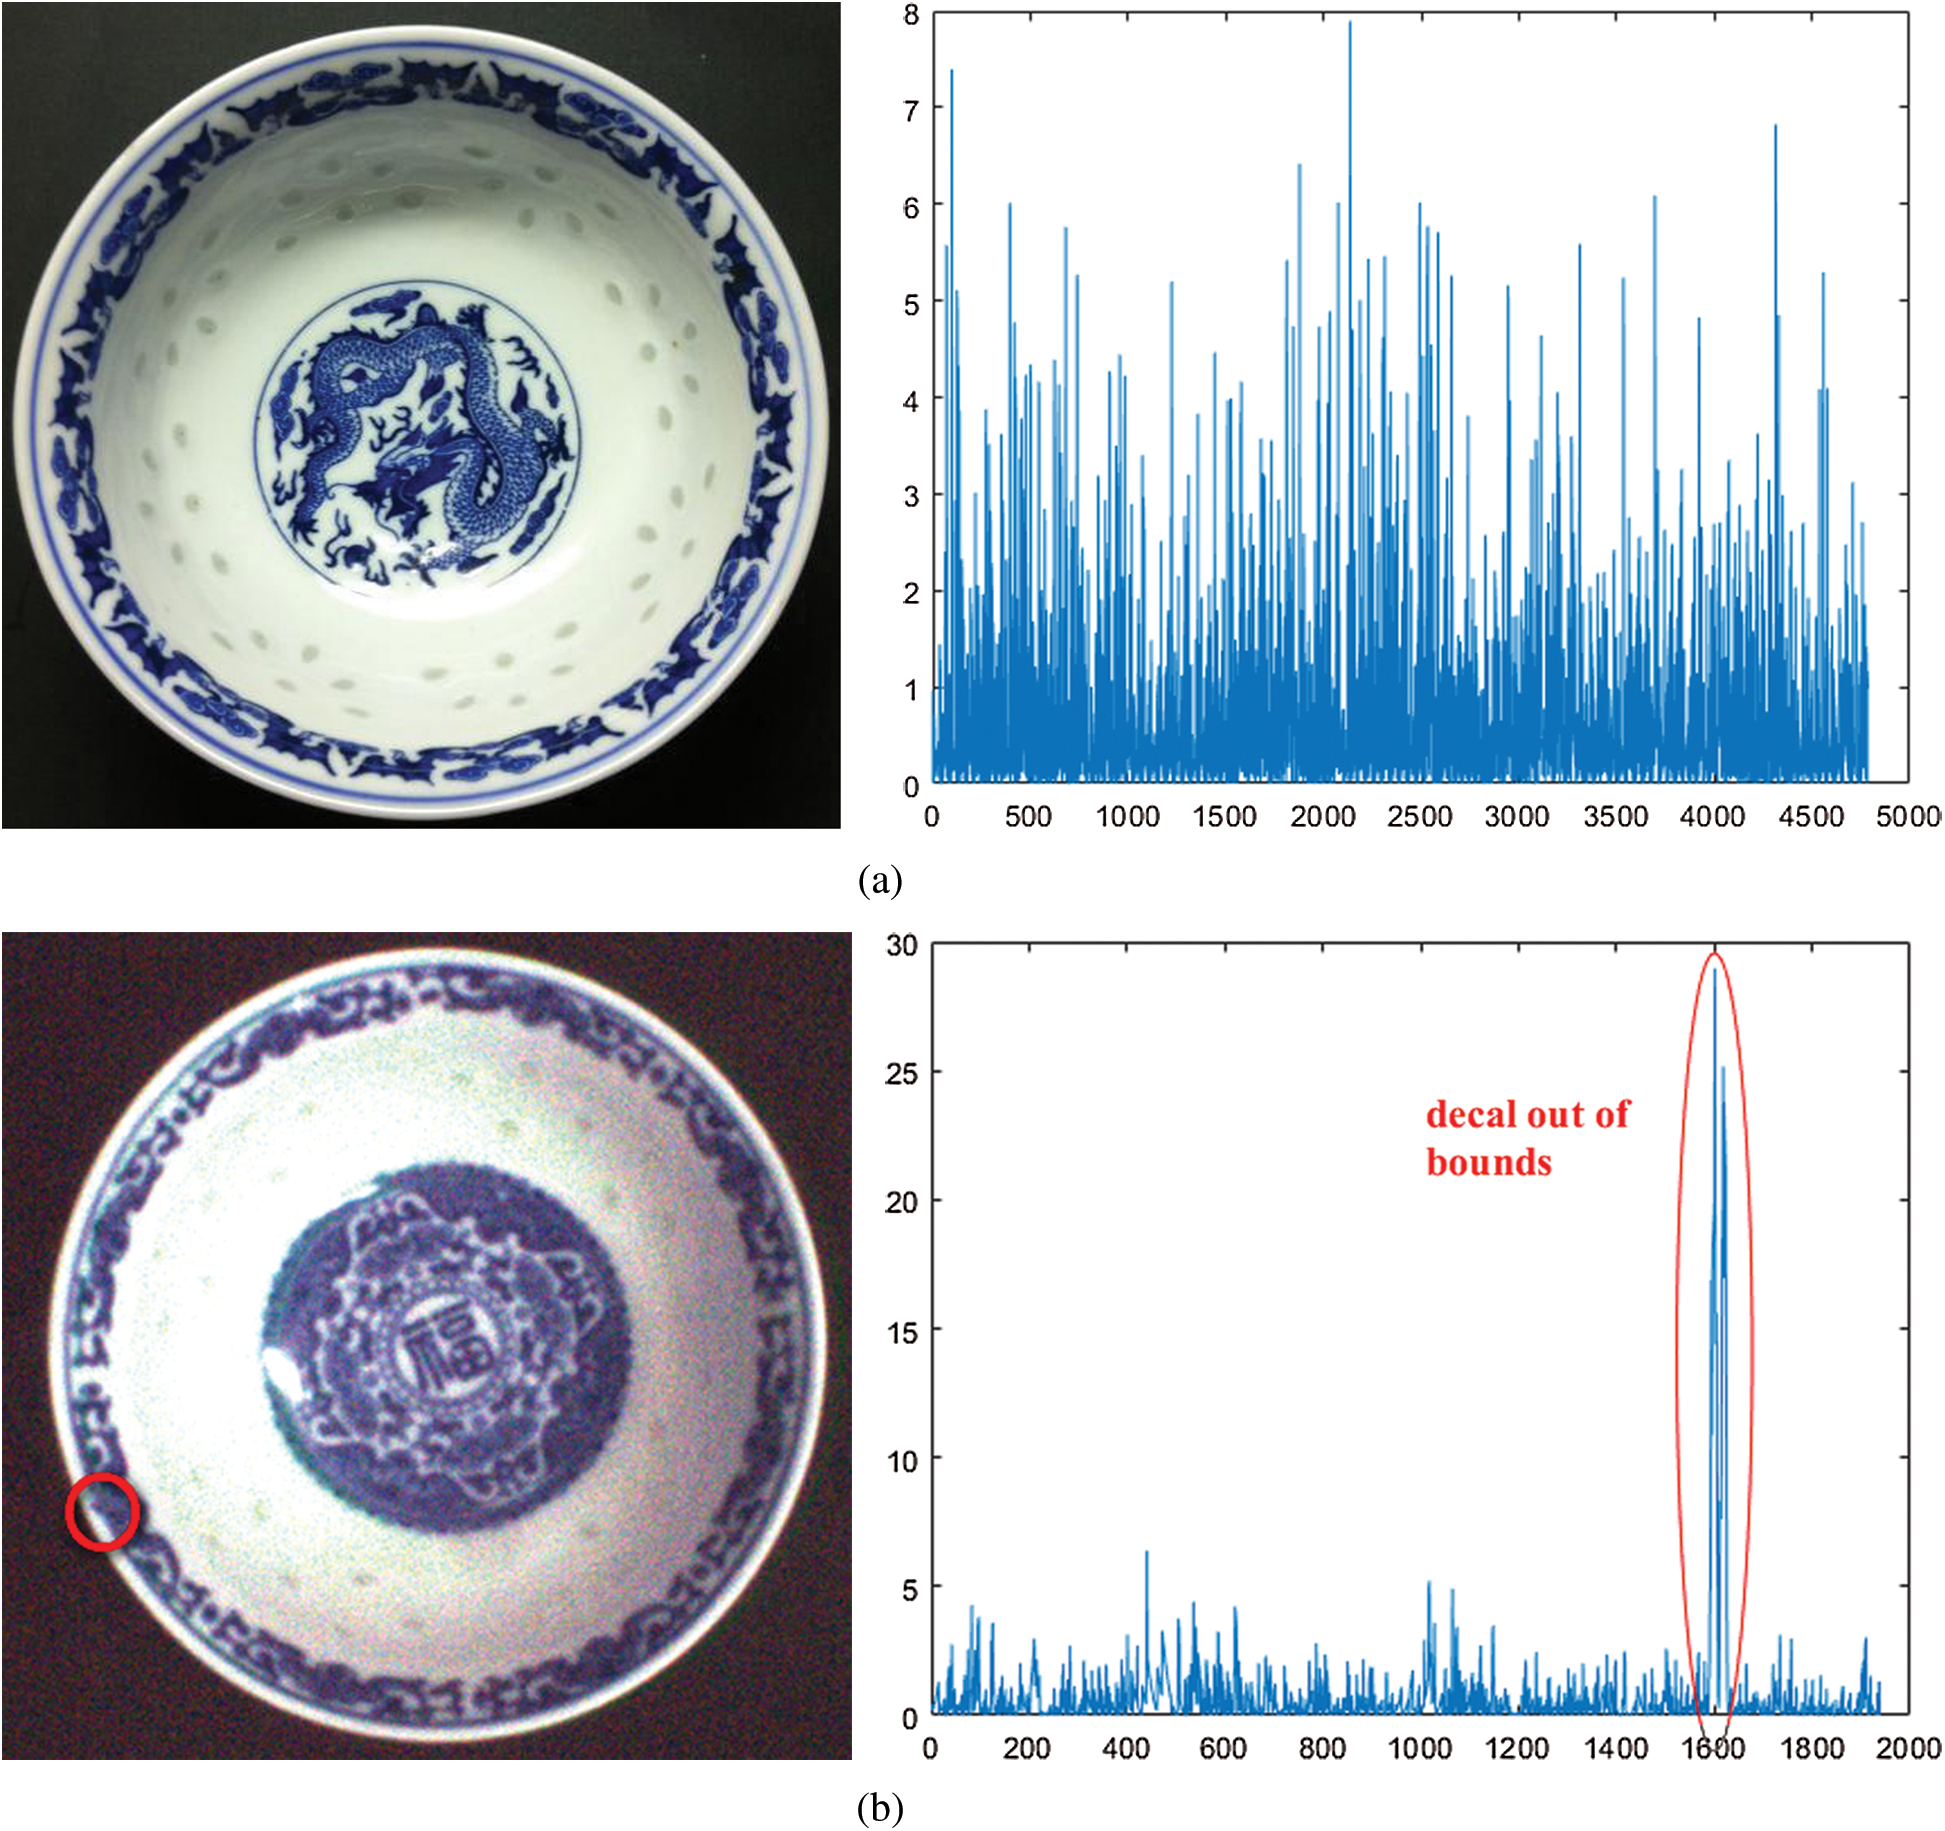
Figure 13: Analysis of decal out-of-bound defect in different cases (a) without the out-of-bound defect; (b) with the out-of-bound defect
3.3 Execution Time and Efficiency
Table 1: The out-of-bound defect detection accuracy
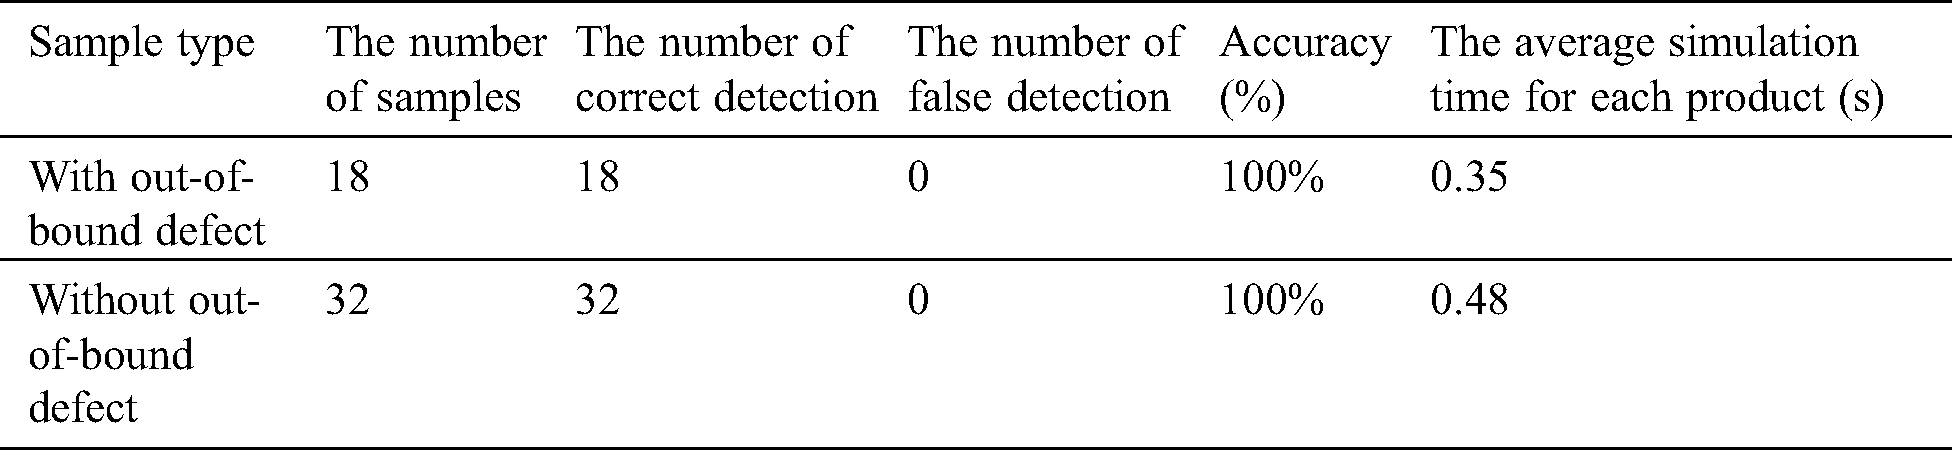
To further verify the accuracy of our proposed decal out-of-bound defect detection algorithm, its efficiency is testified. In this subsection, 1000 samples are chosen and tested by proposed defect detection algorithm. For the involved schemes, we implement the scheme with Matlab on 2.30 and 2.29 GHz Intel Xeon Gold 5118 dual core CPU with 64 GB memory. Experimental results are listed in Tab. 1. It is observed that our proposed algorithm could achieve high accuracy and affordable execution time, which demonstrates its practicability.
In the paper, an anti-glare decal out-of-bound defect detection algorithm is proposed. It includes two modules, i.e., image enhancement and defect detection. It is required that ceramic image is sampled under low light circumstance to avoid glare phenomenon and then employed homomorphic filtering to adaptively enhance the ceramic images. In addition, a detection algorithm is designed to determine the decal out-of-bound defect and further estimate its size. The experimental results demonstrate its effectiveness and practicability.
Funding Statement: This work was partly supported by the Science and Technology Projects, Quzhou City, China (2019K12, X. Chen, www.qz.gov.cn) and National Natural Science Foundation of China (61762054 and 62062044, X. Chen).
Conflicts of Interest: The authors declare that they have no conflicts of interest to report regarding the present study.
1. S. Gholizadeh. (2016). “A review of non-destructive testing methods of composite materials,” in XV Portuguese Conf. on Fracture, PCF, Pao de Arcos, Portugal, pp. 50–57. [Google Scholar]
2. S. Zhang, B. Ducharne and T. Uchimoto. (2020). “Simulation tool for the eddy current magnetic signature (EC-MS) non-destructive method,” Journal of Magnetism and Magnetic Materials, vol. 53, no. 1, 167221. [Google Scholar]
3. K. D. Sandeep, V. Manish and A. Prof. (2017). “Advances and researches on non destructive testing: A review,” in 7th Int. Conf. of Materials Processing and Characterization, Indore, India, pp. 3690–3698. [Google Scholar]
4. H. Rimond, C. Christophe and D. Christophe. (2014). “Eddy-current non-destructive testing system for the determination of crack orientation,” NDT & E International, vol. 61, no. 1, pp. 24–28. [Google Scholar]
5. E. Zancul, H. O. Martins, F. P. Lopes and F. A. T. V. da Silva Neto. (2020). “Machine vision applications in a learning factory,” Procedia Manufacturing, vol. 45, no. 1, pp. 516–521. [Google Scholar]
6. L. Louw and M. Droomer. (2019). “Development of a low cost machine vision based quality control system for a learning factory,” Procedia Manufacturing, vol. 31, no. 1, pp. 264–269. [Google Scholar]
7. C. Boukouvalas, J. Kittler, R. Marik and M. Petrou. (1997). “Automatic color grading of ceramic tiles using machine vision,” IEEE Transactions on Industrial Electronics, vol. 44, no. 1, pp. 132–135. [Google Scholar]
8. T. H. Keser and H. Željko. (2010). “Intelligent machine vision system for automated quality control in ceramic tiles industry,” Strojarstvo, vol. 52, no. 1, pp. 105–114. [Google Scholar]
9. K. Khalili, M. Bagherian and S. Khisheh. (2014). “Numerical simulation of drying ceramic using finite element and machine vision,” Procedia Technology, vol. 12, no. 1, pp. 388–393. [Google Scholar]
10. J. Wang, J. Ni and X. Zhang. (2017). “Rate and distortion optimization for reversible data hiding using multiple histogram shifting hiding,” IEEE Transactions on Cybernetics, vol. 47, no. 2, pp. 315–326. [Google Scholar]
11. J. Wang, X. Chen, J. Ni, N. Mao and Y. Shi. (2020). “Multiple histograms based reversible data hiding: Framework and realization,” IEEE Transactions on Circuits and Systems for Video Technology, vol. 30, no. 8, pp. 2313–2328. [Google Scholar]
12. X. Hu. (2007). “Based on ceramics embedded roundness measurement system of ARM9,” Master Dissertation, Jingdezhen Ceramic Institute, Jingdezhen, China. [Google Scholar]
13. J. Wang, Y. Liu and D. Zhang. (2016). “A new computer vision based multi-indentation inspection system for ceramics,” Multimedia Tools and Applications, vol. 76, no. 2, pp. 1–19. [Google Scholar]
14. L. I. Voicu, H. R. Myler and A. R. Weeks. (1997). “Practical considerations on color image enhancement using homomorphic filtering,” Journal of Electronic Imaging, vol. 6, no. 1, pp. 108–113. [Google Scholar]
15. P. Gorgel, A. Sertbas and O. N. Ucan. (2010). “A wavelet-based mammographic image denoising and enhancement with homomorphic filtering,” Journal of Medical Systems, vol. 34, no. 6, pp. 993–1002. [Google Scholar]
16. R. W. Fries and J. W. Modestino. (1979). “Image enhancement by stochastic homomorphic filtering,” IEEE Transactions on Acoustics, Speech, and Signal Processing, vol. 27, no. 6, pp. 625–637. [Google Scholar]
17. C. C. Yang. (2009). “Image enhancement by the modified high-pass filtering approach,” Optik International Journal for Light and Electron Optics, vol. 120, no. 17, pp. 886–889. [Google Scholar]
 | This work is licensed under a Creative Commons Attribution 4.0 International License, which permits unrestricted use, distribution, and reproduction in any medium, provided the original work is properly cited. |