DOI:10.32604/csse.2021.015309
| Computer Systems Science & Engineering DOI:10.32604/csse.2021.015309 | |
| Article |
COVID-19 Pandemic Data Predict the Stock Market
Faculty of Computing and Information Technology, University of Tabuk, Tabuk, Saudi Arabia
*Corresponding Author: Abdulaziz Almehmadi. Email: aalmehmadi@ut.edu.sa
Received: 14 November 2020; Accepted: 24 December 2020
Abstract: Unlike the 2007–2008 market crash, which was caused by a banking failure and led to an economic recession, the 1918 influenza pandemic triggered a worldwide financial depression. Pandemics usually affect the global economy, and the COVID-19 pandemic is no exception. Many stock markets have fallen over 40%, and companies are shutting down, ending contracts, and issuing voluntary and involuntary leaves for thousands of employees. These economic effects have led to an increase in unemployment rates, crime, and instability. Studying pandemics’ economic effects, especially on the stock market, has not been urgent or feasible until recently. However, with advances in artificial intelligence (AI) and the inter-connectivity that social media provides, such research has become possible. In this paper, we propose a COVID-19-based stock market prediction system (C19-SM2) that utilizes social media. Our AI system enables economists to study how COVID-19 pandemic data influence social media and, hence, the stock market. C19-SM2 gathers COVID-19 infection and death cases reported by the authorities and social media data from a geographic area and extracts the sentiments and events that occur in that area. The information is then fed to the support vector machine (SVM) and random forest and random tree classifiers along with current stock market values. Then, the system produces a projection of the stock market’s movement during the next day. We tested the system with the Dow Jones Industrial Average (DJI) and the Tadawul All Share Index (TASI). Our system achieved a stock market prediction accuracy of 99.71%, substantially higher than the 89.93% accuracy reported in the related literature; the inclusion of COVID-19 data improved accuracy by 9.78%.
Keywords: COVID-19; economic impact; artificial intelligence; sentiment analysis; stock market
The COVID-19 pandemic has had a clear impact on the world economy, causing socio-economic changes that shift consumers’ buying behavior [1]. Individuals now shop less and, if necessary, shop online. Most consumers have decreased unnecessary spending, focusing on saving and liquidating their investments. As a result, markets fell by over 30% in the first quarter of 2020 [2]. The Dow Jones Industrial Average (DJI) fell almost 40% in the same period [2], while the Tadawul All Share Index (TASI), a Saudi Arabian stock index, has dropped over 22% since the start of the pandemic [3].
The number of COVID-19 infections and deaths reported by the authorities contributes to these socio-economic changes. Reported cases affect the emotional state of consumers and can thus drastically influence their decisions. Behavioral economics shows that emotions affect decision-making and behavior [4]; this includes decisions about selling or buying. When the emotional state of individuals is affected by uncertainty, fear, and sadness, irrational decisions are made [5]. Such decisions can be observed in the first quarter of 2020, with a massive sell-off of shares causing market crashes and volatile markets. Reported COVID-19 cases contribute to these market fluctuations through their influence on consumers’ emotions.
The rapid changes in consumer behavior caused by the pandemic and world governments’ efforts to control it have caused roller-coaster stock markets in which uncertainty and fear lead to massive sell-offs. Since the pandemic began, news about its progress has signaled the market’s direction. Positive news increases the appetite to invest, while negative news creates fear and leads to emotion-driven decisions to sell.
Monitoring events such as reported COVID-19 cases and rapid government controls in conjunction with the public’s emotional state through social media data analytics may reveal the economic impact of COVID-19 on stock markets. This may, in turn, produce accurate stock market predictions. Given recent advances in AI algorithms, the vast amount of information available about the pandemic, and the inter-connectivity of social media, we attempt to synthesize the data and train a classifier to predict the direction of the next stock market move.
The remainder of this paper is organized as follows. Related work is described in Section 2. The hypotheses and objectives are provided in Section 3. Section 4 describes and discusses the system design. The methodology is given in Section 5, and the results are provided and discussed in Section 6. Finally, a prognosis for COVID-19’s future economic impact is presented in Section 7.
2 Background and Literature Review
In this section, we present previous work on stock market prediction, with an emphasis on social media-based approaches
2.1 Social Media and Prediction Capability
Social media has proved a valuable source of information. Data scientists have compiled tools and designed systems to analyze the written text produced by social media platforms, especially Twitter [6]. For example, GEOFLX [7] allows for selecting an area or areas of interest on the map and collects the tweets that originate from these areas in the selected time frame. It then applies text-mining techniques and presents public sentiment and emotions over time. Tweet analysis has been used to detect and predict incidents and crimes [8], public mood [9], reactions to statements or products [7], and even to influence elections [10]. In general, data scientists use social media platforms as the input for algorithms that predict outcomes related to their research topics.
Our previous work, “Language usage on Twitter predicts crime rate” [8], served as an example of the power of prediction by analyzing social media data. It predicted the number of crimes that would occur at a certain location based on the Twitter mood of the area. The system reached 96.16% accuracy in predicting if crime rates would increase or decrease in a given area. The same technique can be applied to stock market prediction, as discussed in the next subsection.
2.2 Stock Market Prediction Using Social Media
Xu [11] investigated the correlation between stock market fluctuations and reported news described by Google Trends. They found a significant correlation between the two (p ≤ 0.001). Furthermore, Arafat et al. [12] found a significant correlation (p ≤ 0.001) between social-media-based public emotion according to the Google-Profile of Mood States (GPOMS) and the stock market. These findings support the notion that rapid government controls such as curfews have a direct effect on stock markets in addition to the pandemic’s effect on markets via the public mood.
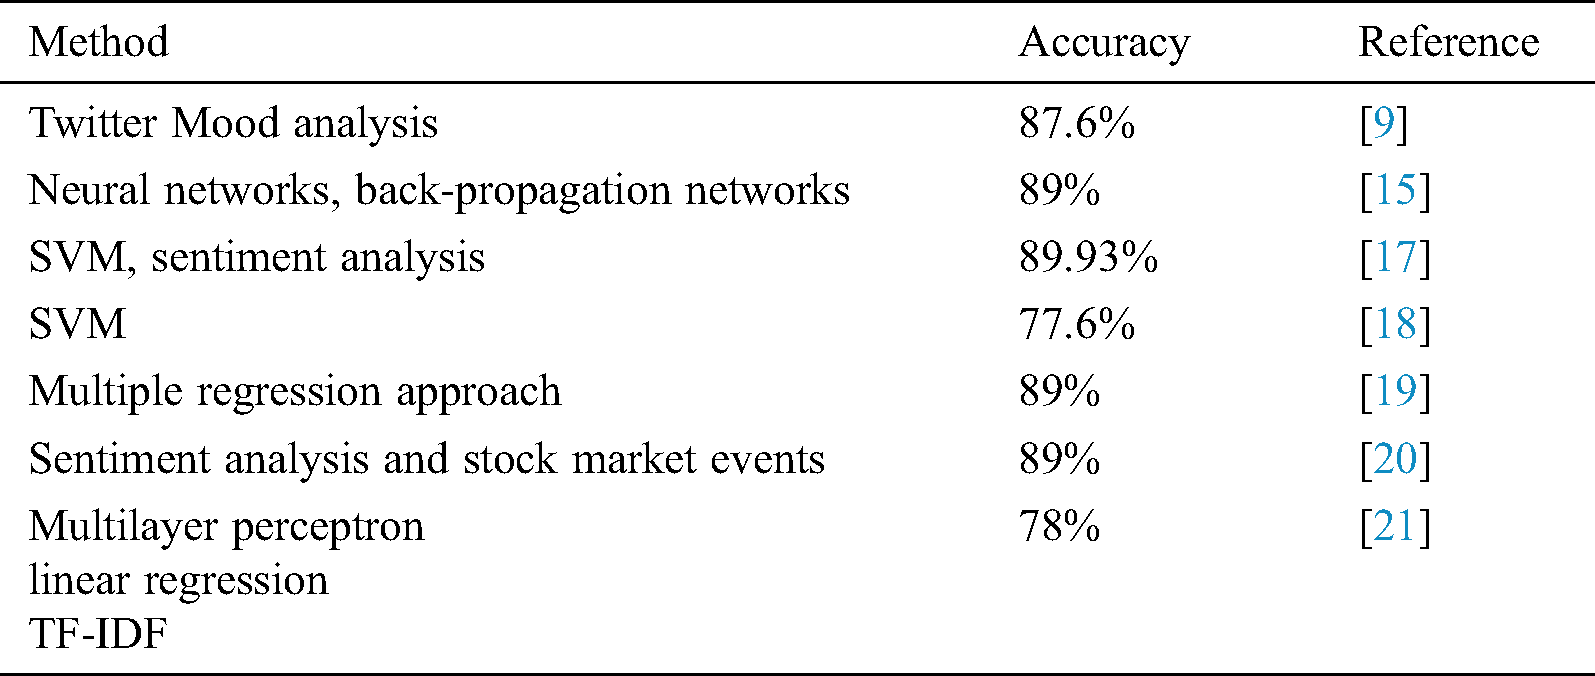
Neural network stock market prediction has achieved better results than conventional statistical techniques [13,14]. Schoeneburg [15] and Kaastra et al. [16] used back-propagation neural networks to predict the stock market in the short term (days) and achieved 89% accuracy. Huang et al. [17] and Shen et al. [18] used a support vector machine (SVM) classifier using investor sentiment, achieving 89.93% and 77.6% accuracy in predicting the next day’s stock market move, respectively.
Furthermore, Kamley et al. [19] used multiple regression using a month’s high and low prices at opening and closing. They reached 89% accuracy in predicting the next stock market move. Makrehchi et al. [20] reached 89% accuracy in predicting the stock market using Twitter sentiment analysis and stock market events. Coyne et al. [21] used a multilayer perceptron, linear regression, and TF-IDF to predict the stock market using social media data, achieving a maximum accuracy of 78%.
Furthermore, Bollen et al. [9] reached 87.6% accuracy in predicting the stock market using Twitter mood. The authors relied on the concept that a country’s public mood is an indicator of the future direction of the stock market. Most work in this area indicates the possibility of predicting the stock market using various approaches and multiple metrics, reaching as high as 89.93% accuracy. However, during a pandemic, a socio-economic change occurs. The public mood becomes sensitive to reported infections and deaths and rapid changes in governmental policy. Therefore, we investigate how reported COVID-19 infections and deaths affect the stock market, using SVM and sentiment analysis to improve on the best prediction systems in the literature. We show that COVID-19 case reports provide an additional metric that classification systems can use to improve the accuracy of stock market predictions. Tab. 1 summarizes the literature on using social media to predict the stock market.
Table 1: Summary of stock market predictions based on social media
Since Twitter mood has been used to predict the stock market with 89.93% [17] accuracy, we developed the following main hypothesis to improve prediction accuracy during pandemics.
Main hypothesis:
Including reported COVID-19 infections and deaths and rapid changes in governmental controls improves the accuracy of stock market predictions based on Twitter mood.
The rationale behind the main hypothesis is that reported COVID-19 cases, as well as rapid government controls, have a direct effect on the public mood. Together with the Twitter-based stock market prediction system, COVID-19 data can enhance classification to better predict the stock market’s next move.
In order to validate the main hypothesis, we have developed the following supporting hypothesis:
Hypothesis 1: Reported COVID-19 infections and deaths, as well as government controls, correlate with Twitter mood.
When sentiment analysis and text mining are applied to tweets within a specific geographic area, it is possible to extract the most dominant emotions at a given time and location, as well as the current events related to government controls in the area of interest. Therefore, we hypothesize that reported COVID-19 infections and deaths as well as government controls influence the public mood and correlate with reported cases. This finding should improve the prediction system and support the main hypothesis, as Twitter mood has shown promise in predicting stock markets [9,17]
To address the hypotheses, we developed the following quantitative research objectives:
a. Determine whether an increase or decrease of reported COVID-19 cases and government controls correlates with the Twitter mood.
b. Determine whether the proposed COVID-19-based stock market prediction system utilizing social media (C19-SM2) improves the prediction of the stock market’s next move.
Studying the emotion and behavior of the population in a certain area, taking into consideration the number of reported COVID-19 infections and deaths as well as government controls, may allow classification models to better predict stock market changes. Accordingly, we designed C19-SM2, an AI-based system that empowers researchers to study the impact of COVID-19 and government controls on the stock market.
A) C19-SM2 components
The proposed system is composed of four parts:
1) Configuration: the user can select the duration and target area, with the option of limiting the search to specific keywords or key phrases, to obtain the following output:
i) the tweets that originated from the area of interest during the selected duration.
2) Data analysis: the emotions and sentiments of the public and the relevant events are extracted from the tweets over time, as well as the stock market data. Events include:
i) the government controls, and
ii) the number of reported COVID 19 infections and death cases.
All data is then pre-processed and prepared for the classification model training.
3) Classification: the data is fed to the classifiers, including support vector machine (SVM), random forest, and random trees classifiers, with 10-fold cross-validation; the best-performing model is reported.
4) Prediction: new data is fed to the classifiers to predict the next stock market change.
The result of the C19-SM2 is a projection that the stock market will move up or down. It represents the projection with a graph showing the emotions and sentiments of the public, with vertical markers showing government controls and the number of reported infection and death cases per day, as well as the most recent stock market change and the projection for its next move. Fig. 1 depicts the C19-SM2 system components.
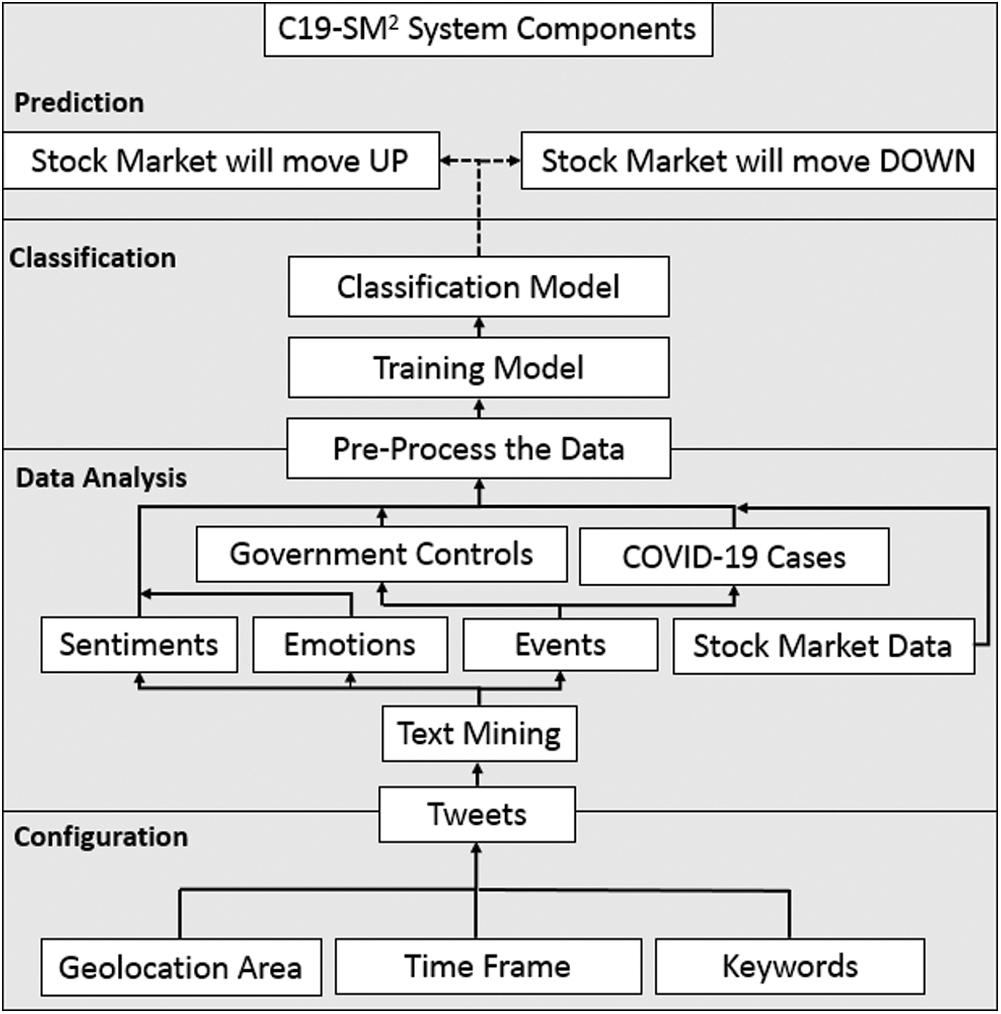
Figure 1: C19-SM2 system components
The next section describes the study’s methodology and data analysis, explaining each component of C19-SM2 and how it contributes to the system’s capability to predict the stock market.
5 Methodology and Data Analysis
In order to test the main and supporting hypotheses, achieve the study objectives, and evaluate the C19-SM2 system, we selected two stock markets in two different countries. We collected tweets in the two countries independently, and we gathered the relevant data on COVID-19 case reports and rapid government controls. This data served as the input for the C19-SM2 system. The details of the methodology and data analysis are described as follows:
The configuration of C19-SM2 allows the system to gather relevant information from Twitter in the selected time frame and geographic area, with the ability to filter by specific keywords or key phrases for a more refined search. This makes it possible to investigate and predict specific stock markets. Fig. 2 depicts the system graphical user interface (GUI) for geographic area selection.
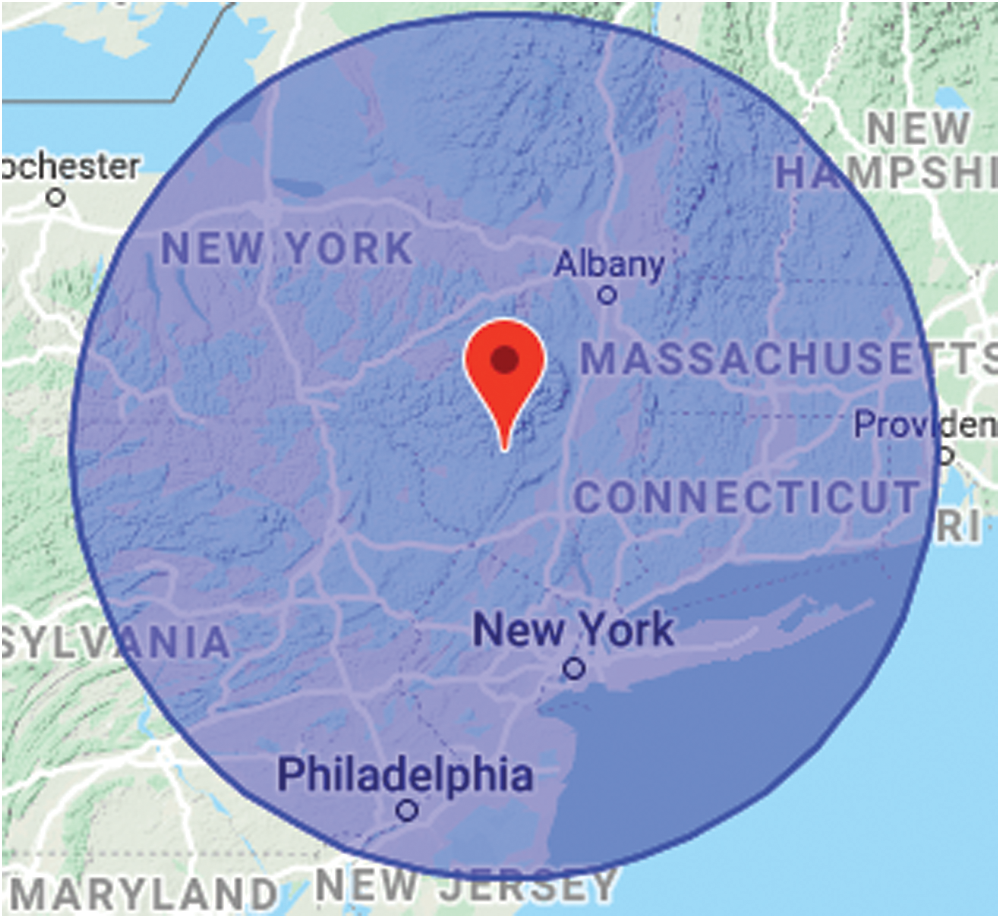
Figure 2: The GUI of C19-SM2 for selecting the area of interest to collect tweets from
Two stock markets were selected: the Dow Jones Industrial Average (DJI) in the United States and the Tadawul All Share Index (TASI) in Saudi Arabia. The rationale behind selecting two different stock markets was to evaluate the system in two markets instead of one. Fig. 3 shows the selected area in both the United States and Saudi Arabia.
Tweets were collected in the two test areas from February 1 to May 30, 2020 without filtered keywords or key phrases. This approach allowed us to capture all tweets and extract all sentiments and emotions, as well as government controls and COVID-19 reported cases, without missing any important information. The total number of tweets collected in the two areas is detailed in Tab. 2.
Table 2: Total tweets collected in the United States and Saudi Arabia from February 1 to May 30
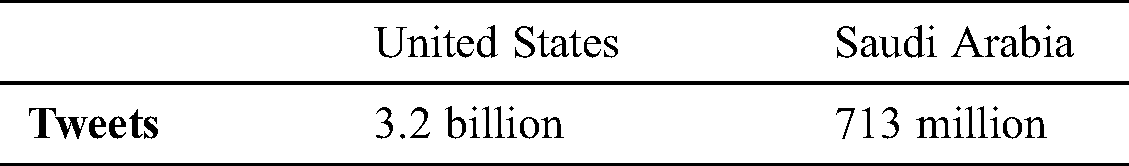
All the tweets were saved in CSV format for extracting sentiments, emotions, and events, as well as stock market data. Details of the analysis are provided in the data analysis component of C19-SM2.
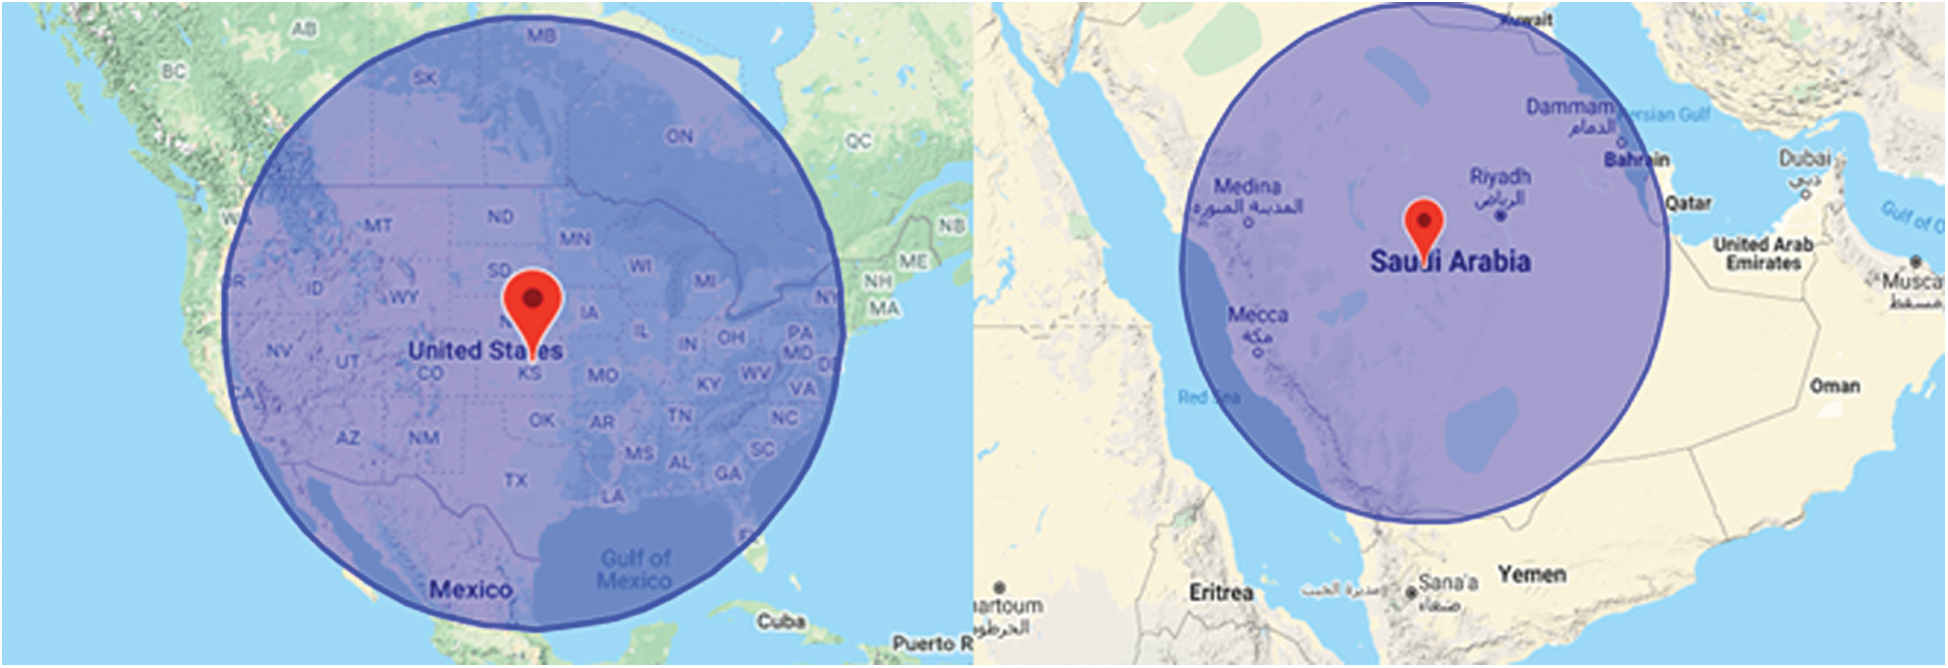
Figure 3: C19-SM2 target areas in the United States and Saudi Arabia
Once the tweets from the two areas of interest are gathered, C19-SM2 applies text mining techniques using the IBM Watson Natural Language Understanding API [22] to extract the sentiments and emotions of the public. The sentiments and emotions from tweets are averaged for each day. C19-SM2 then extracts the events that occurred at the specified area, the COVID-19 reported infection and death cases, and the government controls. The data is extracted from verified Twitter accounts that report the events (the Ministry of Health or Centers for Disease Control). Further, stock market data is extracted using the Alpha Vantage API [23] for the DJI and TASI [24] for TASI stock market data for the same period, February 1–May 30, 2020. The results of the Data Analysis component are:
i) the sentiment averaged per day,
ii) the emotions averaged per day,
iii) new reported COVID-19 infections,
iv) new reported COVID-19 deaths,
v) total reported COVID-19 infections,
vi) total reported COVID-19 deaths,
vii) the stock market open/close and high/low prices,
viii) the stock market trading volume,
ix) the presence or absence of government controls, and
x) the stock market day-to-day difference, for labeling a day as down or up for training the classification models.
The data is pre-processed by aligning the timeframe of the stock market and reported cases and removing noise, such as irrelevant data. COVID-19 data were averaged during a weekend when the stock market was closed to serve as a prediction input for the next day the market was open.
The extracted features are the nine results of the data analysis components with a labeled class of the next day’s stock market move (up or down).
Attribute selection is then applied for extracting the best features. Wrapper subset evaluation is used. Even though it is an expensive process requiring extensive resources, it selects the best features for each classification algorithm; we utilized SVM, random forest, and random trees classifiers. The data is then fed to the classification model for training.
After selecting the best features using the wrapper subset evaluation algorithm, the data is fed into the classifiers to determine which are the most accurate.
The classifiers are evaluated using 10-fold cross-validation. The training and testing data are divided into 10 folds; each fold includes 10% training and 90% testing with an increment of the training by 10% and a decrease of the testing data by 10%. The average of classification results per fold is then computed and reported as the classifier accuracy.
After selecting the best classifier, new data for the day is collected to predict the next day’s market move.
The next section reports the results for the two objectives and hypotheses and presents the evaluation for C19-SM2.
In this section, Objectives 1 and 2 are evaluated, and the two hypotheses are tested.
Objective 1:
To test if an increase or decrease of reported COVID-19 cases and government controls correlates with the Twitter mood.
In order to achieve Objective 1, we collected reported COVID-19 infections and deaths, government controls, and sentiments and emotions from February 1 to May 30. Then, we calculated the correlation coefficient. The test shows that the number of reported COVID-19 infections and deaths and the government controls significantly correlate with the US data (p ≤ 0.001) and the Saudi Arabia data (p ≤ 0.001). These results affirm the supporting hypothesis, which states that reported COVID-19 infections and deaths and government controls correlate with Twitter mood.
Objective 2:
To test if the proposed COVID-19-based stock market prediction system utilizing social media (C19-SM2) improves the prediction of the stock market’s next move.
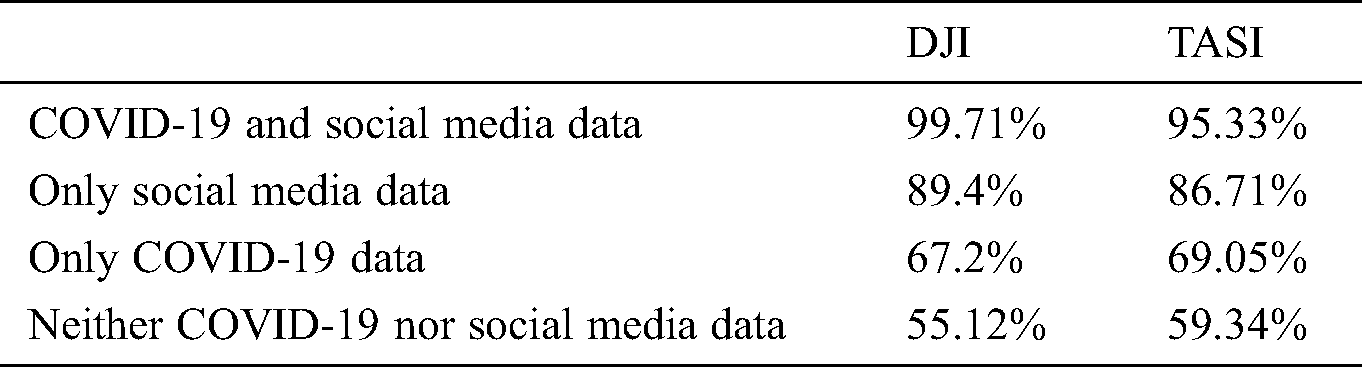
In order to achieve Objective 2, four classifiers were trained for each stock market (DJI and TASI) for a total of eight classifiers. For each stock market, these included one classifier with reported COVID-19 infections and deaths, government controls, and social media data; one classifier with only social media data; one classifier with only COVID-19 and government controls data; and one classifier without COVID-19 or social media data.
After training the classifiers with the four months of data, the SVM classifier showed the highest accuracy with COVID-19 data, achieving 99.71% accuracy for DJI and 95.33% for TASI. Training without COVID-19 data achieved only 89.4% accuracy for DJI and 86.71% for TASI.
To evaluate the C19-SM2 system, we performed an additional test for a period of two weeks after the target period (June 1–June 12, 2020), including 10 business days when the stock market was open. We fed one classifier new COVID-19 infection and death data, government controls, and daily sentiments and emotions to predict the next day’s stock market move; the other classifier was fed only the sentiment and emotions of the day to predict the next day’s stock market change (for each stock market). The SVM classifier with COVID-19 data exhibited 93% accuracy for DJI and 91% accuracy for TASI, while the SVM classifier without COVID-19 data achieved 83.41% accuracy for DJI and 81.62% accuracy for TASI.
The results support the main hypothesis that data on reported COVID-19 infections and deaths and rapid government controls improve the accuracy of Twitter-based stock market predictions. Tab. 3 summarizes the results of the proposed C19-SM2 system.
Table 3: Summary of the C19-SM2 system’s stock market predictions (up/down)
The COVID-19 pandemic has disrupted the global economy, and many stock markets have fallen nearly 40%. Studying how pandemics affect the economy has never been more urgent. Previous work has implemented social media mood-based stock market prediction. However, during a pandemic, a new source of information that directly affects the public mood and the stock market becomes available.
In this paper, we propose a COVID-19-based stock market prediction system utilizing social media (C19-SM2). The system utilizes social media and reported COVID-19 infections and deaths to predict the stock market’s next move (up or down). We tested the system on two stock markets, DJI and TASI, in two different countries. The results affirm the supporting hypothesis that reported COVID-19 infections and deaths and government controls correlate with Twitter mood (p < 0.001). The results also support the main hypothesis that reported COVID-19 infections and deaths and rapid government controls improve the Twitter-mood-based stock market prediction system’s accuracy. The system exhibited a 9.78% increase in accuracy; C19-SM2 achieved an accuracy of 99.71%, compared to the literature’s maximum accuracy of 89.93%.
Future work may involve analyzing sentiment and emotions per minute to predict stock market changes in the next minute, taking into consideration reported COVID-19 infections and deaths when training and testing the system. Furthermore, the classification model could be improved by analyzing other events that occur in the target area that might have a direct influence on public sentiments and emotions. Future work using C19-SM2 could analyze multiple areas to discover the most negative area in sentiment as a result of COVID-19 spread.
Acknowledgement: The author would like to thank the Computer Systems Science and Engineering (CSSE) reviwers for their insights and valuable comments that significantly improved the manuscript.
Funding Statement: This work was supported by the Deanship of Scientific Research at the University of Tabuk under grant number 1441-0043, AA, ut.edu.sa.
Conflicts of Interest: The authors declare that they have no conflicts of interest to report regarding the present study.
1. S. Mehta, T. Saxena and N. Purohit. (2020). “The new consumer behavior paradigm amid covid-19: Permanent or transient?,” Journal of Health Management, vol. 22, no. 2, pp. 291–301. [Google Scholar]
2. CNBC, F. Imbert and Y. Li. (2020). “Dow falls more than 30 points, but Nasdaq ekes out fifth straight gain.” . [Online]. Available: https://www.cnbc.com/2020/06/17/stock-market-futures-open-to-close-news.html. [Google Scholar]
3. Argaam. (2020). “Saudi market dips 22% in 11 2020 on covid 19 concerns,” . [Online]. Available: https://www.argaam.com/en/article/articledetail/id/1362824. [Google Scholar]
4. S. Rick and G. Loewenstein. (2008). “The role of emotion in economic behavior,” in Handbook of Emotions, 3rd edition, New York, NY, USA: The Guildford Press. [Google Scholar]
5. J. Wiebe, T. Wilson and C. Cardie. (2005). “Annotating expressions of opinions and emotions in language,” . [Online]. Available: http://people.cs.pitt.edu/~wiebe/pubs/papers/lre05.pdf. [Google Scholar]
6. P. Gonçalves, F. Benevenuto and M. Cha. (2013). “PANAS-t: A pychometric scale for measuring sentiments on twitter,” CoRR, . [Online]. Available: http://arxiv.org/abs/1308.1857. [Google Scholar]
7. GEOFLX, “A geographical-based tweet capturing and analyzing system,” 2019. [Online]. Available: https://www.geoflx.com. [Google Scholar]
8. A. Almehmadi, Z. Joudaki and R. Jalali. (2017). “Language usage on twitter predicts crime rate,” in Security of Information and Network (SIN’17). New York; NY. [Google Scholar]
9. J. Bollen, H. Mao and X. Zeng. (2011). “Twitter mood predicts the stock market,” Journal of Computational Science, vol. 2, no. 1, pp. 1–8. [Google Scholar]
10. Forbes. (2020). “Facebook and election influence: Will history repeat itself?,” . [Online]. Available: https://www.forbes.com/sites/hbsworkingknowledge/2019/08/08/facebook-and-election-influence-will-history-repeat-itself/#21872f49126b. [Google Scholar]
11. S. Y. Xu. (2012). “Stock price forecasting using information from Yahoo Finance and Google Trend,” . [Online]. Available: https://www.econ.berkeley.edu/sites/default/files/Selene%20Yue%20Xu.pdf. [Google Scholar]
12. J. Arafat, M.Ahsan Habib and R. Hossain. (2013). “Analyzing public emotion and predicting stock market using social media,” American Journal of Engineering Research, vol. 2, no. 9, pp. 265–275, , [Online]. Available: http://www.ajer.org/papers/v2(9)/ZK29265275.pdf. [Google Scholar]
13. V. Kunwar and B. Ashutosh. (2010). “An analysis of the performance of artificial neural network technique for stock market forecasting,” International Journal on Computer Science and Engineering, vol. 2, no. 6, pp. 2104–2109, , [Online]. Available: http://www.researchgate.net/profile/Dr_Kunwar_Vaisla2/publication/49620536_An_Analysis_of_the_Performance_of_Artificial_Neural_Network_Technique_for_Stock_Market_Forecasting/links/01fb83dc1c353f0d142376fd.pdf. [Google Scholar]
14. D. Das and M.Shorif Uddin. (2011). “Data mining and neural network techniques in stock market prediction: A methodological review,” International Journal of Artificial Intelligence & Applications, vol. 4, no. 9, pp. 117–127. [Google Scholar]
15. E. Schoeneburg. (1990). “Stock price prediction using neural networks: A project report,” Neurocomputing, vol. 2, no. 1, pp. 17–27. [Google Scholar]
16. I. Kaastra and M. Boyd. (1996). “Designing a neural network for forecasting financial and economic time series,” Neurocomputing, vol. 10, no. 3, pp. 215–236. [Google Scholar]
17. W. Huang, Y. Nakamori and S. Wang. (2005). “Forecasting stock market movement direction with support vector machine,” Computers & Operations Research, vol. 32, no. 10, pp. 2513–2522. [Google Scholar]
18. S. Shen, H. Jiang and T. Zhang. (2012). Stock market forecasting using machine learning algorithms. Stanford, CA: Department of Electrical Engineering, Stanford University, pp. 1–5. [Google Scholar]
19. S. Kamley, S. Jaloree and R. Thakur. (2013). “Multiple regression: A data mining approach for predicting stock market trends based on open, close and high price of the month,” International Journal of Computer Science Engineering and Information Technology Research, vol. 3, no. 4, pp. 173–180, , [Online]. Available: http://pakacademicsearch.com/pdf-files/com/244/173-180%20Vol.%203,%20Issue%204,%20Oct%202013.pdf. [Google Scholar]
20. M. Makrehchi, S. Shah and W. Liao, “Stock prediction using event-based sentiment analysis,” Web Intelligence (WI) and Intelligent Agent Technologies (IAT), vol. 1, pp. 337–342, 2013. [Online]. Available: http://ieeexplore.ieee.org/focus.lib.kth.se/xpl/articleDetails.jsp?arnumber=6690034. [Google Scholar]
21. S. Coyne, P. Madiraju and J. Coelho. (2017). “Forecasting stock prices using social media analysis,” in IEEE 15th Int. Conf. on Dependable, Autonomic and Secure Computing, 15th Int. Conf. on Pervasive Intelligence and Computing, 3rd Int. Conf. on Big Data Intelligence and Computing and Cyber Science and Technology Congress (DASC/PiCom/DataCom/CyberSciTechOrlando, FL, pp. 1031–1038. [Google Scholar]
22. IBM Watson Natural Language Understanding, 2020. [Online]. Available: https://www.ibm.com/sa-en/cloud/watson-natural-language-understanding. [Google Scholar]
23. Alpha Vantage, 2020. [Online]. Available: https://www.alphavantage.co/. [Google Scholar]
24. Tadawul Market Information Services, 2020. [Online]. Available: https://www.tadawul.com.sa/wps/portal/tadawul/services/market-information-services. [Google Scholar]
 | This work is licensed under a Creative Commons Attribution 4.0 International License, which permits unrestricted use, distribution, and reproduction in any medium, provided the original work is properly cited. |