DOI:10.32604/csse.2021.014988
| Computer Systems Science & Engineering DOI:10.32604/csse.2021.014988 | |
| Article |
RP-NBSR: A Novel Network Attack Detection Model Based on Machine Learning
1School of Computer Science & Technology, Henan Polytechnic University, Jiaozuo Henan, 454000, China
2College of Computer Science & Technology, Jilin University, Changchun Jilin, 130012, China
3Department of Computer Science, University College London, London, United Kingdom
*Corresponding Author: Hui Wang. Email: wanghui_jsj@foxmail.com
Received: 31 October 2020; Accepted: 16 December 2020
Abstract: The rapid progress of the Internet has exposed networks to an increased number of threats. Intrusion detection technology can effectively protect network security against malicious attacks. In this paper, we propose a ReliefF-P-Naive Bayes and softmax regression (RP-NBSR) model based on machine learning for network attack detection to improve the false detection rate and F1 score of unknown intrusion behavior. In the proposed model, the Pearson correlation coefficient is introduced to compensate for deficiencies in correlation analysis between features by the ReliefF feature selection algorithm, and a ReliefF-Pearson correlation coefficient (ReliefF-P) algorithm is proposed. Then, the Relief-P algorithm is used to preprocess the UNSW-NB15 dataset to remove irrelevant features and obtain a new feature subset. Finally, naïve Bayes and softmax regression (NBSR) classifier is constructed by cascading the naïve Bayes classifier and softmax regression classifier, and an attack detection model based on RP-NBSR is established. The experimental results on the UNSW-NB15 dataset show that the attack detection model based on RP-NBSR has a lower false detection rate and higher F1 score than other detection models.
Keywords: Naïve Bayes; softmax regression; machine learning; ReliefF-P; attack detection
At present, cybersecurity threats are becoming increasingly prominent, and cybersecurity risks are constantly infiltrating into political, economic, cultural, social, ecological, and defense fields. In 2018, the National Internet Emergency Center (CNCERT) coordinated and handled approximately 106,000 network security incidents [1]. The cloud platform became the hardest hit area for cyber attacks, which brought potential security risks to netizens’ personal and property safety. Methods to more effectively detect intruder attacks and protect data security are receiving increasing attention.
The intrusion detection system (IDS) can detect intrusion behavior in time. By collecting and analyzing the activity information of the key nodes on the computer network, it can be judged whether the network or the system is compromised [2,3]. According to its technical basis, it can be divided into abnormal detection and misuse detection, that is, normal feature white list and intrusion feature blacklist technology. Anomaly detection usually needs to establish a large normal feature database, which is easily causes a high false alarm rate. Misuse detection establishes a model for known intrusion behaviors, which is easy to implement, has a low false positive rate, and is fast to detect but cannot detect unknown intrusion behavior. Therefore, the old detection model will increase the false detection rate and cause significant losses. How to improve the classification accuracy of the model and reduce the false detection rate of the model has become a research hotspot.
In this paper, we propose a RP-NBSR model based on machine learning for network attack detection. In the proposed model, an improved ReliefF-P algorithm is proposed for feature selection, and then the naïve Bayes classifier and the softmax regression classifier are cascaded to form the NBSR classifier.
This paper is organized as follows: Section 2 discusses the related research. In Section 3, we propose the improved RP-NBSR model for network attack detection. In Section 4, we analyze and compare the existing and proposed model using the UNSW-NB15 dataset.
Bivens et al. [4] used the DARPA 1999 dataset to construct an intrusion detection system based on a multilayer perceptual neural network. The system uses a time-sliding window to detect multiple packets and is able to detect types of attacks that last longer. The experimental results show that the recognition rate of normal behavior reaches 100%, but the detection effect on unknown attack behavior is not good, and the false detection rate is as high as 76%.
Wang et al. [5] proposed a hybrid intrusion detection model based on an algorithm cascade and improved the K-means algorithm. Simulation experiments using the NSL-KDD dataset showed that the proposed intrusion detection model can improve the detection efficiency of intrusion attacks. However, because the NSL-KDD dataset lacks a common dataset based on the intrusion detection network, the NSL-KDD dataset cannot be close to the existing real network.
Al-Yaseen et al. [6] proposed a multilevel intrusion detection model based on a support vector machine (SVM) classifier and an extreme learning machine. This model uses the KDD 1999 dataset to reduce the number of features in the training dataset and to preprocess the transformed and standardized training and test datasets to fit the SVM classifier and the extreme learning machine. This model has higher attack detection efficiency than other models based on the same dataset. However, the dataset used for training lacks unknown attack samples, resulting in a high rate of false positives.
Khor et al. [7] proposed a multilevel intrusion detection model based on a Bayesian network combined with decision-tree C4.5 classifiers. The model focuses on solving the problem of uneven distributions of attack categories in datasets and proposes a dichotomy. The model first separates the rare categories from the training dataset, reduces the impact of the main attack categories on the classifier, and then trains the cascade classifier to handle the rare categories and other categories, thereby increasing the detection rate of the rare attack categories. However, the inclusion of unknown attack categories in the experimental dataset is not complete, and there is still a high false positive rate.
Network attack detection technology can detect an intruder’s attack behavior in time, which is the basis of network security. Based on previous research, this paper proposes a RP-NBSR model based on machine learning for attack detection. First, according to the shortcomings of the ReliefF feature selection algorithm [8,9], the Pearson correlation coefficient is introduced to calculate the correlation between features, and the ReliefF-P algorithm is proposed. Second, the ReliefF-P algorithm is used to process the UNSW-NB15 dataset to remove extraneous features and obtain new ones. The feature subset is used to train the model, and then the naïve Bayes classifier and softmax regression classifier are cascaded to form the NBSR classifier. Finally, the simulation results show that the proposed model has strong advantages in the accuracy and false detection rate of intrusion event classification, especially in the detection accuracy.
3 RP-NBSR Model Based on Machine Learning for Network Attack Detection
3.1 Improved ReliefF-P Feature Selection Algorithm
Data processing is of great significance to the training and research of machine learning. There is noise in the untreated data, the correlation between the features is not large, and the existence of redundant data will increase the algorithm cost and even result in deviations.
The ReliefF feature selection algorithm evaluates the correlation and redundancy of samples by calculating adjacent samples of the same category and different categories. When dealing with the regression problem with the target attribute of a continuous value, first, select the sample subset S randomly from the original dataset, and then find n nearest neighbor samples of s from the same kind of sample set of S. Finally, find n nearest-neighbor samples from the sample set different from the s class. Calculate and then update the feature weight values. This process is iterated until the correlation between the category and the feature of each sample is calculated. Then, according to the value of the feature weight, the features are sorted in descending order, and the features whose weight is less than the given threshold are selected to form a new feature subset.
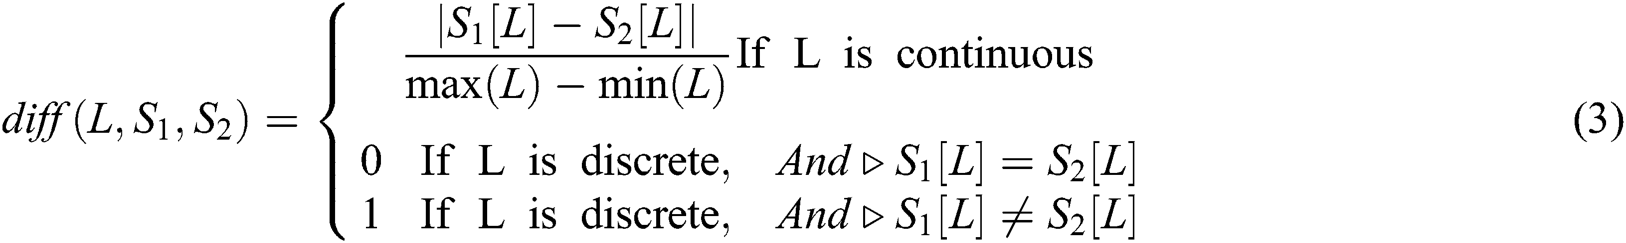
ReliefF only considers the degree of correlation between features and categories and does not consider the correlation between features. This paper proposes a ReliefF-P algorithm with a correlation coefficient definition. The Pearson correlation coefficient is introduced to measure the degree of correlation between features. The calculation steps are as follows:
Randomly select a sample named S from the original dataset and find n nearest neighbors  (j = 1, 2, …, n) in the same sample set as S. Calculate the difference between the samples
  and
and  on the feature L:

Find n nearest neighbors  from each sample set of different classes in S and calculate the difference between the samples
  and
and  on the feature L:

The formulas for  and
and  are as follows:
Calculate the formula for all feature L feature weights as follows:
In the above formula,  is the proportion of this class,
  is the class of sample
  ,
,  is the proportion of randomly selected sample
  categories, and
  represents the jth nearest neighbor sample in class
  . After normalization, the range of values for each feature is converted to [0,1].
Calculate the correlation coefficient between two attribute features as follows:
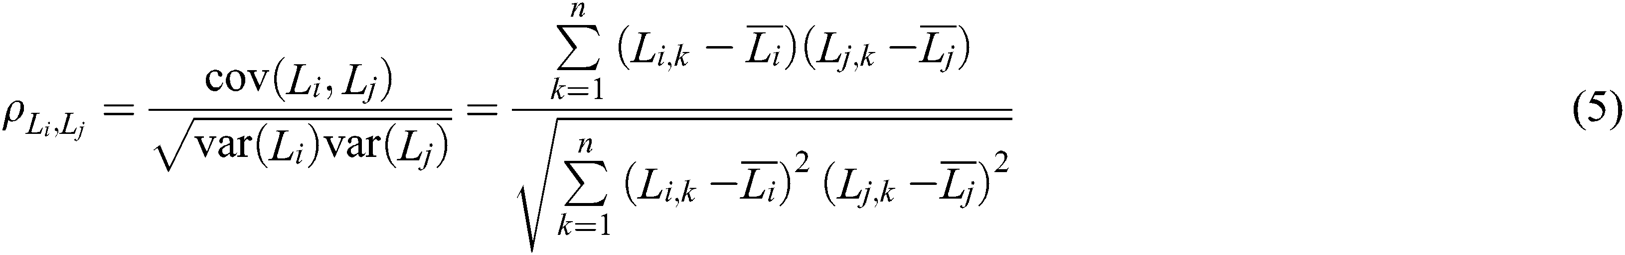
In the above formula,  and
and  are two attribute features.
  and
and  are the observations of two attribute characteristics.
  and
and  are the means of the nth observations of two attribute characteristics. Range(
 )
)  [0,1]. The closer the value of
  is to 1, the stronger the correlation between attribute characteristics. The specific implementation is as follows:

3.2 RP-NBSR Model Based on Machine Learning
A traditional naïve Bayes classification algorithm [10,11] has the problem of inaccurate classification for datasets with unbalanced classes and sparse data. When the sample distribution of each category in the training set is uneven, the classifier tends to use large categories and ignores small categories. In this paper, we apply this feature to the RP-NBSR model and filter the small samples in the second-stage softmax regression classifier by using the first-stage naïve Bayes classifier. Softmax regression [12,13] is a machine learning method used to solve multiclassification problems. It has the characteristics of a simple model, generalization and strong explanation and is used to estimate the possibility of something. If we deal with a multiclassification problem, we need to calculate the probability that each sample belongs to each category. The input is mapped to a real number between 0 and 1, and the sum of normalized guarantees is 1, so the sum of the probability of multiclassification is exactly 1.
By analyzing the network intrusion dataset and the characteristics of the above classifiers, this paper applies the improved ReliefF-P algorithm to data processing and combines the naïve Bayes classifier and logistic regression classifier into a cascade classifier. The process of intrusion detection based on the RP-NBSR model is shown in Fig. 1.
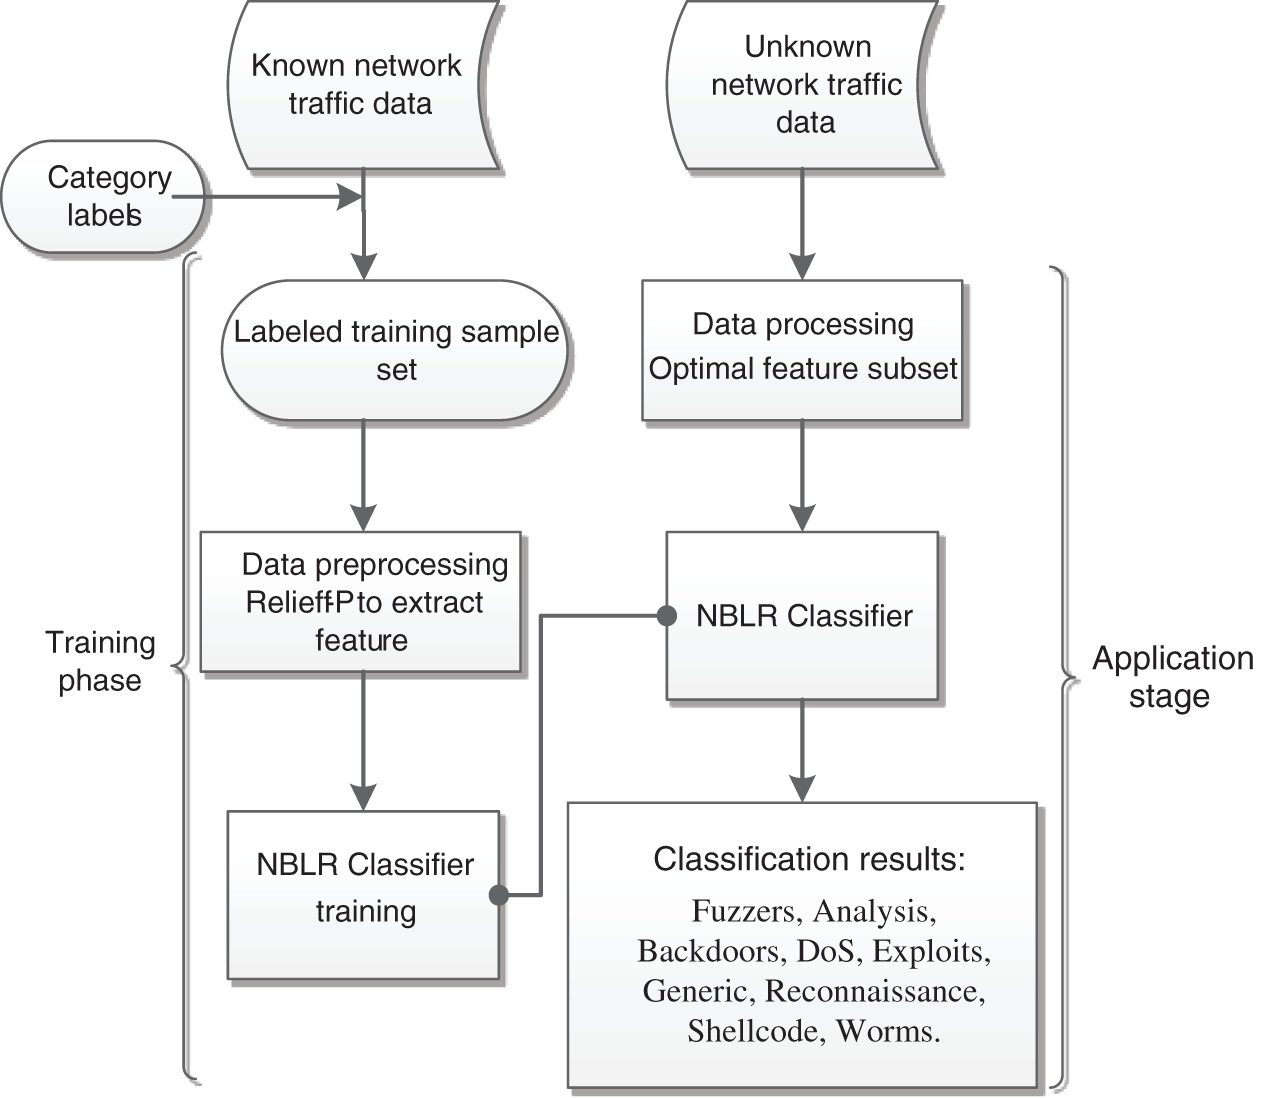
Figure 1: Improved intrusion detection process
3.2.1 Network Attack Dataset Preprocessing
Preprocessing involves the original dataset, mainly including data transformation and data standardization, to achieve the purpose of being suitable for machine learning. First, the nonnumeric data in the original dataset are converted; then, all numerical data are normalized. Because the anomaly data in the dataset have an impact on the Pearson correlation coefficient method, a box plot is used to eliminate the outlier data.
3.2.2 Optimal Feature Subset Selection
The ReliefF-P feature selection algorithm selects the optimal feature subset for each sample type in the dataset, and the optimal subset is the union of each subset. When calculating the correlation between features, the repeated data items are only selected to participate in the Pearson correlation calculation, and the naïve Bayes method is used to pass the prior probability decision. Therefore, when the correlation calculation ends, the repeated data items are still used to train the model. The optimal subset is sent to the cascaded classifier training separately. The feature selection process does not need to be run during the application phase, and the classifier only needs to use the optimal subset of features it obtains during the training phase.
3.2.3 First-Stage Naïve Bayes Classification Model Training
The naïve Bayes (NB) classifier training mainly uses the NB algorithm to train a training set containing six types of data, Fuzzers, Denial of Service (DoS), Exploits, Generic, Reconnaissance and Normal, to obtain a classification model.
The first-stage classification model is as follows:
Step 1. Represent the sample  as an n-dimensional feature vector.
Step 2. Suppose there are m categories for  . Use X as a sample of unknown intrusion behavior without a category tag. Naïve Bayes classification assigns the unknown network behavior to the
  category, and only under the condition of
  does it belong to the largest possible category. Here, 1<j<m, j≠i. According to Bayes’ theorem,

The values of  and C are irrelevant. Therefore, it is only necessary to estimate all
  based on the training set data.
Step 3. If the dataset has multiple attributes, then the computational overhead of  will be large. To reduce the computational overhead, conditional independence assumptions are made. Assuming that the sample category label has been given, the values of the different dimensional features are independent of each other, which means that there is no dependency between any two attributes:

Step 4. Estimate the probability  by training samples. From Eq. (7), if
  , then
  .
.
Step 5. From the above results, the classifier of the first stage of NBSR is obtained:

3.2.4 Second-Stage Softmax Regression Classification Model
The softmax regression classifier training mainly uses softmax regression to train the training set containing the five types of data, Normal, Backdoors, Analysis, Shellcode, and Worms to obtain the classification model.
The second-stage model is as follows:
Step 1. Represents the sample  as an n-dimensional eigenvector. The category label of the training sample set is
  {Normal, Backdoors, Analysis, Shellcode, Worms}.
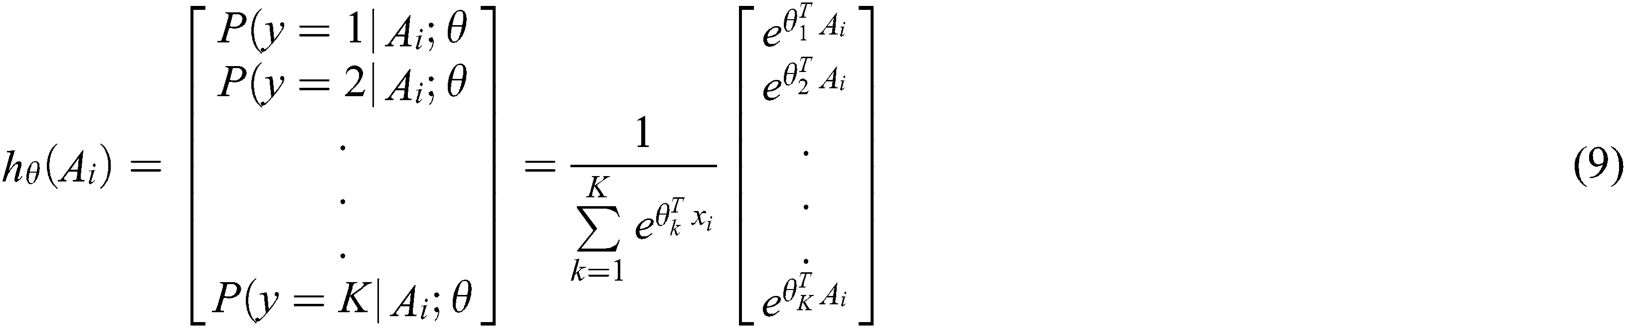
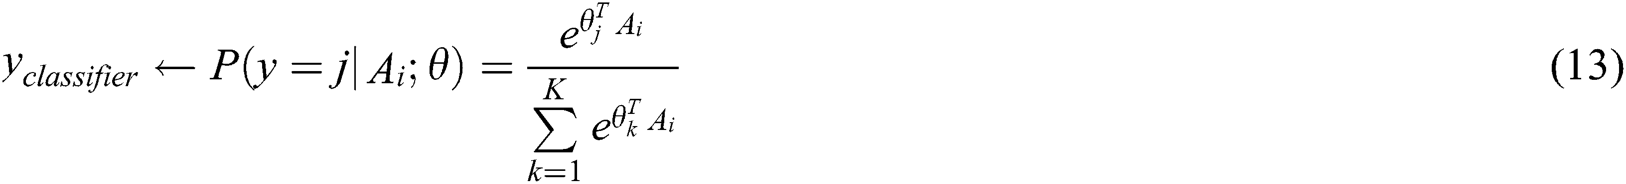
Step 2. Assuming that label y has a total of K categories, for a given test sample  , a hypothesis function is needed to estimate the probability that the sample
  belongs to the j category, and the category with the highest probability is the category of the sample. The corresponding softmax function is as follows:
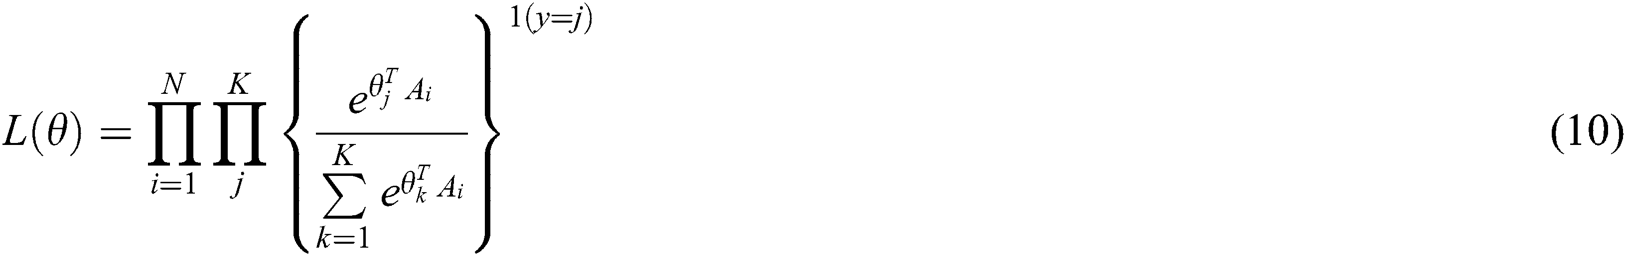
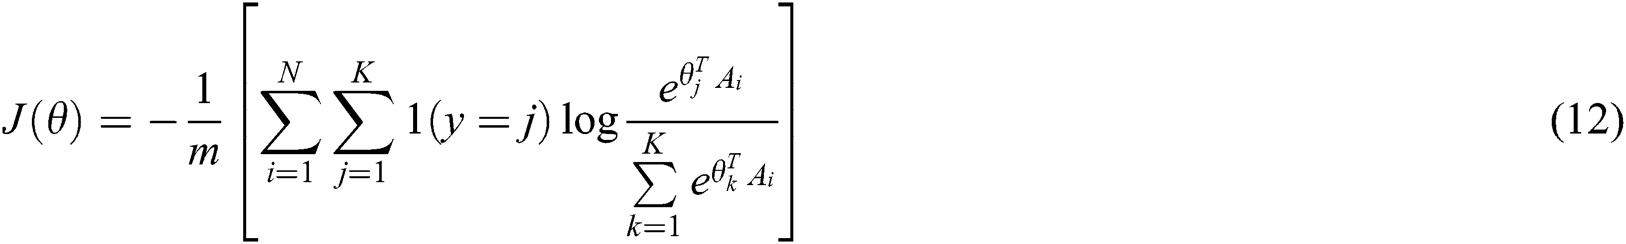
Step 3. The corresponding likelihood function  is expressed as
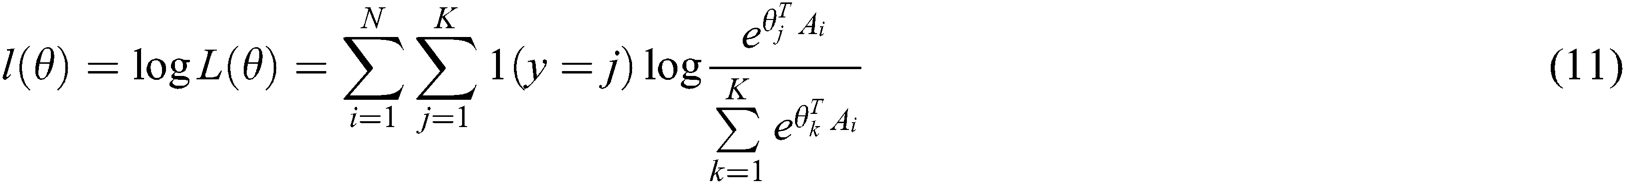
Step 4. Taking the logarithm of the likelihood function  , we obtain the so-called log-likelihood function
  :
:
Step 5. The loss function is
Step 6. From the above results, the second stage classifier of NBSR is obtained:
3.2.5 NBSR Classifier Structure
The NBSR classifier is classified by cascading two different classification algorithms. Each classifier is used to classify different categories. The structure of the cascaded two classifiers is shown in Fig. 2.
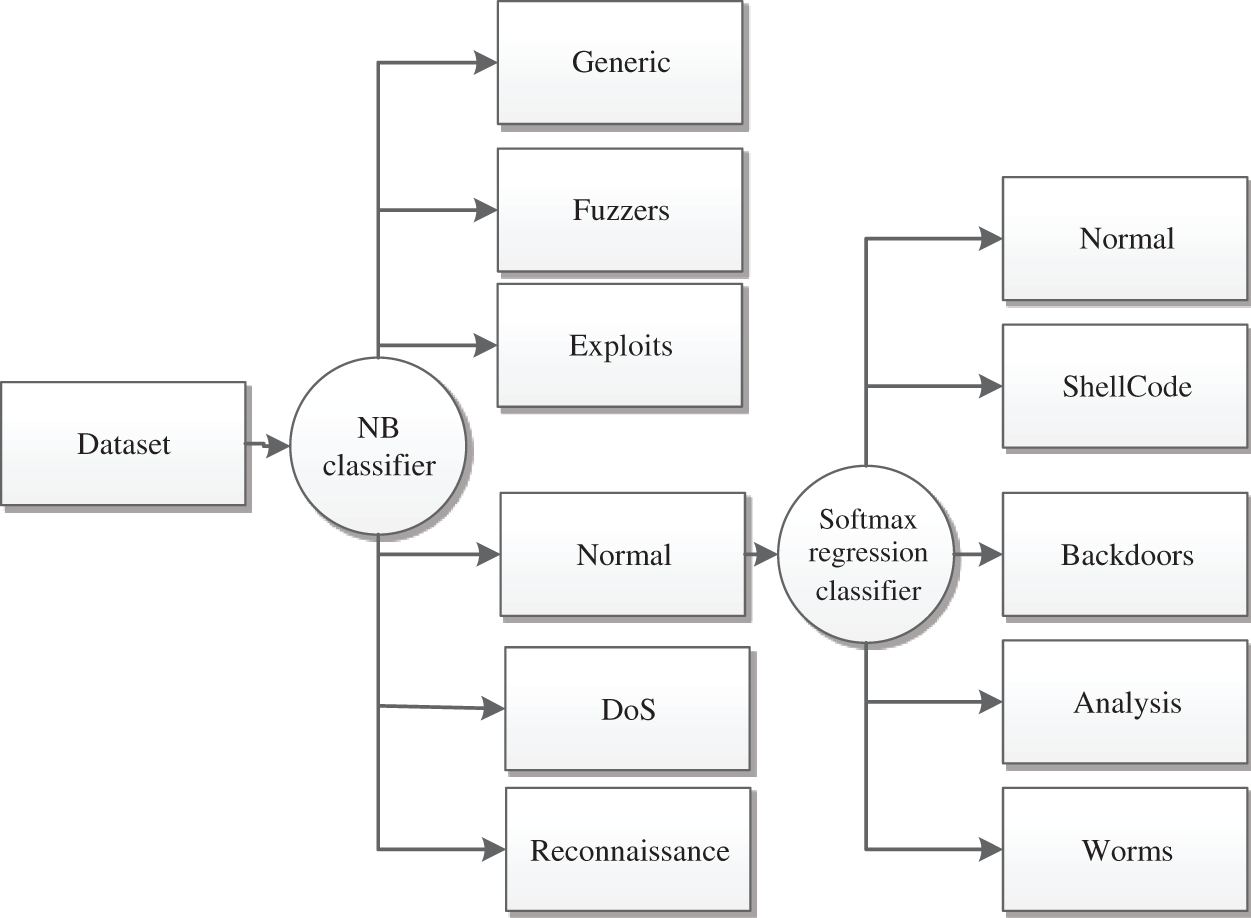
Figure 2: NB-SR classifier structure
Here, the NB classifier divides the data into 6 categories. The data labeled as Normal enters the softmax regression classifier, and the softmax regression classifier performs the subsequent classification. Since the number of Backdoors, Analysis, Shellcode and Worms samples is small in both the training set and the test set, and naïve Bayes has a poor processing effect on unbalanced data, the result will be misclassified. The category is sent to the next classifier, so the NB classifier is used as the first classifier, and the softmax regression classifier is the second classifier; finally, the classification results of the nine intrusion attacks are obtained.
The entire RP-NBSR model is divided into two phases: training and application. In the training phase, ReliefF-P extracts features from the tagged training sample set and obtains a new feature subset for training the NBSR classifier. In the application phase, the data are processed and sent to the trained NBSR classifier for classification. By a series of processes, a reasonable collection of network event classifications is finally obtained.
To evaluate the performance of the proposed model, we compared the precision, recall, and F1 scores of the existing machine learning model with the proposed RP-NBSR model using the UNSW-NB15 dataset. For numerical analysis, we used Python, and we performed test instances using logistic regression (LR), NB, decision tree (DT), SVM and RP-NBSR models and obtained the results in simulations. The operating system used in the experiment was 64-bit Windows 7 Professional edition. The CPU frequency was 2.4 GHz, memory was 4 GB, and 300 GB of hard disk storage was used.
One of the most important evaluation criteria in the intrusion detection model of misuse detection technology is the missing detection rate. The main reason for an increase in the miss detection rate in the existing intrusion detection models is that the dataset in the training stage is too old to effectively identify new intrusion attacks and therefore misjudges them as normal behaviors. In the current network environment, most intrusion detection models are based on the KDD Cup 1999 dataset. KDD Cup 1999 is a data set used in the KDD competition in 1999 and has a history of 20 years. Its dataset lacks many key features, and it cannot comprehensively summarize the current network environment from the aspects of collection mode, collection duration, or sample type. If there is no known intrusion behavior in the network attack samples, then the unknown intrusion behavior will make the misuse detection model and improve the rate of missed detection. UNSW-NB15 is a relatively new intrusion detection dataset that has a comprehensive collection of attack types. Tab. 1 shows a comparison of the two datasets.
Table 1: KDD Cup 1999 Date vs. UNSW-NB15
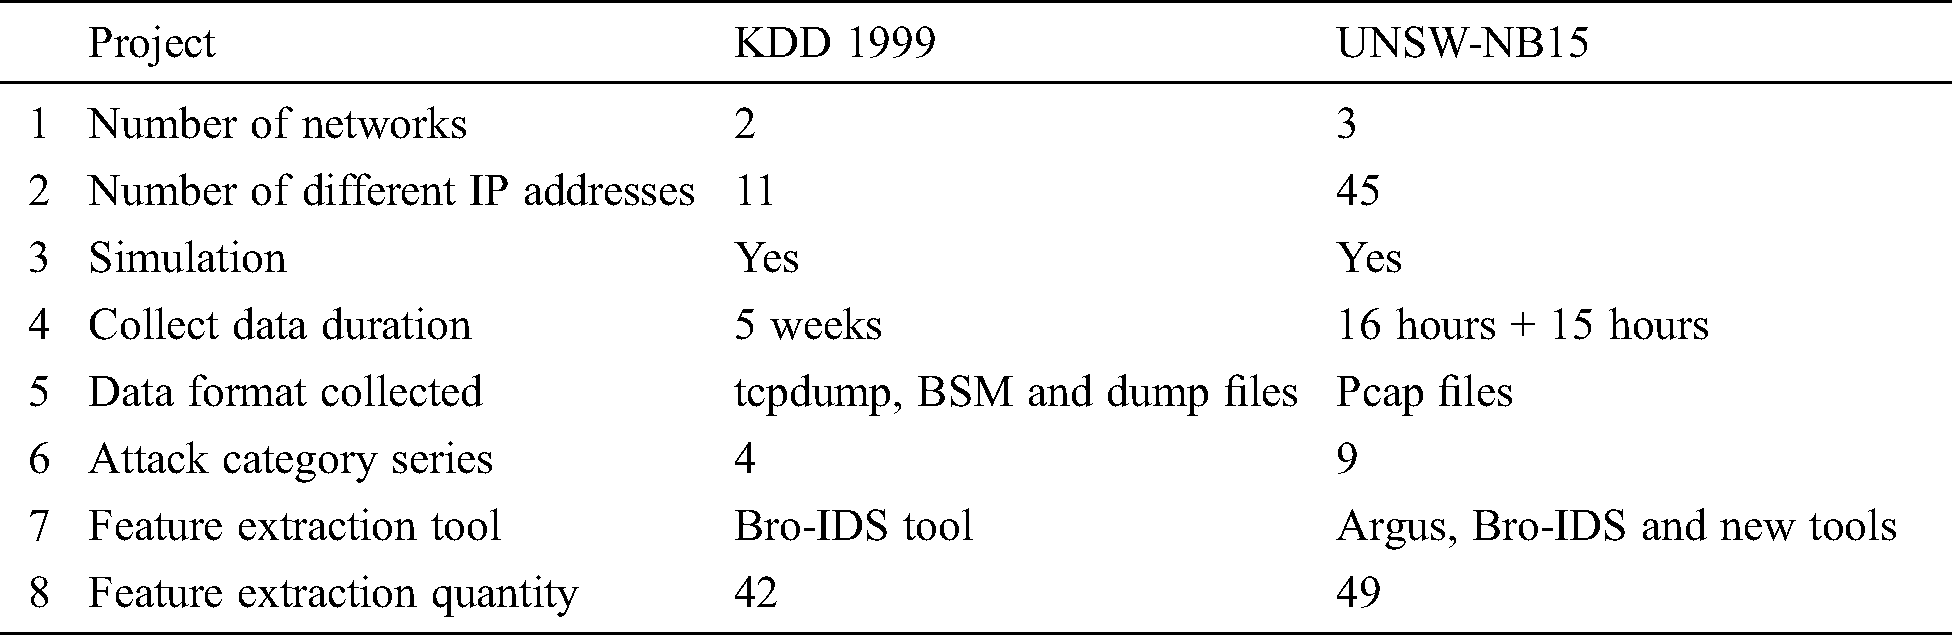
In this paper, the UNSW-NB15 dataset is used to train the intrusion detection model. The original network packet of the UNSW-NB15 dataset [14,15] was created by the Australian Centre for Cyber Security (ACCS) network-wide laboratory in 2015. The Tcpdump tool is used to capture 100 GB of raw traffic. The most significant feature is the inclusion of a contemporary covert attack method that can fully reflect the real situation of contemporary network traffic.
The dataset has nine series of attacks: Backdoors, Exploits, Shellcode, Fuzzers, DoS, Generic, Analysis, Worms and Reconnaissance. Tab. 2 lists the types of attacks in the UNSW-NB15 dataset.
Table 2: Distribution of attack types in UNSW-NB15 dataset

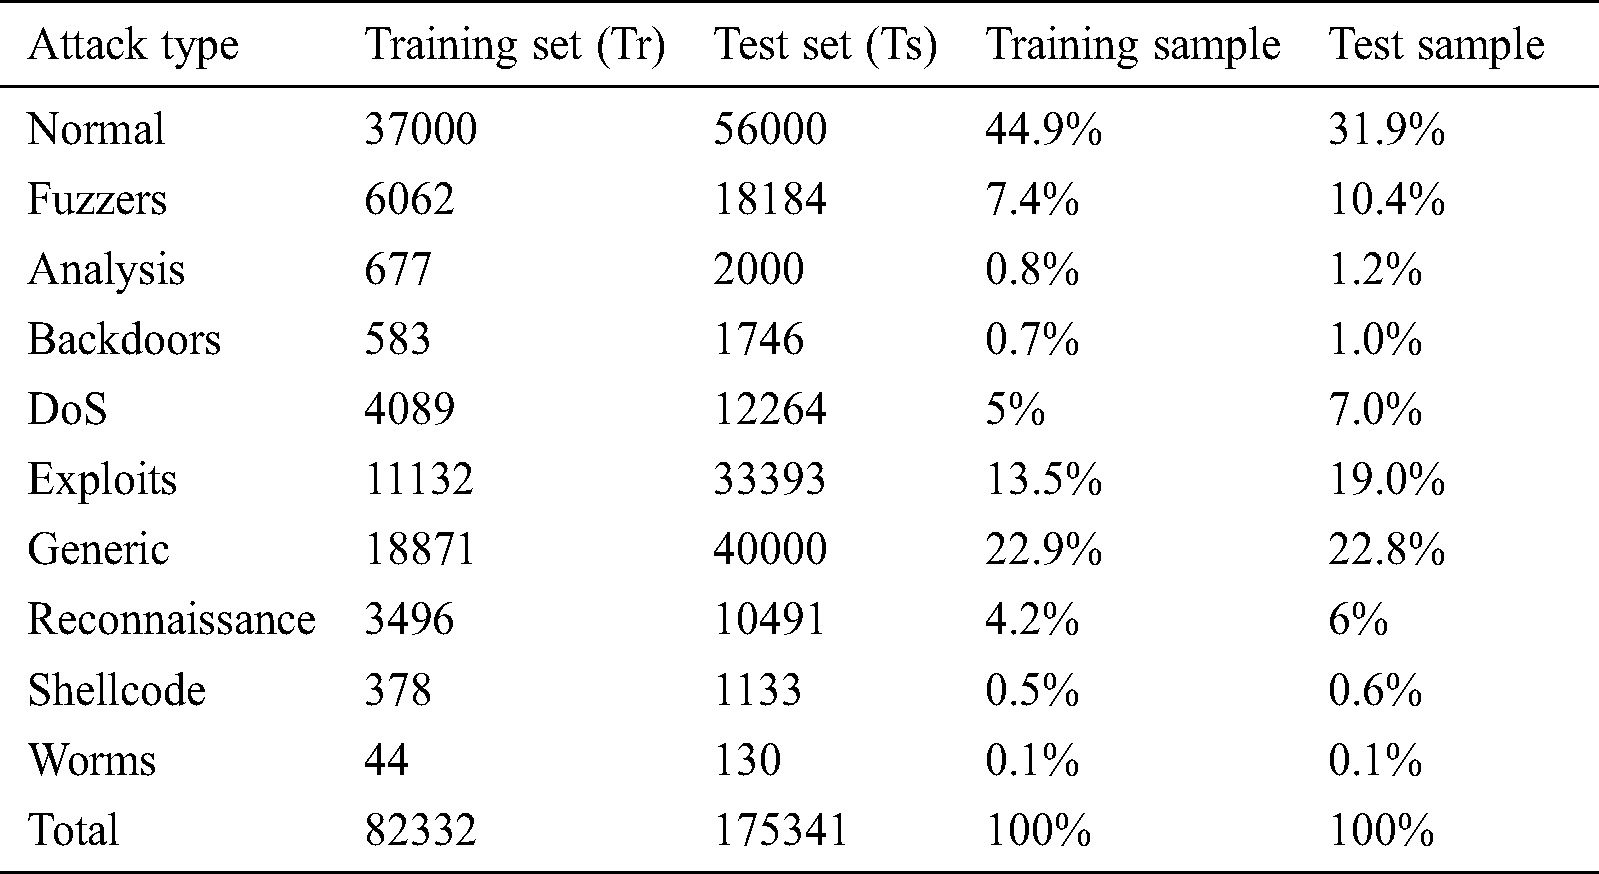
From the above original data set, we find that there are only 1511 cases of Shellcode attack samples and 174 cases of Worms attack samples in the whole dataset. However, there are 100,000 or millions of generic and normal samples, and the gap is very wide. To prevent the problem that the classifier deviates from the large data class due to unbalanced data training, the proposed model uses the UNSW-NB15 dataset as the training set and testing set in model training, as shown in Tab. 3.
Table 3: Distribution of attack types in Training set and Testing set
In our analysis, we first used the proposed ReliefF-P algorithm to extract features. The data are divided into single subsets according to the sample category, and the sample subsets are reordered. Taking the class of worms as an example, we normalize the feature attributes with large extremum differences such as dur, spkts, dpkts, sbytes, dbytes, rate, sload, dload, sloss and dloss. We found that stcpb, dtcpb and tcprtt have the largest negative weights. These attributes have a great negative impact on the classification of Worms, so these attributes are removed. The correlation between some features is shown in Fig. 3.
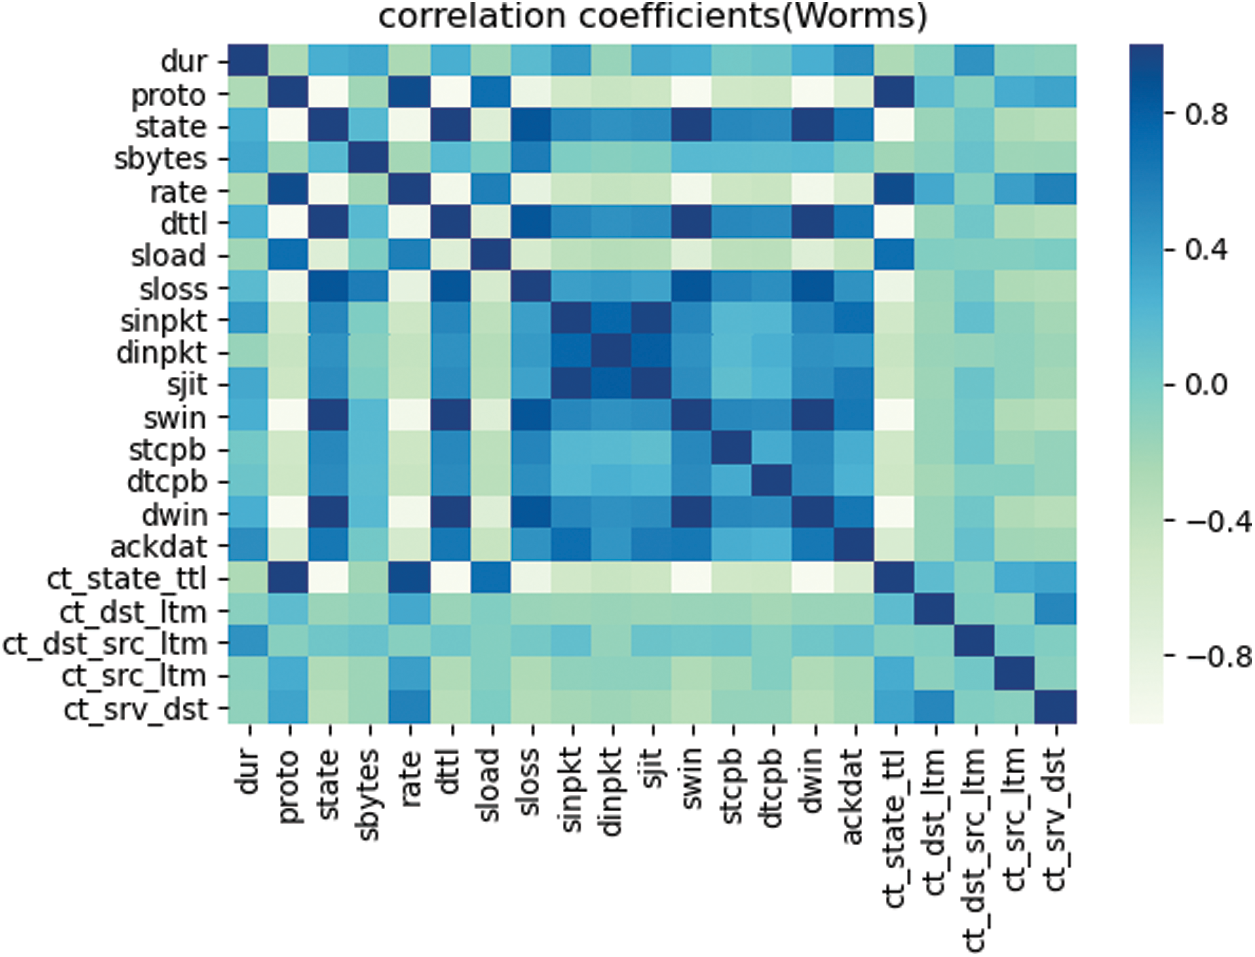
Figure 3: Worms class attribute correlation
When the absolute value of the correlation degree of some features in the Worms category is closer to 0, it means that the correlation between the two attributes is smaller. When the absolute value of the correlation degree of some features in the Worms category is closer to 1, it means that the correlation between the two attributes is greater.
Tab. 4 shows the feature subset after processing using ReliefF-P.
Table 4: Processed feature subsets

The experimental results show that the Relieff-P algorithm can effectively reduce the dimensionality of the data.
We compared the true positive rate (TP) of the proposed model with NB and softmax regression (SR). Fig. 4 shows a comparison of the TP of the proposed model with that of the NB model after the first-stage classification.
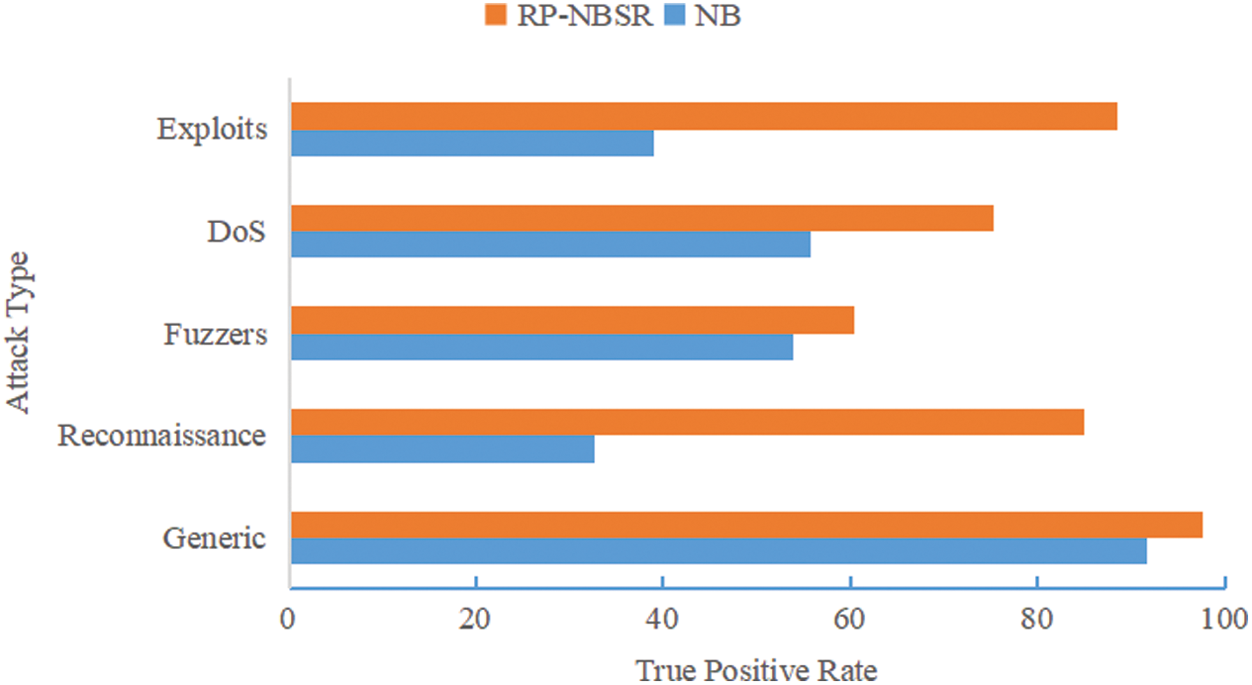
Figure 4: The true positive rate of RP-NBSR and NB
Fig. 5 shows a comparison of the TP of the proposed model with that of the NB model after the second-stage classification.
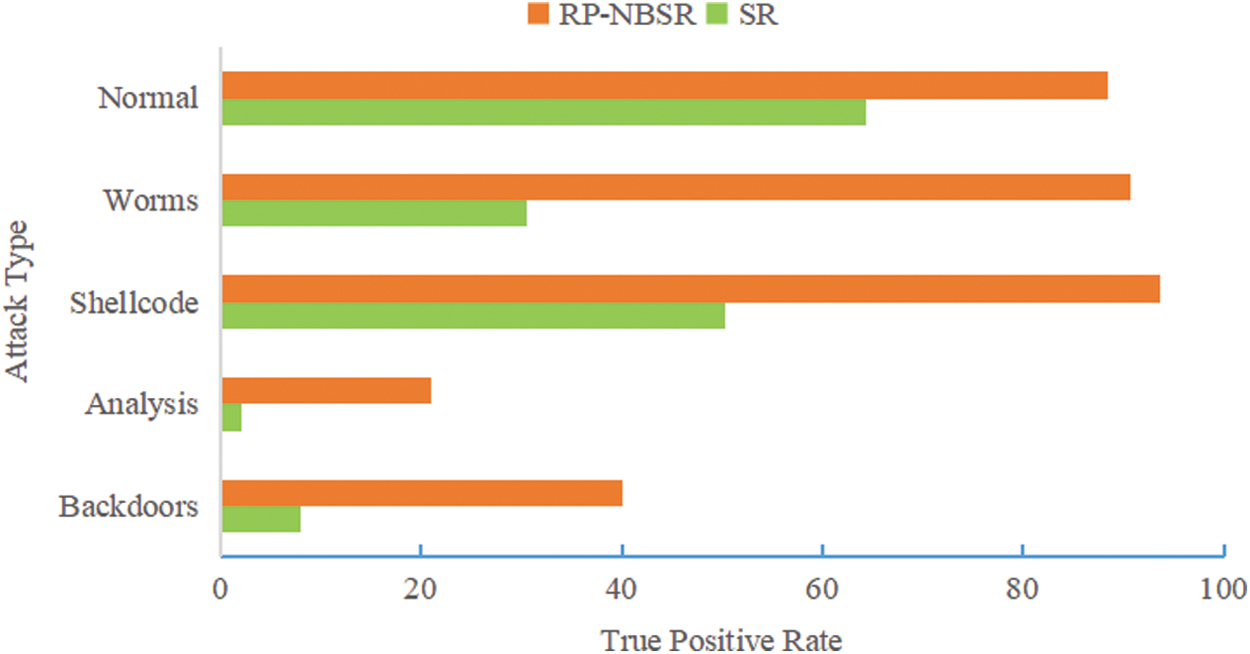
Figure 5: The true positive rate of RP-NBSR and SR
As seen from Figs. 4 and 5, the accuracy of the proposed model in the attack categories of Analysis, Backdoors, Worms, Shellcode, Exploits and Reconnaissance is significantly improved.
Then, we systematically compared the detection effect of the RP-NBSR model and other other machine learning models, as shown in Tab. 5.
Table 5: The detection effect of RP-NBSR model and other machine learning models

Considering the precision, F1 score, and false positive rate (FPR), the RP-NBSR model is better than the other models.
In this paper, we proposed a new RP-NBSR model for network attack detection. In the proposed model, the ReliefF-P algorithm is used for feature extraction, and the result set is trained by a naïve Bayes classifier and softmax regression classifier. The ReliefF-P feature selection algorithm participates in the correlation calculation between features in the evaluation of features. When the number of iterations or the number of nearest neighbor samples changes, the weight of the unrelated features remains unchanged. The ReliefF-P feature selection algorithm can remove irrelevant features and has the characteristics of stability, easy expansion, strong effectiveness, and high operating efficiency.
From a numerical analysis, we saw that the proposed model can provide a better detection effect than the LR, NB, DT, and SVM models. However, the performance of this algorithm still has much room for improvement. How to identify unknown attack types more accurately needs further research.
Funding Statement: This work was partly supported by the National Natural Science Foundation of China (61300216, Wang, H, www.nsfc.gov.cn).
Conflicts of Interest: The authors declare that they have no conflicts of interest to report regarding the present study.
1. Netinfo Security. (2018). China Internet Station Development Status and Security Report (2018). China, . [Online]. Available: https://www.isc.org.cn/editor/attached/file/20180711/20180711201225_67539.pdf. [Google Scholar]
2. N. Chaabouni, M. Mosbah, A. Zemmari, C. Sauvignac and P. Faruki. (2019). “Network intrusion detection for IOT security based on learning techniques,” IEEE Communications Surveys and Tutorials, vol. 21, no. 3, pp. 2671–2701. [Google Scholar]
3. M. Krzysztoń and M. Marks. (2020). “Simulation of watchdog placement for cooperative anomaly detection in Bluetooth Mesh Intrusion Detection System,” Simulation Modelling Practice and Theory, vol. 101, pp. 102041. [Google Scholar]
4. A. Bivens, C. Palagiri, R. Smith, B. Szymanski and M. Embrechts. (2002). “Network-based intrusion detection using neural,” Intelligent Engineering Systems through Artificial Neural Networks, vol. 12, no. 1, pp. 579–584. [Google Scholar]
5. L. L. Wang, J. H. Liu and X. M. Fu. (2018). “An intrusion detection method based on extreme learning machine and modified K-means,” Computer Engineering & Science, vol. 40, no. 8, pp. 1398–1404. [Google Scholar]
6. W. L. Al-Yaseen, Z. A. Othman and M. Z. A. Nazri. (2017). “Multi-level hybrid support vector machine and extreme learning machine based on modified K-means for intrusion detection system,” Expert Systems with Applications, vol. 67, pp. 296–303. [Google Scholar]
7. K. C. Khor and T. S. Phon-Amnuaisuk. (2012). “A cascaded classifier approach for improving detection rates on rare attack categories in network intrusion detection,” Applied Intelligence, vol. 36, no. 2, pp. 320–329. [Google Scholar]
8. R. S. S. K. Jeena. (2019). “Stroke diagnosis from retinal fundus images using multi texture analysis,” Journal of Intelligent & Fuzzy Systems, vol. 36, no. 3, pp. 2025–2032. [Google Scholar]
9. Z. Abbasi and M. Rahmani. (2019). “An instance selection algorithm based on ReliefF,” International Journal on Artificial Intelligence Tools, vol. 28, pp. 14. [Google Scholar]
10. M. Parto, C. Saldana and T. Kurfess. (2020). “Real-time outlier detection and bayesian classification using incremental computations for efficient and scalable stream analytics for IoT for manufacturing,” Procedia Manufacturing, vol. 48, pp. 968–979. [Google Scholar]
11. I. Wickramasinghe and H. Kalutarage. (2020). “Naive Bayes: Applications, variations and vulnerabilities: A review of literature with code snippets for implementation,” Soft Computing, vol. 24, no. 19, pp. 1–17. [Google Scholar]
12. K. Adem, S. Kılıçarslan and O. Comert. (2019). “Classification and diagnosis of cervical cancer with softmax classification with stacked autoencoder,” Expert Systems with Applications, vol. 115, pp. 557–564. [Google Scholar]
13. V. Shankar and K. Singh. (2019). “An intelligent scheme for continuous authentication of smartphone using deep auto encoder and softmax regression model easy for user brain,” IEEE Access, vol. 7, pp. 48645–48654. [Google Scholar]
14. N. Moustafa and J. Slay. (2016). “The evaluation of network anomaly detection systems: Statistical analysis of the UNSW-NB15 data set and the comparison with the KDD99 data set,” Information Systems Security, vol. 25, pp. 18–31. [Google Scholar]
15. V. Kumar, A. Das and D. Sinha. (2020). “Statistical analysis of the UNSW-NB15 dataset for intrusion detection,” Advances in Intelligent Systems and Computing, vol. 999, pp. 279–294. [Google Scholar]
 | This work is licensed under a Creative Commons Attribution 4.0 International License, which permits unrestricted use, distribution, and reproduction in any medium, provided the original work is properly cited. |