DOI:10.32604/csse.2021.014680
| Computer Systems Science & Engineering DOI:10.32604/csse.2021.014680 | |
| Article |
A Network Security Risk Assessment Method Based on a B_NAG Model
1School of Computer Science & Technology, Henan Polytechnic University, Jiaozuo, 454000, China
2Office of Educational Administration, Jiaozuo University, Jiaozuo, 454000, China
3Department of Computer Science, University College London, London, United Kingdom
*Corresponding Author: Zihao Shen. Email: szh@hpu.edu.cn
Received: 08 October 2020; Accepted: 09 January 2021
Abstract: Computer networks face a variety of cyberattacks. Most network attacks are contagious and destructive, and these types of attacks can be harmful to society and computer network security. Security evaluation is an effective method to solve network security problems. For accurate assessment of the vulnerabilities of computer networks, this paper proposes a network security risk assessment method based on a Bayesian network attack graph (B_NAG) model. First, a new resource attack graph (RAG) and the algorithm E-Loop, which is applied to eliminate loops in the B_NAG, are proposed. Second, to distinguish the confusing relationships between nodes of the attack graph in the conversion process, a related algorithm is proposed to generate the B_NAG model. Finally, to analyze the reachability of paths in B_NAG, the measuring indexs such as node attack complexity and node state transition are defined, and an iterative algorithm for obtaining the probability of reaching the target node is presented. On this basis, the posterior probability of related nodes can be calculated. A simulation environment is set up to evaluate the effectiveness of the B_NAG model. The experimental results indicate that the B_NAG model is realistic and effective in evaluating vulnerabilities of computer networks and can accurately highlight the degree of vulnerability in a chaotic relationship.
Keywords: Network attack graph; Bayesian network; state transition; reachability; risk assessment
Computer networks play an indispensable role in people’s productivity and daily life. However, these networks face a variety of cyberattacks, most of which are highly contagious and destructive. These attacks threaten the network security of devices, affecting the popularization of networks and even severely damaging information security [1–3].
According to the “Development Status of China Internet Sites and Security Report in 2018” [4], the National Computer Network Emergency Response Technical Team of China (CNCERT) discovered that over 1.254 million Internet of Things smart devices was attacked successfully and therefore had a great threat to the security of networks. Moreover, in 2018, CNCERT discovered over 2.05 million cyberattacks continuing a trend of high growth over the previous six years. A survey of these attacks announced that the number of applications had quickly increased and was nearly three times higher than the percentage in 2016.
In recent years, researchers have introduced methods based on Bayesian probabilities in evaluating vulnerabilities of attack graphs [5–7]. Bayesian networks are capable of representing nondeterministic relationships and can be used to quantify the correspondences within attack graphs. Therefore, methods of effectively combining a Bayesian network with an attack graph for network vulnerability assessment have become an important focus of research.
Recently, lots of scholars analyzed vulnerabilities of networks by using attack graph. Because of the asymmetric information between attackers and defenders, the detection of Zero Day attacks is still challenging. Revealing Zero Day attacks based on attack paths is a better strategy than targeting them individually.
Sun et al. [8] implemented the system ZePro to identify Zero Day attack paths by adopting the probabilistic approach. With evidence of intrusion as input, the Bayesian network used in this system can calculate the infection probabilities concerning object instances.
The dynamic defense framework was presented to select best countermeasures against diverse attack damage costs [9]. To calculate these costs, a new defense-centric model was designed on the basis of service dependency graphs. The current approaches suffer from some limitations. For example, only static countermeasure effectivity and static countermeasure deployment costs are considered, but the negative impacts of the possible countermeasures on service quality are neglected [10]. These above-mentioned restrictions may lead an industrial control system (ICS) to choose improper countermeasures and deployment locations. And then they can degrade the network performance and frustrate legitimate users.
The construction and analysis on inference rules of attack graph was presented by Garg et al. [11]. They developed a methodology for prioritizing individual vulnerabilities and attack paths using a PageRank model. The results were verified by using a Markov model, and showed that the methodology outperformed lots of current technologies [12] about risk analysis. However, the relevant experiment was lack of specific indicators, and the results were not convincing.
As Zhang et al. [13] said, dynamic risk analysis is an important component of protecting network security. However, risk assessment methods used in network systems are not very appropriate for ICSs due to their unique characteristics. That paper proposed a multilevel network model including attack functions and incidents based on Bayesian. On this basis, it proposed a new risk incident prediction method, and designed a dynamic security risk assessment method which can assess the risk caused by unknown attacks [14]. Moreover, a quantification method was presented to further calibrate the accuracy of assessment. Finally, to test and verify the method, the simplified control system was simulated in MATLAB.
On the basis of previous researches, the paper presents a Bayesian network attack graph (B_NAG) model and an algorithm to assess network vulnerabilities. In this paper, probability theory is introduced into the resource attack graph (RAG) model and converted into the corresponding B_NAG model. The reachability probability of nodes can be calculated, and the final reachability probability of attack paths can be calculated. Finally, the related posterior probability can be calculated, and enable network security administrators to assess network security more accurately and effectively.
Attack graph is a method to analyze all sequences of vulnerabilities exploited by attackers. Attacks can be occurred against all available node status and vulnerability, and all sequences can be constructed into a directed graph. The purpose of the RAG model is to characterize an attack sequence launched against the attacker’s intentions according to Bayesian probability calculations to help network administrators properly understand the security status of their networks. The RAG model is constructed as described below.
Definition 1 The graph
•
• S0 ∈ S denotes the initial resource state nodes which are occupied by the attacker.
•
•
• Γ is the node state discriminant function.
• L is the logical relationships set between nodes, and
•
Definition 2 Attack path: In the RAG, if there exists a status sequence
Definition 3 Attack behavior: One attack behavior can be denoted by a four-tuple of the form
Definition 4 State transition: One state transition is denoted by a three-tuple of the form
To remove loops in an attack graph, an attack difficulty metric is introduced. In the Common Vulnerability Scoring System (CVSS), three basic indexes are used to characterize vulnerabilities: the access vector index, the access complexity index, and the authentication index, which are denoted by Acc_com, Acc_vec and Auth respectively. The values of these indexes associated with different levels of severity of a vulnerability are shown in Tab. 1.

Based on these indexes, the availability score of a vulnerability used in the CVSS is defined as
An attack becomes more difficult to perform successfully as the value of
In the generation of the RAG, a loop may arise that leads to repeated traversals over a given node. It has a great influence on Bayesian probability calculation in network security assessment. In order to overcome the problem, the algorithm E-Loop is proposed to eliminate loops in the RAG. The specific steps are as follows:

Fig. 1 shows an RAG built as described above. There are two loops,
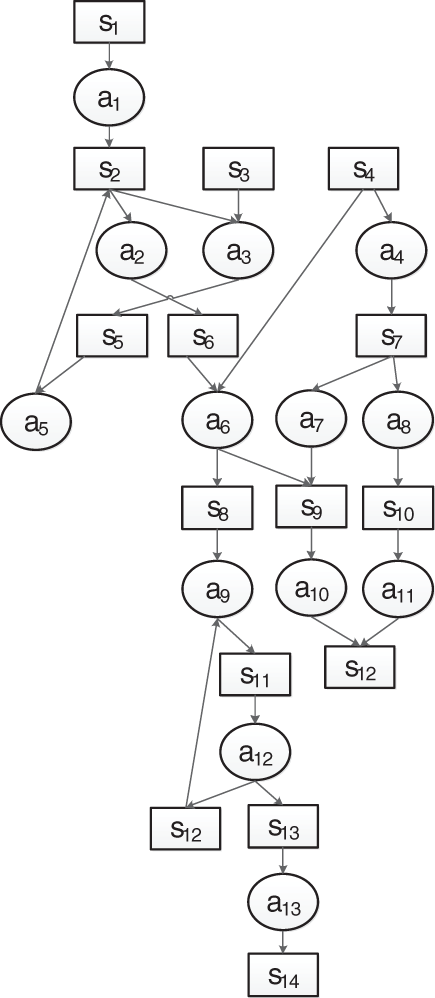
Figure 1: RAG
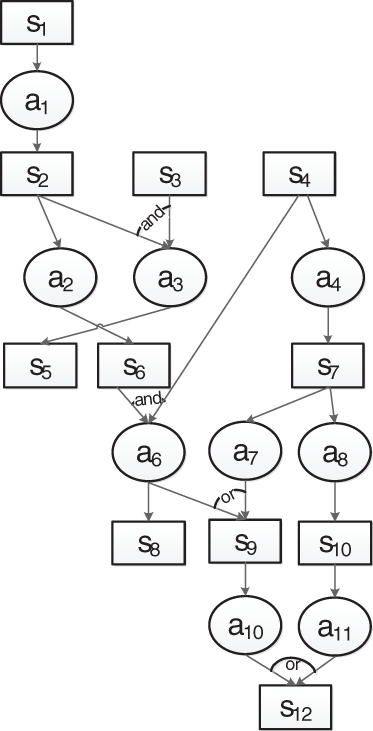
Figure 2: Acyclic RAG
5 Probability Calculation in the B_NAG Model
In the B_NAG, the probability of each node is only constrained by its parent nodes, and the node remains conditionally independent of the others. In the RAG, the transition of node state is only correlated to whether the relevant resource has been occupied or not. A child node can occur a state transition only if its parent nodes are occupied. Thus, the state transition needs be associated with conditional independence in the B_NAG.
Tab. 2 presents the corresponding relationship between an Ac_RAG and a B_NAG. Although these graphs have corresponding structures, differences exist in their certain nodes. The detailed implementation described below is based on a B_NAG.
Table 2: Corresponding relationship

5.1 Implementation of the B_NAG Model
Definition 5 The resulting resource state node and the conditional resource state node: The resource state node where the attack has been occurred successfully is called the resulting resource state node; When the attack condition is satisfied, the required resource state node is called the conditional resource state node.
Definition 6
As illustrated in the example shown in Fig. 2, an RAG consists of four structures: a series structure, a parallel
(1) Series structure: By deleting the attack behavior node
(2) Parallel
(3) Parallel
(4) Mixed structure: The parent nodes
After this conversion process, each edge in the converted B_NAG represents an attack behavior and has a weight that describes the correlation between the two resource state nodes connected by that edge. It can be observed from the converted B_NAG shown in Fig. 3 that
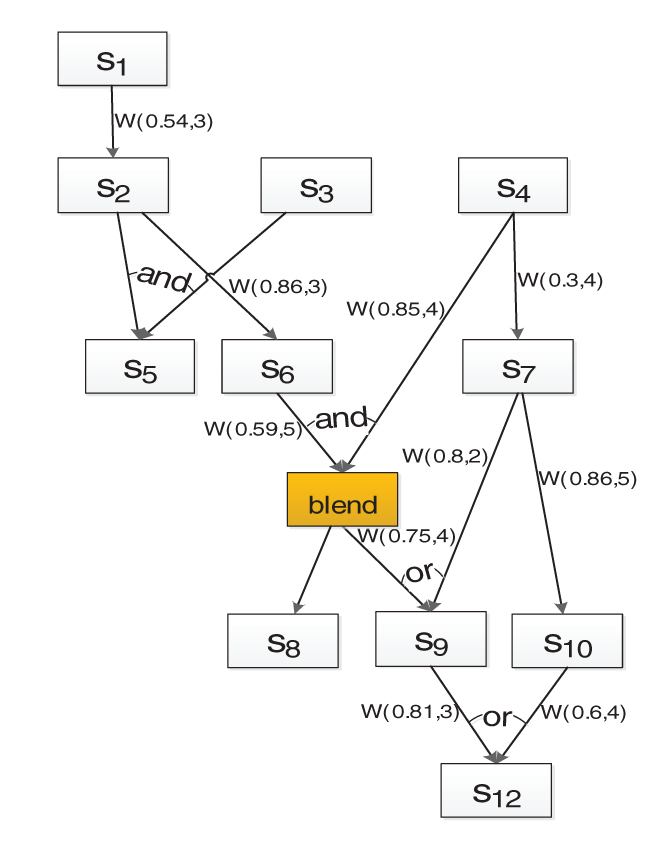
Figure 3: B_NAG
To clarify the process, the conversion algorithm is proposed as follows.

5.2 Calculation of the Probability of Reaching a Node Based on the B_NAG
The direct parent nodes of node S are denoted here by
The state transition index
Here,
Accordingly, the state transition index
It can be concluded from Eq. (6) that resource state nodes in the B_NAG interact with each other, so the probability of reaching a given node cannot be analyzed only by traditional inference in the vulnerability analysis; instead, these state transitions must also be considered deeply. To solute this problem, the index of state transition is used to consider the probability of node state transitions when assessing vulnerabilities of the network.
Here,
In Algorithm 3, all nodes are traversed firstly. The parent nodes

In the example shown in Fig. 3, if
If the weights W, the values of
In a similar way, the following is obtained from Eq. (7): the reachability probabilities of
5.3 Posterior Probability Calculation Based on the B_NAG
In a B_NAG, it is not possible to monitor changes in the network security conditions in real time when the probabilities of resource state nodes attacked by attackers are calculated. Based on the detected the precondition and the available information of security incidents, the posterior probabilities should be calculated, and these related node probabilities can then be updated to achieve real-time monitoring. The equation for calculating a posterior probability is as follows:
Suppose that
In this case, the probability of reaching node
6.1 Experimental Network Environment
To verify that the given method is feasible and effective, the experimental environment shown in Fig. 4 was created. The experimental network includes five hosts: the attacking machine, a web server, a file server, an e-mail server, and a database server. For ease of description, these hosts are represented by the letters A, W, F, E and D, respectively. W opens the telnet service, F opens the File Transfer Protocol (FTP) service, E opens the FTP and Hypertext Transfer Protocol (HTTP) services, and D opens the Oracle service. The final aim of attacker A is to obtain root permissions for host D, but the firewall allows the foreign host A access to only the telnet service of host D and denies other external access. Similarly, host E is allowed access to only the Oracle service of host D, while the other three hosts can openly gain access to each other’s services. Host W can directly access host E; when it obtains access to the two services provided by host E, it can, in turn, gain direct access to the Oracle service of host D.
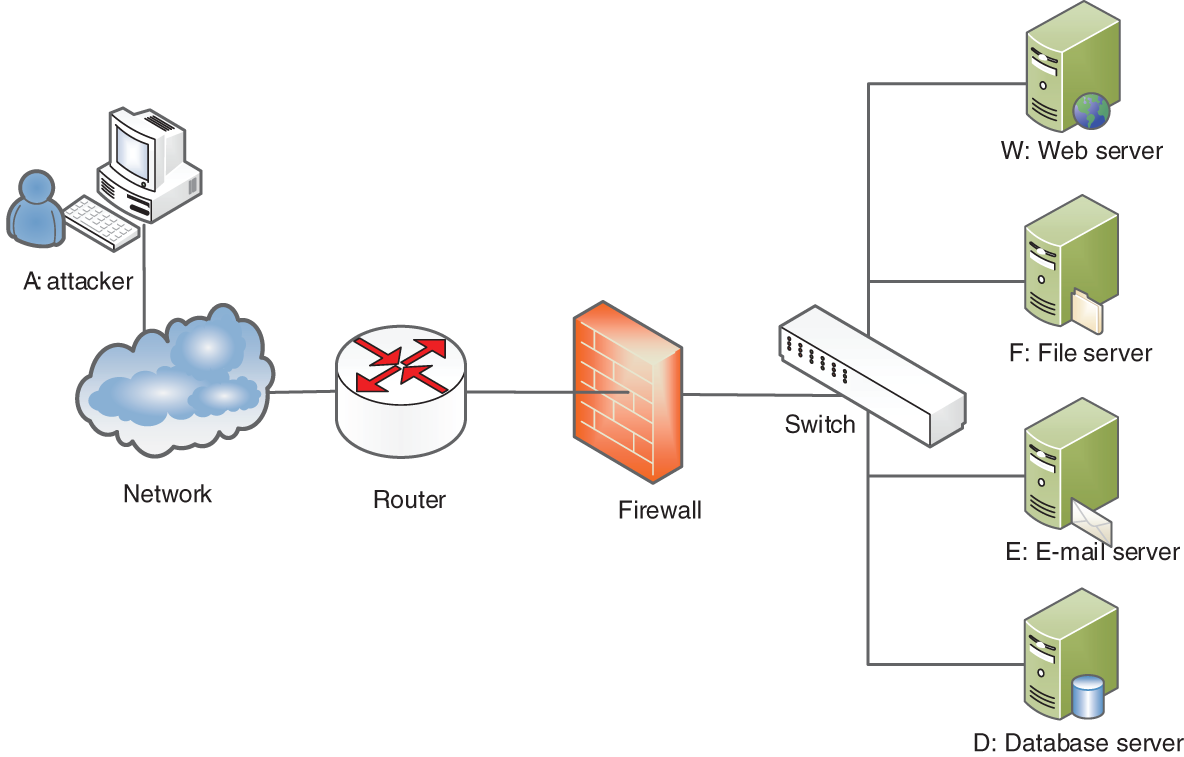
Figure 4: Topological graph of the experimental network
Information about the internal host is shown in Tab. 3.
Table 3: Information about the internal host

6.2 Experimental Results and Analysis
After loops have been removed as previously described during the generation of the RAG in accordance with the attack graph model and the topological graph of the experimental network, the corresponding descriptions of the attack behavior nodes are as shown in Tab. 4. These attacks are related to the services provided by the hosts and their vulnerabilities.
Table 4: Attack behavior information of the experimental attack graph

After the application of the conversion algorithm based on the topological graph of the experimental network to replace the attack behavior nodes mentioned in Tab. 4 with corresponding edges, the converted B_NAG is as shown in Fig. 5.
As shown in Fig. 5, each host node must win the trust of another host through a service provided by that other host, corresponding to a parallel “and” structure in the graph. When one host opens two services, the trust of that host can be obtained by gaining access to either one of its services, so the relationship between the possible attacks against that host is “or”. A node with a mixed relationship can directly access the service provided by another host by crossing over the host it is attacking once it gains access to both services of the target host. A blend node is introduced to address the corresponding mixed relationship in this graph.
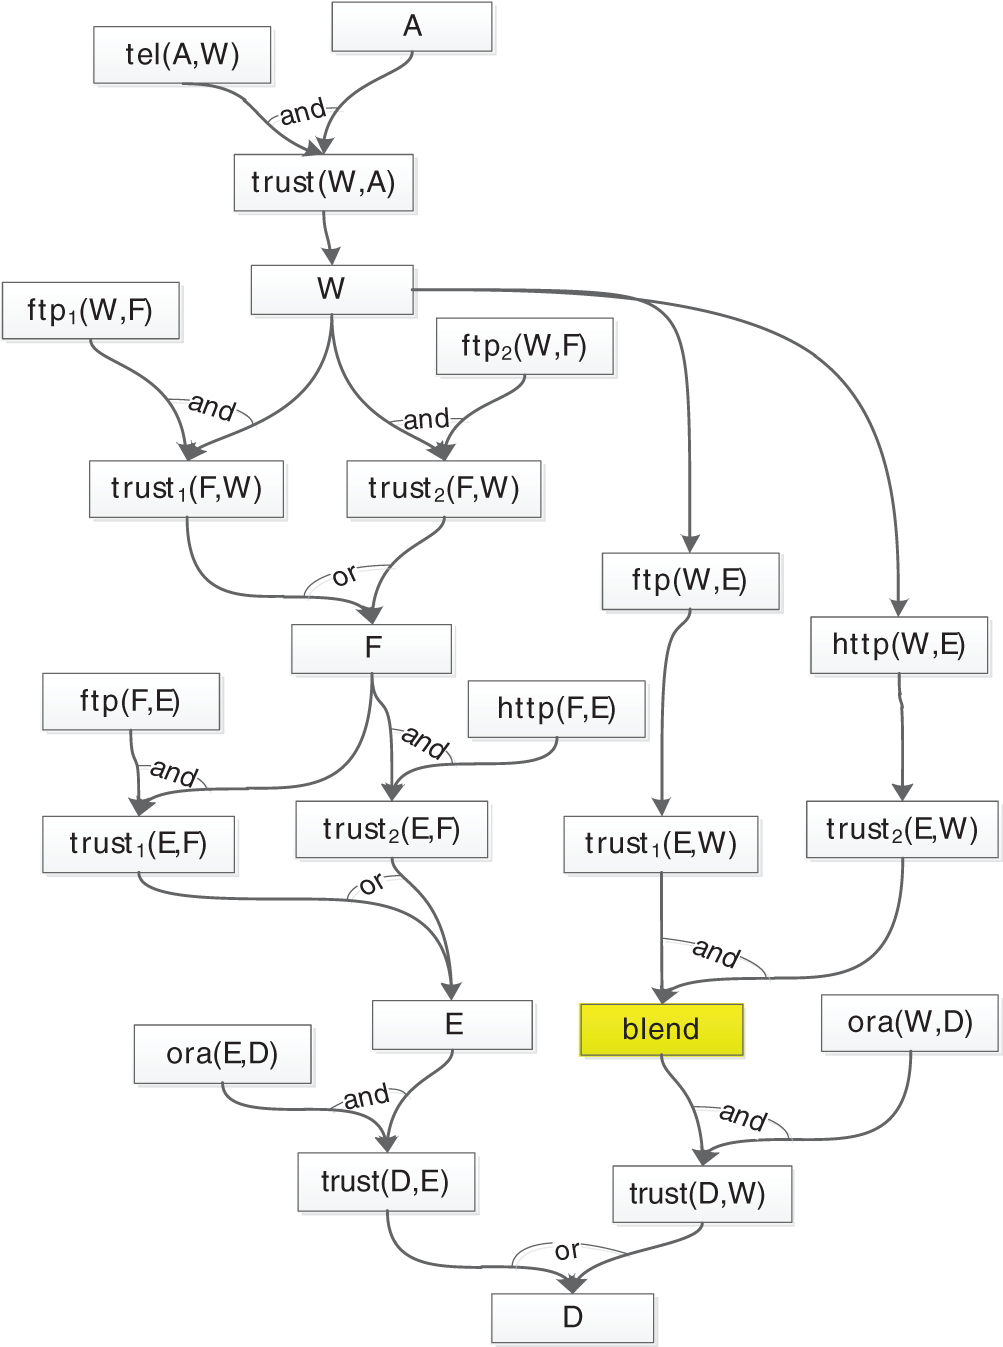
Figure 5: Example of a Bayesian network attack graph
There are 5 paths in Fig. 5 through which the target host D can be reached. The attack path information and the probabilities of reaching each whole path are shown in Tab. 5. P1 denotes the probability of reaching the whole path as calculated by considering the state transition index as proposed in this paper, while P2 is the probability of reaching the whole path calculated without considering the state transition index.
Table 5: Attack path information for the example graph

Based on Tab. 5, the probability of reaching each host node is plotted in Fig. 6.

Figure 6: Path probabilities under P1 and P2 (a) P1 (b) P2
As shown in Fig. 7, the hosts attacked on Path1 and Path2 (and on Path3 and Path4) are the same; the only difference lies in the service of host E that is accessed. Path1 accesses the FTP service of host E, while Path2 accesses the HTTP service of host E. The final probabilities of reaching the whole path for Path1 and Path2 are 0.03247 and 0.05784, respectively, as calculated using the proposed algorithm based on the state transition index. Obvious differences can be seen between the two paths in terms of the probability of the attack successfully proceeding from host F to host E, as shown in Fig. 7a. By contrast, when the state transition index is not considered, the final probabilities for Path1 and Path2 are 0.4768 and 0.4789, respectively, and there is no meaningful difference in the probability of proceeding from host F to host E, as shown in Fig. 7b. With the proposed algorithm, although the reference value of the probability for each node decreases, the differences in probability associated with attacking different nodes are fully apparent. Therefore, this approach is effective in enabling network security administrators to perform useful analyses.

Figure 7: Probabilities of Path1,2 under P1 and P2 (a) P1 (b) P2
As shown in Fig. 8, the traditional computational method for Path5, which includes a mixed relationship, is to calculate all “and” nodes and “or” nodes individually. This not only requires a large number of calculations but also ignores the correlations between nodes.

Figure 8: Probability of Path5 under P1 and P2 (a) P1 (b) P2
The mixed node approach introduced herein provides better calculation results than the traditional method, and it does so with fewer calculations. For the mixed relationship identified when host W attempts to gain access to host E, the probability calculated by considering the state transition index effectively reflects the degree of hazard of the associated vulnerability, making this type of vulnerability more likely to be noticed by the network security administrator.
Improving the accuracy of network vulnerability assessments is an important topic in the field of network security. This paper presents a B_NAG model and an associated vulnerability algorithm as well as the algorithm E-Loop to eliminate loops in an attack graph. To effectively capture mixed relationships between nodes during the process of converting a RAG into a B_NAG, the Alg-AGTrans algorithm is also proposed. In addition, the indexes of node attack complexity and node state transition are introduced into the calculation of the probability of reaching each node, and the posterior probabilities are also calculated on this basis. The results of an experimental evaluation show that the model proposed herein can provide an accurate and effective assessment of network vulnerability. However, the proposed algorithm also has some shortcomings that should be addressed. For example, the effects of some factors, such as risk costs, are not considered when calculating the probability of reaching a node.
Funding Statement: This work was partially supported by the National Natural Science Foundation of China (61300216, Wang, H, www.nsfc.gov.cn).
Conflicts of Interest: The authors declare that they have no conflicts of interest to report regarding the present study.
1. V. Varadharajan, K. Karmakar, U. Tupakula and M. Hitchens. (2019). “A policy-based security architecture for software-defined networks,” IEEE Transactions on Information Forensics and Security, vol. 14, no. 4, pp. 897–912. [Google Scholar]
2. J. Ai, H. Chen, Z. Guo, G. Cheng and T. Baker. (2020). “Mitigating malicious packets attack via vulnerability-aware heterogeneous network devices assignment,” Future Generation Computer Systems-the International Journal of Escience, vol. 111, no. 2, pp. 841–852. [Google Scholar]
3. A. J. Gallo, M. S. Turan, F. Boem, T. Parisini and G. Ferrari-Trecate. (2020). “A distributed cyber-attack detection scheme with application to DC microgrids,” IEEE Transactions on Automatic Control, vol. 65, no. 9, pp. 3800–3815. [Google Scholar]
4. Netinfo Security. (2018). “China Internet Station Development Status and Security Report (2018),” China, . [Online]. Available: https://www.isc.org.cn/editor/attached/file/20180711/20180711201225_67539.pdf. [Google Scholar]
5. L. Muñoz-González, D. Sgandurra, A. Paudice and E. C. Lupu. (2017). “Efficient attack graph analysis through approximate inference,” ACM Transactions on Privacy and Security (TOPS), vol. 20, no. 3, pp. 1–30. [Google Scholar]
6. L. Munoz-Gonzalez, D. Sgandurra, M. Barrere and E. C. Lupu. (2019). “Exact inference techniques for the analysis of bayesian attack graphs,” IEEE Transactions on Dependable and Secure Computing, vol. 16, no. 2, pp. 231–244. [Google Scholar]
7. H. Wang, Z. Chen, J. Zhao, X. Di and D. Liu. (2018). “A vulnerability assessment method in industrial internet of things based on attack graph and maximum flow,” IEEE Access, vol. 6, pp. 8599–8609. [Google Scholar]
8. X. Sun, J. Dai, P. Liu, A. Singhal and J. Yen. (2018). “Using Bayesian networks for probabilistic identification of zero-day attack paths,” IEEE Transactions on Information Forensics and Security, vol. 13, no. 10, pp. 2506–2521. [Google Scholar]
9. A. Shameli-Sendi, H. Louafi, W. He and M. Cheriet. (2018). “Dynamic optimal countermeasure selection for intrusion response system,” IEEE Transactions on Dependable and Secure Computing, vol. 15, no. 5, pp. 755–770. [Google Scholar]
10. G. Hu and P. Qiao. (2016). “Cloud belief rule base model for network security situation prediction,” IEEE Communications Letters, vol. 20, no. 5, pp. 914–917. [Google Scholar]
11. U. Garg, G. Sikka and L. K. Awasthi. (2018). “Empirical analysis of attack graphs for mitigating critical paths and vulnerabilities,” Computers & Security, vol. 77, no. 4, pp. 349–359. [Google Scholar]
12. B. Li, G. J. Sutton, B. Hu, R. P. Liu and S. Chen. (2017). “Modeling and QoS analysis of the IEEE 802.11p broadcast scheme in vehicular ad hoc networks,” Journal of Communications and Networks, vol. 19, no. 2, pp. 169–179. [Google Scholar]
13. Q. Zhang, C. Zhou, N. Xiong, Y. Qin, X. Li et al. (2016). , “Multimodel-based incident prediction and risk assessment in dynamic cybersecurity protection for industrial control systems,” IEEE Transactions on Systems, Man, and Cybernetics: Systems, vol. 46, no. 10, pp. 1429–1444. [Google Scholar]
14. S. Wu, Y. Zhang and W. Cao. (2017). “Network security assessment using a semantic reasoning and graph based approach,” Computers & Electrical Engineering, vol. 64, no. 4, pp. 96–109. [Google Scholar]
 | This work is licensed under a Creative Commons Attribution 4.0 International License, which permits unrestricted use, distribution, and reproduction in any medium, provided the original work is properly cited. |