DOI:10.32604/csse.2021.015933
| Computer Systems Science & Engineering DOI:10.32604/csse.2021.015933 | |
| Article |
Generalized Class of Mean Estimators with Known Measures for Outliers Treatment
1Department of Mathematics, College of Science, King Khalid University, Abha, 62529, Saudi Arabia
2Statistical Research and Studies Support Unit, King Khalid University, Abha, 62529, Saudi Arabia
3Department of Mathematics, Faculty of Science, Al al-Bayt University, Mafraq, 25113, Jordan
4Department of Statistics, Michael Okpara University of Agriculture, Umudike, Abia, Nigeria
5Jammu and Kashmir Institute of Mathematical Sciences, Srinagar, 190008, India
*Corresponding Author: Amer Ibrahim Al-Omari. Email: alomari_amer@yahoo.com
Received: 14 December 2020; Accepted: 14 January 2021
Abstract: In estimation theory, the researchers have put their efforts to develop some estimators of population mean which may give more precise results when adopting ordinary least squares (OLS) method or robust regression techniques for estimating regression coefficients. But when the correlation is negative and the outliers are presented, the results can be distorted and the OLS-type estimators may give misleading estimates or highly biased estimates. Hence, this paper mainly focuses on such issues through the use of non-conventional measures of dispersion and a robust estimation method. Precisely, we have proposed generalized estimators by using the ancillary information of non-conventional measures of dispersion (Gini’s mean difference, Downton’s method and probability-weighted moment) using ordinary least squares and then finally adopting the Huber M-estimation technique on the suggested estimators. The proposed estimators are investigated in the presence of outliers in both situations of negative and positive correlation between study and auxiliary variables. Theoretical comparisons and real data application are provided to show the strength of the proposed generalized estimators. It is found that the proposed generalized Huber-M-type estimators are more efficient than the suggested generalized estimators under the OLS estimation method considered in this study. The new proposed estimators will be useful in the future for data analysis and making decisions.
Keywords: Product estimators; ratio estimators; regression estimators; ordinary least square; Huber M; mean squared error; efficiency;
MSC: 62D05; 62G35
For obtaining proficient estimators in sampling theory, a multiplicity of techniques has been used and the commonly one is the simple random sampling without replacement (SRSWOR) to obtain an estimator for the population mean, when auxiliary information is not available. But when auxiliary information is available and even has a relationship with study variable, there are lots of methods by which this auxiliary information can be incorporated viz., ratio, product, difference and regression, etc. Utilizing this auxiliary information for parameters will increase the estimation efficiency. The utilization of auxiliary information has been made in a number of ways for achieving the improved estimates of population parameters. Some latest uses of auxiliary information are provided in [1–4]. As data collected from different fields, which is the basis for statistical inference, most of the time, the data will not be symmetrical and may contain outliers. The latter can distort results since the classical methods are sensitive to outliers [5]. However, [6], and [7–9] have recommended different estimators that adopted different robust regression techniques when the correlation is positive. For more details of robust regression methods for obtaining mean estimation of sensitive variables by using auxiliary information, see [10–12]. In this study, we focus on a more generalized form of estimators when outliers are presented. On how to deal with that situation, we first proposed generalized estimators utilizing the auxiliary information of non-conventional measures of scattering using OLS and then finally adopting the Huber M-estimation technique on the suggested estimators, in the presence of outliers. Then, we adopted the Huber M-estimation instead of ordinary least square on the recommended generalized estimators in order to get valid findings so that our inference will be valuable for future analysis or application. Hence, the importance of our present paper is that this work uses the robust (Huber M) estimation method and non-conventional measures of dispersion, which can curb the influence of outliers in the estimation of population mean.
The rest of the paper is organized as follows. In Section 2 shows the generalized estimator, outliers present, negative correlation exist and the adaptation of the OLS method with the expressions of Bias and the mean squared error (MSE) derived up to the second degree of approximation. The generalized estimators based on adopting Huber M estimation instead of OLS and their bias and MSE equations are proposed in Section 3. Efficiency comparisons between the proposed and existing estimators are considered in Section 4. The results of the numerical examples are reported in Section 5. Discussion is devoted to Section 6, and the paper is concluded in the last section.
2 Proposed Generalized Estimators Using OLS
Let
Reference [14] proposed ratio estimators of the mean based on the simple random sampling (SRS) method as
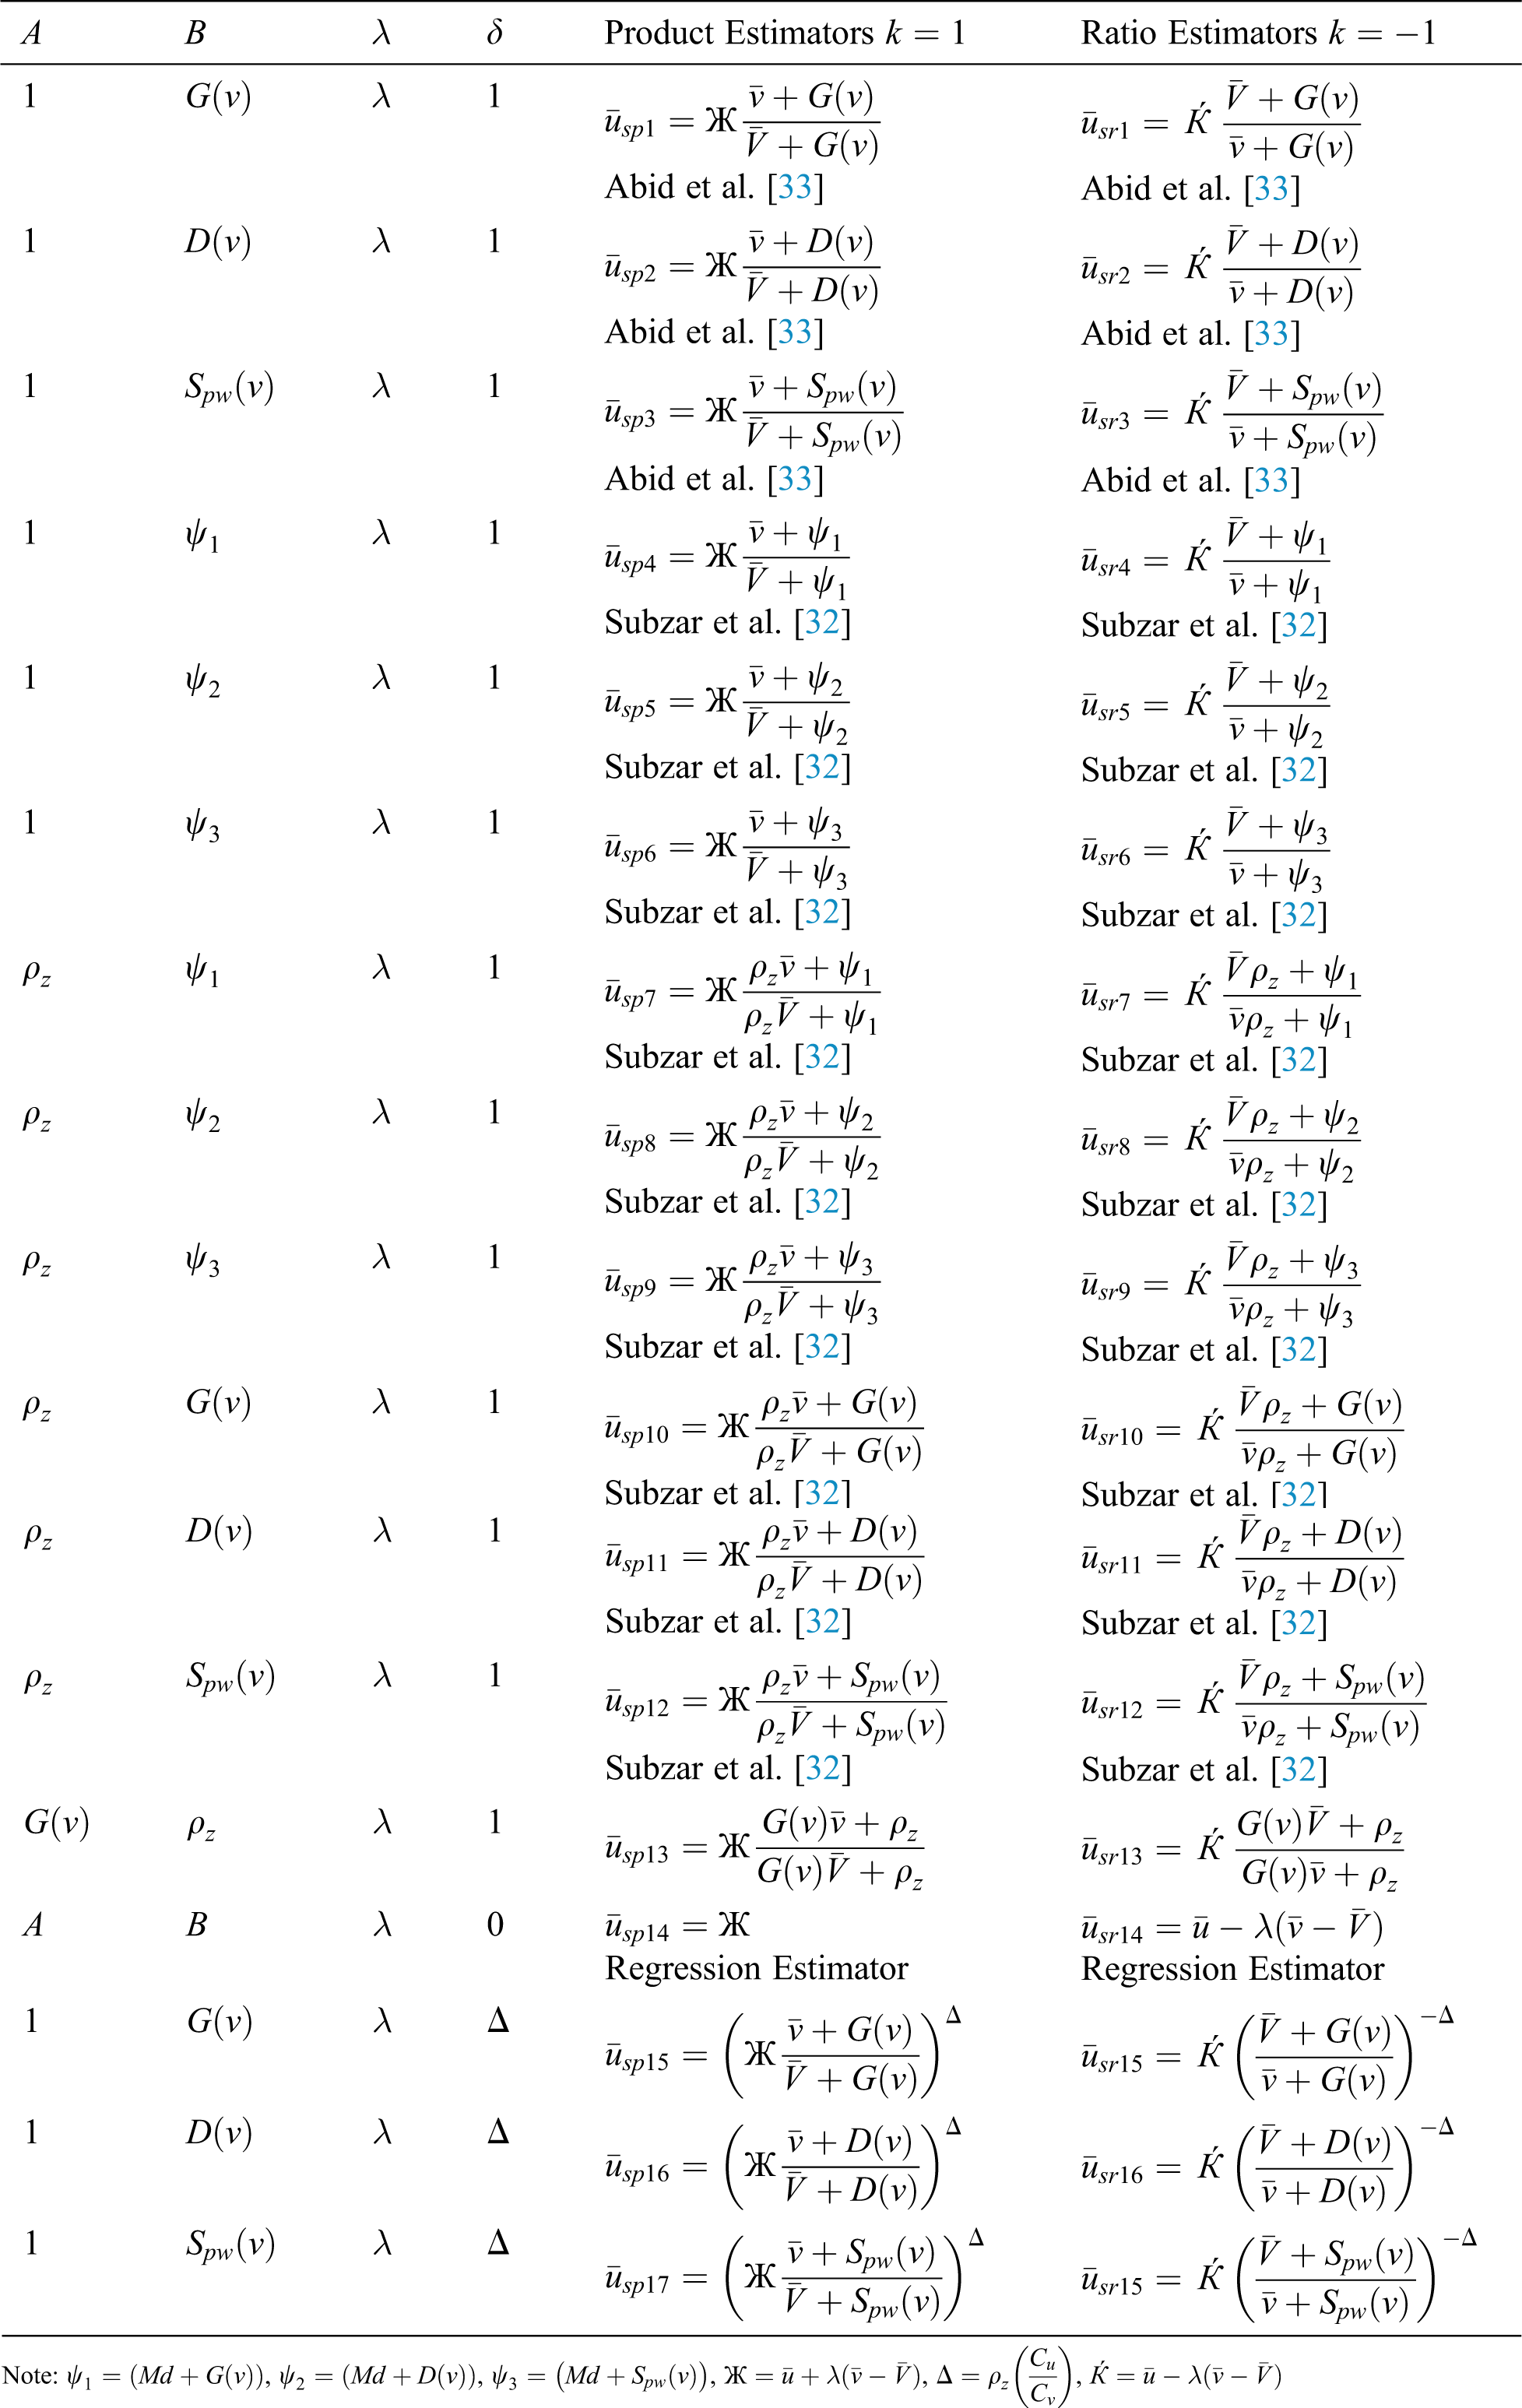
Reference [13] and [26–32], and ultimately, suggested generalized estimator using ancillary information for estimating the population parameters such as the mean in SRSWOR. Motivated by their works, our proposed estimators are given as
where
Eqs. (1) and (2) can be transformed as
Using Taylor expansion of order 2 of
Therefore, the bias of the estimator is
The MSE of the proposed estimator in (1) can be obtained by using the Taylor series approximation as:
Table 1: A few members from the suggested class based on product and ratio estimators under OLS
3 Proposed Class of Estimators using Huber M-Estimation
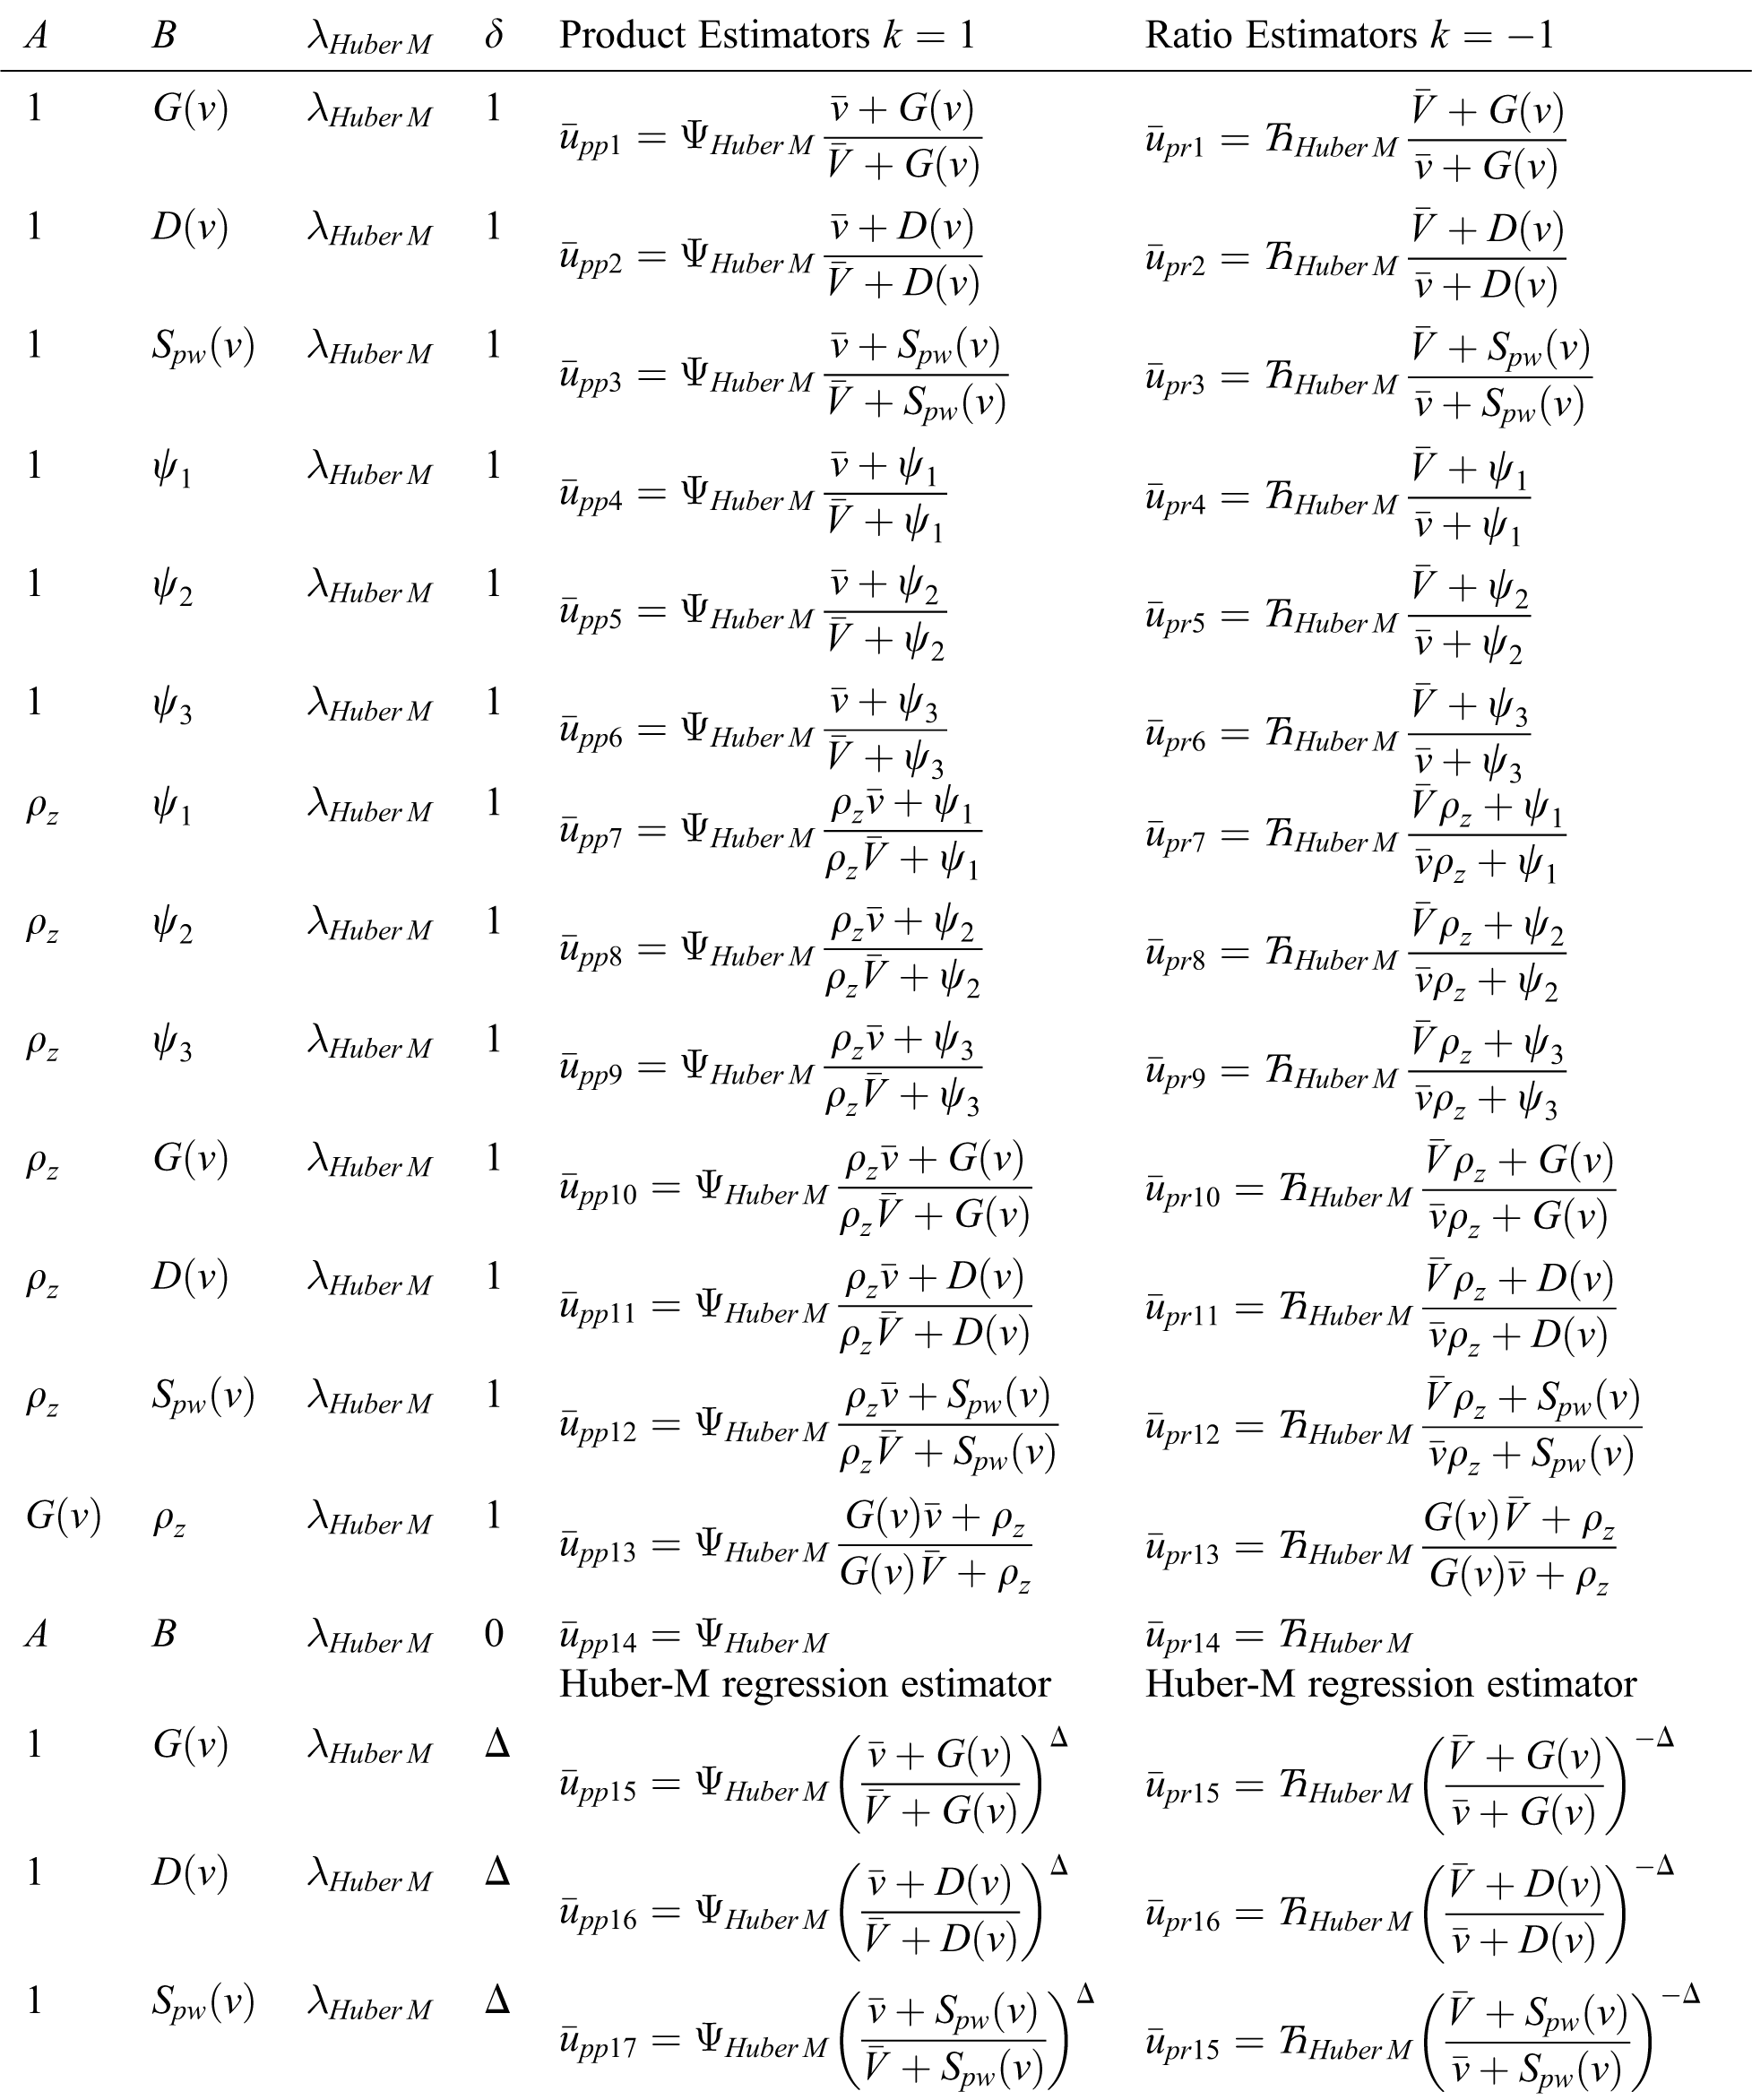
The main issue on which we focus in the present study is the proposition of a generalized class of ratio and product estimators that are suitable for data with the existence of outliers. To deal with this situation, we have adopted the Huber M-estimation technique to the developed generalized class of estimators, displayed in (1), to obtain valid results while estimating parameters in that situation, i.e.,
In adopting the Huber M-estimates, the outlier’s negative effect is reduced and valid results are obtained; hence, valid inferences will be drawn from the results. The compromise between
where
with respect to
Then, using the Taylor expansion of order 2 of
Hence, the bias of the estimator is
and the MSE of (7) can be obtained based on the Taylor series approximation as
Substituting the different values of
Table 2: Some class members of product and ratio estimators
The efficiencies of the generalized estimators using ancillary information when OLS is adopted are compared with the generalized estimator using the same ancillary information but with Huber M-estimation. For
.
Since,
Or
When the conditions given in (14) or (15) are satisfied, a proposed class of estimators in which Huber-M is adopted is more proficient than the generalized estimators in which OLS is taken.
5 Application and Numerical Illustration
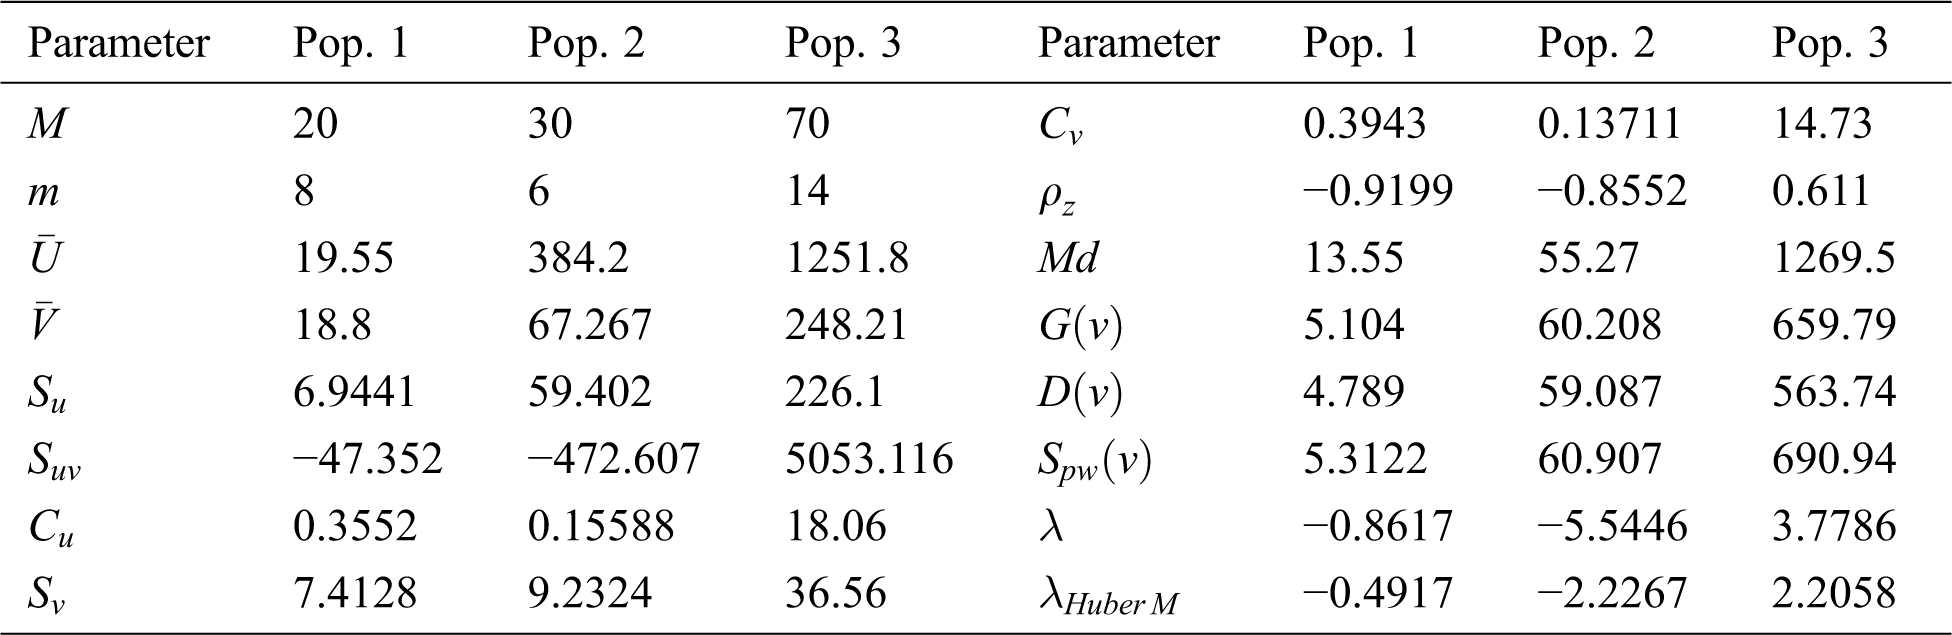
In this section, we consider three real data populations and their descriptive statistics are summarized in Tab. 3. The first population (Pop.) is taken from [34]. The second population data is taken from the book entitled “Advanced Sampling Theory with Applications” by Singh [35], p. 147, Example (3.2.2.1). This second data is collected from a little town in the USA in which Psychologist want to estimate, in average, the sleep duration (in minutes) during the night for people of 50 years old and more. It is realized that there are 30 people living in the town matured 50 and over. Rather than asking everyone, the clinician chooses a SRSWOR sample of six people of this age gathering and records the data. The third population data set is taken from Myers, [36] in which the study is conducted on transistor gain between emitter and collector in an integrated circuit device (hFC), where emitter drive-in time (in minutes) is denoted by
Table 3: Data sets descriptive
We applied to these data different class members of estimators using both proposed methods with the same auxiliary information; OLS and Huber M-estimation technique. The bias, mean squared error and percent relative efficiency (PRE) of some product types estimators for populations 1, 2 and 3 are given in Tabs. 4–6, respectively. The Tabs. 7–9 present the values of bias, MSE and PRE of some ratio types estimators for the populations 1, 2 and 3, respectively.
Table 4: MSE’s and bias of some member type products from the classes for population 1
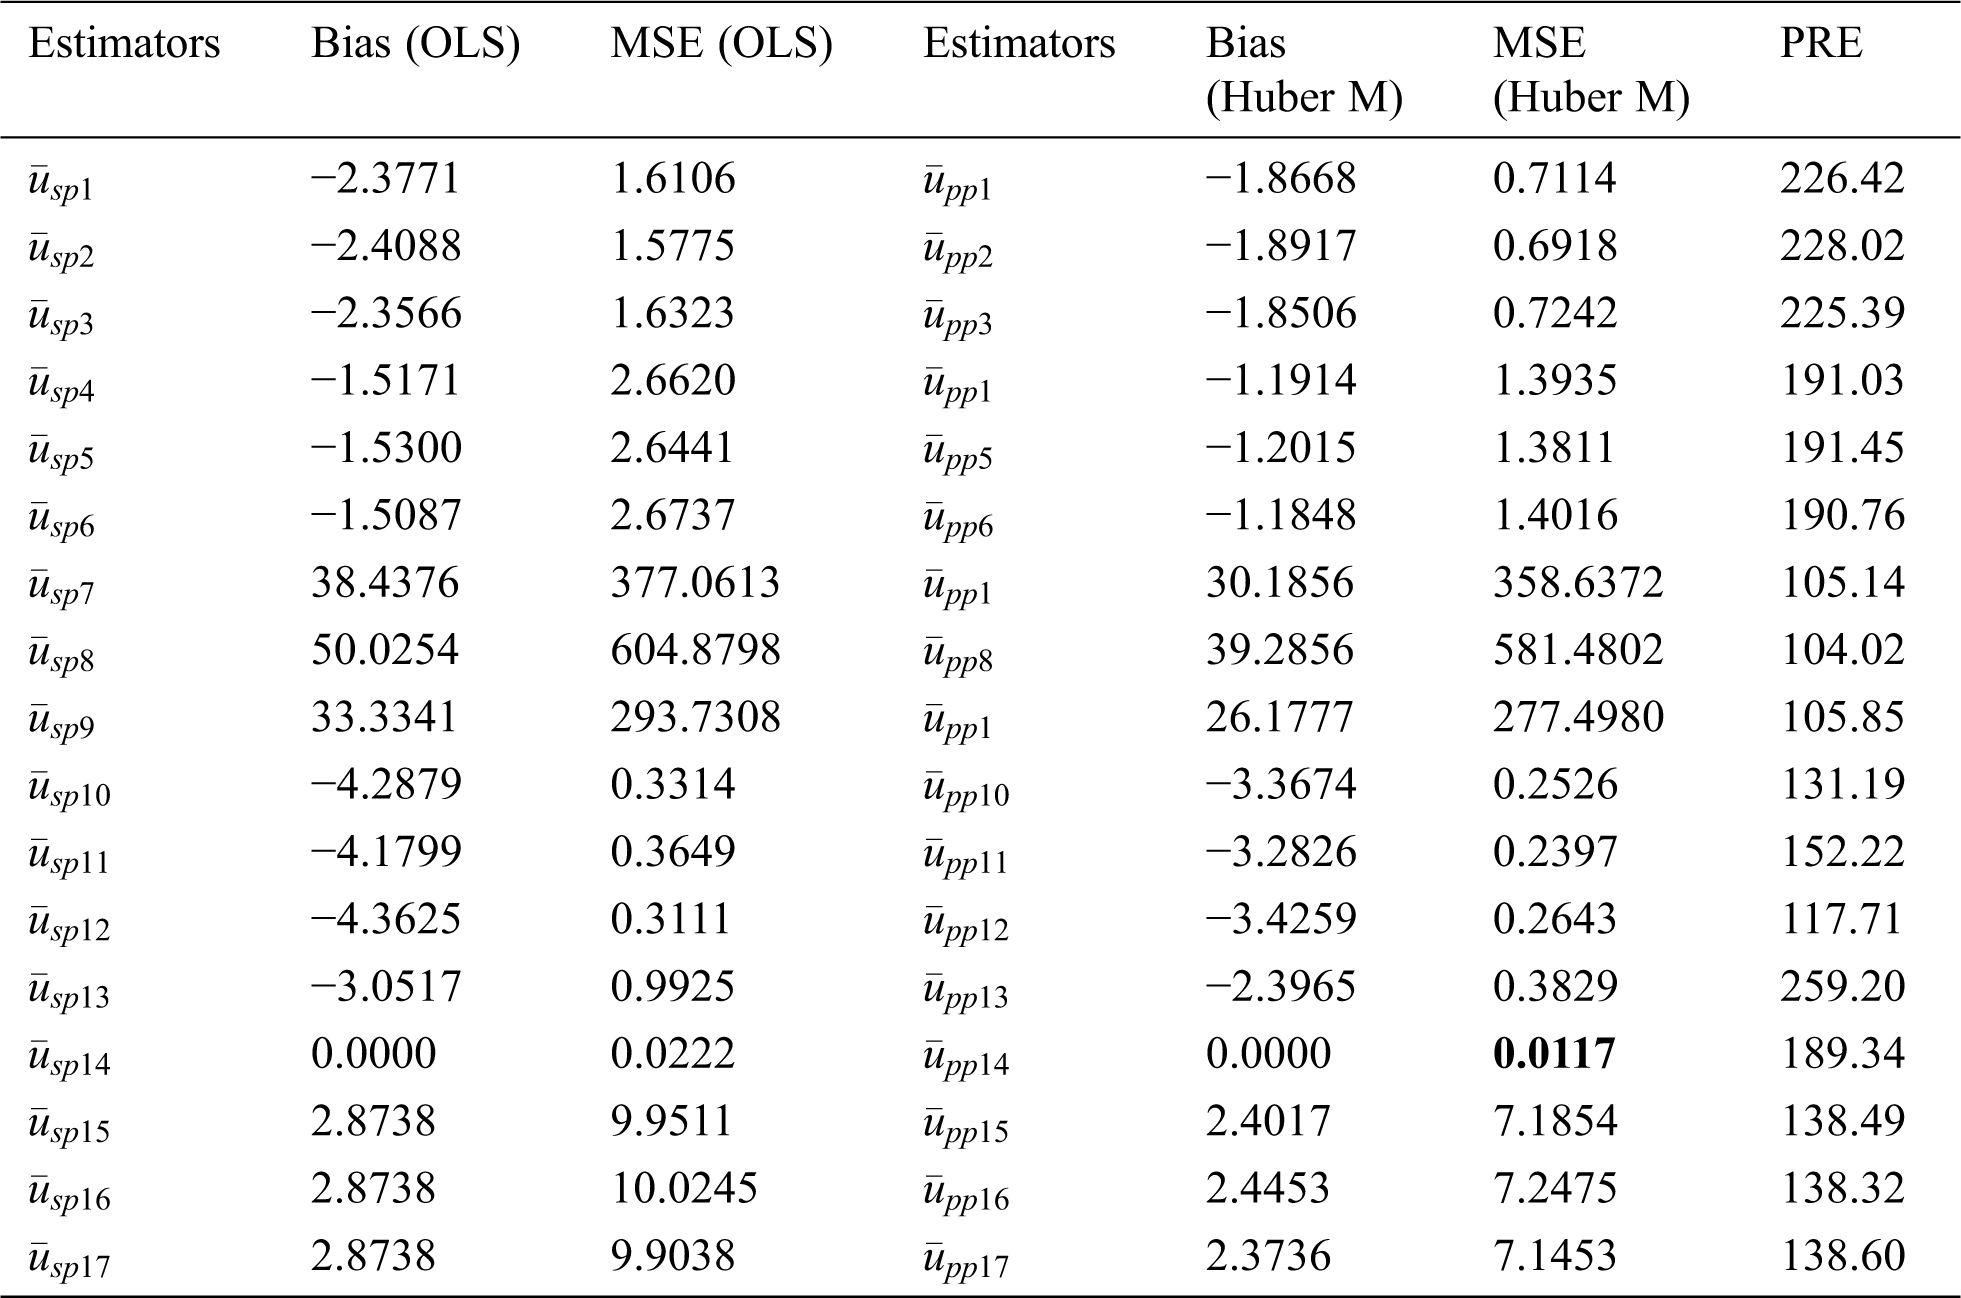
Table 5: MSE’s and bias of some member type products from the classes for population 2
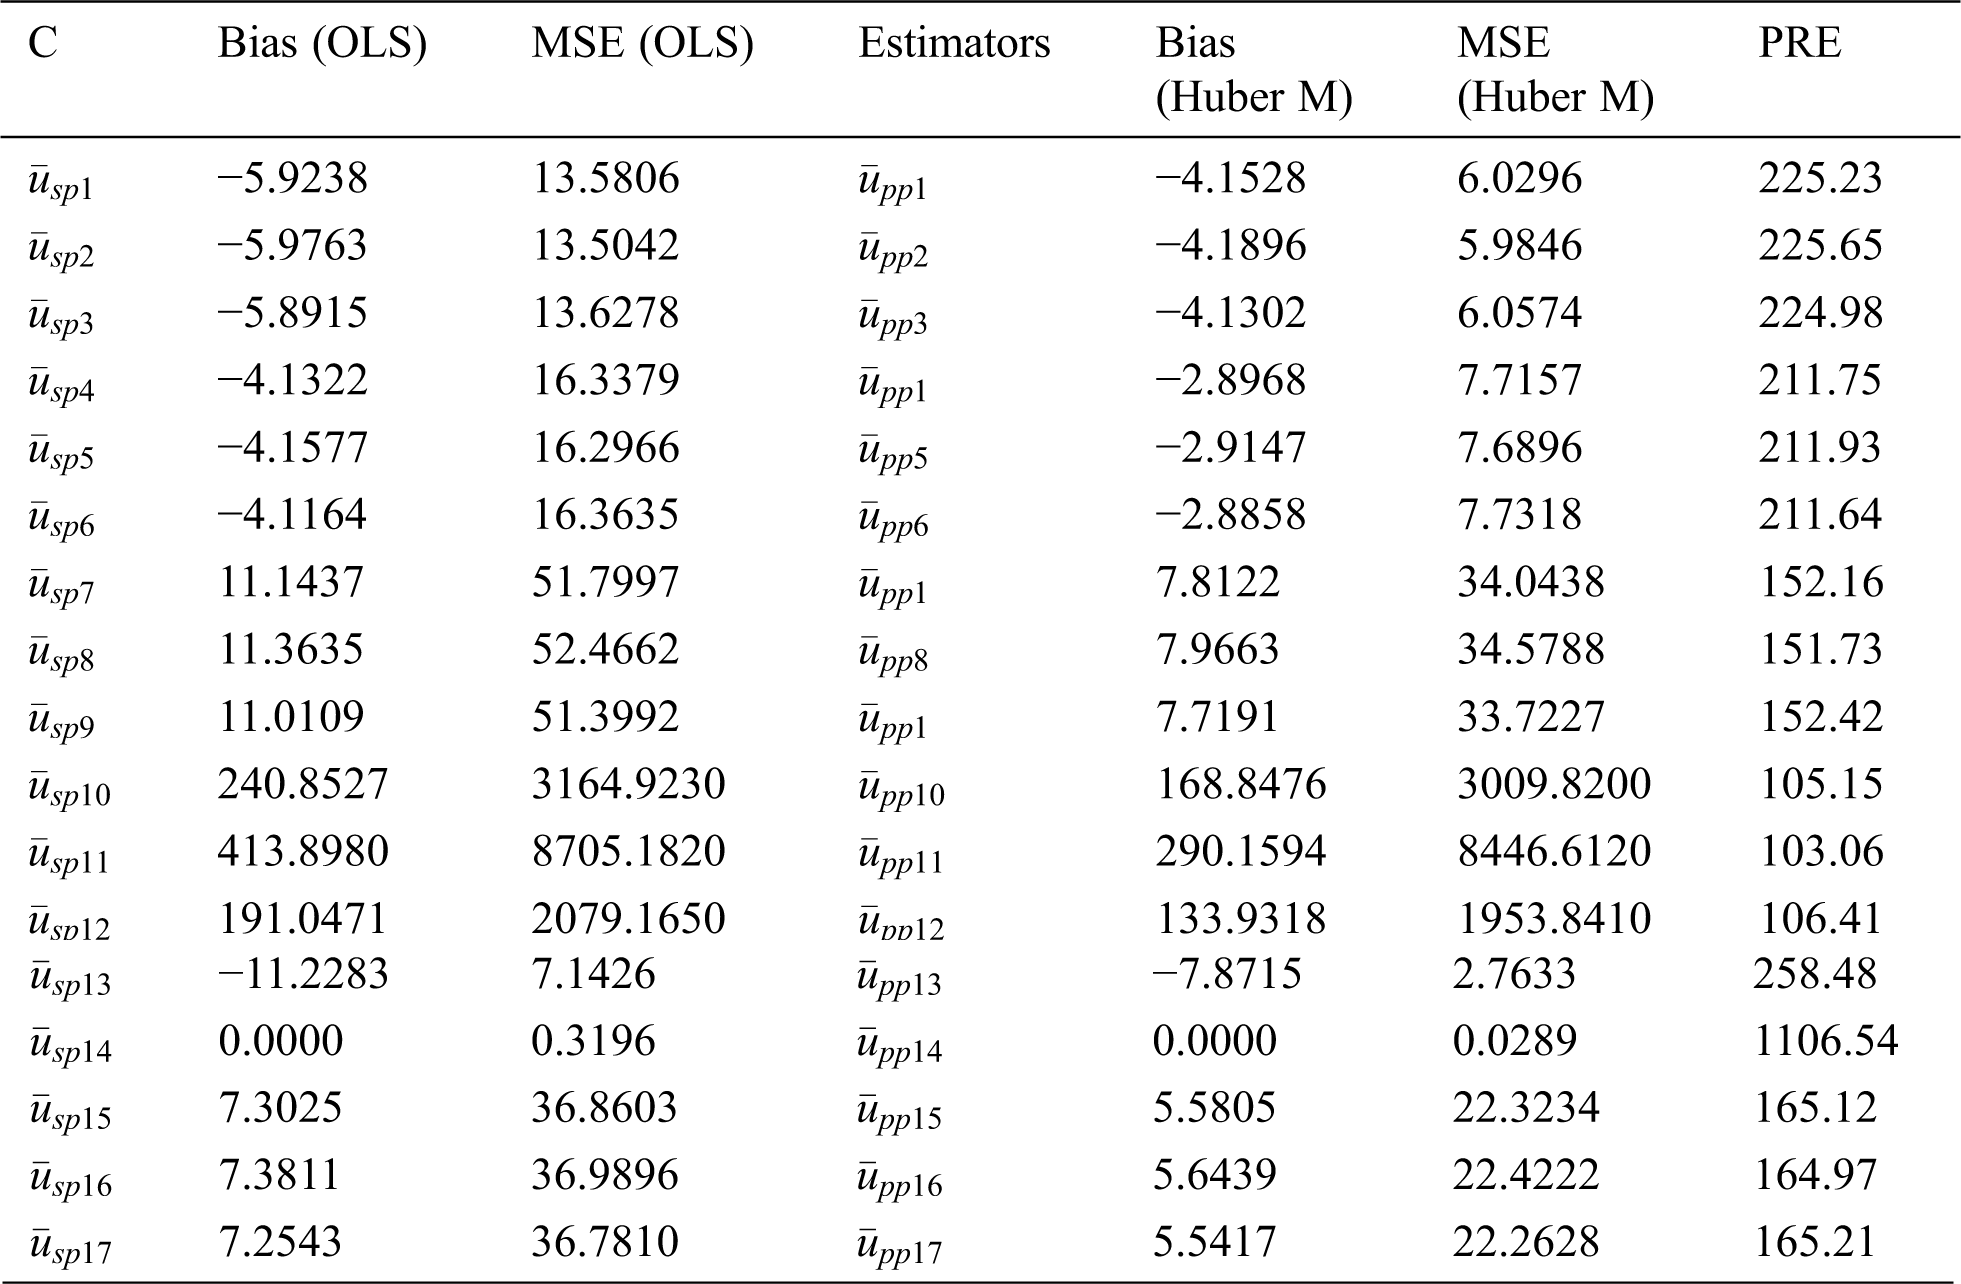
Table 6: MSE’s and bias of some member type products from the classes for population 3
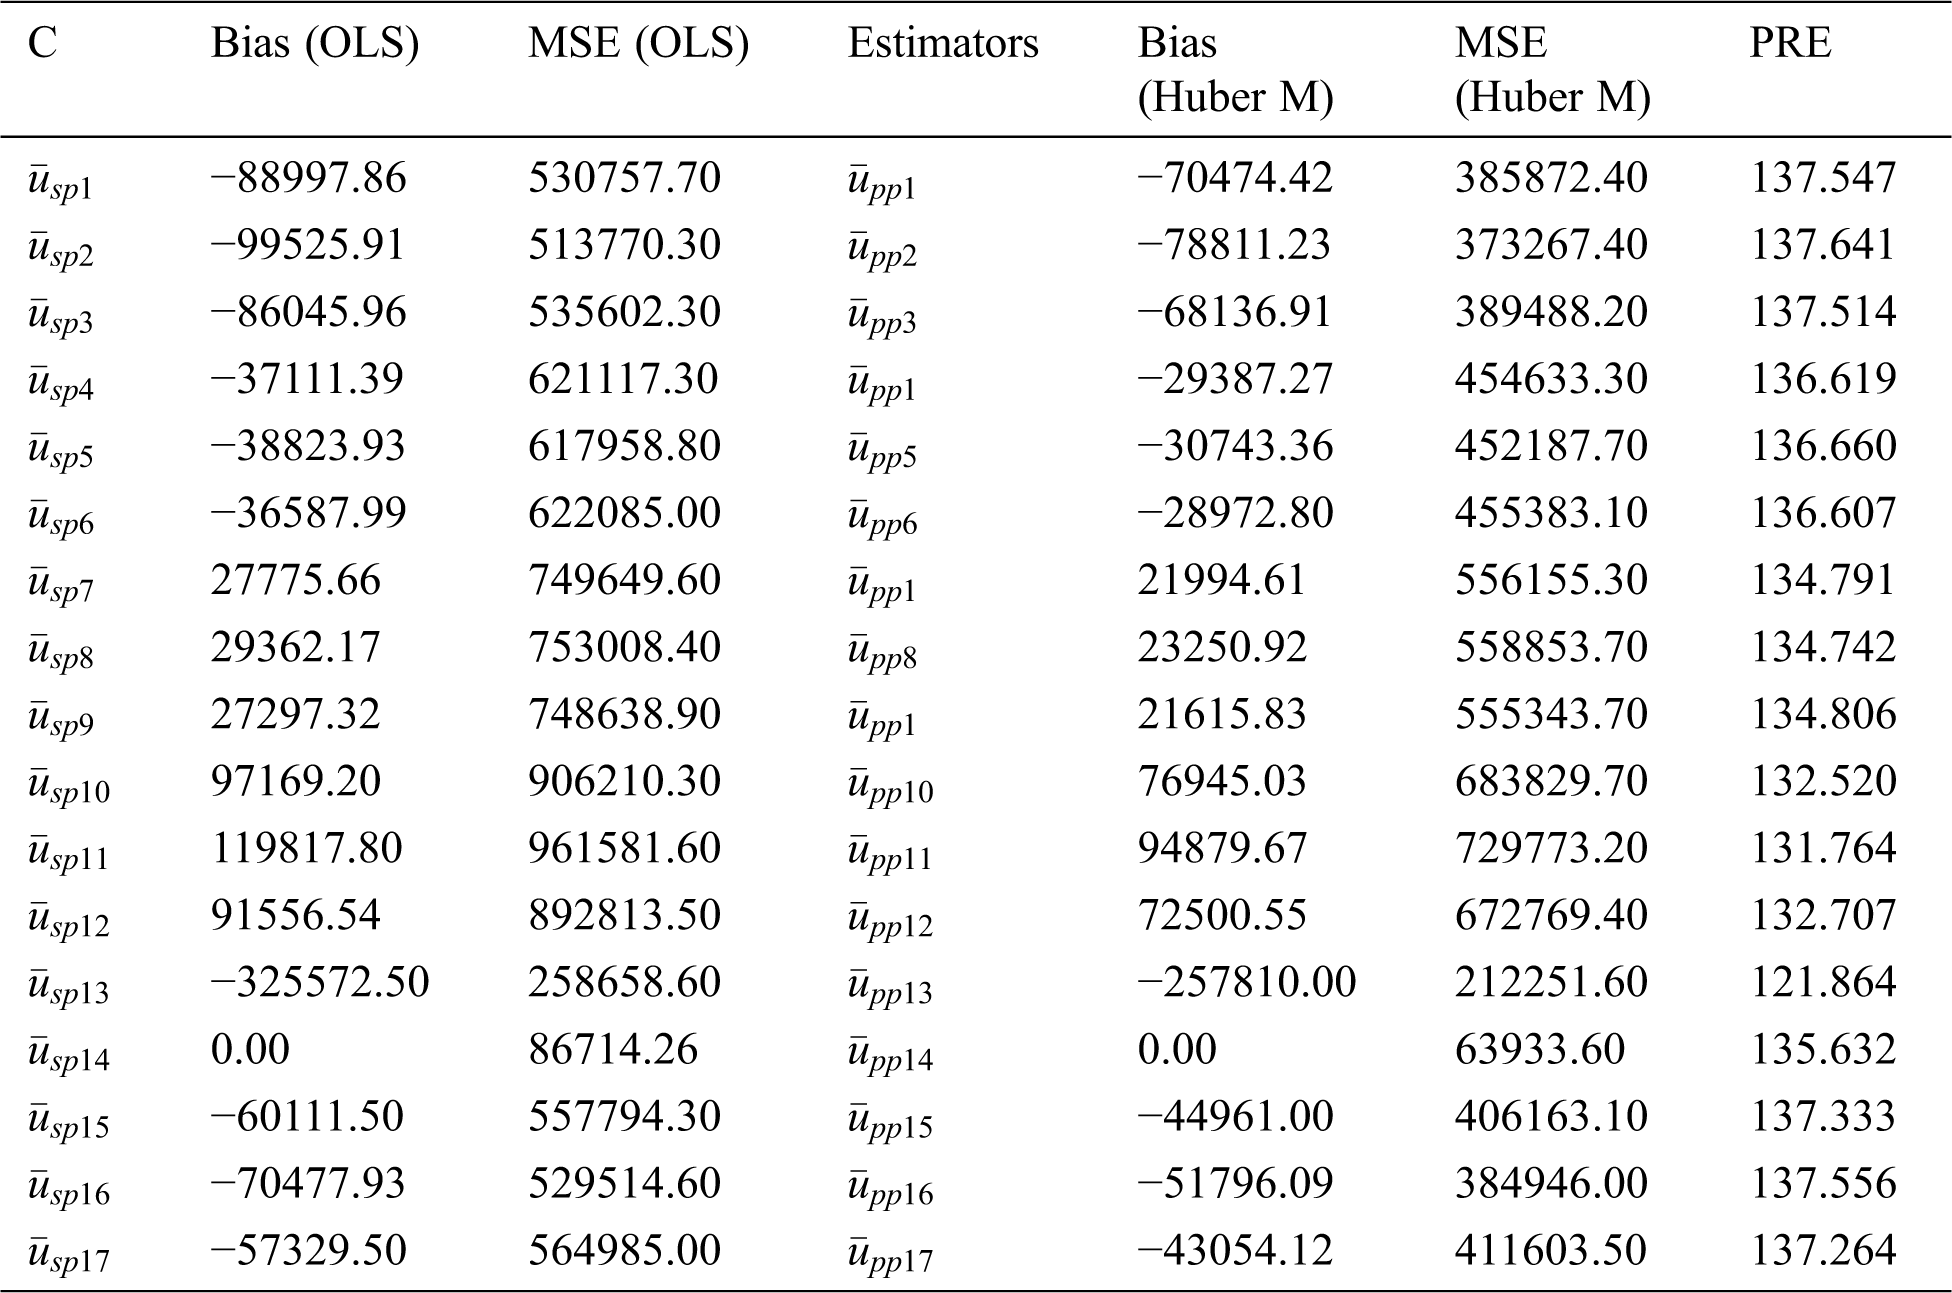
Table 7: MSE’s and bias of some type member ratios from the classes for population 1
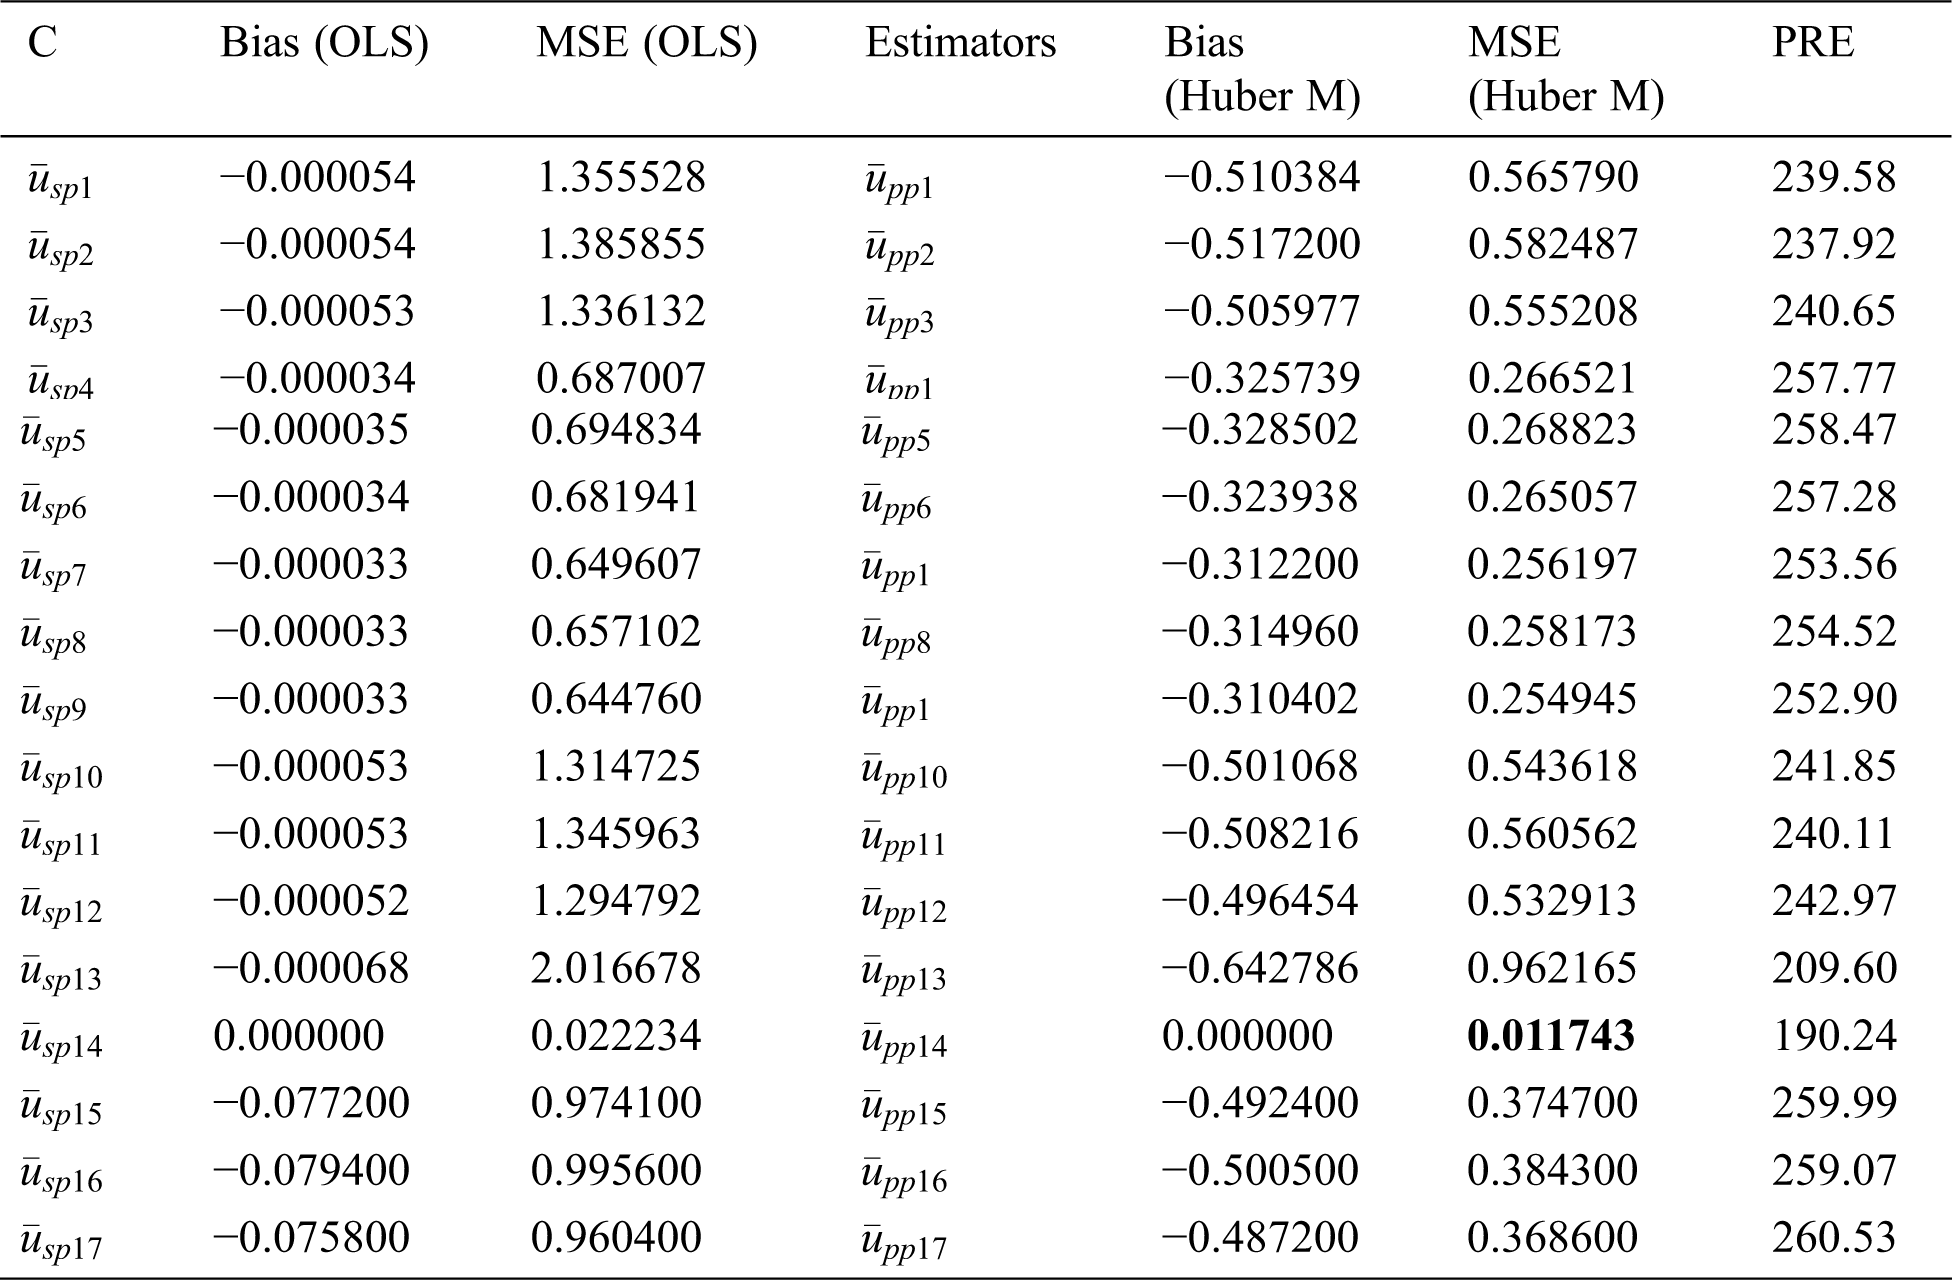
Table 8: MSE’s and bias of some type member ratios from the classes for population 2
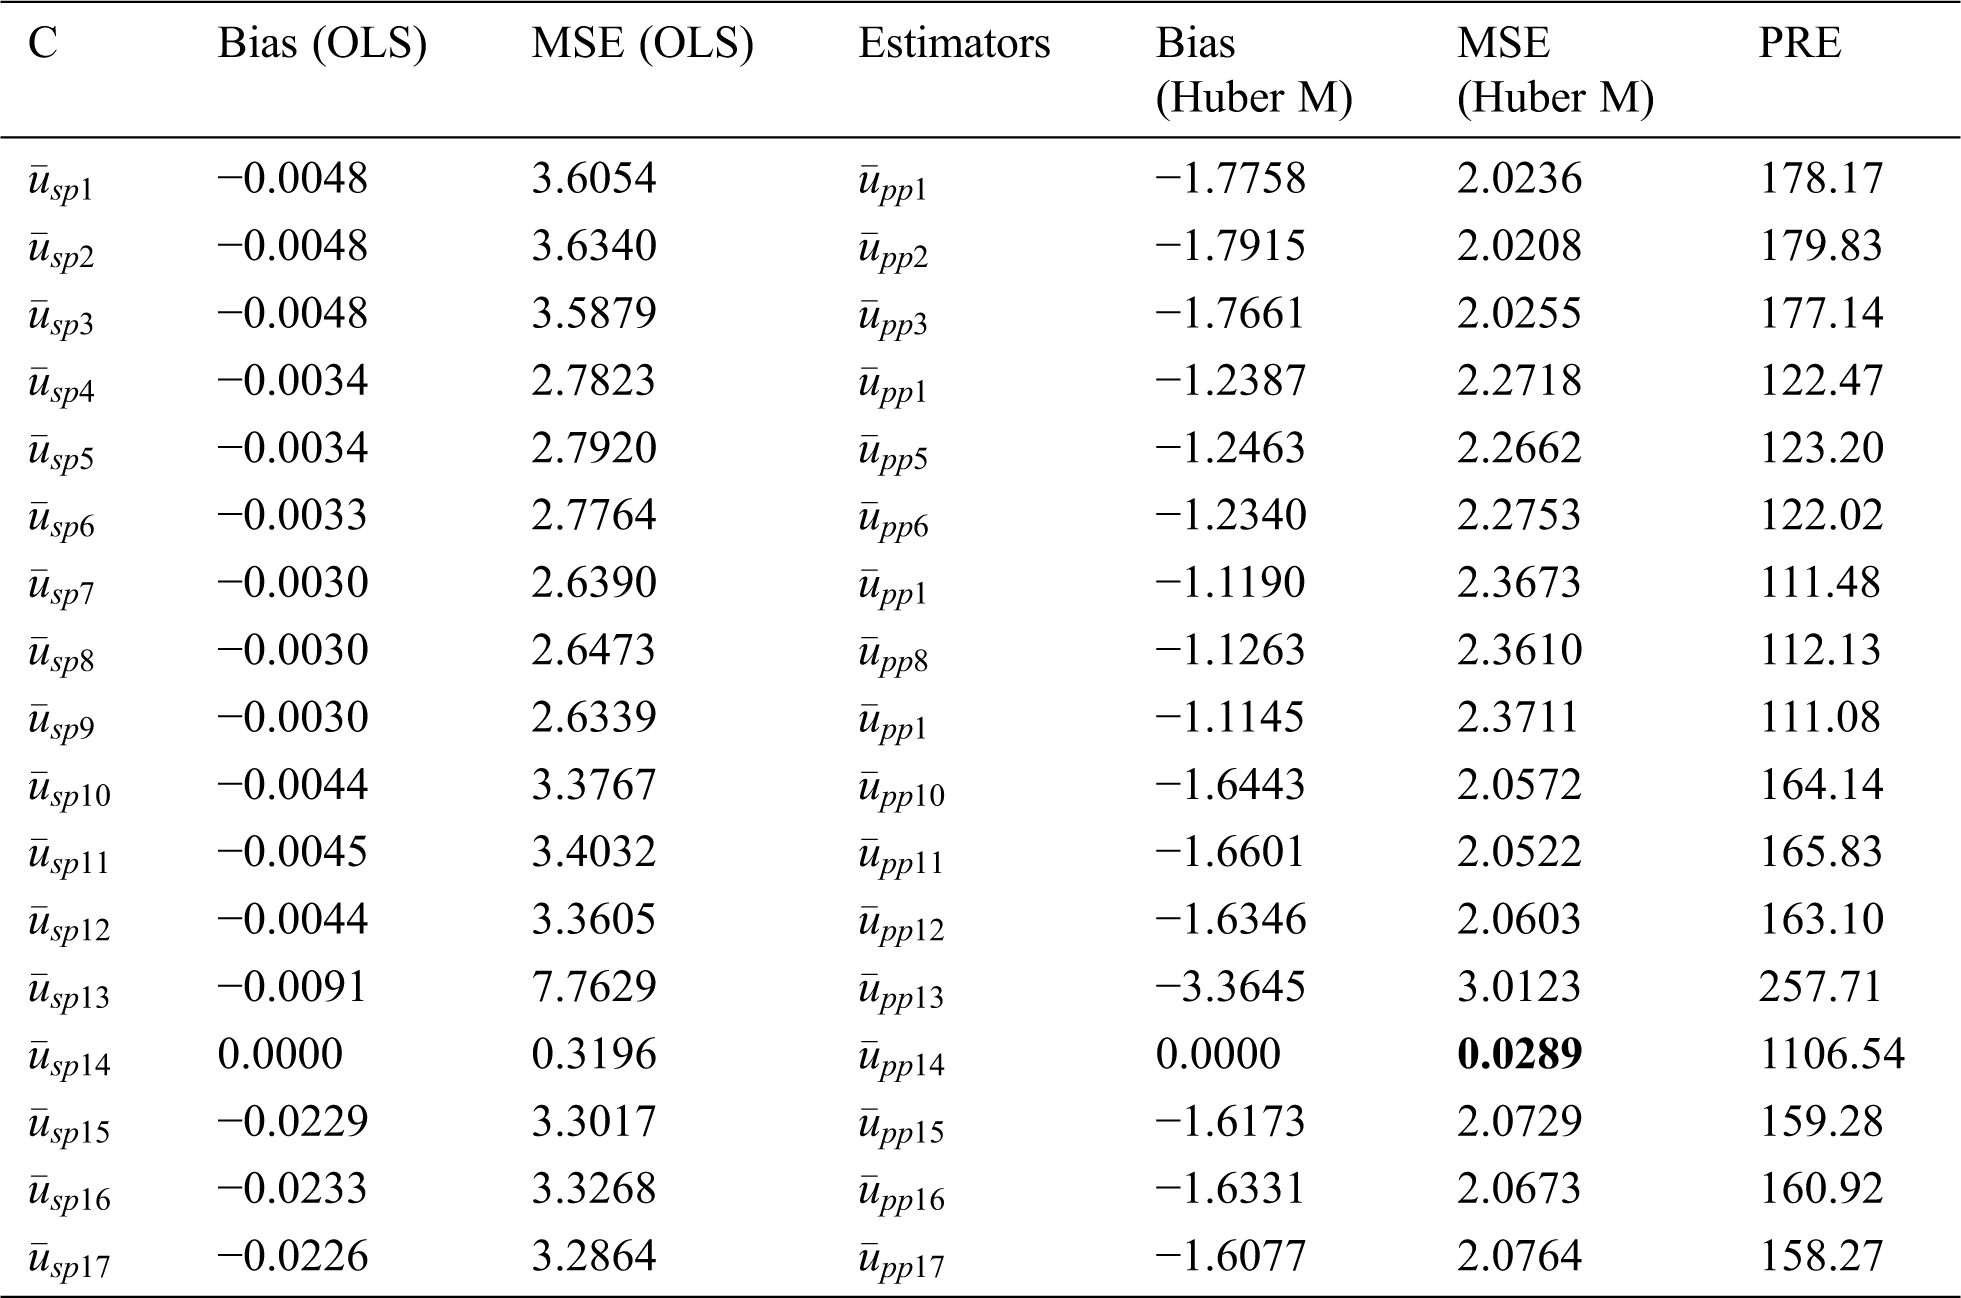
Table 9: MSE’s and bias of some type member ratios from the classes for population 3
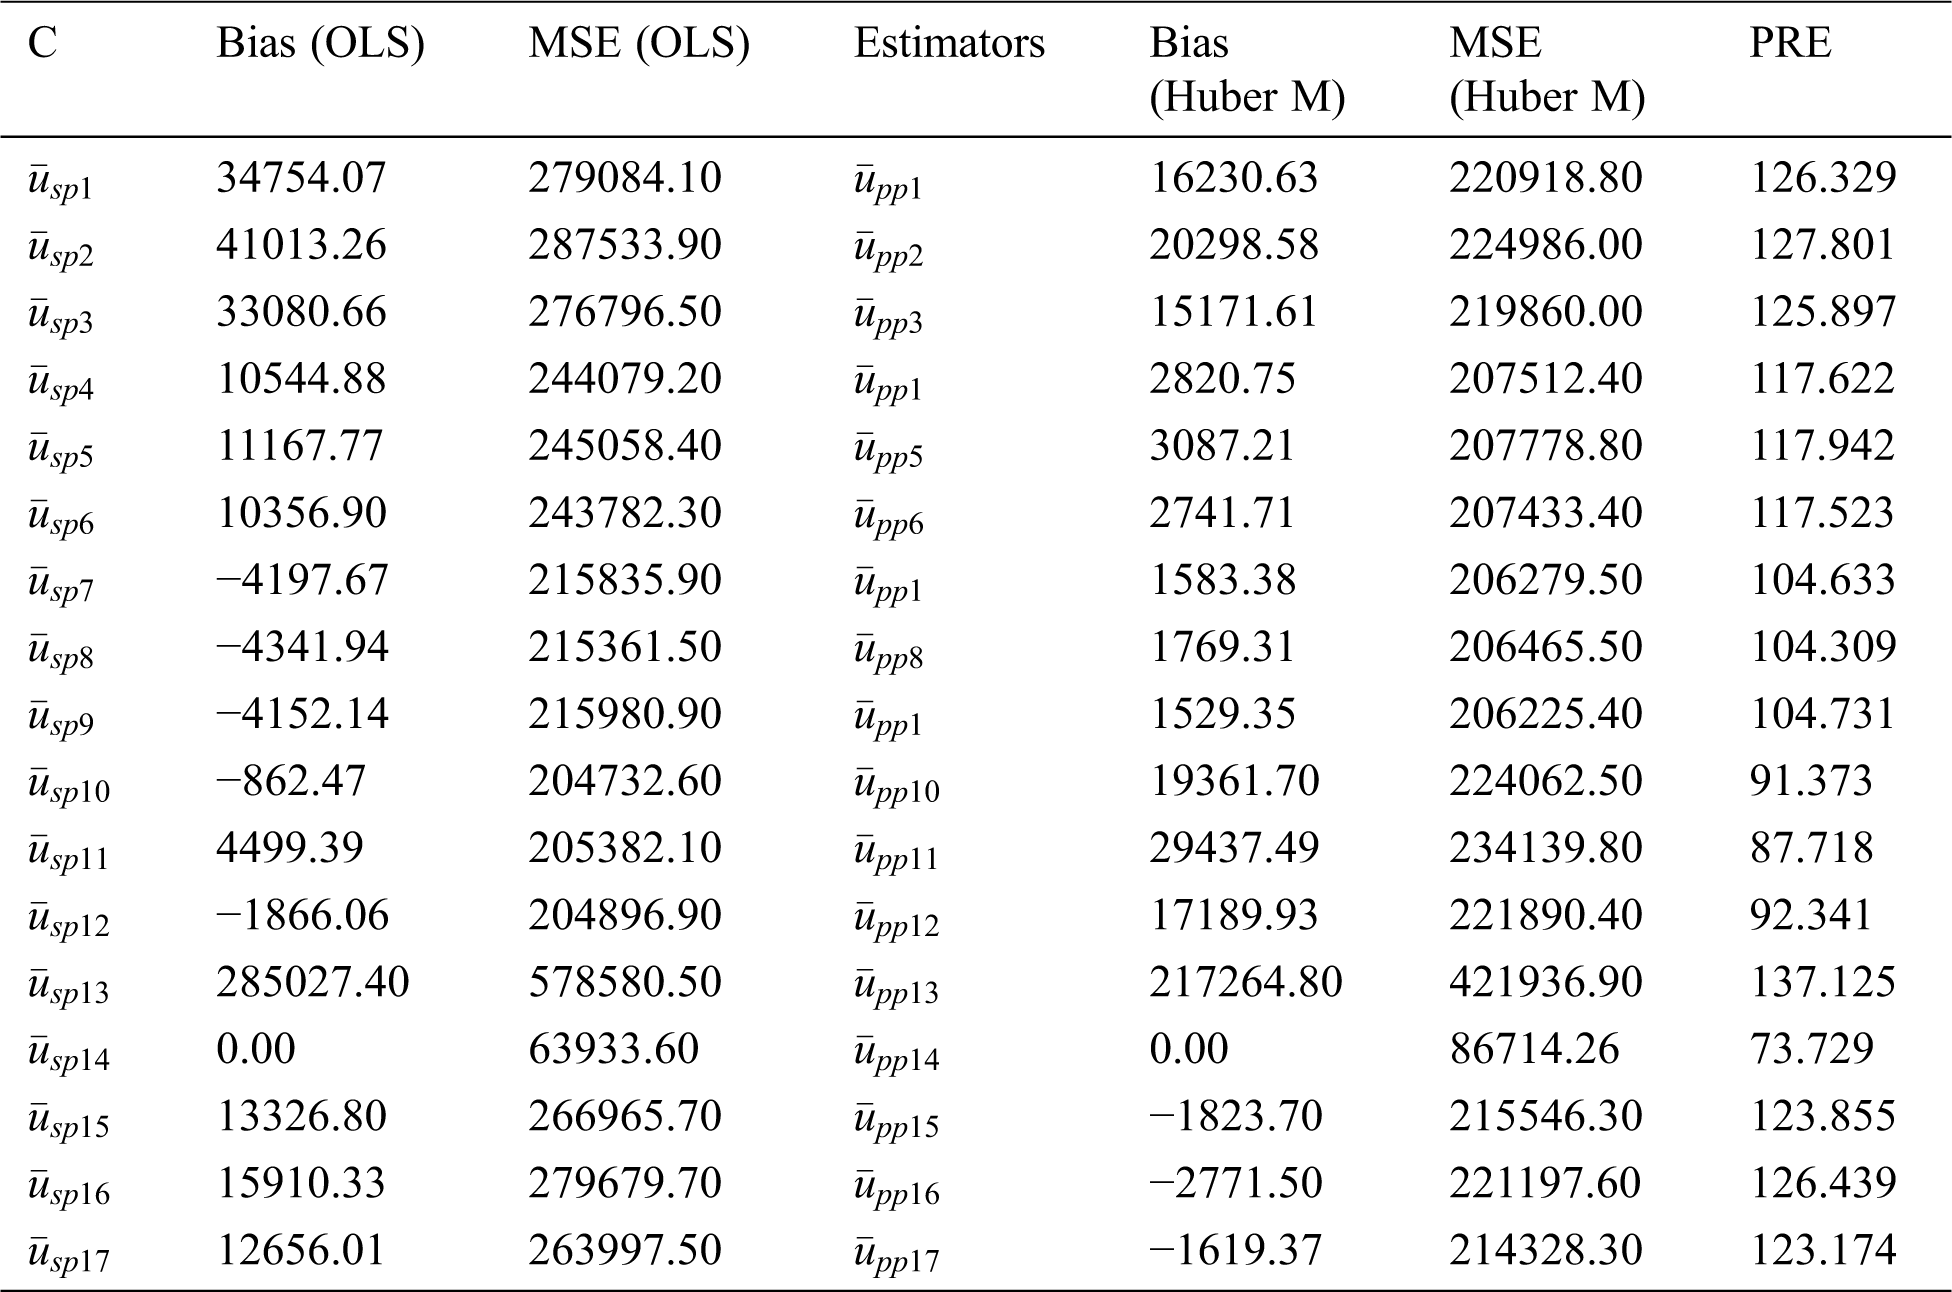
From Tabs. 1 and 2, it can be seen that the generalized class members of estimators can deliver various kinds of product and ratio estimators utilizing different auxiliary information under the adoption of OLS and Huber-M methods, respectively. Tabs. 4–6 present the numerical delineation of the productivity of certain members from these generalized classes of estimators. From these tables, it is found that while utilizing the same auxiliary information in the case of OLS and Huber M-estimations through product method of estimation, Huber-M-type (robust) estimators provide more efficient results than the OLS-type estimators when outliers are presented in the data. It is also observed that the Huber-M product regression estimator
Based on the above discussion and numerical study, we can conclude that adopting Huber M instead of OLS, especially when outliers are presented, has superiority in precision (see Tabs. 7–9). The main feature of adopting the Huber M-estimation method that it provides an estimator that is easy to compute in practice with more efficient results. Beside these facts, our new proposed estimators will be useful in future study for data analysis and making decisions. Thus, a valid inference could be drawn from accurate results for future study or application, and, hence, providing better alternative estimators in practical situations. The proposed generalized estimators in this paper can be modified using different robust regression techniques [37] under different sampling techniques such as [38], systematic, two-Phase, and may be based on ranked set sampling methods [39–45].
Acknowledgement: The authors would like to thank the editor in chief and worthy referees for valuable suggestions for giving the final shape of the manuscript.
Funding Statement: The authors extend their appreciation to Deanship of Scientific Research at King Khalid University for funding this work through Research Groups Program under grant number R.G.P. 2/82/42. I.M.A. who received the grant, www.kku.edu.sa.
Conflicts of Interest: The authors declare that they have no conflicts of interest to report regarding the present study.
1. U. Shahzad, P. F. Perri and M. Hanif. (2018). “A new class of ratio-type estimators for improving mean estimation of sensitive variables by using the supplementary information,” Communication in Statistics-Simulation and Computation, vol. 48, no. 9, pp. 2566–2585. [Google Scholar]
2. U. Shahzad, N. H. Al-Noor, M. Hanif and I. Sajjad. (2020). “An exponential family of median based estimator for mean estimation with simple random sampling scheme,” Communication in Statistics- Theory and Methods. [Google Scholar]
3. U. Shahzad, I. Ahmad, I. Almanjahie, N. H. Al-Noor and M. Hanif, “A new class of L-moments based calibration variance estimators,” Computer Materials and Continua, vol. 66, no. 3, pp. 3013–3028, 2021. [Google Scholar]
4. U. Shahzad, I. Ahmad, E. Oral, M. Hanif and I. Almanjahie. (2020). “Estimation of the population mean by successive use of an auxiliary variable in median ranked set sampling,” Mathematical Population Studies. [Google Scholar]
5. S. Chatterjee and B. Price. (1991). Regression Analysis by Example. Second Edition. New York: Wiley & Sons. [Google Scholar]
6. C. Kadilar, M. Candan and H. Cingi. (2007). “Ratio estimators using robust regression,” Hacettepe Journal of Mathematics and Statistics, vol. 36, no. 2, pp. 181–188. [Google Scholar]
7. M. Subzar, C. N. Bouza, S. Maqbool, T. A. Raja and B. Para. (2019). “Robust ratio type estimators in simple random sampling using Huber m-estimation,” Revista Investigacion Operacional, vol. 40, no. 2, pp. 201–209. [Google Scholar]
8. M. Subzar, C. N. Bouza and A. I. Al-Omari. (2019). “Utilization of different robust regression techniques for estimation of finite population mean in SRSWOR in case of presence of outliers through ratio method of estimation,” Revista Investigacion Operacional, vol. 40, no. 5, pp. 600–609. [Google Scholar]
9. M. Subzar, S. Maqbool, T. A. Raja. and M. A. Bhat. (2019). “New ratio estimators for population mean using robust regression,” Journal of Indian Society of Agricultural Statistics, vol. 73, no. 3, pp. 211–216. [Google Scholar]
10. N. Ali, I. Ahmad, M. Hanif and U. Shahzad, “Robust-regression type estimators for improving mean estimation of sensitive variables by using auciliary information,” Communication in Statistics- Theory and Methods. [Google Scholar]
11. U. Shahzad, N. H. Al-Noor, M. Hanif, I. Sajjad and M. M. Anas, “Imputation based mean estimators in case of covariance matrices,” Communication in Statistics-Simulation and Computation. [Google Scholar]
12. U. Shahzad, M. Hanif, I. Sajjad and M. M. Anas, “Quantile regression –ratio-type estimators for mean estimation under complete and partial auxiliary information,” Scientia Iranica. [Google Scholar]
13. M. N. Murthy. (1964). “Product method estimation,” Sankhya Series A, vol. 26, pp. 69–74. [Google Scholar]
14. A. I. Al-Omari, K. Ibrahim and A. A. Jemain. (2009). “New ratio estimators of the mean using simple random sampling and ranked set sampling methods,” Revista Investigacion Operacional, vol. 30, no. 2, pp. 97–108. [Google Scholar]
15. A. I. Al-Omari, K. Jaber and K. Ibrahim. (2008). “A modified ratio-type estimators of the mean using extreme ranked set sampling,” Journal of Mathematics and Statistics, vol. 4, no. 3, pp. 150–155. [Google Scholar]
16. A. A. Jemain, A. I. Al-Omari and K. Ibrahim. (2007). “Multistage extreme ranked set samples for estimating the population mean,” Journal of Statistical Theory and Applications, vol. 6, no. 4, pp. 456–471. [Google Scholar]
17. A. I. Al-Omari and C. N. Bouza. (2015). “Ratio estimators of the population mean with missing values using ranked set sampling,” Environmetrics, vol. 26, no. 2, pp. 67–76. [Google Scholar]
18. T. A. Srivenkataramna. (1980). “Dual to ratio estimator in sample survey,” Biometrika, vol. 67, pp. 199–204. [Google Scholar]
19. S. Bandyopadhyay. (2008). “Improved ratio and product estimators,” Sankhya Series C, vol. 42, no. 2, pp. 45–49. [Google Scholar]
20. H. P. Singhand and M. R. Espejo. (2003). “On linear regression and ratio-product estimators of a finite population mean,” Statistician, vol. 52, no. 1, pp. 59–67. [Google Scholar]
21. R. Tailor and B. K. Sharma. (2009). “A modified ratio cum product estimator of finite population mean using known coefficient of variation and coefficient of kurtosis,” Statistics in Transition-New Series, vol. 10, no. 1, pp. 15–24. [Google Scholar]
22. B. Sharma and R. Tailor. (2010). “A new ratio cum dual to ratio estimators of finite population mean in simple random sampling,” Global Journal of Science Frontier Research, vol. 10, no. 1, pp. 27–31. [Google Scholar]
23. S. Chaudhary and S. K. Singh. (2012). “An efficient class of dual to product-cum dual to ratio estimators of finite population mean in sample surveys,” Global Journal of Science Frontier Research, vol. 12, no. 3, pp. 25–33. [Google Scholar]
24. M. Javed and M. Irfan. (2020). “A simulation study: New optimal estimators for population mean by using dual auxiliary information in stratified random sampling,” Journal of Taibah University for Science, vol. 14, no. 1, pp. 557–568. [Google Scholar]
25. M. Aslam. (2020). “Design of the Bartlett and Hartley tests for homogeneity of variances under indeterminacy environment,” Journal of Taibah University for Science, vol. 14, pp. 6–10. [Google Scholar]
26. B. V. S. Sisodia and V. K. Dwivedi. (1981). “A modified ratio estimator using coefficient of variation of auxiliary variable,” Journal of Indian Society of Agricultural Statistics, vol. 33, pp. 13–18. [Google Scholar]
27. H. P. Singh and R. Tailor. (2003). “Use of known correlation coefficient in estimating the finite population means,” Statistics in Transition, vol. 6, no. 6, pp. 555–560. [Google Scholar]
28. C. Kadilar and H. Cingi. (2004). “Ratio estimators in simple random sampling,” Applied Mathematics and Computation, vol. 151, no. 3, pp. 893–902. [Google Scholar]
29. Z. Yan and B. Tian. (2010). “Ratio method to the mean estimation using coefficient of skewness of auxiliary variable,” Information Computing and Applications, vol. 106, pp. 103–110. [Google Scholar]
30. J. Subramani and G. Kumarapandiyan. (2012). “A class of almost unbiased modified ratio estimators for population mean with known population parameters,” Elixir International Journal, vol. 44, pp. 7411–7415. [Google Scholar]
31. E. J. Ekpenyong and E. I. Enang. (2015). “A modified class of ratio and product estimators of the population mean in simple random sampling using information on auxiliary variable,” Journal of Statistics, vol. 22, pp. 1–8. [Google Scholar]
32. M. Subzar, S. Maqbool, T. A. Raja, S. K. Pal and P. Sharma. (2018). “Mean ratio estimation in simple random sampling by using auxiliary information in survey sampling,” Statistics in Transition, vol. 19, no. 2, pp. 453–473. [Google Scholar]
33. M. Abid, N. Abbas, R. A. K. Sherwani and H. Z. Nazir. (2016). “Improved ratio estimators for the population mean using non-conventional measures of dispersion,” Pakistan Journal of Statistics and Operation Research, vol. 12, no. 2, pp. 353–367. [Google Scholar]
34. M. Khoshnevisan, R. Singh, P. Chauhan, N. Sawan and F. Smarandache. (2007). “A general family of estimators for estimating population means using known value of some population parameters,” Far East Journal of Theoretical Statistics, vol. 22, pp. 181–191. [Google Scholar]
35. S. Singh. (2003). Advanced Sampling Theory with Applications. Springer-Science Business Media, B.V., Springer, Dordrecht. [Google Scholar]
36. R. H. Myers, D. C. Montgomery and C. M. Anderson-Cook. (2009). Response Surface Methodology: Process and Product Optimization Using Designed Experiments. Third Edition. New York: John Wiley & Sons. [Google Scholar]
37. C. N. Bouza and M. Subzar. (2019). “Subsampling rules for item non response of an estimator based on the combination of regression and ratio,” Journal of King Saud University - Science, vol. 31, no. 2, pp. 171–176. [Google Scholar]
38. M. Subzar, A. I. Al-Omari and A. R. A. Alanzi. (2020). “The robust regression methods for estimating of finite population mean based on SRSWOR in case of outliers,” Computers, Materials & Continua, vol. 65, no. 1, pp. 125–138. [Google Scholar]
39. A. I. Al-Omari. (2012). “Ratio estimation of population mean using auxiliary information in simple random sampling and median ranked set sampling,” Statistics & Probability Letters, vol. 82, no. 11, pp. 1883–1990. [Google Scholar]
40. A. I. Al-Omari and A. Haq. (2012). “Improved quality control charts for monitoring the process mean, using double-ranked set sampling methods,” Journal of Applied Statistics, vol. 39, no. 4, pp. 745–763. [Google Scholar]
41. E. Zamanzade and A. I. Al-Omari. (2016). “New ranked set sampling for estimating the population mean and variance,” Hacettepe Journal of Mathematics and Statistics, vol. 45, no. 6, pp. 891–1905. [Google Scholar]
42. A. Haq, J. Brown, E. Moltchanova and A. I. Al-Omari. (2013). “Partial ranked set sampling design,” Environmetrics, vol. 24, no. 3, pp. 201–207. [Google Scholar]
43. A. Haq, J. Brown, E. Moltchanova and A. I. Al-Omari. (2014). “Mixed ranked set sampling design,” Journal of Applied Statistics, vol. 41, no. 10, pp. 2141–2156. [Google Scholar]
44. A. I. Al-Omari. (2016). “Quartile ranked set sampling for estimating the distribution function,” Journal of the Egyptian Mathematical Society, vol. 24, no. 2, pp. 303–308. [Google Scholar]
45. A. I. Al-Omari. (2015). “The efficiency of L ranked set sampling in estimating the distribution function,” Afrika Matematika, vol. 26, no. 7, pp. 1457–1466. [Google Scholar]
 | This work is licensed under a Creative Commons Attribution 4.0 International License, which permits unrestricted use, distribution, and reproduction in any medium, provided the original work is properly cited. |