DOI:10.32604/csse.2021.016189
| Computer Systems Science & Engineering DOI:10.32604/csse.2021.016189 | |
| Article |
Residential Electricity Classification Method Based On Cloud Computing Platform and Random Forest
1Information and Communication Branch of State Grid Anhui Electric Power Co., Ltd., Hefei, 230009, China
2State Grid Anhui Electric Power Co., Ltd., Chuzhou Power Supply Company, Chuzhou, 239000, China
3School of Computer and Software, Nanjing University of Information Science and Technology, Nanjing, 210044, China
4Department of Mathematics, Faculty of Science, New Valley University, El-Kharga, 72511, Egypt
*Corresponding Author: Yong Ma. Email: mayongah@163.com
Received: 20 December 2020; Accepted: 26 January 2021
Abstract: With the rapid development and popularization of new-generation technologies such as cloud computing, big data, and artificial intelligence, the construction of smart grids has become more diversified. Accurate quick reading and classification of the electricity consumption of residential users can provide a more in-depth perception of the actual power consumption of residents, which is essential to ensure the normal operation of the power system, energy management and planning. Based on the distributed architecture of cloud computing, this paper designs an improved random forest residential electricity classification method. It uses the unique out-of-bag error of random forest and combines the Drosophila algorithm to optimize the internal parameters of the random forest, thereby improving the performance of the random forest algorithm. This method uses MapReduce to train an improved random forest model on the cloud computing platform, and then uses the trained model to analyze the residential electricity consumption data set, divides all residents into 5 categories, and verifies the effectiveness of the model through experiments and feasibility.
Keywords: Cloud computing; Hadoop; random forest; user classification
With the construction and development of urbanization in China, the number of residential quarters of cities is increasing. The total amount of electricity consumed by urban residents is also increasing, which brings new challenges to the stable operation of the power grid. Categorizing the electricity consumption of residential users can help the power supply side perform better resource management and distribution, and reduce power loss [1,2].
There have been many analyses and studies on residential electricity consumption. Song et al. [3] used factors such as holidays and weekends as the parameters of the ANN (Artificial Neural Network) model to predict short-term power consumption. Loktionov et al. [4] used the seasonal decomposition method to study the relationship between urban electricity consumption and climate change. They analyze electricity consumption in terms of time. Liu et al. [5] proposed a method to identify users in the same transformer area based on an improved k-means clustering algorithm. However, these do not involve the classification of specific users. Zhang et al. [6] used the two-step clustering method to classify residential users by extracting the characteristics of the electricity load curve. Song et al. [7] analyzed the relationship between household income and user electricity consumption. Song et al. [8] analyzed the user’s power consumption pattern of pattern recognition power supplies. The above methods have classified users from different perspectives, but due to the increasing amount of data in the grid system now. Some current methods focus more on optimizing classification accuracy, and ignore the timeliness of response, which can no longer meet the demand.
Based on this, this paper designs a random forest residential electricity classification method based on the distributed architecture of cloud computing. This method firstly uses the fruit fly algorithm to improve the random forest model, and then uses MapReduce to train the improved random forest model on the cloud computing platform. After that, the trained model is used to analyze the residential electricity consumption data set, and all residents are divided into 5 categories. The effect of the model is verified through experiments.
2.1 Cloud Computing Architecture
Cloud computing is a concept first proposed by Google [9]. It is the development of distributed computing, grid computing and parallel computing. It distributes computing tasks to a large number of computers or virtual machines through the network, and realizes the decomposition of huge computing tasks, thereby obtaining the calculation results of the tasks faster. Therefore, it is very suitable for the analysis and processing of massive concurrent data. Currently the main popular cloud computing technologies are Hadoop and Spark. This paper uses Hadoop architecture to build the model. The main task deployment of Hadoop is divided into three parts: client machine, master node and slave node [10]. The master node is responsible for the supervision of HDFS (Hadoop Distributed File System) and Map Reduce, and the slave node is responsible for computing instructions and storing data [11].
The overall framework of Hadoop is shown in Fig. 1. Among them, HDFS is a distributed file system, MapReduce is a programming model, and HDFS and Map Reduce are two key functional modules of Hadoop. In addition, HBase is a distributed database based on the column storage model, and Pig is a data analysis platform that provides operations and programming interfaces for massive data parallel operations. Hive is a tool that provides SQL queries, Sqoop is a tool for data transfer between Hadoop and traditional databases, ZooKeeper is a collaborative working system, and Avro is a data serialization system [12].
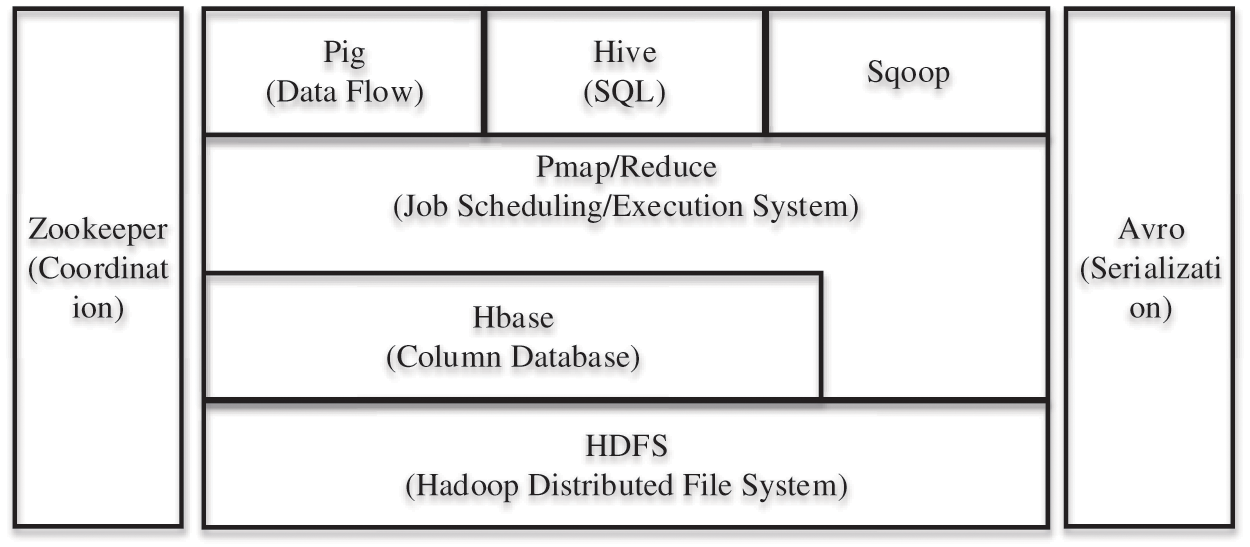
Figure 1: The overall framework of Hadoop
Random forest is an ensemble classification algorithm composed of several decision trees based on statistical learning theory [13,14]. The principle is to extract some samples of the original sample set by using the re-sampling method that can be replaced to train multiple decision trees. The final prediction result of the random forest model is obtained by comprehensively training the prediction results of multiple decision trees.
Suppose a random forest
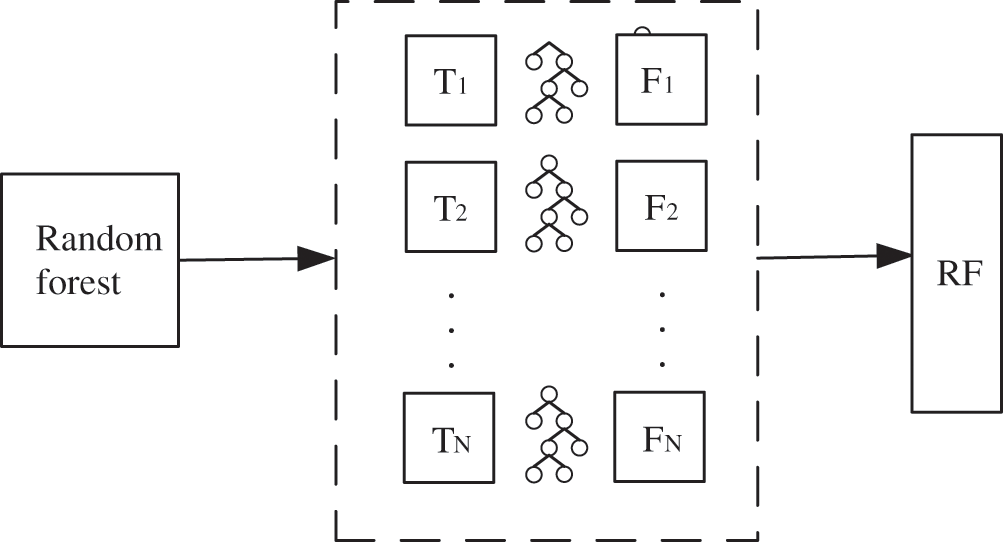
Figure 2: Random forest diagram
When constructing a random forest, an out-of-bag data set will be generated. The out-of-bag error of the out-of-bag data set can be used to measure the performance of the model. The random forest out-of-bag error formula is as follows:
The function Err is the count of the number of misclassifications.
According to random forest
The larger the margin value, the more reliable the classification prediction.
Since the collected electricity consumption data will have problems such as missing and irregularities, the data needs to be preprocessed. Preprocessing is divided into two steps: missing data completion and data standardization.
Use interpolation method to complete the data, set the original data set as
If continuous data is missing, for example,
Suppose the data set to complete the missing value completion is
The data set after preprocessing is
This paper uses the unique out-of-bag error of random forest to optimize the internal parameters of random forest and improve random forest to improve the performance of random forest model algorithm. Assume that the random forest model
We combine the drosophila algorithm to optimize the internal parameters of the random forest model [15,16]. In the process of random forest classification and recognition, the parameters that determine the accuracy are generally the number of decision trees TN and the size of the attribute feature subset FT. Where the number of decision trees TN is too large, the model training time may be too long, and too small will cause the accuracy to decrease, and the appropriate attribute features subset size FT can also greatly improve the model performance. Therefore, it is very important to TN and FT optimization, and the fruit fly algorithm can meet this requirement.
Suppose the size of the fruit fly population is
where
Then calculate the rate of change of
According to the change rate, the optimal step weight
Calculate the adaptive optimization route of drosophila:
then:
Repeat several times until the maximum number of iterations
Get the drosophila
3.3 Random Forest Model Based On Cloud Computing
On the built Hapood platform, use the MapReduce module to build a random forest model, the steps are as follows:
a) The random subspace sampling method is used for sampling, multiple sets of characteristic attribute sets
b) The data is distributed among each distributed computing node, and the information A of the characteristic attribute set is sent to each node, and each Map node gets a key/value pair.
c) Each Map node executes the program, reads and maps the information on the characteristic attribute set S of the mapper, and separately counts the branch information on different decision tree nodes, and obtains one or more key/value pairs after processing.
d) After all the Map work is completed, each Map node passes the information to the Reduce node, and the Reduce node merges the information, performs iterative calculations on the data with the same key, and calculates the nodes of the first layer of different decision trees.
e) Iteratively execute steps 2 to 4 until all decision trees are constructed.
In order to verify the performance of the algorithm, this article compares and verifies with the random forest model under a single server. Collect the daily electricity consumption data of 200 households in a community in Shanghai from August 2019 to August 2020, and collect the daily electricity consumption of each user every hour. Smart electricity collection equipment is installed in the residential houses of the community, and the high-power consumption equipment in the home, such as washing machines, refrigerators, air conditioners, etc., is transmitted to the home smart gateway wirelessly (433 MHz) to complete the data collection task. According to the daily power consumption trend, users are divided into eight categories, category 1 is high power consumption users throughout the day, and category 2 is peak power consumption users from 6 am to 9 am. Category 3 is the peak power user from 9 am to 12 am, Category 3 is the peak power user from 12 noon to 3 pm, and Category 4 is the peak power user from 3 pm to 5 pm. Category 5 is peak electricity consumption users from 5 to 7 pm, category 6 is peak electricity consumption users from 8 pm to 10 pm, category 7 is peak electricity consumption users from 10 pm to 1 am, and category 8 is low electricity consumption throughout the day power users. Use 70% of the collected electricity consumption data as the training set, and the remaining 30% as the test set.
To verify the performance of the model, the classification accuracy of the model under different data sets was tested Fig. 3. Data set A contains 3 types of electricity users, data set B contains 4 types of electricity users, data set C contains 5 types of electricity users, data set D contains 6 types of electricity users, and data set E contains 7 types of electricity users, Data set F contains 8 power users. It can be seen that as the data set contains more types, although the model classification accuracy rate has decreased, the overall classification remains above 90%.
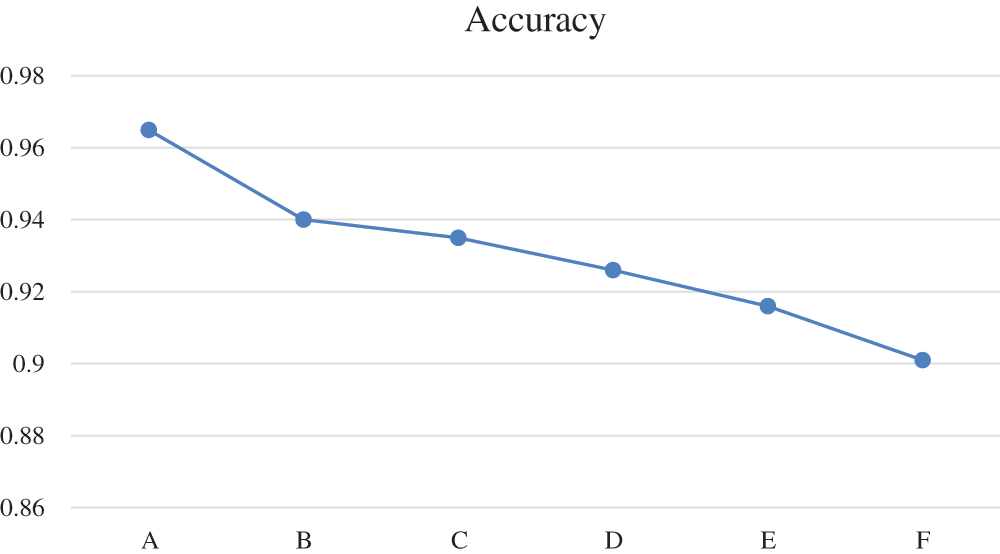
Figure 3: Model classification accuracy on different data sets
In order to verify the superiority of the model, the TN and FT of the traditional random forest are compared with the improved random forest proposed in this paper. As shown in the Figs. 4 and 5, it can be seen that the improved random forest model proposed in this paper is generally better than the traditional random forest in classification performance.
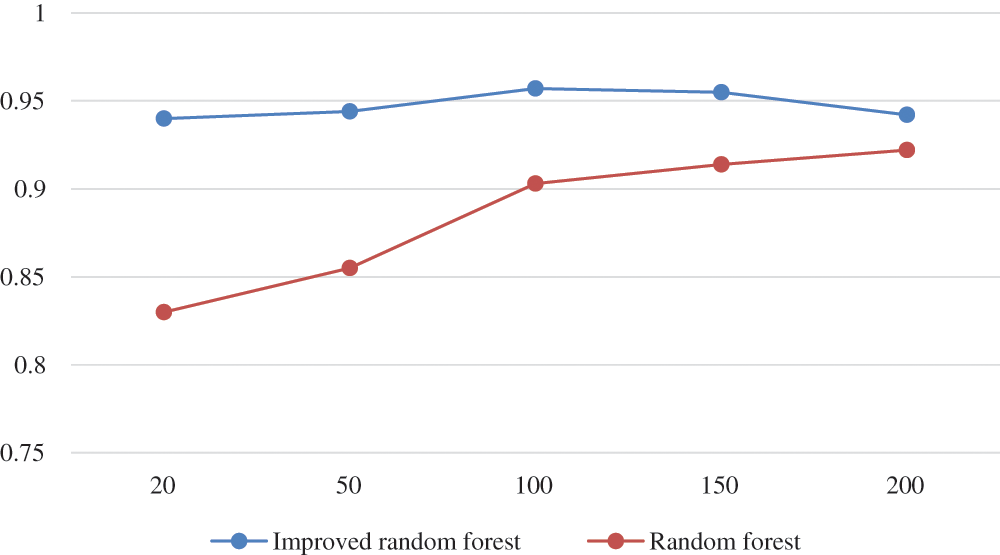
Figure 4: Change the classification accuracy of the decision tree number model
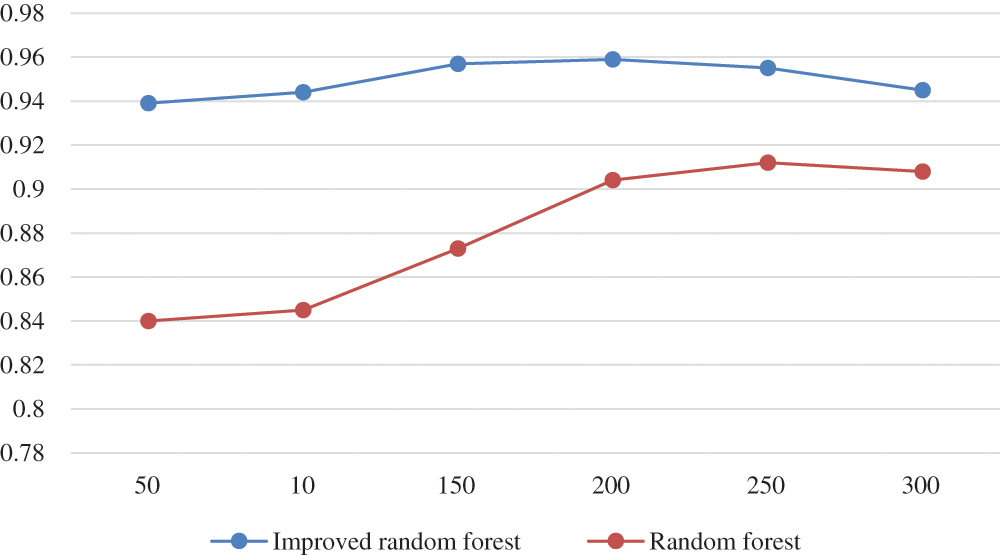
Figure 5: Change the classification accuracy of the attribute feature subset size model
In order to help the power supply side perform better resource management and distribution, it is necessary to classify the electricity consumption of residential users. Based on the distributed architecture of cloud computing, this paper uses an improved random forest model to design a residential electricity classification method. This method firstly uses the fruit fly algorithm to improve the random forest model, and then uses MapReduce to train the improved random forest model on the cloud computing platform. After that, the trained model is used to analyze the residential electricity consumption data set, and all residents are divided into 5 categories. And the effect of the model is verified through experiments.
Acknowledgement: This work was supported by the I6000 migration to the cloud micro-application pilot construction project of the Information and Communication Branch of State Grid Anhui Electric Power Co., Ltd., Technical project (contract number: SGAHXT00XYXX2000121).
Funding Statement: This work was partially supported by the National Natural Science Foundation of China (61876089).
Conflicts of Interest: The authors declare that they have no conflicts of interest to report regarding the present study.
1. C. Song, W. Xu, G. Han, P. Zeng, Z. Wang et al. (2020). , “A cloud edge collaborative intelligence method of insulator string defect detection for power IIoT,” IEEE Internet of Things Journal, vol. 2020, pp. 1–11. [Google Scholar]
2. B. Xu, Y. Sun, H. Wang and S. Yi. (2019). “Short-term electricity consumption forecasting method for residential users based on cluster classification and backpropagation neural network,” in 2019 11th Int. Conf. on Intelligent Human-Machine Systems and Cybernetics (IHMSCHangzhou, China, pp. 55–59. [Google Scholar]
3. C. Song, W. Xu, Z. Wang, S. Yu, P. Zeng et al. (2020). , “Analysis on the impact of data augmentation on target recognition for UAV-based transmission line inspection,” Complexity, vol. 2020, pp. 1–11. [Google Scholar]
4. O. A. Loktionov, O. E. Kondrateva, N. V. Zvonkova and D. A. Burdyukov. (2019). “Seasonal decomposition application for the energy consumption analysis of cities,” in 2019 Int. Youth Conf. on Radio Electronics, Electrical and Power Engineering (REEPEMoscow, Russia, pp. 1–4. [Google Scholar]
5. C. Liu, J. Wang, M. Wu, J. Bai, X. Wang et al. (2019). , “Research on the transformer area recognition method based on improved K-means clustering algorithm,” in 2019 IEEE Innovative Smart Grid Technologies—Asia (ISGT Asia). Chengdu, China, pp. 4137–4141. [Google Scholar]
6. J. Zhang. (2020). “Classification method of resident users based on load analysis,” Industrial Control Computer, vol. 33, no. 5, pp. 142–144. [Google Scholar]
7. C. Song, W. Jing, P. Zeng and C. Rosenberg. (2017). “An analysis on the energy consumption of circulating pumps of residential swimming pools for peak load management,” Applied Energy, vol. 195, no. 3, pp. 1–12. [Google Scholar]
8. C. Song, W. Jing, P. Zeng, H. Yu and C. Rosenberg. (2018). “Energy consumption analysis of residential swimming pools for peak load shaving,” Applied Energy, vol. 220, no. Part 3, pp. 176–191. [Google Scholar]
9. H. Zhang, G. Chen and X. Li. (2019). “Resource management in cloud computing with optimal pricing policies,” Computer Systems Science and Engineering, vol. 34, no. 4, pp. 249–254. [Google Scholar]
10. G. S. Bhathal and A. S. Dhiman. (2018). “Big data solution: improvised distributions framework of Hadoop,” in 2018 Second Int. Conf. on Intelligent Computing and Control Systems (ICICCSMadurai, India, pp. 35–38. [Google Scholar]
11. V. Sontakke and R. B. Dayanand. (2019). “Optimization of Hadoop MapReduce model in cloud computing environment,” in 2019 Int. Conf. on Smart Systems and Inventive Technology (ICSSITTirunelveli, India, pp. 510–515. [Google Scholar]
12. T. Wilcox and J. Nanlin. (2019). “A Big Data platform for smart meter data analytics,” Computers in Industry, vol. 105, pp. 250–259. [Google Scholar]
13. Y. Yang, P. Fu, X. Yang, H. Hong and D. Zhou. (2020). “MOOC learner’s final grade prediction based on an improved random forests method,” Computers Materials & Continua, vol. 65, no. 3, pp. 2413–2423. [Google Scholar]
14. X. L. Wei, J. W. Liu, Y. A. Wang, C. G. Tang and Y. Y. Hu. (2021). “Wireless edge caching based on content similarity in dynamic environments,” Journal of Systems Architecture, vol. 115, no. 2, pp. 102000. [Google Scholar]
15. F. Bi, X. Fu1, W. Chen, W. Fang, X. Miao et al. (2020). , “Fire detection method based on improved fruit fly optimization-based SVM,” Computers Materials & Continua, vol. 62, no. 1, pp. 199–216. [Google Scholar]
16. A. Feng, Z. Gao, X. Song, K. Ke, T. Xu et al. (2020). , “Modeling multi-targets sentiment classification via graph convolutional networks and auxiliary relation,” Computers Materials & Continua, vol. 64, no. 2, pp. 909–923. [Google Scholar]
 | This work is licensed under a Creative Commons Attribution 4.0 International License, which permits unrestricted use, distribution, and reproduction in any medium, provided the original work is properly cited. |