DOI:10.32604/csse.2021.016404
| Computer Systems Science & Engineering DOI:10.32604/csse.2021.016404 | |
| Article |
Differential Evolution Algorithm Based Self-adaptive Control Strategy for Fed-batch Cultivation of Yeast
1Jiangsu Key Lab of IoT Application Technology, Wuxi Taihu University, Wuxi, 214064, China
2The key Laboratory of Industrial Biotechnology, Ministry of Education, School of Biotechnology, Jiangnan University, Wuxi, 214122, China
3Department of Food Processing Technology, Harare Institute of Technology, Harare, Zimbabwe
*Corresponding Author: Sunli Cong. Email: 1261937895@qq.com
Received: 01 January 2021; Accepted: 02 February 2021
Abstract: In the fed-batch cultivation of Saccharomyces cerevisiae, excessive glucose addition leads to increased ethanol accumulation, which will reduce the efficiency of glucose utilization and inhibit product synthesis. Insufficient glucose addition limits cell growth. To properly regulate glucose feed, a different evolution algorithm based on self-adaptive control strategy was proposed, consisting of three modules (PID, system identification and parameter optimization). Performance of the proposed and conventional PID controllers was validated and compared in simulated and experimental cultivations. In the simulation, cultivation with the self-adaptive control strategy had a more stable glucose feed rate and concentration, more stable ethanol concentration around the set-point (1.0 g•L-1), and final biomass concentration of 34.5 g-DCW•L-1, 29.2% higher than that with a conventional PID control strategy. In the experiment, the cultivation with the self-adaptive control strategy also had more stable glucose and ethanol concentrations, as well as a final biomass concentration that was 37.4% higher than that using the conventional strategy.
Keywords: Saccharomyces cerevisiae; Ethanol accumulation; differential evolution algorithm; self-adaptive control
The addition of both excessive and insufficient carbon sources is detrimental to cell growth and product formation in the cultivation of microorganisms and the accumulation of by-products and catabolite repression caused by the addition of excessive carbon sources is common occurrences [1]. The fed-batch cultivation technique is widely used to relieve these problems [2]. However, even with the fed-batch technique, the accumulation of by-products cannot be avoided [3]. Therefore, the development of a suitable feeding strategy is critical in fed-batch cultivation [4].
Due to the lack of reliable on-line sensors, the concentration of glucose (carbon source) cannot be measured on-line in most S. cerevisiae cultivations. Thus, directly maintaining the level of glucose at a desired concentration is infeasible. Although control strategies based on the process model of S. cerevisiae cultivation have been introduced to determine the glucose feed rate [5–7], their application was restricted by the poor generality of these process models. Dissolved oxygen (DO) and pH are datas related to glucose can be measured on-line in fed-batch cultivation, because their changing patterns indirectly reflect substrate consumption and depletion. As a result, DO-Stat and pH-Stat are widely used as the simplest feedback feeding strategy to avoid excessive substrate addition [8]. Under the DO-Stat strategy, DO suffers from large and frequent fluctuations. Excessively high DO is cytotoxic and significantly reduces cell viability. Meanwhile, an anaerobic environment can damage the normal carbon metabolism in cells [9]. Under pH-Stat, frequent substrate depletion also reduces cell growth and the synthesis of products [10,11]. A high respiratory quotient (RQ) reflects excessive glucose addition in S. cerevisiae cultivation. Controlling RQ at a proper set-point is an effective method to determine glucose feed rate [12]. These strategies don’t rely on process models and can be applied to other cultivations to solve many problems, instead of a substrate feeding strategy based on a specific model can only be applied to the cultivation described by the model.
DO, pH and RQ are not the only on-line measurements that can be used as the basis for adjusting the glucose feed rate. Ethanol concentration is one the most significant state variables in S. cerevisiae cultivation, and it can be measured on-line by the previously reported method [13]. The accumulation of a small percentage of ethanol is the ideal state in S. cerevisiae cultivation. These low concentrations not only do not repress cell growth and product synthesis, but also indicate adequate glucose supply, which is a prerequisite for successful cultivation. In the present study, we attempted to measure and control the ethanol concentration at very low levels by regulating the glucose feed rate.
The conventional proportional-integral-differential (PID) controller with constant parameters is the most widely used controller in industrial production to reflect ethanol concentration. However, the performance of these controllers in bioprocess is often unsatisfying due to non-linear, time varying and slow response nature. To improve the performance of a PID controller, its parameters should be automatically tuned on-line. Auto tuning techniques are mainly classified as model based and model free [14,15]. The model based control techniques rely on linear mathematical models of processes and may not produce good results in the presence of process non-linearity and parametric uncertainty [16]. Model free tuning techniques are mainly based on fuzzy logic, neural network or fuzzy-neural network [17–19]. Fuzzy logic needs complex fuzzy rules and a large number of parameters to be determined prior to implementation, requiring significant effort. In the application of neural network, training is a time-consuming process. The differential evolution (DE) algorithm, proposed by Storn and Price [20], is a simple yet powerful population-based stochastic search technique, which is an efficient and effective global optimizer in the continuous search domain, and has been successfully applied in diverse fields [21–24]. Compared with fuzzy logic and neural network, DE needs only two parameters (F and CR, described in Theoretical Aspects section) and has a fast convergence rate, making it more suitable to be applied in on-line control situations. Adopting a DE algorithm for the tuning of PID parameters, we propose a self-adaptive control strategy to control ethanol concentration in S. cerevisiae fed-batch cultivation. Finally, the control performance of a conventional PID and the proposed self-adaptive controller were validated and compared both in simulation and in experiment.
Traditional PID is the most widely used feedback control strategy. The incremental PID algorithm is described by Eq. (1), in which k is the sampling point, F represents the glucose feed rate and kp, ki, kd are control parameters with constant values. e is the error value between set-point (Ce,set) and real value (Ce) of the ethanol concentration, meaning that e = Ce,set – Ce.
2.2 DE Based Self-adaptive Control
A self-adaptive controller capable of automatically tuning kp, ki and kd to improve the performance of the incremental PID controller was proposed. As shown in Fig. 1, the self-adaptive controller consists of three modules: 1) the incremental PID module; 2) the system identification module based on autoregressive moving average model (ARMA); 3) the control parameter optimization module based on the DE algorithm. The procedure of the self-adaptive control is depicted as follows.

Figure 1: Schematic diagram of the DE-PID controller
Ce,set and the initial values of kp, ki and kd were set first. When k < 4, there was not enough data to support the implementation of system identification and control parameter optimization modules. Ce(k) was collected and saved and the glucose feed rate F(k) was calculated using the incremental PID module.
When k ≥ 4, system identification (ARMA model) and control parameter optimization (DE algorithm) modules were turned on. ARMA model can recognize the relationship between data with short intervals, and has been widely used in time series analysis and prediction [25,26]. The general form of the ARMA model is written in Eq. (2), in which x and y are the inputs and outputs of the model, respectively, a1, a2, …,an, b1, b2, …,bm are the parameters, and E is the error of the ARMA model. In the present work, the ARMA model was used to describe the relationship between Ce (output) and F (input). Setting n = m = 1, the general form is transformed to Eq. (3). The parameters a1 and b1 were estimated according to the principle of the least square, which is represented by Eq. (4). The matrices Xm and Ym are defined as Eq. (5), and then the model parameter matrix θ = [a1, b1]T is obtained from Eq. (6).
Kinetic characteristics of fed-batch cultivation change continuously with cell growth, and newer data more accurately reflect the current kinetic characteristics. Therefore, for the accuracy of the ARMA model, data from different sampling points should be multiplied by different weight coefficients. Defining a forgetting factor λ = 0.95 and a weight coefficient matrix W (Eq (7)), Eq. (6) is finally modified to become Eq. (8), with which the parameters of the ARMA model can be calculated. Ce(k+1) can be predicted by Eq. (9) when Ce(k) and F(k) are known.
2.2.3 Definition of Objective Function
PID control parameters at k-1 sampling point are expressed by kp(k-1), ki(k-1), kd(k-1). The strategy of renewing each of them is shown in Eq. (10). As F(k-1), kp(k-1), ki(k-1), kd(k-1), e(k-2), e(k-1) and e(k) are known, F(k+1) is considered as the function of p1, p2 and p3 (Eq. (11)). Ethanol concentration at k+1 and k+2 points are predicted by Eqs. (12) and (13), respectively, if the glucose feed rate is maintained at F(p1, p2, p3). The objective function G(p1, p2, p3) is defined by Eq. (14). To control ethanol concentration at its set-point, the best p1, p2 and p3 should be solved for optimization of the function G, as expressed by Eq. (15).
2.2.4 On-line Optimization of PID Control Parameters with DE Algorithm
2.2.4.1 Generating Initial Population
Setting population size as NP = 100, the initial population is generated randomly. Individuals in the population are expressed as a vector
2.2.4.2 Operation of Mutation, Crossover and Selection
For each target vector
The trial vector U =[u1,u2,u3] is formed according to Eq. (17), where the crossover constant CR = 0.8, Rj is the jth evaluation of a uniform random number generator with outcome ∈ [0,1]. RN is a randomly chosen index ∈{1,2,3} which ensures that U gets at least one parameter from VDE. The selection is described by Eq. (18).
The procedure of mutation-crossover-selection is repeatedly implemented until Pbest is not renewed within 8 iterations, which indicates that the objective function has converged. The current Pbest = [p1,best p2,best p3,best] is considered as the optimal solution of Eq. (15). The values of p1,best, p2,best, p3,best are substituted into Eq. (11), to calculate the optimal F(k) and using it to regulate ethanol concentration.
2.3 Process Model of Yeast Fed-batch Cultivation
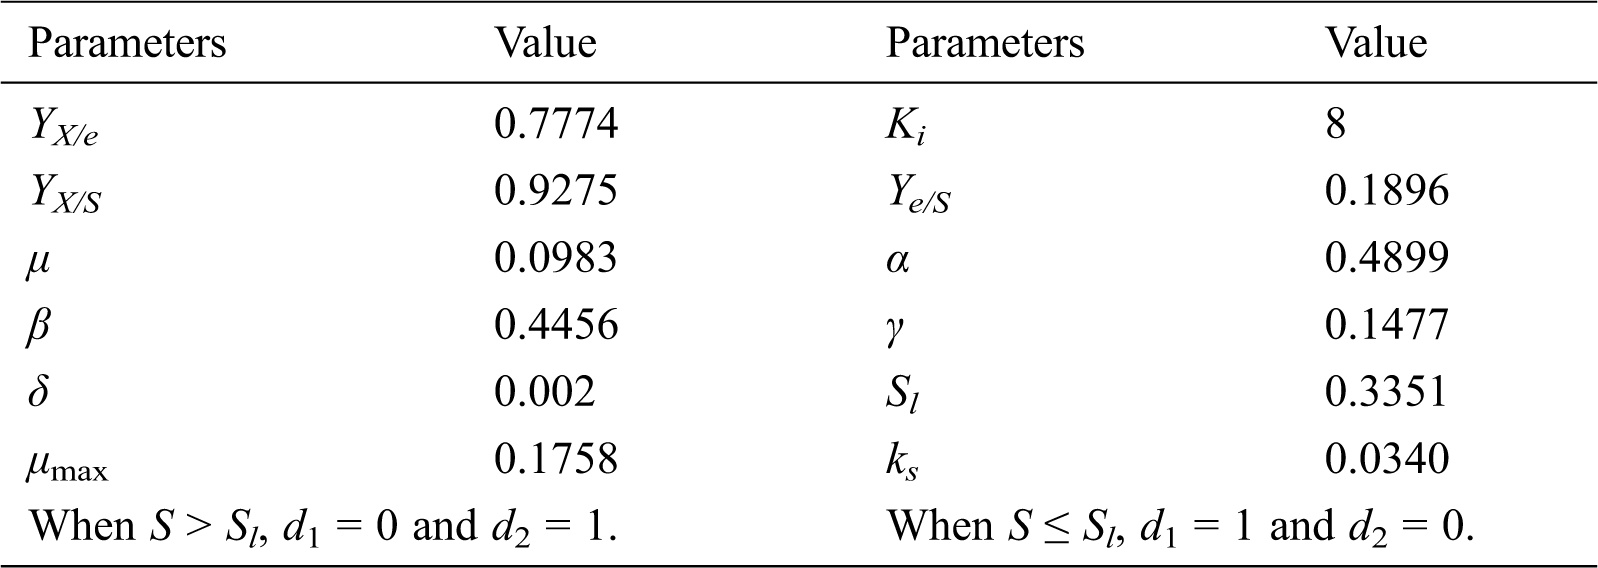
The mechanistic behavior of the S. cerevisiae cultivation system is well explained by a mathematical model, which has been previously reported [27] and was modified in the present work. The model is expressed as Eq. (19), where X, S, Ce represent the concentrations of biomass (g•L-1), glucose (g•L-1) and ethanol (g•L-1), respectively; V represents the working volume of the fermenter; F, Sin represent the flow rate (L•h-1) and concentration of feed (g•L-1), respectively. πe is the specific ethanol production rate (h-1) and νe is the specific growth rate (h-1) by the assimilation of ethanol, which are calculated by Eq. (20).
In addition, whenever πe and νe are negative values, they should be taken as zero. Parameter values in the model were adjusted in the present study and are shown in Tab. 1.
Table 1: Parameter values of the model describing fed-batch cultivation of S. cerevisiae
The usefulness and the validity of the incremental PID and the proposed self-adaptive controller were discussed using the computer simulation based on the assumption that the mathematical model was a real system. In the process of simulation, random error in the range of ±3% was added to Ce.
3.1 Fed-batch Cultivation of S. cerevisiae in 7 L Bioreactor
Seed medium for the cultivation of S. cerevisiae consisted of (in g•L-1): glucose 20, yeast extract 8.5, (NH4)2SO4 1.3, MgSO4•7H2O 0.1, CaCl2•2H2O 0.06. Batch medium (in g•L-1): glucose 5, yeast extract 12, (NH4)2SO4 2.5, MgSO4•7H2O 1.5, CaCl2•2H2O 0.1. Feeding medium consisted of 500 g•L-1 glucose. Fed-batch cultivations were carried out in a 7 L bioreactor equipped with on-line DO/pH measurements, with an initial medium volume of 3 L. Broth temperature was strictly controlled at 30°C and pH was maintained at 6.0 by adding 25% (v/v) ammonium hydroxide. Glucose feed rate was automatically regulated by conventional PID and DE algorithm based adaptive control strategies, which are described in the Theoretical Aspects section.
The concentration of cells was determined by measuring the optical density at 600 nm (OD600), and then dry cell weight (DCW) by a consistent calibration curve of DCW versus OD600 (DWC g•L-1 = 0.25 × OD600). Ethanol concentration was measured on-line according to a published method [12]. Glucose concentration was determined with SBA-40C biosensor (Shandong Academy of Science, China).
4.1 Simulated Fed-batch Cultivation under PID Control Strategy
An incremental PID is the most widely-used feedback controller and was applied to the simulated fed-batch cultivation represented by Eqs. (19) and (20). kp, ki and kd were set as 0.0017, 0.0599 and 0.0224, respectively, according to the result of off-line optimization with genetic algorithm, and Sin was given the value of 500 g•L-1. F was regulated by the incremental PID algorithm to control ethanol concentration at its set-point. The accumulation of low levels of ethanol in S. cerevisiae cultivation indicates ideal fermentation status and sufficient glucose addition. Therefore, the ethanol concentration was set as 1 g•L-1. The differential equations in Eq. (19) were solved by the Runge-Kutta method with the initial state of X = 0.375 g•L-1, Ce = 1 g•L-1, S = 5 g•L-1 and V = 3 L, and a sampling interval was 0.05 h. Profiles of F, Ce and S are shown in Figs. 2a, 2b and 2c, respectively.

Figure 2: Profiles of substrate feed rate (F), ethanol concentration (Ce) and glucose concentration (S) under PID and DE-PID control strategies. a, b and c: profiles under PID control; d, e and f: profiles under DE-PID control

Figure 3: Biomass concentrations (X) under PID and DE-PID control strategies. Open circles: X under PID control; filled circles: X under DE-PID control
When adjusted by the PID algorithm, F fluctuated increasingly. In the period between 40 h~50 h, it oscillated between 0 and 0.25 L•h-1 (Fig. 2a). With a shifting value of F, it was also difficult to steadily maintain Ce at 1 g•L-1. The error between the set-point and the real value of Ce kept increasing, and it reached a level of approximately 0.8 g•L-1 at the end of fermentation. In addition, S also fluctuated in the range between 0 and 0.34 g•L-1 after 12 h, meaning that the process had to be frequently shifted between the states of accumulating ethanol (S > Sl, Tab. 1) and glucose starvation. Due to the severe fluctuations of F, Ce and S, the control performance of the standard PID was unsatisfactory, most likely because the constant kp, ki and kd were unable to deal with a bioprocess whose cell growth, glucose consumption and by-product accumulation rates gradually increased. Finally, X at the end only reached 26.7 g•L-1. With 1173 g glucose consumed in this batch, the yield of biomass with glucose was 0.12 g-DCW•g-glucose-1(Fig. 3).
4.2 System Identification Based on ARMA Model
As shown in Eq. (14), the objective function for control parameter optimization is actually the error between the set-point and predicted value of Ce. Therefore, an ARMA model, which can accurately predict the value of Ce, is the prerequisite for optimizing control parameters. Different glucose feed trajectories depicted in Figs. 4a, 4b and 4c were intentionally designed. Real Ce (obtained from the process model) and predicted Ce (calculated by ARMA model) with these feed trajectories are plotted and compared in Figs. 4d, 4e and 4f. The predicted value of Ce precisely followed its real value, indicating that the ARMA model was accurate enough to support the DE based self-adaptive controller.

Figure 4: Glucose feed rate (F) profiles, and the corresponding real and predicted ethanol concentrations (Ce). a, b and c: F profiles with sine, exponential and random curves, respectively; d, e and f: real and predicted Ce with sine, exponential and random curve feed rate profiles, respectively. Open circles: real Ce; dash lines: predicted Ce
4.3 Simulated Fed-batch Cultivation under DE-PID Control Strategy
The DE-PID control strategy, including ARMA system identification, was also applied to the fed-batch cultivation of S. cerevisiae. The ethanol concentration set-point and Sin were also given the values of 1 g·L-1 and 500 g·L-1. The initial value of kp, ki and kd were set as 0.0017, 0.0599 and 0.0224, respectively. In simulation, the differential equations were solved with the same initial state and sampling interval. Profiles of F, Ce and S are shown in Figs. 2d, 2e and 2f, respectively.
F continuously increased after 10 h, but was limited to a narrow range and severe fluctuations were avoided. As F was more stable, fluctuations in the glucose concentration were reduced, and “glucose starvation”, which frequently occurred under PID control strategy, was seldom observed. The improved control performance in glucose feed effectively stabilized the ethanol concentration that was still in the range of 1 ± 0.2 g·L-1 until the end of fermentation. Unlike the batch using the PID, the batch with DE-PID had changeable values of kp, ki and kd (Fig. 5), and they were renewed on-line by the DE algorithm for dealing with the gradually increasing cell growth, glucose consumption and by-product accumulation rates. As a result, the final X reached 34.5 g·L-1, which was 29.2% higher than that under the PID control strategy. As 1282 g glucose was consumed in this batch, the yield of biomass with respect to glucose was 0.15 g-DCW·g-glucose-1, 25% higher than that under the PID strategy. The DE-PID was obviously superior to a conventional PID control strategy for the fed-batch cultivation of S. cerevisiae.

Figure 5: Variation of kp, ki and kd in the batch using the DE-PID control strategy
4.4 Robustness of the DE-PID Control Strategy
The robustness of a control system is an important index in evaluating the control performance. Fig. 6 indicates the changing patterns of F and Ce, when the Ce set-point was shifted and the cultivation was subject to disturbance and fault. As shown in Figs. 6a and 6b, when the Ce set-point was shifted from 1 g·L-1 to 2 g·L-1 at 20 h, F increased sharply also increasing Ce, and Ce was then stabilized at a new set-point before 22 h, overshooting the set point by less than 1 g·L-1. The set-point was shifted back to 1 g·L-1 at 35 h. As glucose addition was temporarily stopped after 35 h, Ce reduced and stabilized at the desired level within 1 h, as shown in Figs. 6c and 6d. To further validate the robustness of the DE-PID strategy, a pump fault interrupting the addition of glucose was imitated during the simulation at 30 h. As shown in Fig. 6e, the pump stopped working at 30 h, leading to a sudden decrease in Ce, and although the response was to suddenly increase F, this could not be implemented with a broken pump. When the failure was detected and trouble shooting was conducted at 30.5 h, then glucose was rapidly added with the high calculated F, and Ce returned to its original set-point of 1 g·L-1 within 0.5 h. The robustness of the DE-PID control system in dealing with set-point changes and outer disturbances was verified.

Figure 6: The robustness of the DE-PID controller in response to ethanol concentration set-point changes and disturbance during fermentation. a and b: changing patterns of ethanol concentration (Ce) and glucose feed rate (F) to a Ce set-point change from 1 g•L-1 to 2 g•L-1; c and d: changing patterns of Ce and F to Ce a set-point change from 2 g•L-1 to 1 g•L-1; e and f: changing patterns of Ce and F to a pump fault
4.5 Experimental Fed-batch Cultivations under PID and DE-PID Control Strategies
Although the control performance and robustness validated by simulated fed-batch cultivations was satisfying, it is not enough for a successful on-line control strategy. The control performance of the DE-PID also needed to be tested in experiment. Therefore, two runs of S. cerevisiae fed-batch cultivation, using PID and DE-PID control strategies, respectively, were conducted in a 7L fermenter. Ce, S and X in the two runs are shown in Fig. 7. It was observed that S under the DE-PID strategy was lower and more stable (Fig. 7c), resulting in a more stable ethanol concentration (Figs. 7a and 7b). Due to the proper glucose addition, the final X with the DE-PID strategy was 24.63 g-DCW·L-1, which was 37.4% higher than that with a conventional PID strategy.

Figure 7: Ethanol concentration (Ce), glucose concentration (S) and biomass concentrations (X) profiles under PID and DE-PID control strategies. a: Ce under the PID control strategy. b: Ce under the DE-PID control strategy. c: S under both PID and DE-PID control strategies. Filled circles: DE-PID; open circles: PID. d: X under PID and DE-PID control strategies. Filled circles: DE-PID; open circles: PID
The proposed DE-PID control strategy has the following characteristics: 1) It does not rely on the process model, as real-time status of cultivation was identified on-line by the ARMA mode and can therefore be applied in other fed-batch cultivation processes, as well as be used to control other on-line measurements, such as DO, QR, CER and OUR. 2) If the cultivation system is too complex to be identified by the ARMA model, it can be replaced with other non-linear and intelligent models, such as neural network or support vector machine. This means that the DE-PID control strategy has the potential of dealing with more complicated cultivation systems than S. cerevisiae cultivation. 3) The DE algorithm, which was shown to be faster than other traditional evolutionary algorithms [18] (such as genetic algorithm), gives fast operational speed to the DE-PID strategy, making DE-PID able to be easily applied in experimental fed-batch cultivation for on-line control.
In conclusion, a self-adaptive controller based on differential evolution algorithm was developed to regulate the glucose feed rate in the fed-batch cultivation of S. cerevisiae, with the purpose of avoiding ethanol accumulation and glucose insufficiency. Compared with a conventional PID controller, the DE-PID strategy has improved performance in stabilizing glucose feed rate, glucose and ethanol concentrations, as well as in promoting cell growth, in both simulated and experimental cultivations.
Funding Statement: The authors received no specific funding for this study.
Conflicts of Interest: The authors declare no conflicts of interest to report regarding the present study.
1. L. F. Liu, Y. M. Zhang, Z. H. Liu, D. Petranovic and J. Nielsen. (2015). “Improving heterologous protein secretion at aerobic conditions by activating hypoxia-induced genes in Saccharomyces cerevisiae,” Fems Yeast Research, vol. 15, no. 7, pp. 1–10. [Google Scholar]
2. M. T. Huang, J. C. Bao, B. M. Hallstr, D. Petranovic and J. Nielsen. (2017). “Efficient protein production by yeast requires global tuning of metabolism,” Nature Communications, vol. 8, no. 1, pp. 11–31. [Google Scholar]
3. A. J. Peng, K. Deng, S. H. Luo and H. Zeng. (2020). “Multi-purpose forensics of image manipulations using residual-based feature,” Computers, Materials & Continua, vol. 65, no. 3, pp. 2217–2231. [Google Scholar]
4. G. O. Xavier, C. Elena, P. Ferrer, J. Albiol, L. M. S. Jose et al. (2019). , “Rational development of bioprocess engineering strategies for recombinant protein production in Pichia pastoris (Komagataella phaffii) using the methanol-free GAP promoter,” Where do we stand, New Biotechnology, vol. 53, pp. 24–34. [Google Scholar]
5. V. Galvanauskas, O. Grigs, J. Vanags, K. Dubencovs, V. Stepanova et al. (2013). , “Model-based optimization and pO(2) control of fed-batch Escherichia coli and Saccharomyces cerevisiae cultivation processes,” Engineering in Life Sciences, vol. 13, no. 2, pp. 172–184. [Google Scholar]
6. A. Shokry, P. Barald, E. Zio and A. Espuna. (2020). “Dynamic surrogate modelling for multistep-ahead prediction of multivariate nonlinear chemical processes,” Industrial & Engineering Chemistry Research, vol. 59, no. 35, pp. 15634–15655. [Google Scholar]
7. S. V. Saraiva, F. V. Silva and F. O. Carvalho. (2020). “Comparative analysis of machine learning models for predictive control of the cyclopentadine production process,” Chemical Product and Process Modeling, vol. 15, no. 3, pp. 665. [Google Scholar]
8. J. Kaur, A. Kumar and J. Kaur. (2018). “Strategies for optimization of heterologous protein expression in E. coli: Roadblocks and reinforcements,” International Journal of Biological Macromolecules, vol. 106, no. 11, pp. 803–822. [Google Scholar]
9. J. Ding, C. L. Zhang, M. J. Gao, G. L. Hou, K. X. Liang et al. (2014). , “Enhanced porcine circovirus Cap protein production by Pichia pastoris with a fuzzy logic DO control based methanol/sorbitol co-feeding induction strategy,” Journal of Biotechnology, vol. 177, pp. 35–44. [Google Scholar]
10. M. Han, J. Z. Xu, Z. M. Liu, H. Qian and W. G. Zhang. (2018). “Co-production of microbial oil and exopolysaccharide by the oleaginous yeast Sporidiobolus pararoseus grown in fed-batch culture,” Rsc Advances, vol. 8, no. 6, pp. 3348–3356. [Google Scholar]
11. K. L. Yeh, C. Y. Chen and J. S. Chang. (2012). “pH-stat photoheterotrophic cultivation of indigenous Chlorella vulgaris ESP-31 for biomass and lipid production using acetic acid as the carbon source,” Biochemical Engineering Journal, vol. 64, pp. 1–7. [Google Scholar]
12. A. Qasim and S. A. R. Kazmi. (2019). “Formal modelling of real-time self-adaptive multi-agent systems,” Intelligent Automation & Soft Computing, vol. 25, no. 1, pp. 49–63. [Google Scholar]
13. J. Ding, M. J. Gao, G. L. Hou, K. X. Liang, R. S. Yu et al. (2014). , “Stabilizing porcine interferon-α production by Pichia pastoris with an ethanol on-line measurement based DO-Stat glycerol feeding strategy,” Journal of Chemical Technology & Biotechnology, vol. 89, no. 12, pp. 1948–1953. [Google Scholar]
14. C. Anitescu, E. Atroshchenko, N. Alajlan and T. Rabczuk. (2019). “Artificial neural network methods for the solution of second order boundary value problems,” Computers, Materials & Continua, vol. 59, no. 1, pp. 345–359. [Google Scholar]
15. S. A. Q. Mohammed, A. T. Nguyen, H. H. Choi and J. W. Jung. (2020). “Improved iterative learning control strategy for surface-mounted permanent magnet synchronous motor drives,” IEEE Transactions on Industrial Electronics, vol. 67, no. 12, pp. 10134–10144. [Google Scholar]
16. R. Singh and B. Bhushan. (2020). “A novel fault classification-based fault-tolerant control for two degree of freedom helicopter systems,” International Journal of Adaptive Control and Signal Processing, vol. 34, no. 8, pp. 1080–1104. [Google Scholar]
17. J. Armendariz, P. V. Vicente, G. R. Rodolfo and S. Rosales. (2014). “Neuro-fuzzy self-tuning of PID control for semiglobal exponential tracking of robot arms,” Applied Soft Computing, vol. 25, no. 3, pp. 139–148. [Google Scholar]
18. V. Kumar, P. Gaur and A. P. Mittal. (2014). “ANN based self tuned PID like adaptive controller design for high performance PMSM position control,” Expert Systems with Applications, vol. 41, no. 17, pp. 7995–8002. [Google Scholar]
19. B. Nagaraj, D. Pelusi and J. I. Chen. (2020). “Special section on emerging challenges in computational intelligence for signal processing applications,” Intelligent Automation & Soft Computing, vol. 26, no. 4, pp. 737–739. [Google Scholar]
20. R. Storn and K. Price. (1997). “Differential evolution - A simple and efficient heuristic for global optimization over continuous spaces,” Journal of Global Optimization, vol. 11, no. 4, pp. 341–359. [Google Scholar]
21. A. Y. Hamed, M. H. Alkinani and M. R. Hassan. (2020). “A genetic algorithm optimization for multi-objective multicast routing,” Intelligent Automation & Soft Computing, vol. 26, no. 4, pp. 1201–1216. [Google Scholar]
22. M. D. Kapadi and R. D. Gudi. (2004). “Optimal control of fed-batch fermentation involving multiple feeds using Differential Evolution,” Process Biochemistry, vol. 39, no. 11, pp. 1709–1721. [Google Scholar]
23. E. D. Moreno-Medrano, O. E. Valentín, N. Casillas, M. A. Pedroza-Toscano, N. Casillas et al. (2019). , “Mechanistic interpretation for xanthate adsorption onto galena through electrochemical impedance spectrum fitting by a differential evolution algorithm,” International journal of electrochemical Science, vol. 15, pp. 666–676. [Google Scholar]
24. U. Yuzge. (2018). “Chaotic based differential evolution algorithm for optimization of baker’s yeast drying process,” Egyptian Informatics Journal, vol. 19, no. 3, pp. 151–163. [Google Scholar]
25. H. Liu, X. W. Mi and Y. F. Li. (2018). “Wind speed forecasting method based on deep learning strategy using empirical wavelet transform, long short term memory neural network and Elman neural network,” Energy Conversion and Management, vol. 156, no. June, pp. 498–514. [Google Scholar]
26. S. J. Huang, T. S. Lee, W. H. Li and R. Y. Chen. (2019). “Modular on-road AGV wireless charging systems via interoperable power adjustment,” IEEE Transactions on Industrial Electronics, vol. 66, no. 8, pp. 5918–5928. [Google Scholar]
27. T. Takamatsu, S. Shioya, Y. Okada and M. Kanda. (1985). “Profile control scheme in a Bakers’ yeast fed-batch culture,” Biotechnology and Bioengineering, vol. 27, no. 12, pp. 1675–1686. [Google Scholar]
 | This work is licensed under a Creative Commons Attribution 4.0 International License, which permits unrestricted use, distribution, and reproduction in any medium, provided the original work is properly cited. |