DOI:10.32604/csse.2021.015275
| Computer Systems Science & Engineering DOI:10.32604/csse.2021.015275 | |
| Article |
A Cuckoo Search Detector Generation-based Negative Selection Algorithm
1Department of Mathematical Sciences, Faculty of Science, Augustine University, Ilara-Epe, Lagos, Nigeria
2Department and College of Computer Science, King Khalid University, Abha, Kingdom of Saudi Arabia
*Corresponding Author: Ayodele Lasisi. Email: lasisiayodele@yahoo.com
Received: 14 November 2020; Accepted: 02 February 2021
Abstract: The negative selection algorithm (NSA) is an adaptive technique inspired by how the biological immune system discriminates the self from non-self. It asserts itself as one of the most important algorithms of the artificial immune system. A key element of the NSA is its great dependency on the random detectors in monitoring for any abnormalities. However, these detectors have limited performance. Redundant detectors are generated, leading to difficulties for detectors to effectively occupy the non-self space. To alleviate this problem, we propose the nature-inspired metaheuristic cuckoo search (CS), a stochastic global search algorithm, which improves the random generation of detectors in the NSA. Inbuilt characteristics such as mutation, crossover, and selection operators make the CS attain global convergence. With the use of Lévy flight and a distance measure, efficient detectors are produced. Experimental results show that integrating CS into the negative selection algorithm elevated the detection performance of the NSA, with an average increase of 3.52% detection rate on the tested datasets. The proposed method shows superiority over other models, and detection rates of 98% and 99.29% on Fisher’s IRIS and Breast Cancer datasets, respectively. Thus, the generation of highest detection rates and lowest false alarm rates can be achieved.
Keywords: Negative selection algorithm; detector generation; cuckoo search; optimization
The biological immune system (BIS), a unique, powerful, and orchestrated system against the influx of pathogens, viruses, and bacteria, protects the body from being damaged and infected. The BIS handles this process through the recognition and detection of foreign elements (non-self) and thereby causing their annihilation. The white blood cells (lymphocytes), that is, the B-cells and T-cells, are responsible for handling these detection and elimination process in the body. The main purpose is basically to distinguish what is self from what is non-self [1]. A process in the body known as negative selection depends solely on the maturation of T-cells in the thymus. This occurs by eliminating T-cells reacting to self-cells. Non-reactive T-cells circulate the body to detect foreign cells. An artificial immune system (AIS) algorithm that mimics the negative selection process was proposed and developed in Forrest et al. [2], and is referred to as the negative selection algorithm (NSA). It is based on binary representation. The real-valued representations of the real-valued negative selection algorithm (RNSA) with constant-sized detectors [3] and real-valued negative selection with variable-sized detectors (V-Detectors) [4] having also been proposed. Their usage has flourished in diverse functional disciplines such as anomaly detection [5,6], data classification and fault diagnosis [7,8], path testing [9], as well as hardware tolerance [10]. Other prominent AIS algorithms are artificial immune network algorithms [11], clonal selection algorithms [12,13], and dendrite-based algorithms [14,15].
Despite the success rate of the NSA in different application domains, it comes with its own deficiencies and drawbacks, which are attributed to its random detectors [16,17]. The issue with the randomly generated detectors lies with the efficient generation of detectors that effectively occupies the non-self space [18]. Thus, there is no assurance for adequate coverage by the random detectors. This problem prompted the present research. We aim to provide suitable and appropriate solutions to combat this issue with negative selection algorithm. Therefore, the present research focuses on the nature-inspired metaheuristic cuckoo search (CS) algorithm [19,20] for the optimization of the randomly generated detector set of NSA. CS is integrated with the NSA, and makes use of Lévy flight to be able to search effectively and thus increase the NSA’s overall performance. The V-Detectors variation is used in this research.
The organization of this article is as follows. Section 2 reviews related improvements on the negative selection algorithm. Detailed in Section 3 is the proposed cuckoo search algorithm as utilized in the optimization of the negative selection algorithm. Experiments are presented in Section 4. A conclusion and directions for future work are provided in Section 5.
Various distinctive improvements have been proposed to optimize the random detectors of the negative selection algorithm. Completely different solutions for the generation of more robust detectors have also been explored. The fruit fly optimization (FFO) and k-means clustering were used as a replacement for the random detectors of NSA in email spam detection. The k-means helps to cluster the self-set that serves as the initial population of FFO [21], with the FFO as a mechanism for restructuring random detectors. A penalty factor (PF) improved the NSA, resulting in the algorithm termed NSAPF [22]. The dangerous malware signatures that would have been discarded through matching with self are otherwise penalized and kept in a library. NSAPF demonstrates its ability to detect malware with low false positives. PSO-DENSA and MPSO-DENSA were also developed [23]. They are enhancements of the distribution estimation-based negative selection algorithm (DENSA), which is dependent on the Gaussian mixture model (GMM) in actualizing flexible and efficient boundaries for self-samples, thereby aiding in the distribution of detectors in non-self space. Experiments confirm that PSO-DENSA and MPSO-DENSA have good potency for detection. In predicting crude oil price, the fuzzy rough set triggering feature selection was combined with NSA [24]. Moreover, to detect email spam, the random detectors of the NSA were replaced with a PSO detector generation procedure [25]. This lead to improved accuracy when a local outlier factor (LOF) was used as a fitness function.
Relying on the NSA, an efficient proactive artificial immune system for anomaly detection and prevention (EPAADPS) was proposed [26]. To generate efficient detectors, a self-tuning of detectors and detector power of the NSA was implemented. The EPAADPS performed better than the NSA in experiments. The subspace density technique was used to improve NSA in generating optimal detectors [27], and a dual NSA algorithm was proposed to produce potent and mature detectors for network anomaly detection [28]. The theory of Delaunay triangulation integrated with the negative selection algorithm (described as ASTC-RNSA) was proposed in Ref. [29]. This algorithm relies on computational geometry in partitioning self-space, and is superior to V-Detectors and RNSA. An improved NSA was proposed also for diagnosing faults in wind turbine gearboxes [30]. Finally, by adopting antigen density clustering, a large reduction in the randomness of NSA detectors was achieved [31], along with better performance compared to other algorithms.
The detector generation scheme of the real-valued negative selection algorithm with variable-sized detectors (V-Detectors) will play a crucial role in obtaining adequate performance stability and efficiency. The production of detectors is by random acquisition; however, covering non-self space effectively is not guaranteed. The cuckoo search (CS) algorithm is introduced to improve the quality of the V-Detectors’ detectors, which are referred to as CS-V-Detectors. The mutation, crossover, and selection operators enable the CS to attain global convergence and optimality. By undergoing these processes, the best candidate detectors are produced, and ultimately enhance the traditional random generation of detectors. A fitness function is needed to acquire potent detectors. This function is dependent on the Euclidean distance between two overlapping detectors. The implementation of the proposed algorithm is detailed next.
3.1 Detector Generation through Cuckoo Search Algorithm
The cuckoo search (CS) algorithm is a population-based stochastic global search algorithm. The main steps of detector generation with CS are enumerated below and summarized in Algorithm 1.
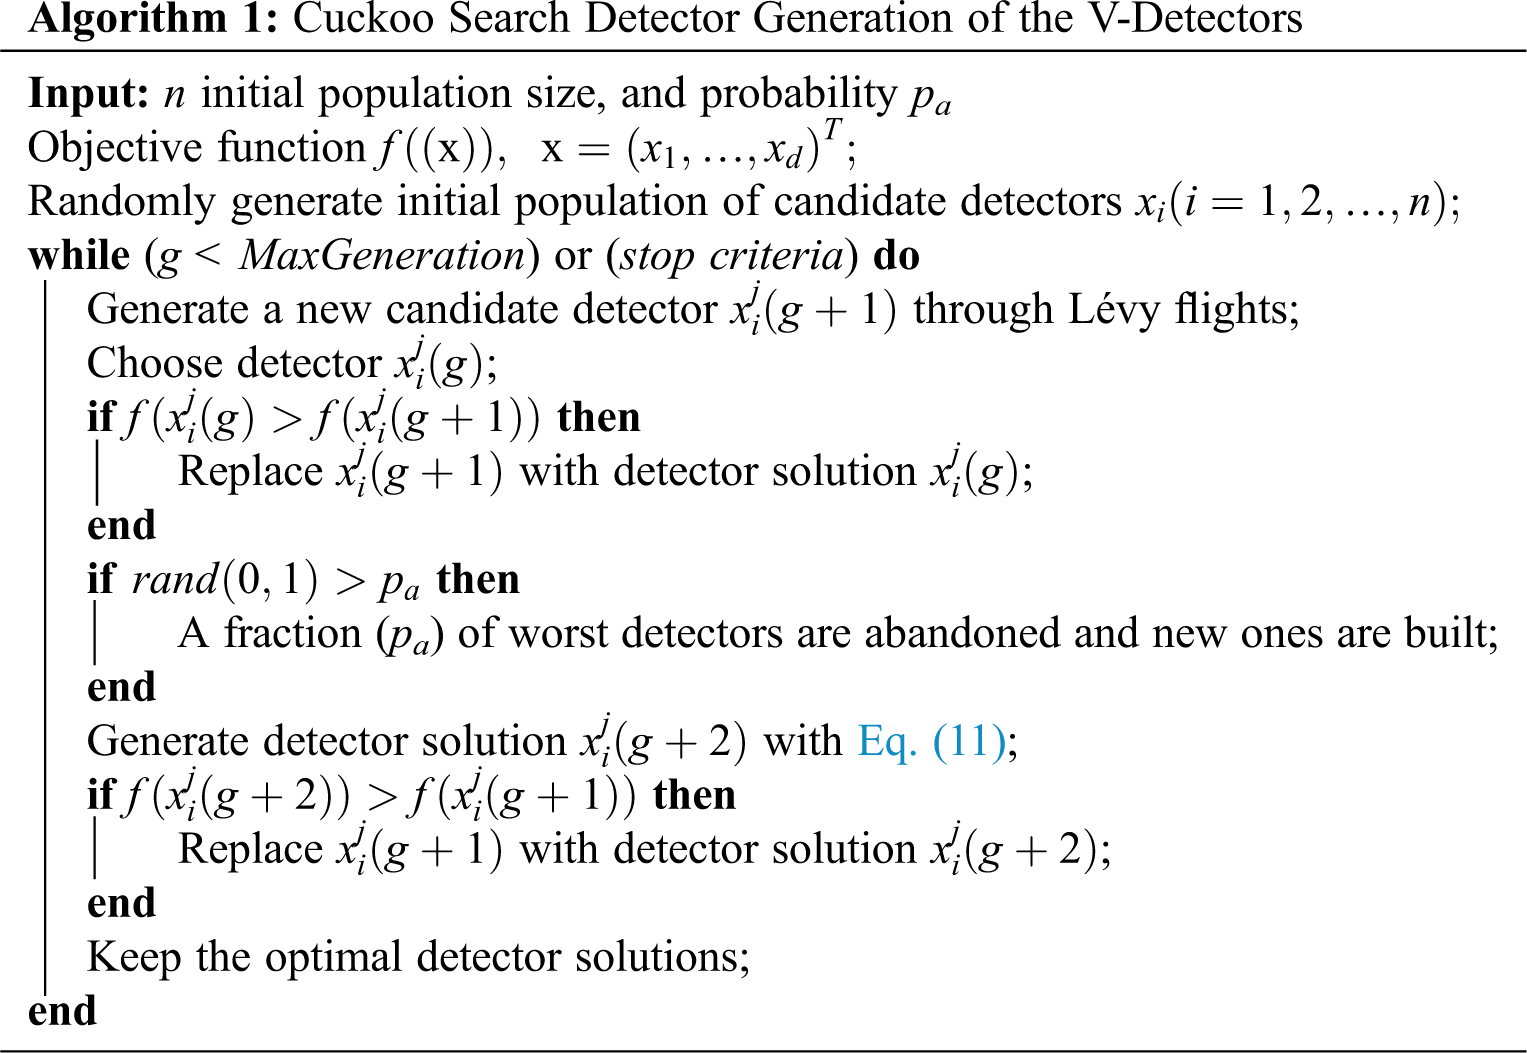
The generation of detectors with CS begins by initiating a random population of detectors with the use of a lower bound and upper bound based on the designed variables. The random detectors are uniformly distributed. A candidate ith detector of jth attribute is produced in Eq. (1),
where
Upon population initialization and identifying the best candidate detector
where an α greater than 0 is the measurement size of step linked to the scales of problems of interests, g is the number of the current generation (only one generation is used here), and
The steps develop into a formative process of random walk, with a power-law step length distribution. Mantegna’s algorithm [32] is used to calculate the step length s, and produces a uniform Lévy well-balanced distribution (Eq. (4)),
where u and v exist within a naturally occurring distribution of the zero mean
where
Here,
where
where randn(D) is a random vector of the dimension of detector
The crossover operator acts on the detector solution obtained from Eq. (10). It involves a probability pa that is compared to a uniform random number rand obeying a uniform distribution of [0,1]. Let us say that the final detector solution in Eq. (10) is stored as
where
These processes for CS are repeated for the detector solutions. Each detector is then matched to the self-samples using the matching rule of Euclidean distance. The training (self) dataset samples is represented in Eq. (13).
The self-sample Xi is normalized in the n-dimensional space as follows:
We have a generated detector
The value of distance
The detector is checked to ascertain whether it can be detected by previously stored detectors using the Euclidean distance. If the minimum distance between the detector and previously stored detector is less than the radius of the previous detector, the detector is eliminated. Otherwise, it is stored for the detection stage. This continues until the required number of detectors covering the non-self space is reached. These detectors then effectively monitor the system’s status during the detection stage.
For the detector stage, the test sample dataset is matched with detectors from the generation stage. Euclidean distance is applied for the matching process. There is a match if the minimum distance between the test sample and detectors is less than the detector’s radius, and thus the sample is labeled as non-self. If the distance is greater than the detector’s radius, the sample is classified as self, which dictates no match.
3.2 Computation of the Fitness Function
The goal of the detectors of the V-Detectors is to thoroughly comb the non-self space; however, the detectors overlap. This overlaps hinders the detectors’ coverage and ultimately has a negative effect on the performance of the V-Detectors algorithm. To tackle the overlapping of detectors, a fitness function is introduced and implemented. The fitness function is a minimization problem. The minimum distance between two detectors d1 and d2 that are overlapping with each other is calculated with Euclidean distance in Eq. (17). This distance calculation causes the overlapped detectors to move away from each other, thereby enlarging the coverage area of each detector.
In more explicit terms, we are given two detectors
4 Experimental Results and Analysis
The driving force behind this study is to discover the detection potency of the proposed CS-V-Detectors algorithm. The UCI repository [34] serves as a benchmark database for retrieval of datasets. The datasets are Fisher’s IRIS, Breast Cancer Wisconsin (Original), and BUPA Liver Disorders datasets. The characteristic of Fisher’s IRIS attributes (including a class attribute), and the number of instances are 5 and 50, respectively. The Fisher’s IRIS dataset is free of any missing values. The distributions of the Breast Cancer Wisconsin (Original) dataset are attributes of 10 (with class) with 699 instances. Missing values exist. A total of 683 instances were extracted from the Breast Cancer Wisconsin (Original) dataset when missing values were omitted. BUPA Liver Disorders consists of 7 variables and 345 instances. All experiments for the proposed CS-V-Detectors and V-Detectors are conducted with MATrix LABoratory (MATLAB). The support vector machine (SVM), artificial neural network (ANN), Naïve Bayes, k-nearest neighbor (k-NN), fuzzy k-nearest neighbor (FuzzyNN), and random forest algorithms are used for comparison by using a powerful data-mining tool called WEKA. In all experiments for CS-V-Detectors and V-Detectors, the training data are prepared, with the experiments executed 10 times, allowing for documentation of the average. The datasets are normalized with the min-max normalization process in the range of [0,1]. Parameters values for CS are as follows: population size n = 1000, and probability pa = 0.25 (the set value for pa is considered the best for any optimization problem) [19,35]. For V-Detectors, the parameters are as follows: self-radius rs = 0.05, estimated coverage c0 = 99.98%, and maximum number of detectors Tmax = 1000 [4,36].
Evaluation criteria for CS-V-Detectors are standard measures. These measures are the detection rate and false alarm rate. The equations for these metrics are:
Simulations are performed on 3.40 GHz CPU Intel Pentium® Core i7 Processor configured using 4 GB RAM.
The results on Fisher’s IRIS dataset are contained in Tab. 1. The detection rate for V-Detectors was 92.16%, and when it was optimized with cuckoo search (CS), an increase of 5.84% was observed (i.e., the detection rate for CS-V-Detectors was 98%).
Table 1: Comparative test results for fisher’s IRIS dataset
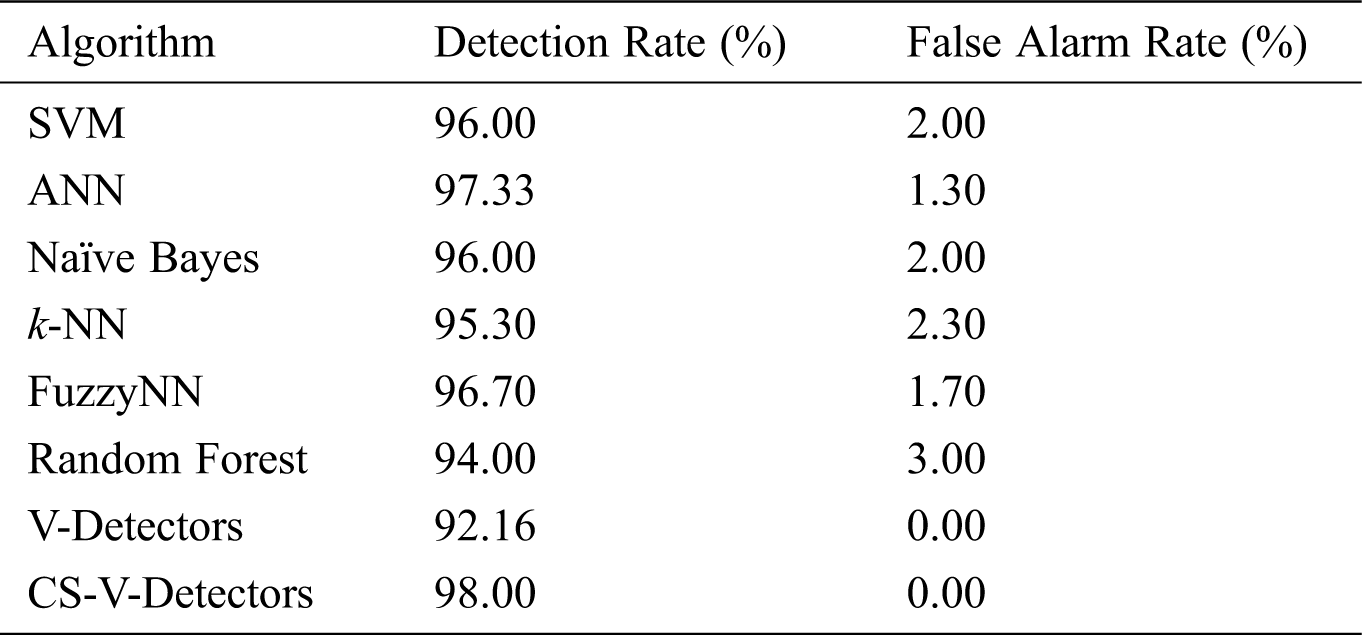
The ANN came close to CS-V-Detectors, with a detection rate of 97.33%. FuzzyNN was next, with 96.70%, followed by the SVM and Naïve Bayes (both with a 96% detection rate). The k-NN only had a detection rate of 95.30%, and random forest had a rate of 94%. Thus, CS-V-Detectors performed better than other methods on Fisher’s IRIS dataset. In regard to false alarm rates, k-NN had the highest (3%), while CS-V-Detectors and V-Detectors both had 0% rates.
It can be seen from Tab. 2 that all the algorithms performed well on the Breast Cancer Wisconsin dataset. However, CS-V-Detectors surpassed all of the other algorithms, with a 99.29% detection rate (compared to V-Detectors’ 96.85%). k-NN, ANN, and random forest had detection rates of 95.10%, 95.30% and 95.70%, respectively. Meanwhile, FuzzyNN, Naïve Bayes, and SVM had detection rates of 96.40%, 96%, and 97%, respectively. k-NN and ANN had the highest false alarm rates: 6.30% and 5.40%, respectively. In contrast, CS-V-Detectors and V-Detectors had false alarm rates of 0%.
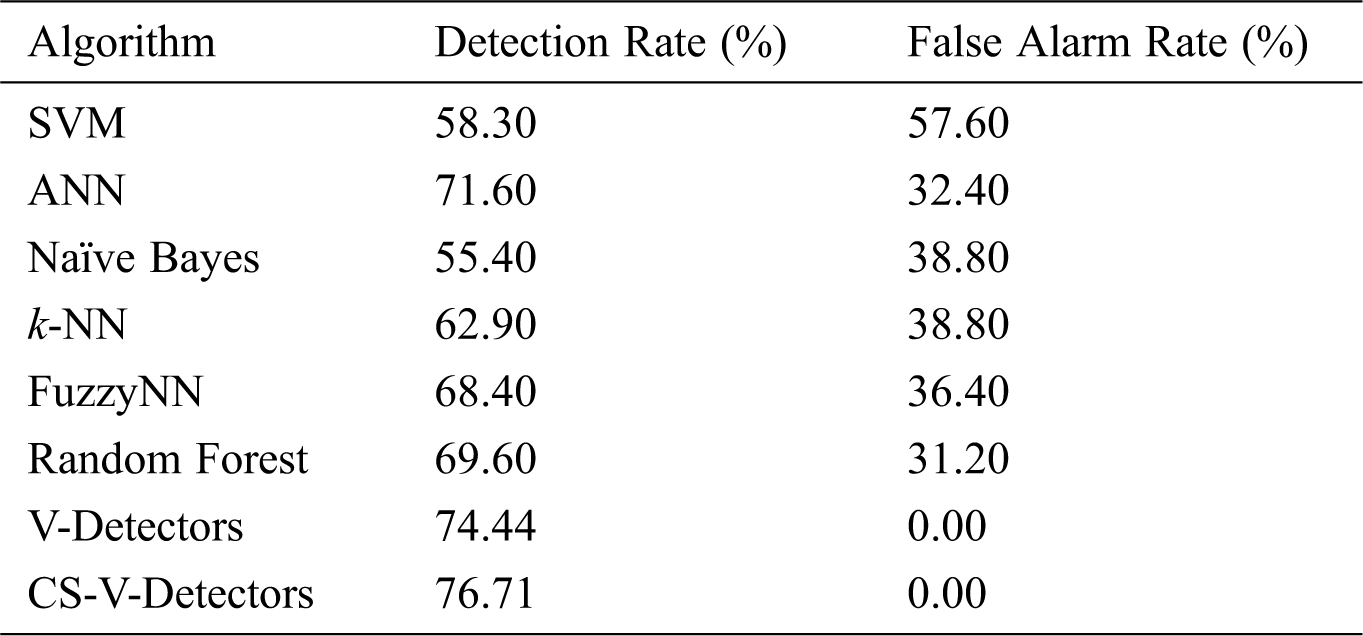
As shown in Tab. 3, the results on the BUPA Liver Disorders dataset reveal that detection performances ranged from 58% to 77% across all the algorithms. CS-V-Detectors had the best performance (a 76.71% detection rate); this can be compared to V-Detectors’ detection rate of 74.44%.
Table 2: Comparative test results for breast cancer dataset
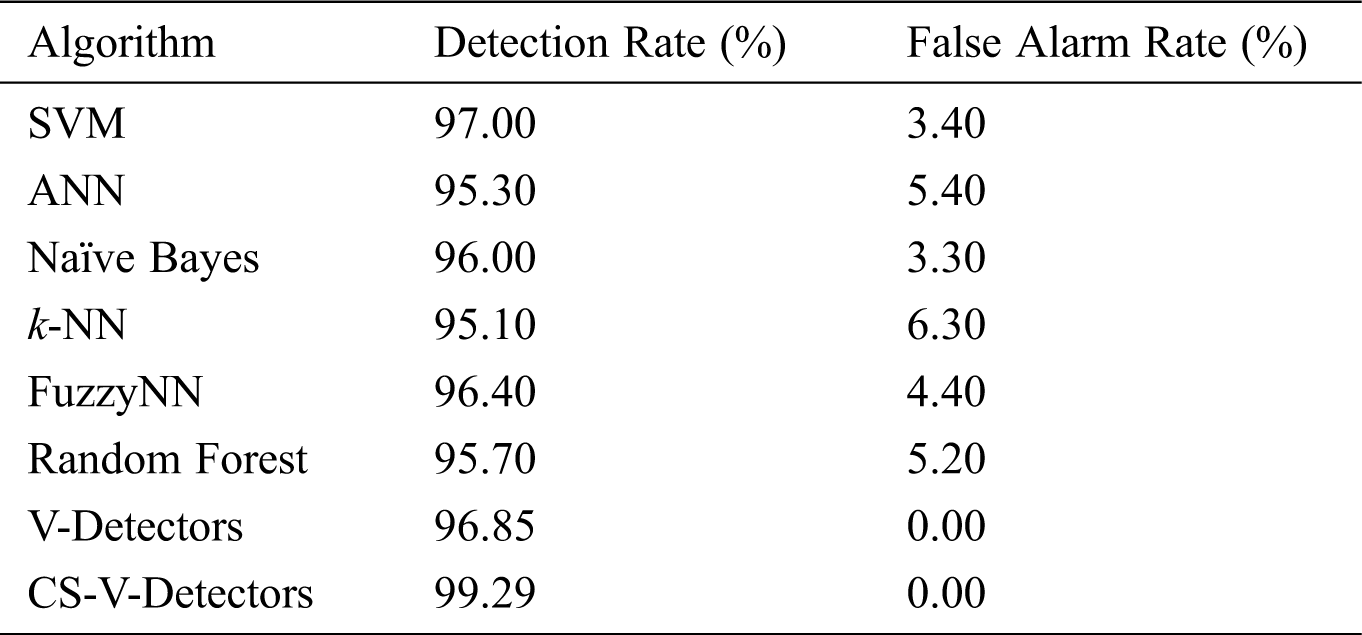
Table 3: Comparative test results for liver disorders dataset
4.3 Receiver Operating Characteristics
The receiver operating characteristic (ROC) curves corresponding to the experiments on Fisher’s IRIS and Breast Cancer datasets are presented in Figs. 1 and 2, respectively. In Fig. 1, CS-V-Detectors is clearly better than the other algorithms. It is closely followed by ANN, then FuzzyNN, SVM, and Naïve Bayes; random forest performs the worst. These results are analogous to those in Tab. 1. Shifting focus to the ROC curves for experiments on the Breast Cancer dataset plotted in Fig. 2, we observe that CS-V-Detectors again outperformed all the other algorithms. V-Detectors performed second best, while k-NN performed worst. These results also well match those in Tab. 2. The graph connoting ROC curves for experiments on the Liver Disorders dataset is drawn in Fig. 3. The performances of the algorithms are not as high as on other datasets. However, once again, CS-V-Detectors surpassed the other algorithms in terms of performance. It was closely followed by V-Detectors, and SVM performed worst.
Algorithm performance can also be compared by looking at the area under the ROC curve (AUC). The AUC is generated through the reduction of ROC into a single scalar, with values ranging from 0 to 1. Algorithms that have an area less than 0.5 are considered unrealistic; the best algorithms have AUC values near 1. The AUC for the algorithms are listed in Tab. 4. In ascending order for the Fisher’s IRIS dataset, random forest had the lowest AUC value (0.9550), while CS-V-Detectors had the highest AUC (0.9900). On the Breast Cancer dataset, CS-V-Detectors again had the highest AUC (0.9965). The lowest AUC was generated by k-NN (0.9440). A similar trend is seen on the Liver Disorders dataset, with CS-V-Detectors obtaining the highest AUC (0.8836). Thus, it is affirmed that the proposed CS-V-Detectors is at the apex concerning AUC.

Figure 1: ROC curves for fisher’s IRIS dataset

Figure 2: ROC curves for breast cancer dataset

Figure 3: ROC curves for liver disorders dataset
Table 4: AUC for fisher’s IRIS, breast cancer, and liver disorders datasets

4.4 Comparison of CS-V-Detectors with Other NSA Models
This section compares CS-V-Detectors with variants of NSA models that have already been proposed. The focus is directed at performance on Fisher’s IRIS and Breast Cancer datasets. The various NSA algorithms considered for Fisher’s IRIS are artificial bee colony-NSA (ABC-NSA) [37], interface detector (I-detector) [38], boundary-fixed NSA (FB-NSA) [39], fine boundary-fixed NSA (FFB-NSA) [39], and specialized detectors-NSA [40]. It can be seen from Tab. 5 and Fig. 4, that the proposed CS-V-Detectors performs better than all other algorithms except for I-detector. CS-V-Detectors has a detection rate of 98% while I-detector has a detection rate of 99%. Moreover, there is an 8% gap in detection rates of CS-V-Detectors and the specialized detectors-NSA.
Table 5: Detection results of CS-V-Detectors among other models for fisher’s IRIS

For the Breast Cancer dataset, the algorithms for comparison are antigen density clustering-NSA (ADC-NSA) [31], ASSC-NSA [31], dual NSA (DNSA) [28], hierarchical clustering of self-set-RNSA (HC-RNSA) [41], pattern recognition receptor theory–dual NSA (PRR-2NSA) [42], and antigen space density-RNSA (ASD-RNSA) [43]. The results in Tab. 6 reveals a tight contest in performance. ADC-NSA has a 99.41% detection rate, CS-V-Detectors has a 99.29% detection rate, and DNSA has the lowest detection rate (92.39%). These results are also presented in Fig. 5.
Table 6: Detection results of CS-V-Detectors among other models for breast cancer

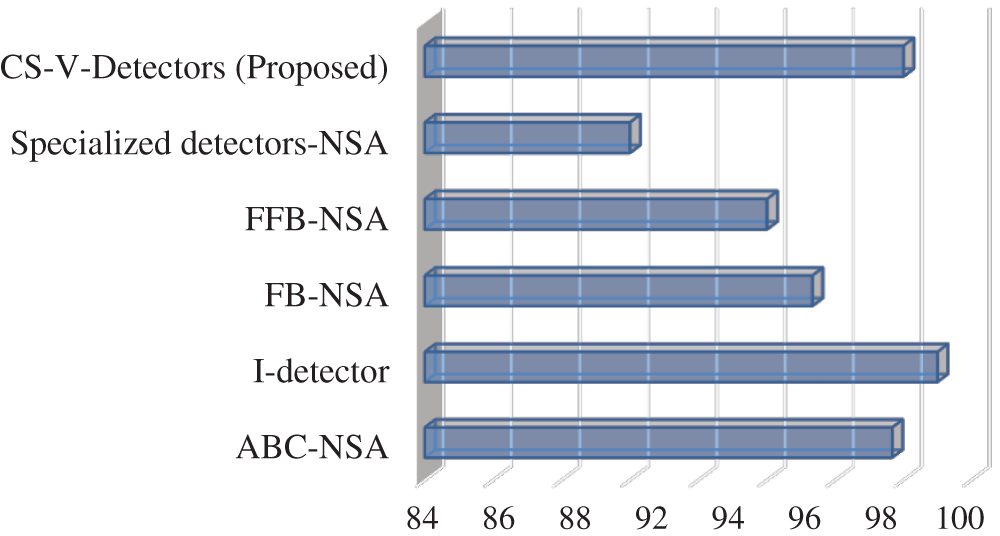
Figure 4: Detection rate for fisher’s IRIS
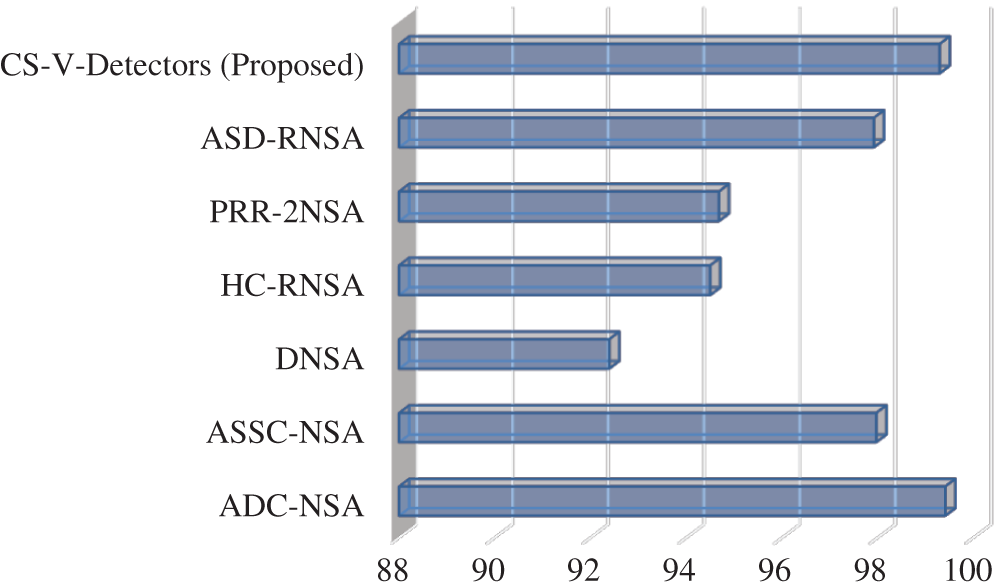
Figure 5: Detection rate for breast cancer
This research introduced and proposed a detector generation algorithmic scheme based on cuckoo search (CS) for the negative selection algorithm with particular focus on the real-valued negative selection algorithm with variable-sized detectors (V-Detectors). It embodies the properties of Lévy flight in attaining global convergence and optimality, which results in the generation of efficient detectors. The proposed algorithm improved the performance of standard V-Detectors and performs better than other existing algorithms. Hence, it can be concluded that the optimization technique enhances the detection ability and efficiency of the negative selection algorithm. Future work will involve hybridizing cuckoo search with other optimization algorithms for enhanced detection.
Funding Statement: The authors received no specific funding for this study.
Conflicts of Interest: The authors declare that they have no conflicts of interest to report regarding the present study.
1. D. González-Patiño, Y. Villuendas-Rey, A. J. Argüelles-Cruz, O. Camacho-Nieto and C. Yáñez-Márquez, “AISAC: An artificial immune system for associative classification applied to breast cancer detection,” Applied Sciences, vol. 10, no. 2, pp. 515, 2020. [Google Scholar]
2. S. Forrest, A. S. Perelson, L. Allen and R. Cherukuri, “Self-nonself discrimination in a computer,” in Proc. of the Research in Security and Privacy, 1994. Proc., 1994 IEEE Computer Society Sym. on, Oakland, CA, USA, pp. 202–212, 1994. [Google Scholar]
3. F. Gonzalez, D. Dasgupta and R. Kozma, “Combining negative selection and classification techniques for anomaly detection,” Proc. of the Evolutionary Computation, 2002. CEC’02. Proc. of the 2002 Congress on, Honolulu, HI, USA, vol. 1, pp. 705–710, 2002. [Google Scholar]
4. Z. Ji and D. Dasgupta, “Real-valued negative selection algorithm with variable-sized detectors,” in Proc. of the Genetic and Evolutionary Computation--GECCO 2004, Seattle, WA, USA, pp. 287–298, 2004. [Google Scholar]
5. C. A. Laurentys, G. Ronacher, R. M. Palhares and W. M. Caminhas, “Design of an artificial immune system for fault detection: A negative selection approach,” Expert Systems with Applications, vol. 37, no. 7, pp. 5507–5513, 2010. [Google Scholar]
6. J. Zeng, Z. Qin and W. Tang, “Anomaly detection using a novel negative selection algorithm,” Journal of Computational and Theoretical Nanoscience, vol. 10, no. 12, pp. 2831–2835, 2013. [Google Scholar]
7. I. Idris, A. Selamat and S. Omatu, “Hybrid email spam detection model with negative selection algorithm and differential evolution,” Engineering Applications of Artificial Intelligence, vol. 28, no. 5, pp. 97–110, 2014. [Google Scholar]
8. H. Wu and B. Zhao, “Overview of current techniques in remote data auditing,” Applied Mathematics and Nonlinear Sciences, vol. 1, no. 1, pp. 140–153, 2016. [Google Scholar]
9. S. M. Mohi-Aldeen, R. Mohamad and S. Deris, “Automated path testing using the negative selection algorithm,” Int. Journal of Computational Vision and Robotics, vol. 7, no. 1–2, pp. 160–171, 2017. [Google Scholar]
10. A. Lasisi, R. Ghazali and T. Herawan, “Comparative performance analysis of negative selection algorithm with immune and classification algorithms, ” In: T. Herawan, R. Ghazali, M. M. Deris (eds.Recent Advances on Soft Computing and Data Mining, Springer, Switzerland, pp. 441–452, 2014. [Google Scholar]
11. W. Pang and G. M. Coghill, “Qml-ainet: An immune network approach to learning qualitative differential equation models,” Applied Soft Computing, vol. 27, pp. 148–157, 2015. [Google Scholar]
12. A. Lasisi, R. Ghazali, T. Herawan, F. Lasisi and M. M. Deris, “Knowledge extraction of agricultural data using artificial immune system,” in Proc. of the Fuzzy Systems and Knowledge Discovery (FSKD2015 12th Int. Conf. on, Zhangjiajie, China, pp. 1653–1658, 2015. [Google Scholar]
13. A. Lasisi, R. Ghazali, M. M. Deris, T. Herawan and F. Lasisi, “Extracting information in agricultural data using fuzzy-rough sets hybridization and clonal selection theory inspired algorithms,” Int. Journal of Pattern Recognition and Artificial Intelligence, vol. 30, no. 09, pp. 1660008, 2016. [Google Scholar]
14. K. Zainal and M. Z. Jali, “A perception model of spam risk assessment inspired by danger theory of artificial immune systems,” Procedia Computer Science, vol. 59, pp. 152–161, 2015. [Google Scholar]
15. Z. Chelly and Z. Elouedi, “A survey of the dendritic cell algorithm,” Knowledge and Information Systems, vol. 48, no. 3, pp. 505–535, 2016. [Google Scholar]
16. D. Li, S. Liu and H. Zhang, “A boundary-fixed negative selection algorithm with online adaptive learning under small samples for anomaly detection,” Engineering Applications of Artificial Intelligence, vol. 50, no. Part B, pp. 93–105, 2016. [Google Scholar]
17. D. Wang, F. Zhang and L. Xi, “Evolving boundary detector for anomaly detection,” Expert Systems with Applications, vol. 38, no. 3, pp. 2412–2420, 2011. [Google Scholar]
18. I. Aydin, M. Karakose and E. Akin, “Chaotic-based hybrid negative selection algorithm and its applications in fault and anomaly detection,” Expert Systems with Applications, vol. 37, no. 7, pp. 5285–5294, 2010. [Google Scholar]
19. X. S. Yang and S. Deb, “Cuckoo search via lévy flights,” in Proc. of the Nature & Biologically Inspired Computing, 2009. NaBIC 2009. World Congress on, Coimbatore, India, pp. 210–214, 2009. [Google Scholar]
20. N. El Gmili, M. Mjahed, A. El Kari and H. Ayad, “Particle swarm optimization and cuckoo search-based approaches for quadrotor control and trajectory tracking,” Applied Sciences, vol. 9, no. 8, pp. p.–1719, 2019. [Google Scholar]
21. R. Chikh and S. Chikhi, “Clustered negative selection algorithm and fruit fly optimization for email spam detection,” Journal of Ambient Intelligence and Humanized Computing, vol. 10, no. 1, pp. 143–152, 2019. [Google Scholar]
22. Y. Tan, “Negative selection algorithm with penalty factor,” In: Y. Tan (ed.Artificial Immune System: Applications in Computer Security, New Jersey: John Wiley & Sons, Inc., pp. 86–100, 2016. [Google Scholar]
23. L. Nemati and M. Shakeri, “Negative selection based data classification with flexible boundaries,” Journal of Computer & Robotics, vol. 11, no. 2, pp. 67–83, 2018. [Google Scholar]
24. A. Lasisi, N. Tairan, R. Ghazali, W. K. Mashwani, S. N. Qasem et al., “Predicting crude oil price using fuzzy rough set and bio-inspired negative selection algorithm,” Int. Journal of Swarm Intelligence Research, vol. 10, no. 4, pp. 25–37, 2019. [Google Scholar]
25. I. Idris, A. Selamat, N. T. Nguyen, S. Omatu, O. Krejcar et al., “A combined negative selection algorithm–particle swarm optimization for an email spam detection system,” Engineering Applications of Artificial Intelligence, vol. 39, no. 7, pp. 33–44, 2015. [Google Scholar]
26. P. Saurabh and B. Verma, “An efficient proactive artificial immune system based anomaly detection and prevention system,” Expert Systems with Applications, vol. 60, no. 1, pp. 311–320, 2016. [Google Scholar]
27. Z. Liu, T. Li, J. Yang and T. Yang, “An improved negative selection algorithm based on subspace density seeking,” IEEE Access, vol. 5, pp. 12189–12198, 2017. [Google Scholar]
28. X. Zheng, Y. Zhou and Y. Fang, “The dual negative selection algorithm and its application for network anomaly detection,” Int. Journal of Information and Communication Technology, vol. 11, no. 1, pp. 94–118, 2017. [Google Scholar]
29. F. Zang, W. Chen, T. Li, X. C. Ciao and H. P. Peng, “An antigen space triangulation coverage based real-value negative selection algorithm,” IEEE Access, vol. 7, pp. 51886–51898, 2019. [Google Scholar]
30. X. L. Xu and X. L. Liu, “Fault diagnosis method for wind turbine gearbox based on image characteristics extraction and actual value negative selection algorithm,” Int. Journal of Pattern Recognition and Artificial Intelligence, vol. 34, 2054034, 2020. [Google Scholar]
31. C. Yang, L. Jia, B. Chen and H. Wen, “Negative selection algorithm based on antigen density clustering,” IEEE Access, vol. 8, pp. 44967–44975, 2020. [Google Scholar]
32. R. N. Mantegna, “Fast, accurate algorithm for numerical simulation of levy stable stochastic processes,” Physical Review E, vol. 49, no. 5, pp. 4677–4683, 1994. [Google Scholar]
33. X. S. Yang and S. Deb, “Engineering optimisation by cuckoo search,” Int. Journal of Mathematical Modelling and Numerical Optimisation, vol. 1, no. 4, pp. 330–343, 2010. [Google Scholar]
34. K. Bache and M. Lichman, “UCI machine learning repository. vol. 901, 2013. [Online]. Available: https://archive.ics.uci.edu/ml. [Google Scholar]
35. X. S. Yang and S. Deb, “Cuckoo search: Recent advances and applications,” Neural Computing and Applications, vol. 24, no. 1, pp. 169–174, 2014. [Google Scholar]
36. Z. Ji and D. Dasgupta, “V-detector: An efficient negative selection algorithm with “probably adequate” detector coverage,” Information Sciences, vol. 179, no. 10, pp. 1390–1406, 2009. [Google Scholar]
37. P. K. Mishra and M. Bhusry, “Artificial bee colony optimization based negative selection algorithms to classify iris plant dataset,” Int. Journal of Computer Applications, vol. 133, no. 10, pp. 40–43, 2016. [Google Scholar]
38. D. Li, S. Liu and H. Zhang, “A negative selection algorithm with online adaptive learning under small samples for anomaly detection,” Neurocomputing, vol. 149, no. 2, pp. 515–525, 2015. [Google Scholar]
39. D. Li, S. Liu and H. Zhang, “Negative selection algorithm with constant detectors for anomaly detection,” Applied Soft Computing, vol. 36, pp. 618–632, 2015. [Google Scholar]
40. A. Abid, M. T. Khan, I. U. Haq, S. Anwar and J. Iqbal, “An improved negative selection algorithm-based fault detection method,” IETE Journal of Research, pp. 1–12, 2020. [Google Scholar]
41. W. Chen, X. J. Liu, T. Li, Y. Q. Shi, X. F. Zheng et al., “A negative selection algorithm based on hierarchical clustering of self set and its application in anomaly detection,” Int. Journal of Computational Intelligence Systems, vol. 4, no. 4, pp. 410–419, 2011. [Google Scholar]
42. X. Zheng, Y. Zhou and Y. Fang, “The dual negative selection algorithm based on pattern recognition receptor theory and its application in two-class data classification,” Journal of Computers, vol. 8, no. 8, pp. 1951–1959, 2013. [Google Scholar]
43. T. Yang, W. Chen and T. Li, “An antigen space density based real-value negative selection algorithm,” Applied Soft Computing, vol. 61, no. 4, pp. 860–874, 2017. [Google Scholar]
 | This work is licensed under a Creative Commons Attribution 4.0 International License, which permits unrestricted use, distribution, and reproduction in any medium, provided the original work is properly cited. |