DOI:10.32604/csse.2021.015624
| Computer Systems Science & Engineering DOI:10.32604/csse.2021.015624 | |
| Article |
Improved Attribute Chain Sampling Plan for Darna Distribution
1Department of Statistics, Central University of Rajasthan, Rajasthan, India
2Department of Mathematics, Faculty of Science, Al al-Bayt University, Mafraq, Jordan
3Department of Mathematics, College of Science and Human Studies at HotatSudair, Majmaah University, Majmaah 11952, Saudi Arabia
*Corresponding Author: Ayed R. A. Alanzi. Email: a.alanzi@mu.edu.sa
Received: 30 October 2020; Accepted: 09 February 2021
Abstract: Recently, the Darna distribution has been introduced as a new lifetime distribution. The two-parameter Darna distribution represents is a mixture of two well-known gamma and exponential distributions. A manufacturer or an engineer of products conducts life testing to examine whether the quality level of products meets the customer’s requirements, such as reliability or the minimum lifetime. In this article, an attribute modified chain sampling inspection plan based on the time truncated life test is proposed for items whose lifetime follows the Darna distribution. The plan parameters, including the sample size, the acceptance number, and the past lot result of the proposed sampling plan, are determined with the help of the two-point approach considering the acceptable quality level (AQL) and the limiting quality level (LQL). The plan parameters and the corresponding operating characteristic functions of a new plan are provided in tabular form for various Darna distribution parameters. Also, a few illustrated examples are presented for various distribution parameters. The usefulness of the proposed attribute modified chain sampling plan is investigated using two real failure time datasets. The results indicate that the proposed sampling plan can reduce the sample size when the termination ratio increases for fixed values of the producer’s risk and acceptance number. Hence, the proposed attribute modified chain sampling inspection plan is recommended to practitioners in the field.
Keywords: Attribute chain sampling inspection plan; consumer’s risk; Darna distribution; operating characteristic curve; producer’s risk; truncated life test
All manufacturing industries in this competitive world solely rely on the quality of products manufactured by the company. The quality of products is the main metric that matters the same for both consumers and producers. The greatest challenge for the manufacturing industry is to stay in the competitive market with high revenue and market value of the products. High market value and revenue can be achieved only by producing good-quality products. Therefore, quality control is an indispensable part of the ongoing manufacturing process or full finished product. Hence, there is nothing more important than product quality in the manufacturing industry. Therefore, several tools and techniques have been proposed for statistical quality control (SQC) to handle the product quality at various levels of production. Two major types of SQC techniques are statistical process control and statistical product control. The statistical process control is achieved using the techniques of the histogram, Pareto chart, design of experiment, control chart, and process capability indices, while the statistical product control is achieved using the technique of acceptance sampling inspection plan. The hundred percent inspection method of items of a lot is another way to inspect the lot to control the quality of products. However, the hundred percent inspection is not feasible in practice because it has high costs in terms of time, money, and labor. Besides, when the quality of a product is tested by destructive testing (e.g., the life of a candle or testing of electrical fuses), the hundred percent inspection will result in the destruction of products.
The acceptance sampling inspection plan (AcSIP) represents an alternative solution to the hundred percent inspection. The AcSIP can be classified as AcSIP by attributes and AcSIP by variables. The AcSIP development for different probability models has been increasing in recent years. A variety of AcSIPs have been present in the literature of SQC, including the single acceptance sampling inspection plan (SaSIP), double acceptance sampling inspection plan (DaSIP), group acceptance sampling inspection plan (GaSIP), sequential acceptance sampling inspection plan (SeSIP), and multiple acceptance sampling inspection plan (MaSIP). Many studies have been focused on the development of an extension of the existing AcSIPs [1–4]. The time truncation technique is very useful when the nature of products is destructive. The methodology of the time truncated AcSIP is that life test terminates at a predefined time point
In Dodge [23], a special AcSIP known as the chain sampling inspection plan (ChSP) was designed. The usage of the past lot quality information is the crucial part of the ChSP, which reduces the consumer and producer’s risks significantly. In the ChSP, the decision on lot acceptance or rejection is based not only on the quality of the current sample but also on the quality of the past-submitted lots. The ChSP is also known as ChSP-1. An extended version of the ChSP denoted as MChSP-1 was proposed in Govindaraju and Balamurali [24]. In 2018, Luca developed a re-extended version of the MChSP-1 that is referred to as the modified chain sampling plan (MChSP). The MChSP is suitable for both to attribute and variable inspection plans. In addition, Luca showed that the MChSP could be preferable over the other existing plans; more details about the MChSP can be found in Luca [25]. The modified group chain sampling plans for lifetimes following the Rayleigh distribution were presented in Jamaludin et al. [26]. The chain sampling plan for variables inspection was studied in [27,28].
To the best of the authors’ knowledge, in the SQC-related literature, there has been no study on the development of MChSP time truncated life test for the Darna probability distribution in the case of attribute quality characteristic. In order to address this shortcoming, this paper presents an attribute MChSP for the time truncated life test under the assumption of the Darna distribution (DD). Also, using the attribute MChSP of the DD, estimation of the suggested parameters plan is studied with the help of the two-point approaches, the acceptable quality level (AQL) and the limiting quality level (LQL).
The rest of the paper is organized as follows. In Section 2, the design of the proposed attribute sampling plan is presented. A brief description of the DD and the proposed plan are described in detail in Section 3. In Section 4, a study of the tables and hypothetical examples are provided to understand the methodology of the proposed plan. In Section 5, the proposed plan is verified using two real datasets. Finally, concluding remarks and future scope of the proposed ChSP are given in Section 6.
The DD that was proposed in Shraa and Al-Omari [29] is explained in the following. The DD represents a special mixture of the exponential and gamma distributions (i.e.,
where
The reliability and hazard functions of the DD distribution are respectively given by:
It has been observed that the DD possesses different characteristics, for instance, the increasing and decreasing hazard rate functions depend on the distribution parameters. The behavior of the hazard rate function of the DD is quite similar to some real-life situations. Hence, it is better to use the DD for the truncated life test of the MChSP.
This section discusses the proposed plan when the time of the items follows the DD. The main part of designing the proposed plan is to estimate the plan parameters. The plan parameters characterize the AcSIP, and they include the sample size
1. Select a sample of size
2. Observe the number of defective units
3. If
The acceptance probability in the proposed AcSIP is based on the plan parameters, i.e., the operating characteristic (OC) function of the MChSP ([21]), which is given by:
where
The probability of item failure before the predefined termination time
A main part of the MChSP is to determine the sampling plan parameters. The problem of determining the plan parameters
Two risks are associated with the AcSIP, the producer’s risk that is denoted as
Hence, the suggested plan parameters can be determined with the help of the two-point approach for various values of AQL, LQL,
4 Proposed Plan Tables and Hypothetical Example
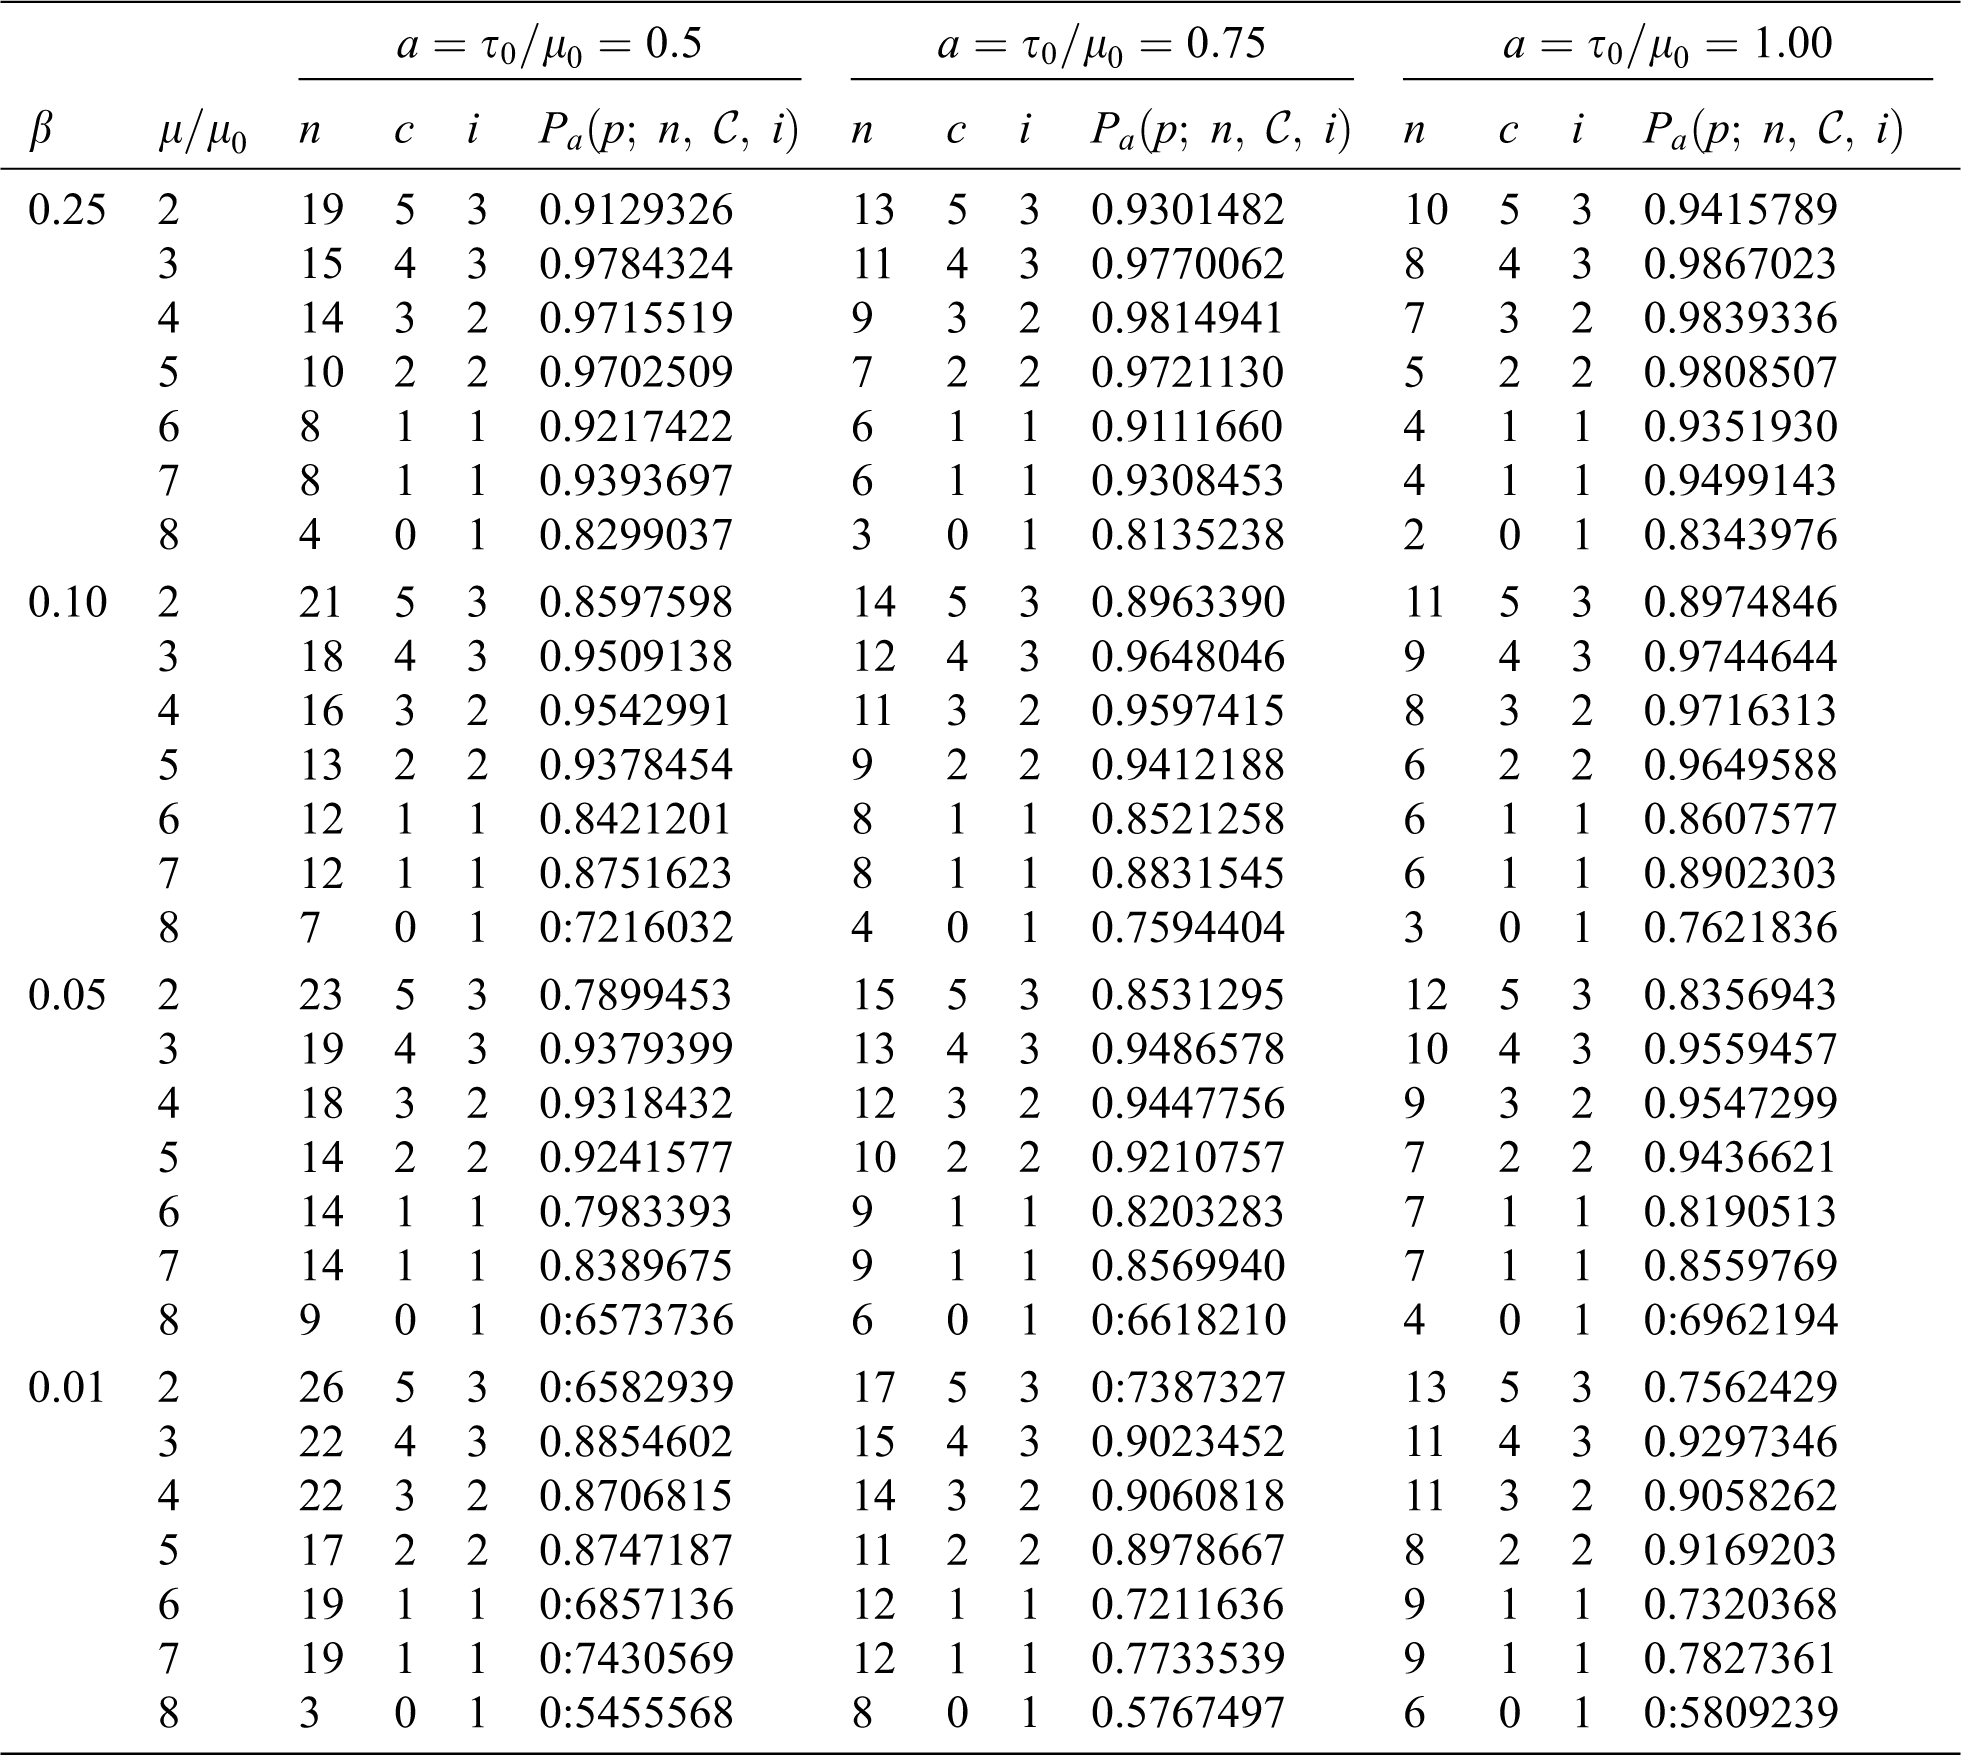
This section describes the proposed plan tables for various combinations of distribution parameters
Table 1: Plan parameters of the MChSP for the DD when
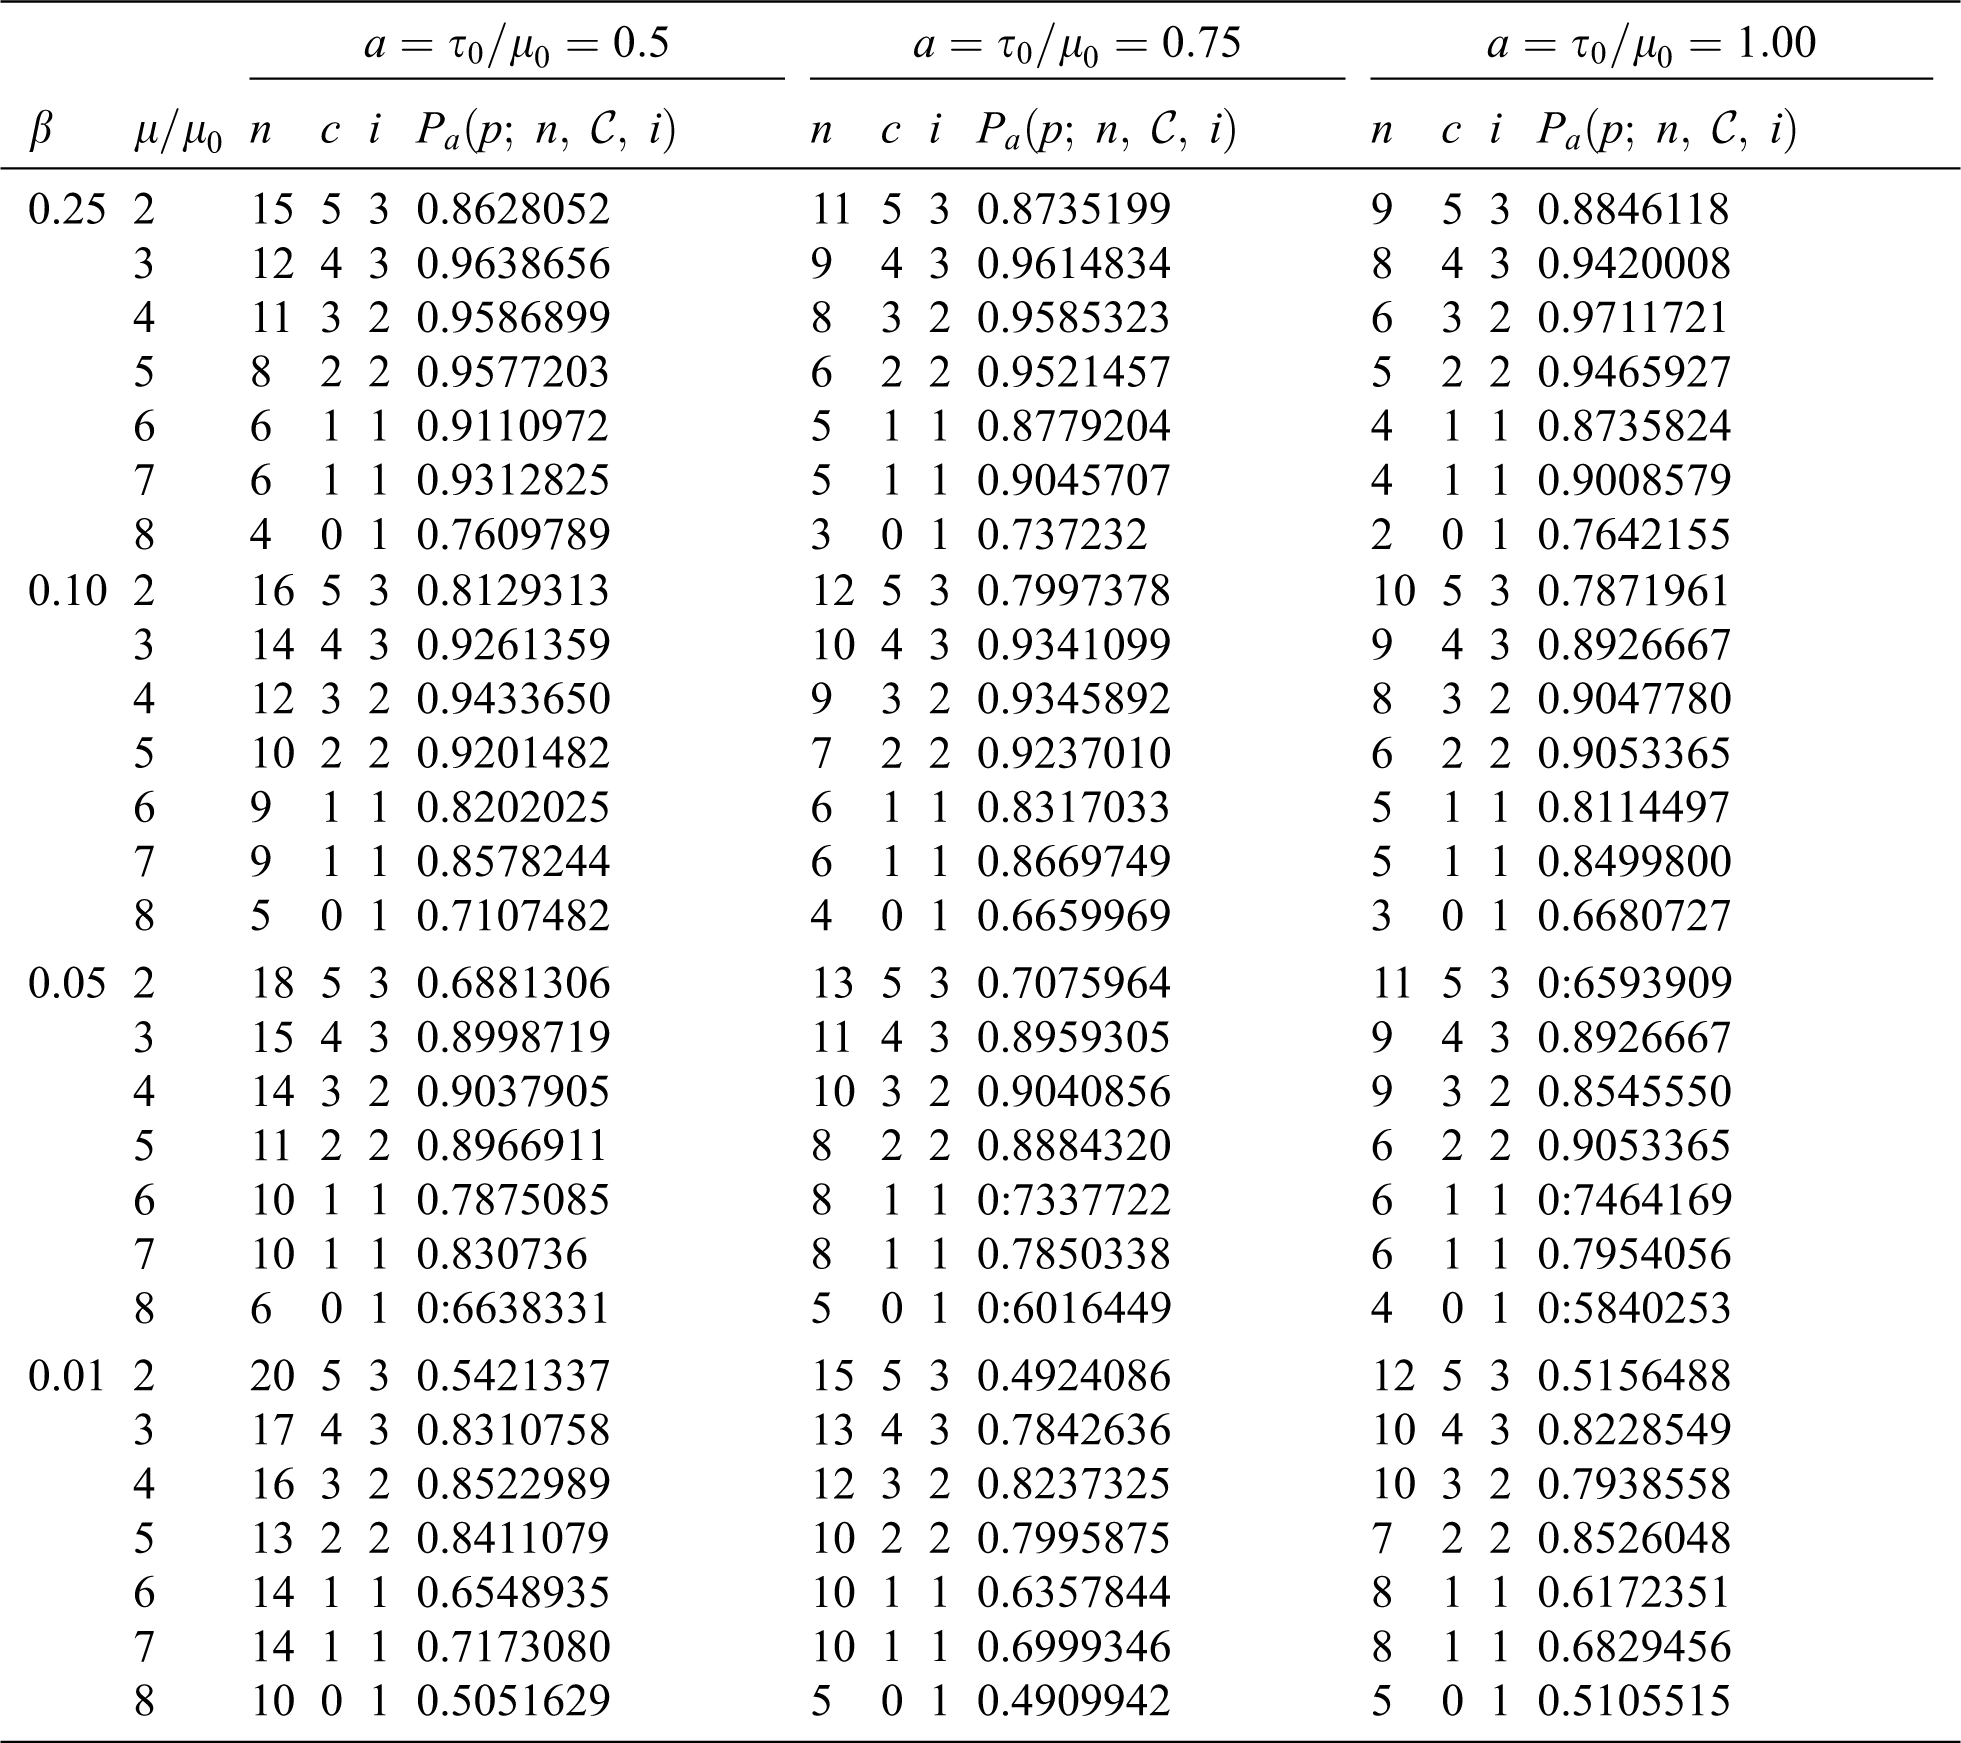
Similarly, as shown in Tab. 2 the required sample size
Table 2: Plan parameters of the MChSP for the DD at
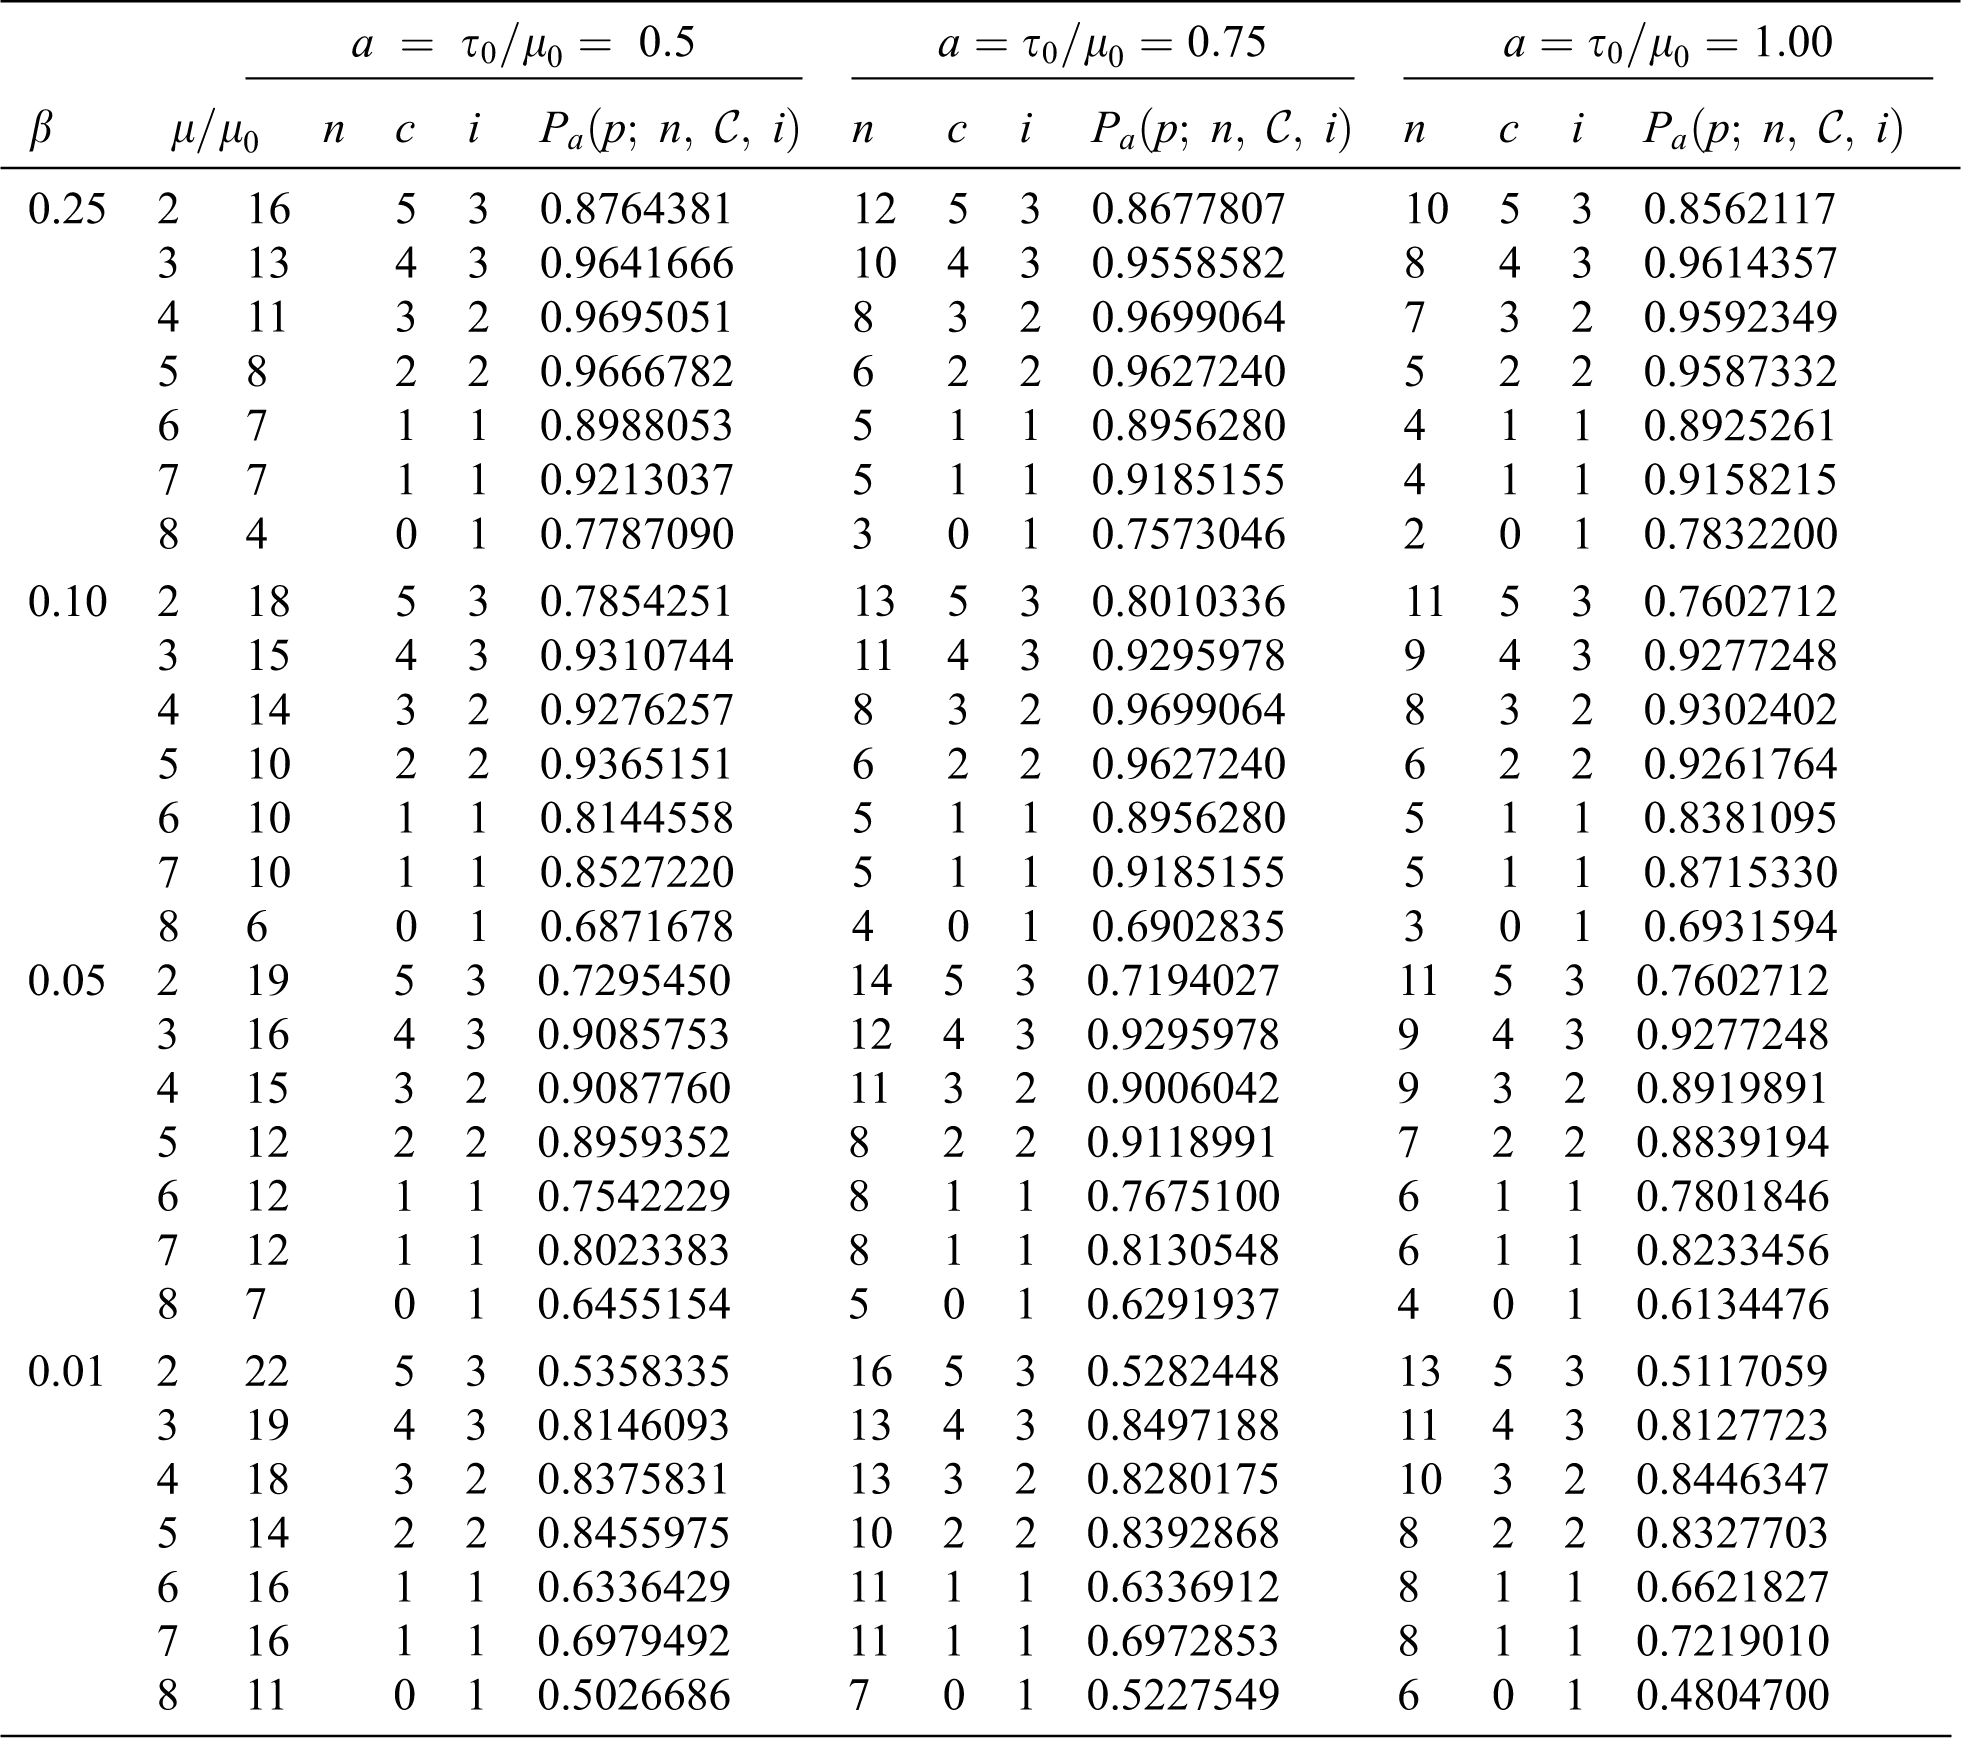
For
Table 3: Plan parameters of the MChSP for the DD at
Hypothetical example: Suppose that the lifetime of an item follows the DD with parameters
5 Proposed Plan Evaluation using Real Data
In this section, two real-life situations are discussed and the descriptions of these examples are presented. The descriptive statistics of the data includes the minimum, first quartile
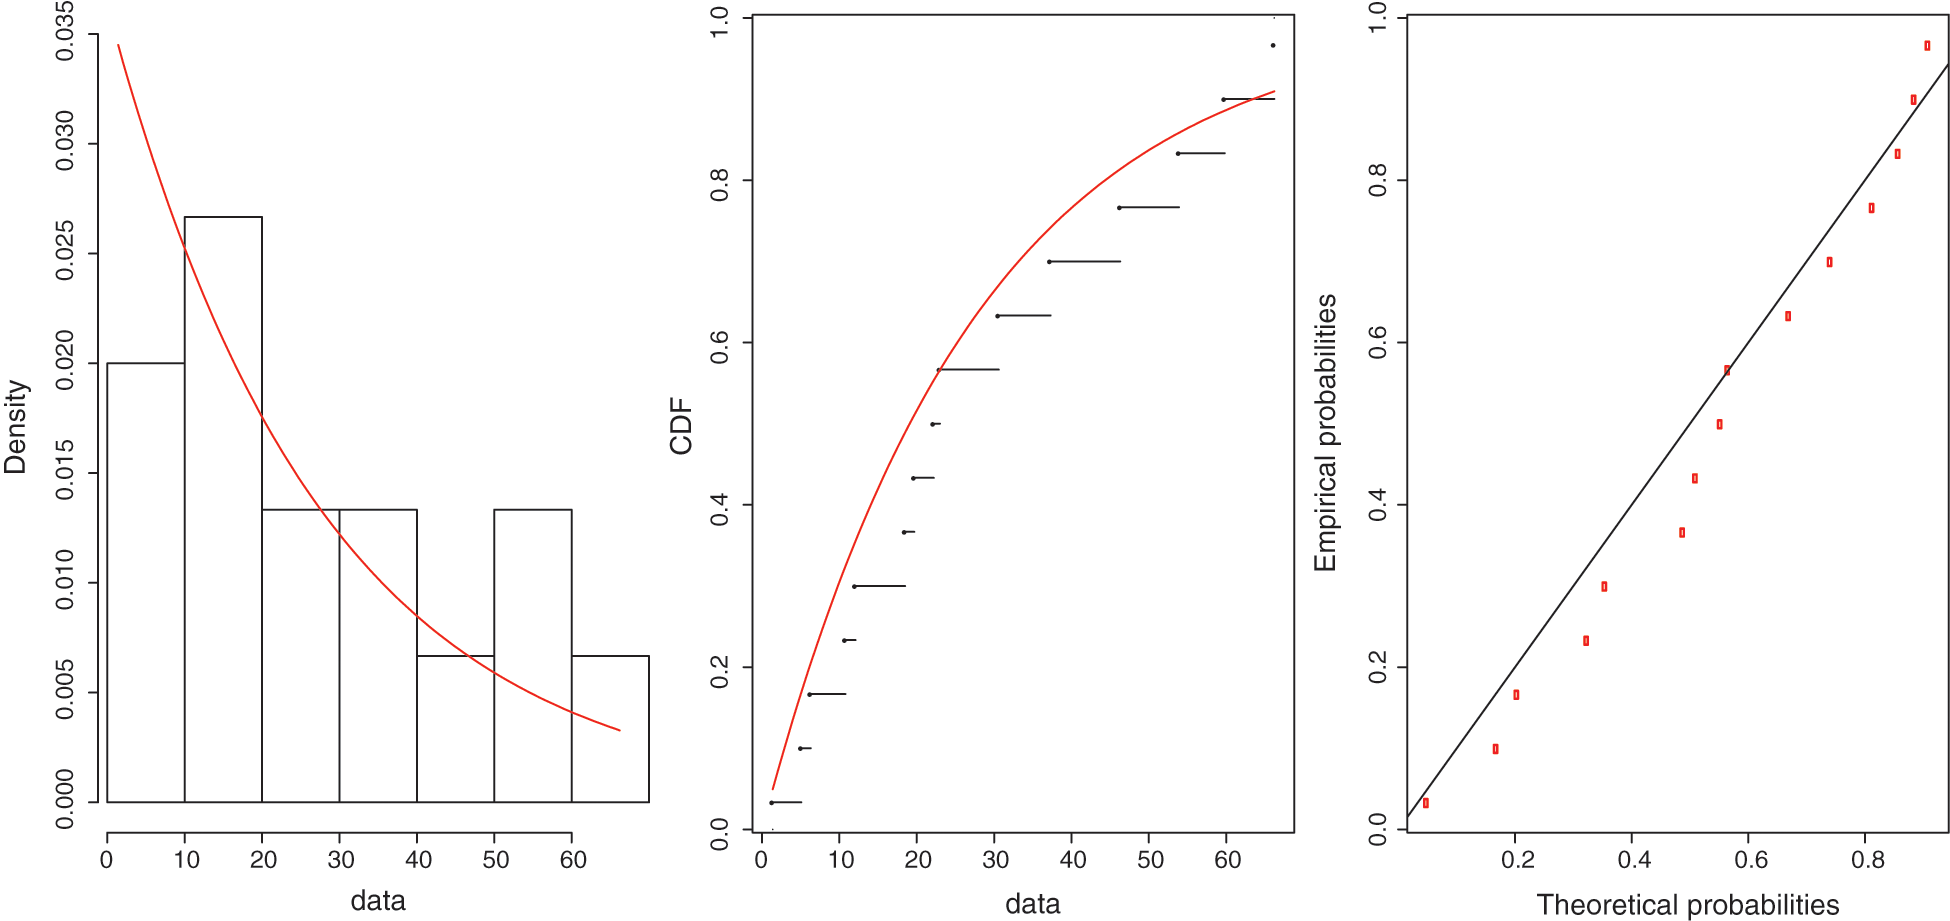
Figure 1: Histogram-density, CDFs, and P-P plots for dataset I
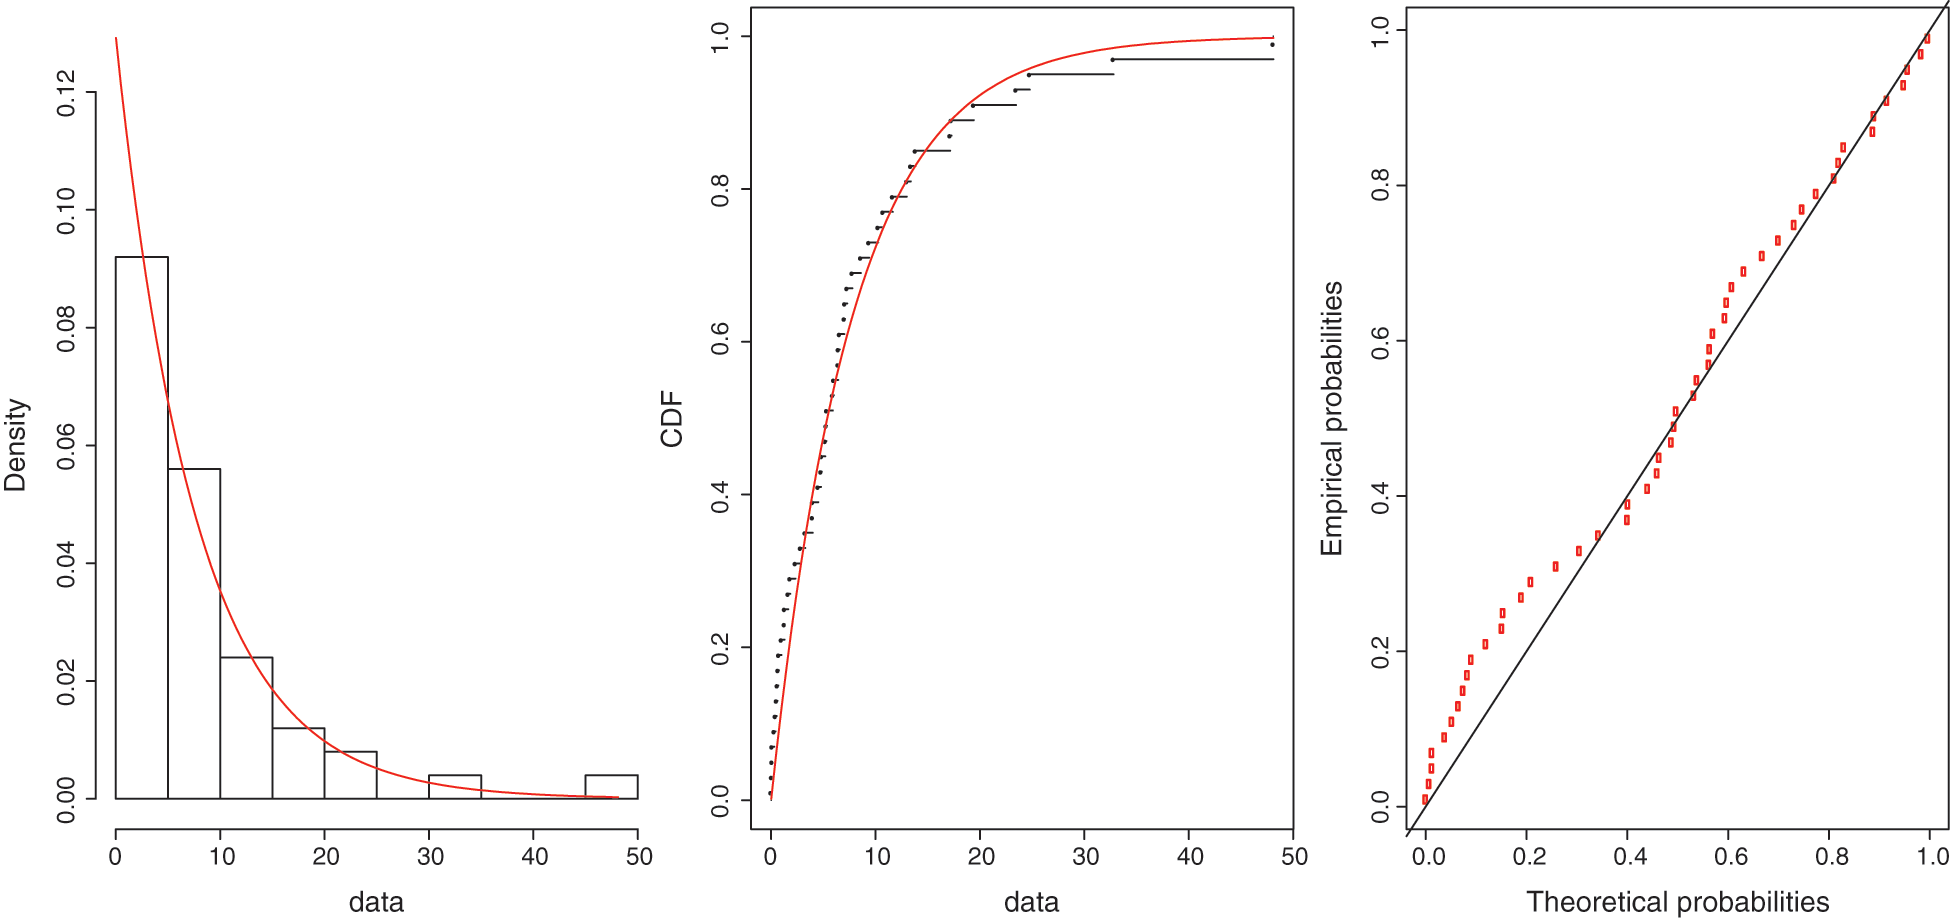
Figure 2: Histogram-density, CDFs, and P-P plots for dataset II
Table 4: Descriptive summary of real datasets
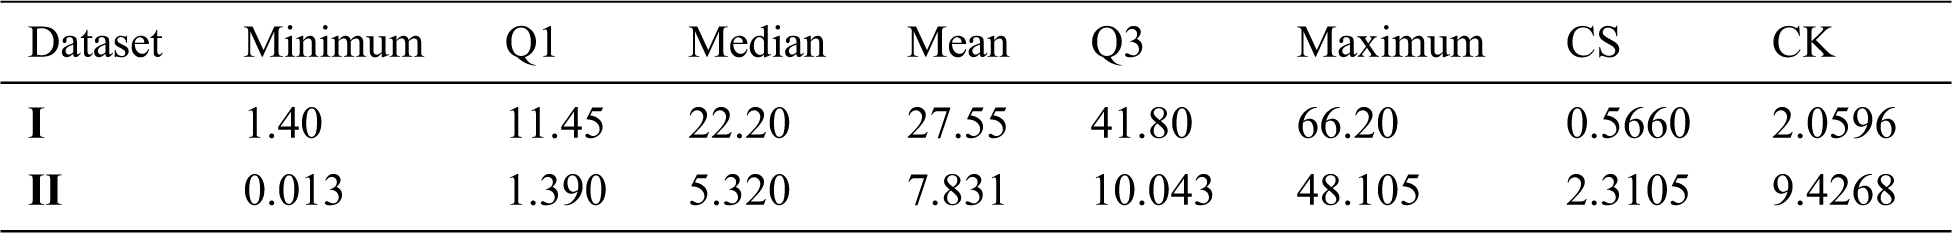
Table 5: Model fitting results of real datasets
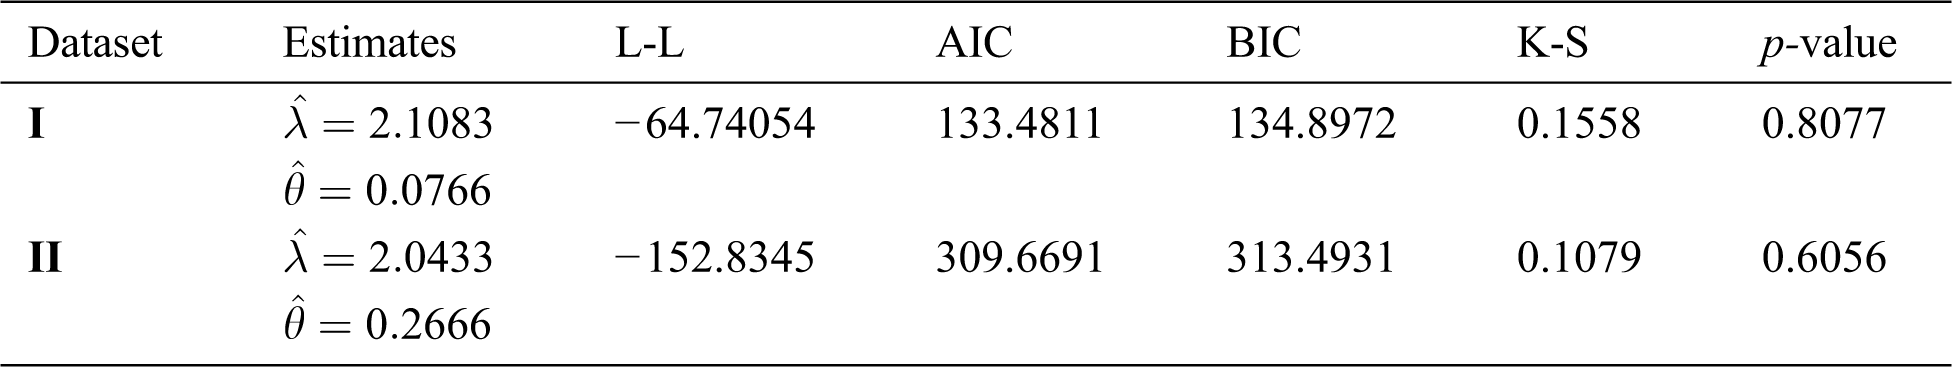
Dataset I: The dataset I was taken from Lawless [30], and it included the failure times in minutes for 15 electronic components obtained by the accelerated life test, which were as follows: 1.4, 5.1, 6.3, 10.8, 12.1, 18.5, 19.7, 22.2, 23, 30.6, 37.3, 46.3, 53.9, 59.8, and 66.2. This dataset follows the DD, and the maximum likelihood estimates of the distribution parameters were
• Select a sample of size
• Record the number of non-conforming units
• If
At the true mean lifetime of
Dataset II: The second dataset consisted of the failure times (in weeks) of 50 components. This dataset was considered by Jose and Paul [31], and the failure times in this dataset were as follows: 0.013, 0.065, 0.111, 0.111, 0.613, 0.309, 0.426, 0.535, 0.684, 0.747, 0.997, 1.284, 1.304, 1.647, 1.829, 2.336, 2.838, 3.269, 3.997, 3.981, 4.52, 4.789, 4.849, 5.202, 5.291, 5.349, 5.911, 6.018, 6.427, 6.456, 6.572, 7.023, 7.087, 7.291, 7.787, 8.596, 9.388, 10.261, 10.731, 11.658, 13.006, 13.388, 13.842, 17.152, 17.283, 19.418, 23.471, 4.777, 32.795, and 48.105.
The lifetime of this dataset followed the Darna distribution, and the maximum likelihood estimates were
• Select a sample of size 50 from a submitted lot with the normal inspection and test the units up to the truncation time of
• Record the number of non-conforming units
• If
At the true mean lifetime of
In this paper, an MChSP for the time truncated test when the lifetime of products follows the DD is proposed. The proposed plan parameters at the producer’s risk of
Acknowledgement: The authors are grateful to the Editor and anonymous reviewers for their valuable comments and suggestions.
Funding Statement: A.R.A. Alanzi would like to thank the Deanship of Scientific Research at Majmaah University for financial support and encouragement.
Conflicts of Interest: The authors declare that they have no conflicts of interest to report regarding the present study.
1. A. I. Al-Omari and A. D. Al-Nasser, “A two parameter quasi Lindley distribution in acceptance sampling plans from truncated life test,” Journal of Statistic and Operation Research, vol. 1, pp. 39–47, 2019. [Google Scholar]
2. A. I. Al-Omari and S. A. Al-Hadhrami, “Acceptance sampling plans based on truncated life tests for extended exponential distribution,” Kuwait Journal of Science, vol. 45, no. 2, pp. 89–99, 2018. [Google Scholar]
3. M. Aslam, C. H. Jun and M. Ahmad, “New acceptance sampling plans based on life tests for Birnbaum–Saunders distributions,” Journal of Statistical Computation and Simulation, vol. 81, no. 4, pp. 461–470, 2011. [Google Scholar]
4. G. S. Rao, “A group acceptance sampling plans for lifetimes following a generalized exponential distribution,” Economic Quality Control, vol. 24, no. 1, pp. 75–85, 2009. [Google Scholar]
5. C. H. Jun, S. Balamurali and S. H. Lee, “Variables sampling plans for Weibull distributed lifetimes under sudden death testing,” IEEE Transactions on Reliability, vol. 55, no. 1, pp. 53–58, 2006. [Google Scholar]
6. A. I. Al-Omari, “Acceptance sampling plans based on truncated life tests for Sushila distribution,” Journal of Mathematical and Fundamental Sciences, vol. 50, no. 1, pp. 72–83, 2018. [Google Scholar]
7. A. I. Al-Omari, “The transmuted generalized inverse Weibull distribution in acceptance sampling plans based on life tests,” Transactions of the Institute of Measurement and Control, vol. 40, no. 16, pp. 4432–4443, 2018. [Google Scholar]
8. A. I. Al-Omari, “Improved acceptance sampling plans based on truncated life tests for Garima distribution,” International Journal of System Assurance Engineering and Management, vol. 9, no. 6, pp. 1287–1293, 2018. [Google Scholar]
9. M. Aslam and C. H. Jun, “A double acceptance sampling plan for generalized log-logistic distributions with known shape parameters,” Journal of Applied Statistics, vol. 37, no. 3, pp. 405–414, 2010. [Google Scholar]
10. G. S. Rao, “Double acceptance sampling plan based on truncated life tests for Marshall-Olkin extended exponential distribution,” Austrian Journal of Statistics, vol. 40, no. 3, pp. 169–176, 2011. [Google Scholar]
11. A. S. Ramaswamy and P. Anburajan, “Double acceptance sampling based on truncated life tests in generalized exponential distribution,” Applied Mathematical Sciences, vol. 6, no. 64, pp. 3199–3207, 2012. [Google Scholar]
12. W. Gui, “Double acceptance sampling plan for truncated life tests based on Maxwell distribution,” American Journal of Mathematical and Management Sciences, vol. 33, no. 2, pp. 98–109, 2014. [Google Scholar]
13. A. I. Al-Omari, A. D. Al-Nasser and F. S. Gogah, “Double acceptance sampling plan for time-truncated life tests based on half normal distribution,” Economic Quality Control, vol. 31, no. 2, pp. 93–99, 2016. [Google Scholar]
14. M. Aslam, C. H. Jun and M. Ahmad, “A group sampling plan based on truncated life test for gamma distributed items,” Pakistan Journal of Statistics, vol. 25, no. 3, pp. 333–340, 2009. [Google Scholar]
15. M. Aslam and C. H. Jun, “A group acceptance sampling plan for truncated life test having Weibull distribution,” Journal of Applied Statistics, vol. 36, no. 9, pp. 1021–1027, 2009. [Google Scholar]
16. M. Aslam, A. R. Mughal, M. Ahmed and Y. Zafar, “Group acceptance sampling plans for Pareto distribution of the second kind,” Journal of Testing and Evaluation, vol. 38, no. 2, pp. 143–150, 2010. [Google Scholar]
17. H. Tripathi, M. Saha and V. Alha, “An application of time truncated single acceptance sampling plan based on generalized half-normal distribution,” Annals of Data Science, vol. 8, no. 1, pp. 189–195, 2021. [Google Scholar]
18. H. Tripathi, S. Dey and M. Saha, “Double and group acceptance sampling plan for truncated life test based on inverse log-logistic distribution,” Journal of Applied Statistics, vol. 31, pp. 1–16, 2020. [Google Scholar]
19. A. I. Al-Omari, N. Koyuncu and A. R. A. Al-anzi, “New acceptance sampling plans based on truncated life tests for Akash distribution with an application to electric carts data IEEE,” Access, vol. 8, pp. 201393–201403, 2020. [Google Scholar]
20. A. I. Al-Omari, A. D. Al-Nasser and E. Ciavolino, “Acceptance sampling plans based on truncated life tests for Rama distribution,” International Journal of Quality & Reliability Management, vol. 36, no. 7, pp. 1181–1191, 2019. [Google Scholar]
21. A. I. Al-Omari, A. Santiago, J. M. Sautto and C. N. Bouza, “New Weibull-Pareto distribution in acceptance sampling plans based on truncated life tests,” American Journal of Mathematics and Statistics, vol. 8, no. 5, pp. 144–150, 2016. [Google Scholar]
22. A. D. Al-Nasser, A. I. Al-Omari, A. Bani-Mustafa and K. Jaber, “Developing single-acceptance sampling plans based on a truncated lifetime test for an Ishita distribution,” Statistics in Transition New Series, vol. 19, no. 3, pp. 393–406, 2018. [Google Scholar]
23. H. F. Dodge, “Chain sampling inspection plan,” Industry Quality Control, vol. 11, no. 4, pp. 10–13, 1995. [Google Scholar]
24. K. Govindaraju and S. Balamurali, “Chain sampling plan for variables inspection,” Journal of Applied Statistics, vol. 25, no. 1, pp. 103–109, 1998. [Google Scholar]
25. S. Luca, “Modified chain sampling plans for lot inspection by variables and attributes,” Journal of Applied Statistics, vol. 45, no. 8, pp. 1447–1464, 2018. [Google Scholar]
26. A. F. Jamaludin, Z. Zain and N. Aziz, “A modified group chain sampling plans for lifetimes following a Rayleigh distribution,” Global Journal of Pure and Applied Mathematics, vol. 12, no. 5, pp. 3941–3947, 2016. [Google Scholar]
27. K. Govindaraju and S. Balamurali, “Chain sampling plan for variables inspection,” Journal of Applied Statistics, vol. 25, no. 1, pp. 103–109, 1998. [Google Scholar]
28. A. R. S. Ramaswamy and A. R. M. Priya, “Sampling risks for chain sampling plans with non-constant defective probability,” Stochastics and Quality Control, vol. 22, no. 1, pp. 117–126, 2007. https://www.degruyter.com/view/journals/eqc/22/1/article-p117.xml?language=en-affiliation0. [Google Scholar]
29. D. H. Shraa and A. I. Al-Omari, “Darna distribution: Properties and application,” Electronic Journal of Applied Statistical Analysis, vol. 12, no. 2, pp. 520–541, 2019. [Google Scholar]
30. J. F. Lawless, Statistical models and methods for lifetime data. New York, USA: John Wiley and Sons, 2003. [Google Scholar]
31. K. K. Jose and A. Paul, “Marshall-Olkin exponential power distribution and its generalization: Theory and application,” IAPQR Transaction, vol. 43, no. 1, pp. 1–29, 2018. [Google Scholar]
32. A. Haq, J. Brown, E. Moltchanova and A. I. Al-Omari, “Partial ranked set sampling design,” Environmetrics, vol. 24, no. 3, pp. 201–207, 2013. [Google Scholar]
33. A. Haq, J. Brown, E. Moltchanova and A. I. Al-Omari, “Mixed ranked set sampling design,” Journal of Applied Statistics, vol. 41, no. 10, pp. 2141–2156, 2014. [Google Scholar]
34. A. Haq, J. Brown, E. Moltchanova and A. I. Al-Omari, “Ordered double ranked set samples and applications to inference,” American Journal of Mathematical and Management Sciences, vol. 33, pp. 239–260, 2014. [Google Scholar]
35. E. Zamanzade and A. I. Al-Omari, “New ranked set sampling for estimating the population mean and variance,Hacettepe,” Journal of Mathematics, and Statistics, vol. 45, no. 6, pp. 1891–1905, 2016. [Google Scholar]
 | This work is licensed under a Creative Commons Attribution 4.0 International License, which permits unrestricted use, distribution, and reproduction in any medium, provided the original work is properly cited. |