DOI:10.32604/csse.2021.016340
| Computer Systems Science & Engineering DOI:10.32604/csse.2021.016340 | |
| Article |
A Holographic Diffraction Label Recognition Algorithm Based on Fusion Double Tensor Features
1Hangzhou Dianzi University, Hangzhou, 310018, China
2Zhejiang Police College, Hangzhou, 310018, China
3University of Warwick, Coventry, CV4 7AL, UK
*Corresponding Author: Shanqing Zhang. Email: sqzhang@hdu.edu.cn
Received: 30 December 2020; Accepted: 26 February 2021
Abstract: As an efficient technique for anti-counterfeiting, holographic diffraction labels has been widely applied to various fields. Due to their unique feature, traditional image recognition algorithms are not ideal for the holographic diffraction label recognition. Since a tensor preserves the spatiotemporal features of an original sample in the process of feature extraction, in this paper we propose a new holographic diffraction label recognition algorithm that combines two tensor features. The HSV (Hue Saturation Value) tensor and the HOG (Histogram of Oriented Gradient) tensor are used to represent the color information and gradient information of holographic diffraction label, respectively. Meanwhile, the tensor decomposition is performed by high order singular value decomposition, and tensor decomposition matrices are obtained. Taking into consideration of the different recognition capabilities of decomposition matrices, we design a decomposition matrix similarity fusion strategy using a typical correlation analysis algorithm and projection from similarity vectors of different decomposition matrices to the PCA (Principal Component Analysis) sub-space , then, the sub-space performs KNN (K-Nearest Neighbors) classification is performed. The effectiveness of our fusion strategy is verified by experiments. Our double tensor recognition algorithm complements the recognition capability of different tensors to produce better recognition performance for the holographic diffraction label system.
Keywords: Label recognition; holographic diffraction; fusion double tensor; matrix similarity
With the rapid development of printing technology, new types of product labels are used. Holographic diffraction labels have been chosen by many manufacturers due to their unique anti-counterfeiting feature. With the popularity of smartphones, there is an increasing demand for image recognition using mobile phones. Different image features are shown in different illumination environments due to the unique physical feature of holographic diffraction labels. Traditional image recognition algorithms are not ideal for holographic diffraction label recognition.
In this study, tensor is used to represent data to preserve the optically variable data of a diffraction image. Tensor has been widely used in signal and image processing [1–3], factor analysis [4,5], and voice communication [6]. Since a tensor can maintains the structure of the original data, tensor analysis has appealed to researchers. Most datasets can be represented by matrices and efficiently analyzed by singular value decomposition (SVD) [7]. However, some specific datasets such as sequence images, video and text cannot be represented by matrices directly, so additional operations are required. For example, when SVD decomposition cannot be used directly, tensor decomposition such as Tucker decomposition is required [8]. Vasilescu et al. [9] constructed face images into two-dimensional tensors for face recognition.
Low-dimension sub-space learning methods have been expanded to tensor representation, such as tensor principal component analysis [10], tensor linear discriminant analysis [11], and multilinear discriminant analysis [12]. Stoudenmire et al. [13] proposed a supervised tensor-learning framework that can directly process high order tensor data.
Information from changing illumination of holographic diffractive labels is lost if it is represented using matrix [14]. In addition, smartphone camera captures the jitter and rotational interference. A double tensor is used herein to represent the features of holographic diffraction labels. Most tensor-based image recognition methods directly represent the original data of the image as a tensor and do not include feature extraction. An appropriate feature extraction method makes it possible that the original image is represented as a tensor through new features [15], which results in better recognition performance. Moreover, the original data and the extracted features can complement each other, further improving the accuracy of classification [16]. Taking into consideration of the features of holographic images under different illumination, we propose a holographic label classification method that combines an HSV (Hue Saturation Value) tensor with a HOG (Histogram of Oriented Gradient) feature tensor. Accurate classification and identification of label images are achieved by similarity measurement of both tensors.
A color image has three channels of RGB and can be represented as a tensor intrinsically. A holographic label has different color information for different illuminations because of its light-varying feature. In order to preserve the color information of an image, the holographic image is converted from the RGB to the HSV color space and is further represented as an HSV tensor [17]. The HOG tensor of a label is constructed on the extracted HOG features [18]. In order to measure the similarity between the tensors, high-order singular value decomposition (HOSVD) is used to obtain the decomposition matrix of tensor expansion matrices [19], and the typical correlation coefficients of the decomposition matrix are calculated using Canonical correlation analysis (CCA) to obtain the similarity vector. Because different decomposition matrices have different classification capabilities, we propose a fusion strategy to perform principal component analysis (PCA) dimension reduction for the similarity vector. Finally, the nearest neighbor algorithm is used for classification. The flowchart of our algorithm is shown in Fig. 1.
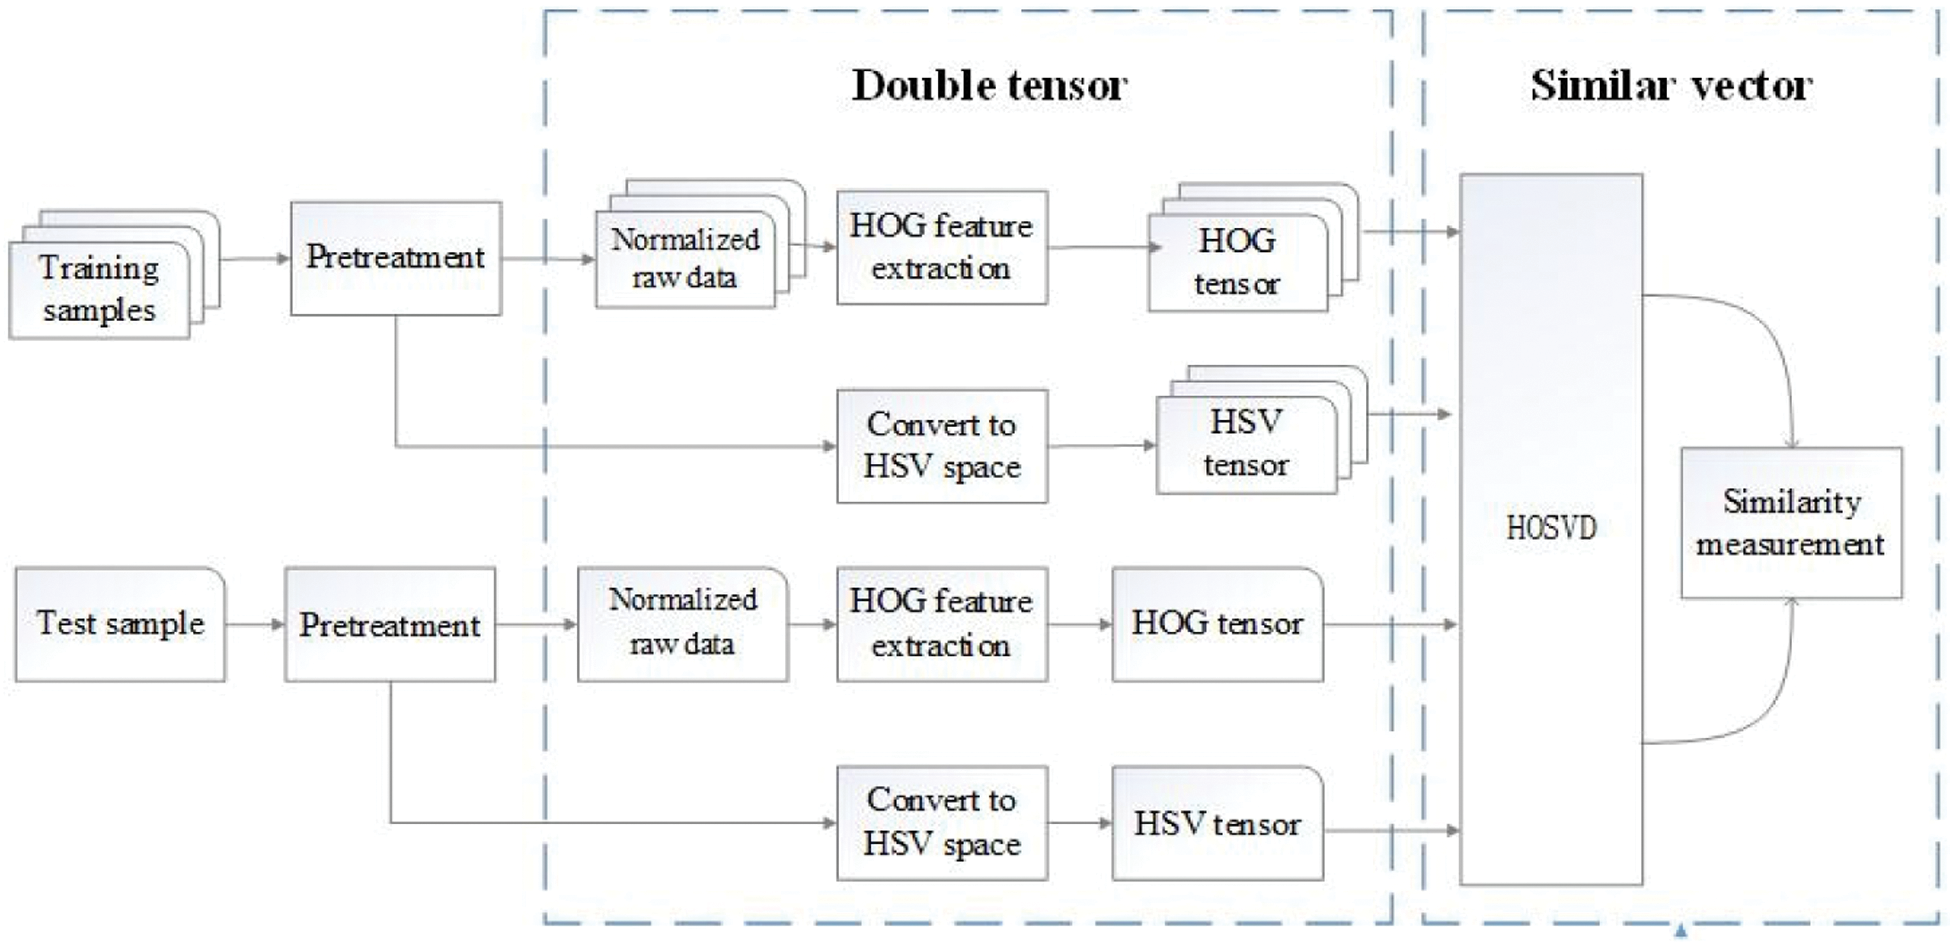
Figure 1: Flowchart of double tensor recognition algorithm
The tilt and rotation of an image taken by a mobile phone always causes incorrect recognition. In order to ensure the accuracy of the classification, rotation correction using edge detection and the Hough transformation are performed for all input images.
In order to remove interference from the background in a label image, the grayscale image is converted into a binary image using the maximum OTSU. Then Canny edge detection is performed on the binary image. The traditional Canny operator performs Gaussian smoothing on the original image in the process of edge detection. However, the influence of noise is related to the distance of the noise point from the center after Gaussian smoothing. It causes image edge blurring [20] and impacts the image correction effect [21]. Median filtering is used to preserve the edge information of an image. The test results are shown in Fig. 2c. The binary image obtained by edge detection goes through the Hough rotation correction, and the results are shown in Fig. 2.
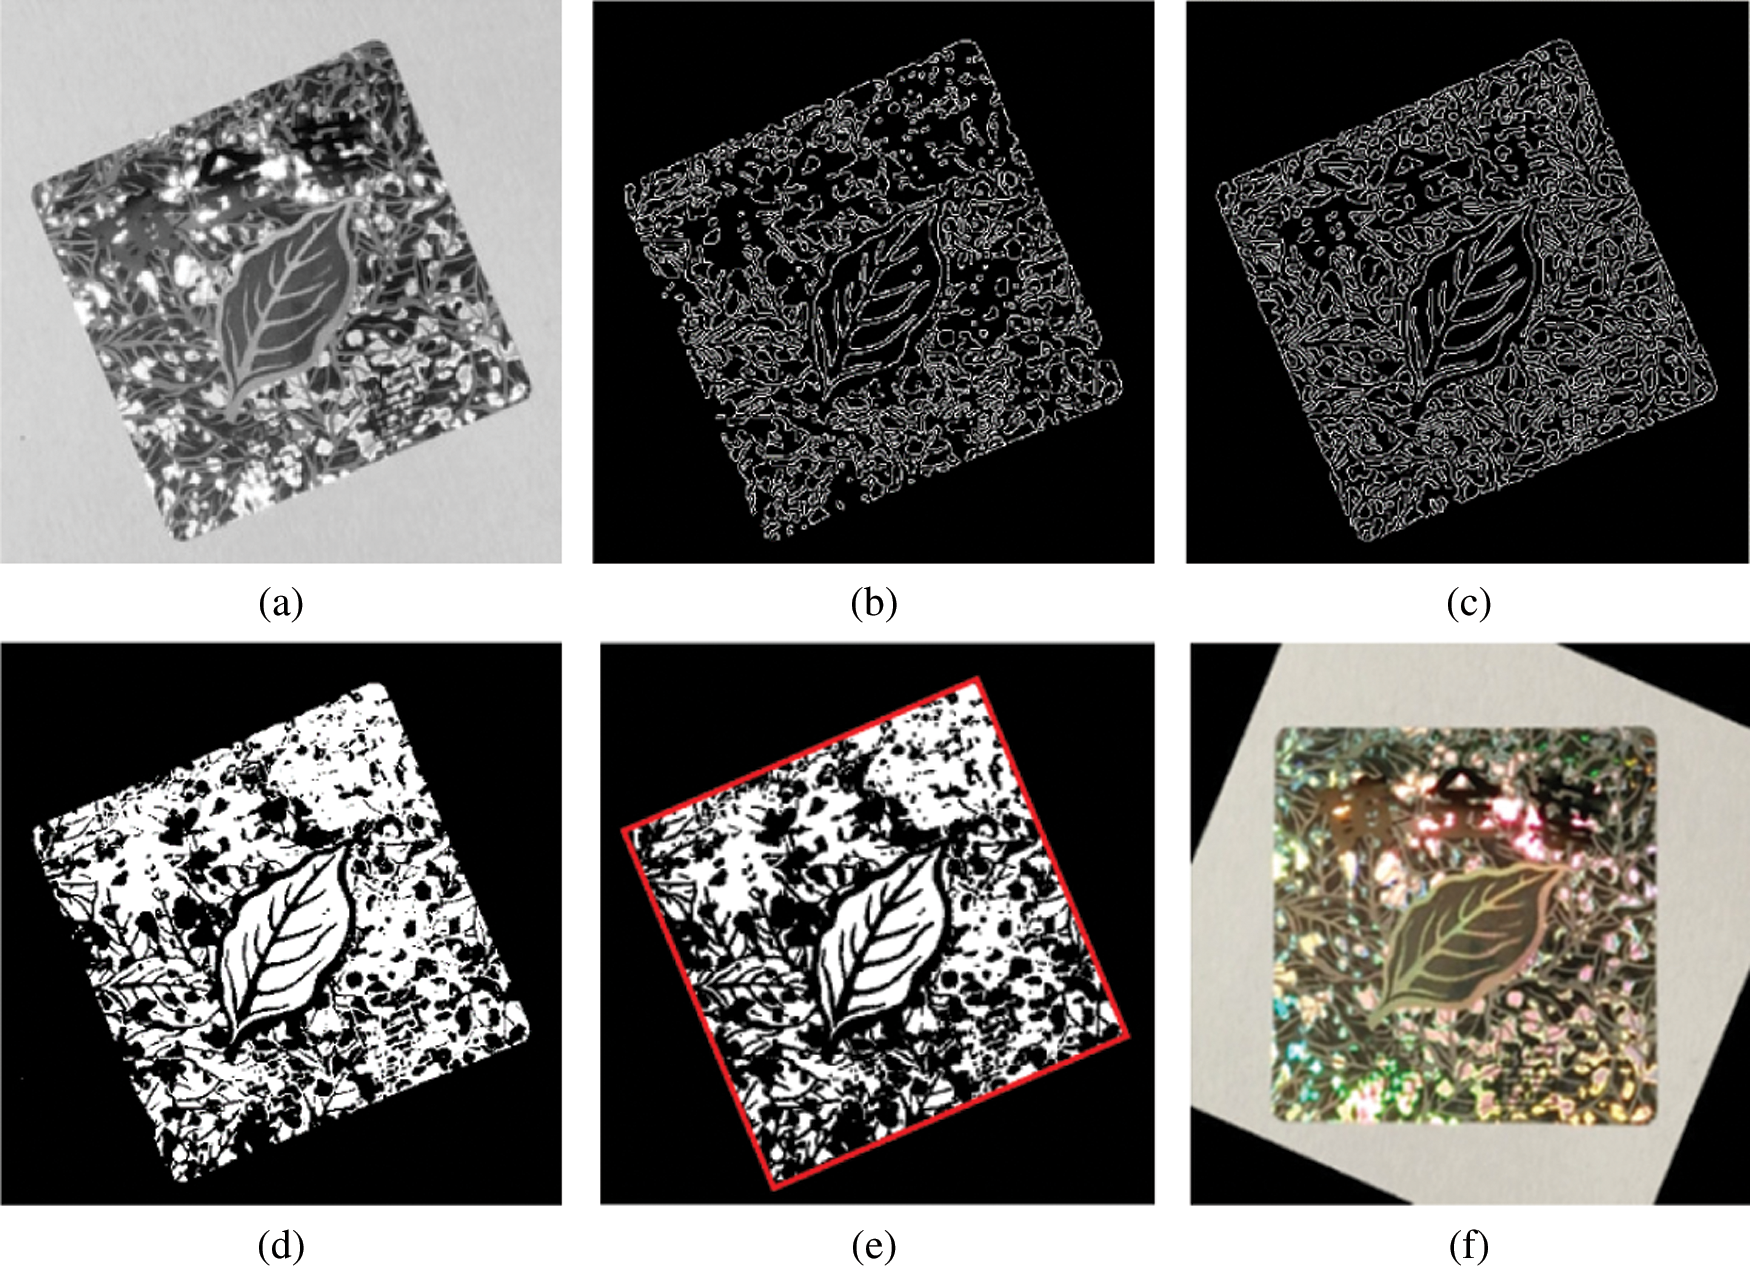
Figure 2: The image with rotation correction (a) Grayscale (b) Traditional Canny algorithm (c) Improved Canny algorithm (d) Binary map (e) Hough detection line (f) Rotation correction
After the rotation correction, the original RGB color space is converted into a HSV space and normalized into a third-order HSV tensor
Image features are extracted using HOG descriptors. In contrast to traditional HOG feature extraction algorithms, a faster HOG feature extraction method [22] is used to obtain the same descriptors as the original HOG.
The size of a normalized image is given as
where
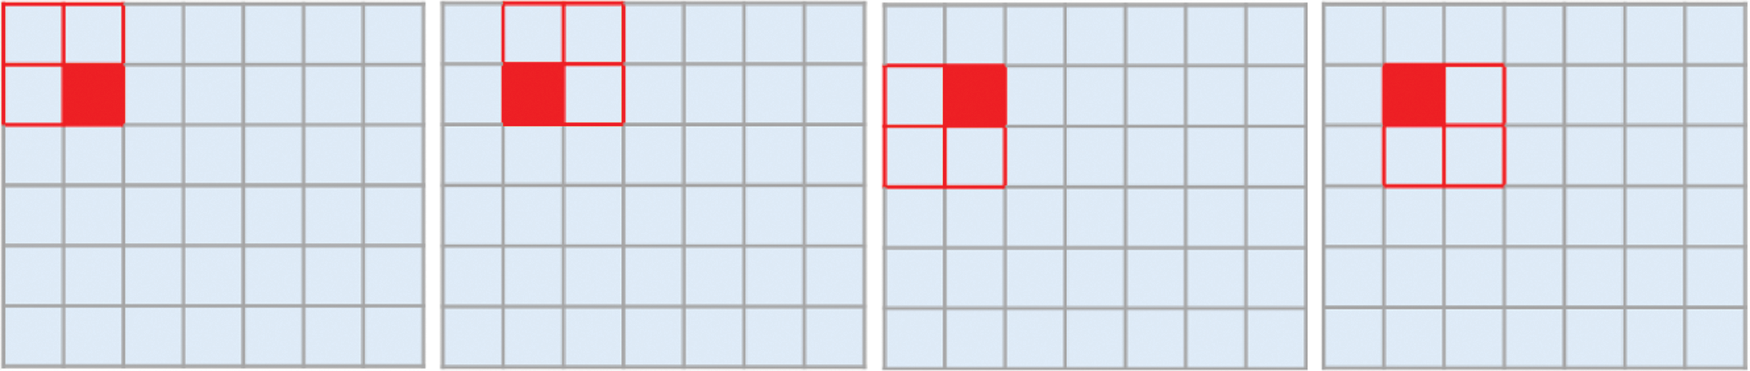
Figure 3: The normalization of blocks in the image
Each block yields four different normalization results,
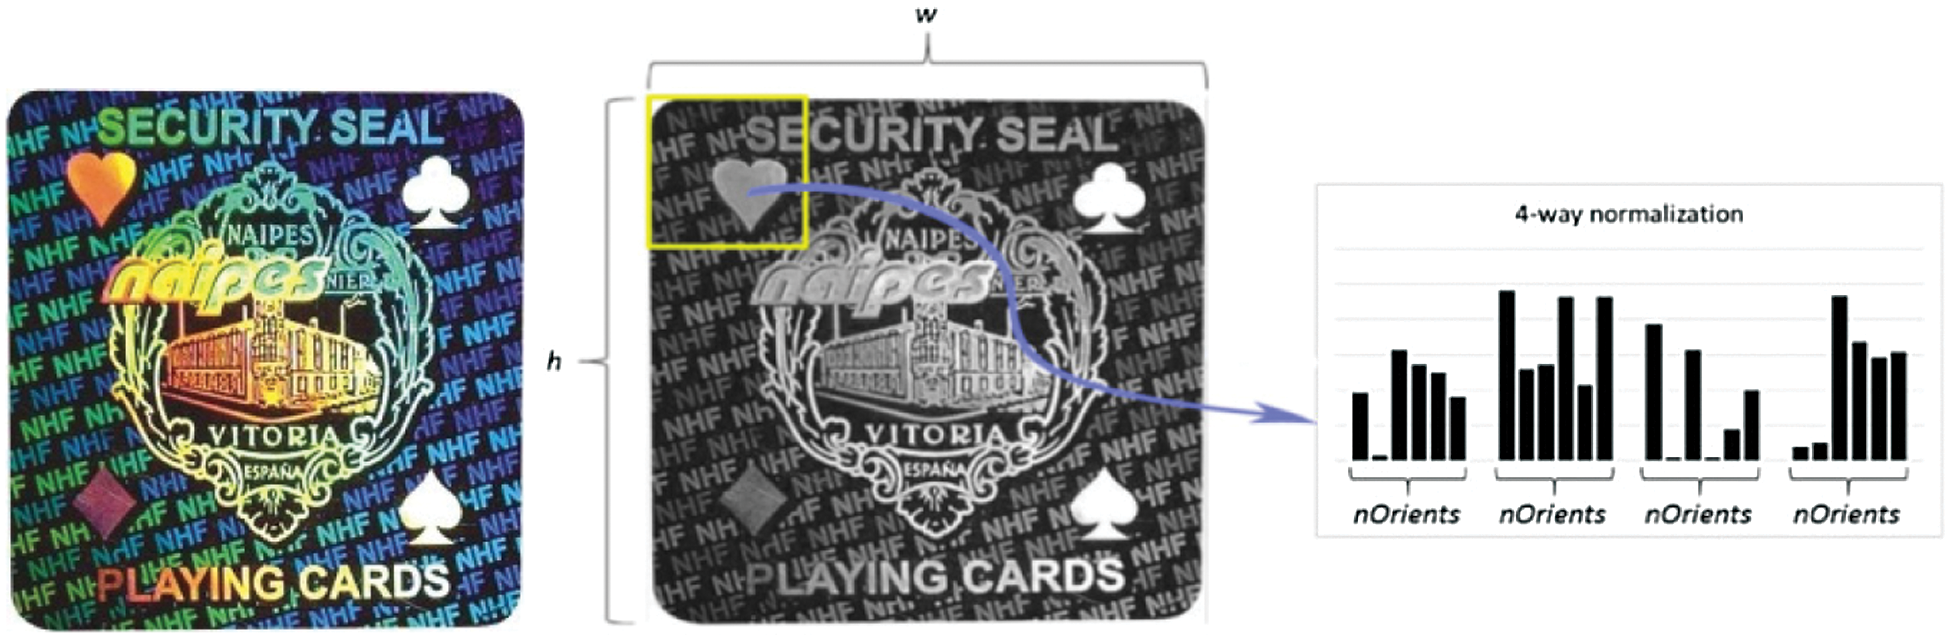
Figure 4: HOG feature extraction
A third-order tensor
2.3 Similarity Between the Double Tensors
The obtained HOG tensor and HSV tensor are the primary features of an image. These primary features are decomposed into orthogonal matrices using HOSVD algorithm. The similarity between the decomposition matrices of the test sample and the training sample are measured using CCA [23,24].
2.3.1 Generation of Decomposition Matrix.
A tensor is decomposed into decomposition matrices using HOSVD. First, a high-order tensor is expanded into a two-dimensional matrix. An
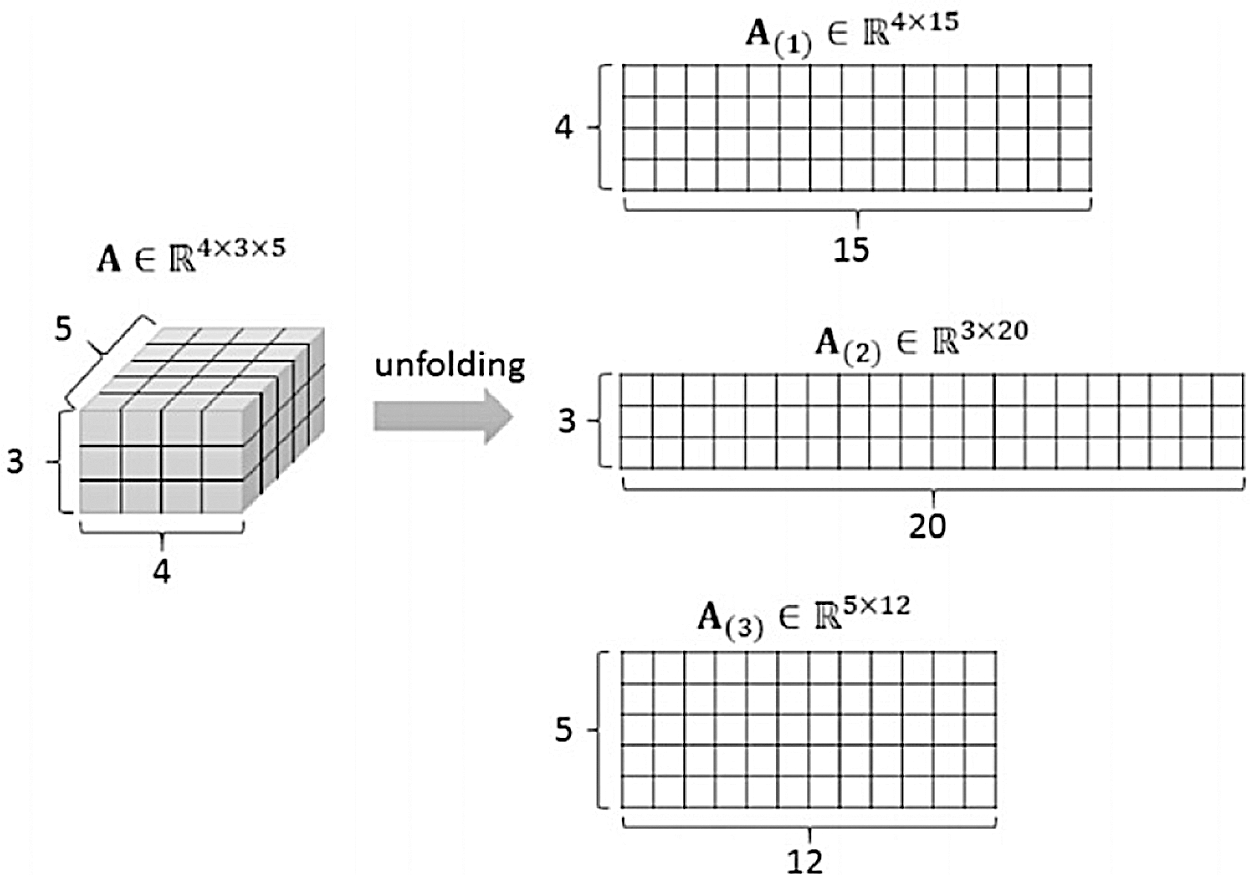
Figure 5: Modulo-N unfold of a third-order tensor
HOSVD decomposition of an expanded matrix is represented as follows:
where
2.3.2 CCA Similarity Measurement.
CCA is used to measure the similarity between tensor decomposition matrices. For random vector
where
Six decomposition matrices
Six typical correlations are obtained based on calculating the similarity of holographic labels described in the previous sections. The summation of all six typical correlations may be simply used as the similarity between the samples. However, different decomposition matrices of a tensor contain different information and have different distinctive capabilities. Therefore, each decomposition matrix serves as an independent unit, and an effective method is proposed to fuse these similarities. The process is shown in Fig. 6.
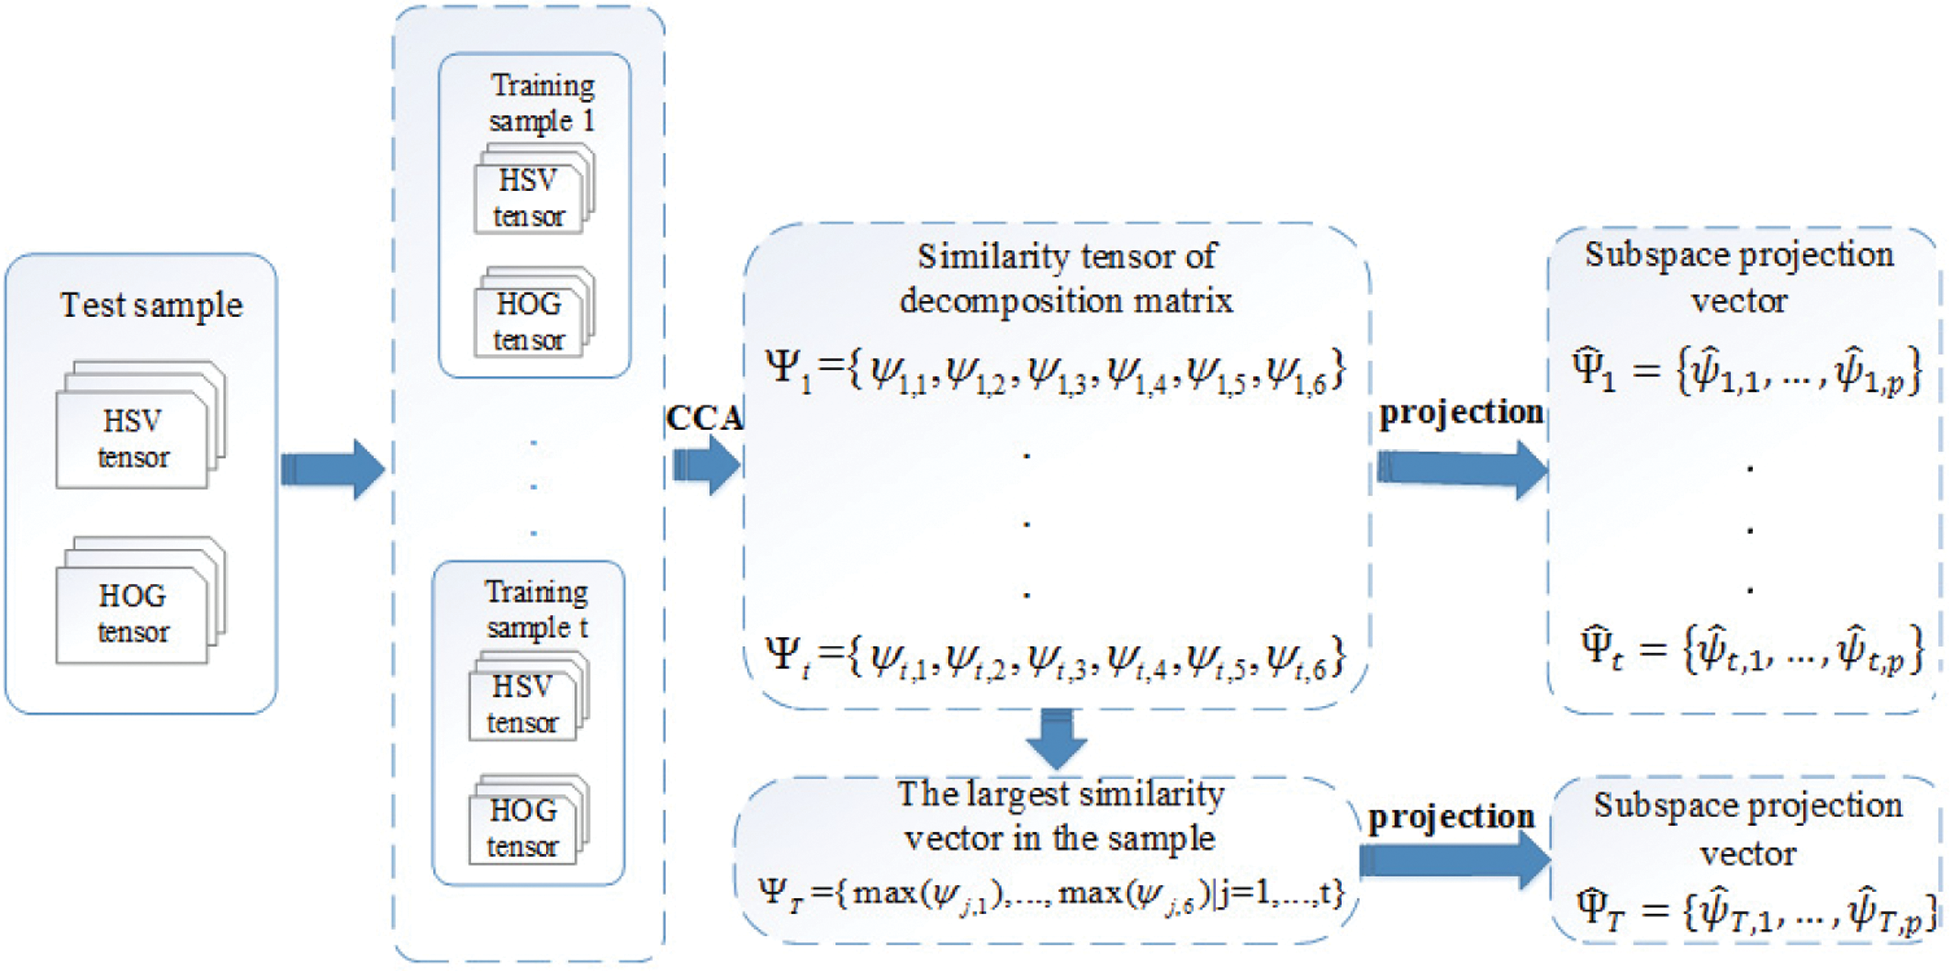
Figure 6: The process of the decomposition matrix similarity fusion
The similarity vectors between the test sample and the training samples are represented as
The scatter matrix is calculated using Eq. (6):
The scatter matrix is decomposed using Eq. (7):
The diagonal matrix
where
The dataset used in this study contains 200 holographic diffraction labels with an image size of
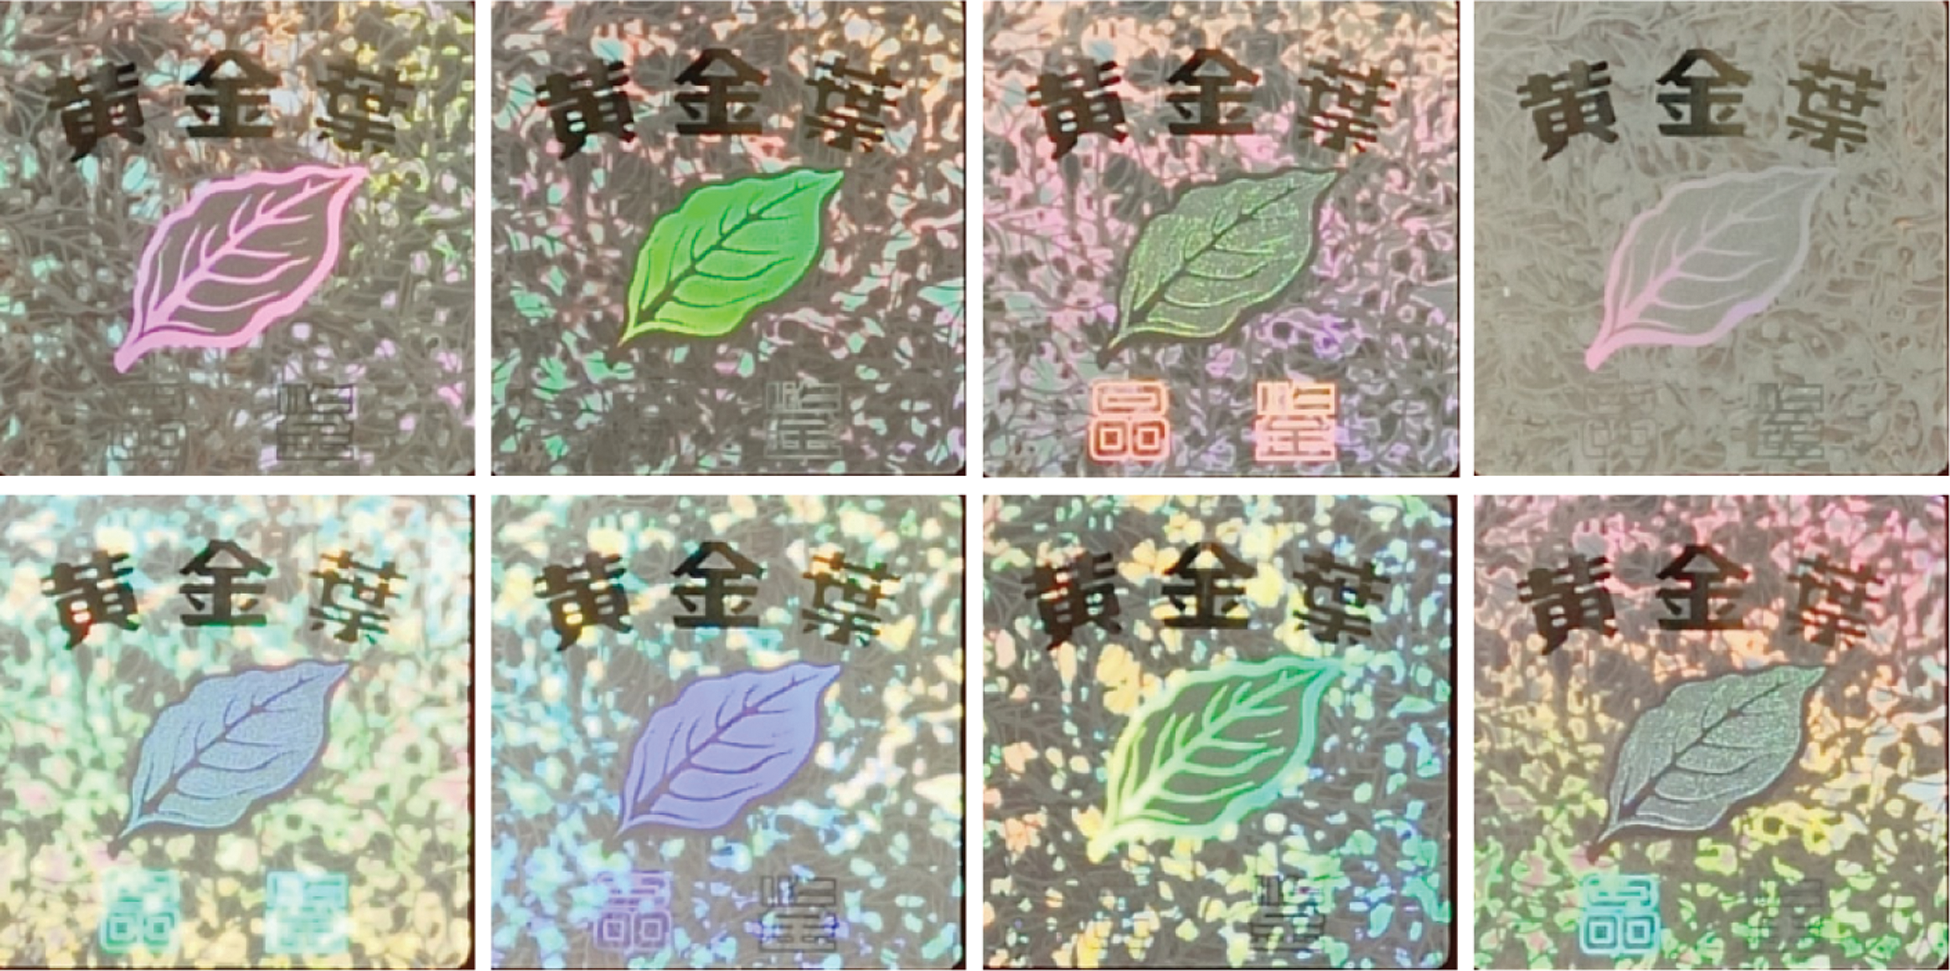
Figure 7: Samples with different lighting environments
3.1 The Advantages of the Fusion Decomposition Matrix
The advantages of the similarity algorithm of the fusion decomposition matrix are analyzed in this study. First, a classification experiment is performed using the decomposition matrices for the HSV tensor, and the recognition results are shown in Tab. 1. Then, the summation strategy was used in their experiments [25]. As shown in Tab. 1, the recognition rate using the fusion strategy is 87.96% and better than that of the decomposition matrix alone. The recognition rate of our fusion algorithm is 93.61%, which indicates good recognition effect.
Table 1: Comparison of recognition rate
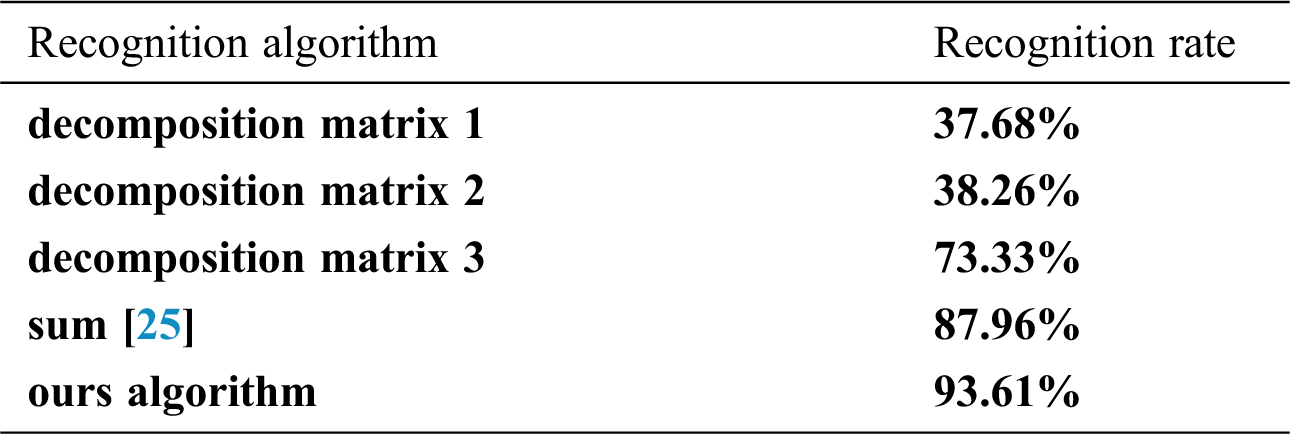
The recognition abilities of different decomposition matrices are not the same but it was not considered in their study. Our strategy overcomes this shortcoming. As shown in Tab. 1, the sample recognitions of decomposition matrices 1, 2, and 3 are different among each other. The typical correlation coefficients of each decomposition matrix are summed into one similarity vector. The similarity vector is projected to the PCA sub-space and classified by the K-nearest neighbor algorithm. The similarity of the decomposition matrices between our algorithm and the summation method is shown in Fig. 8. There are five training samples and one test sample.
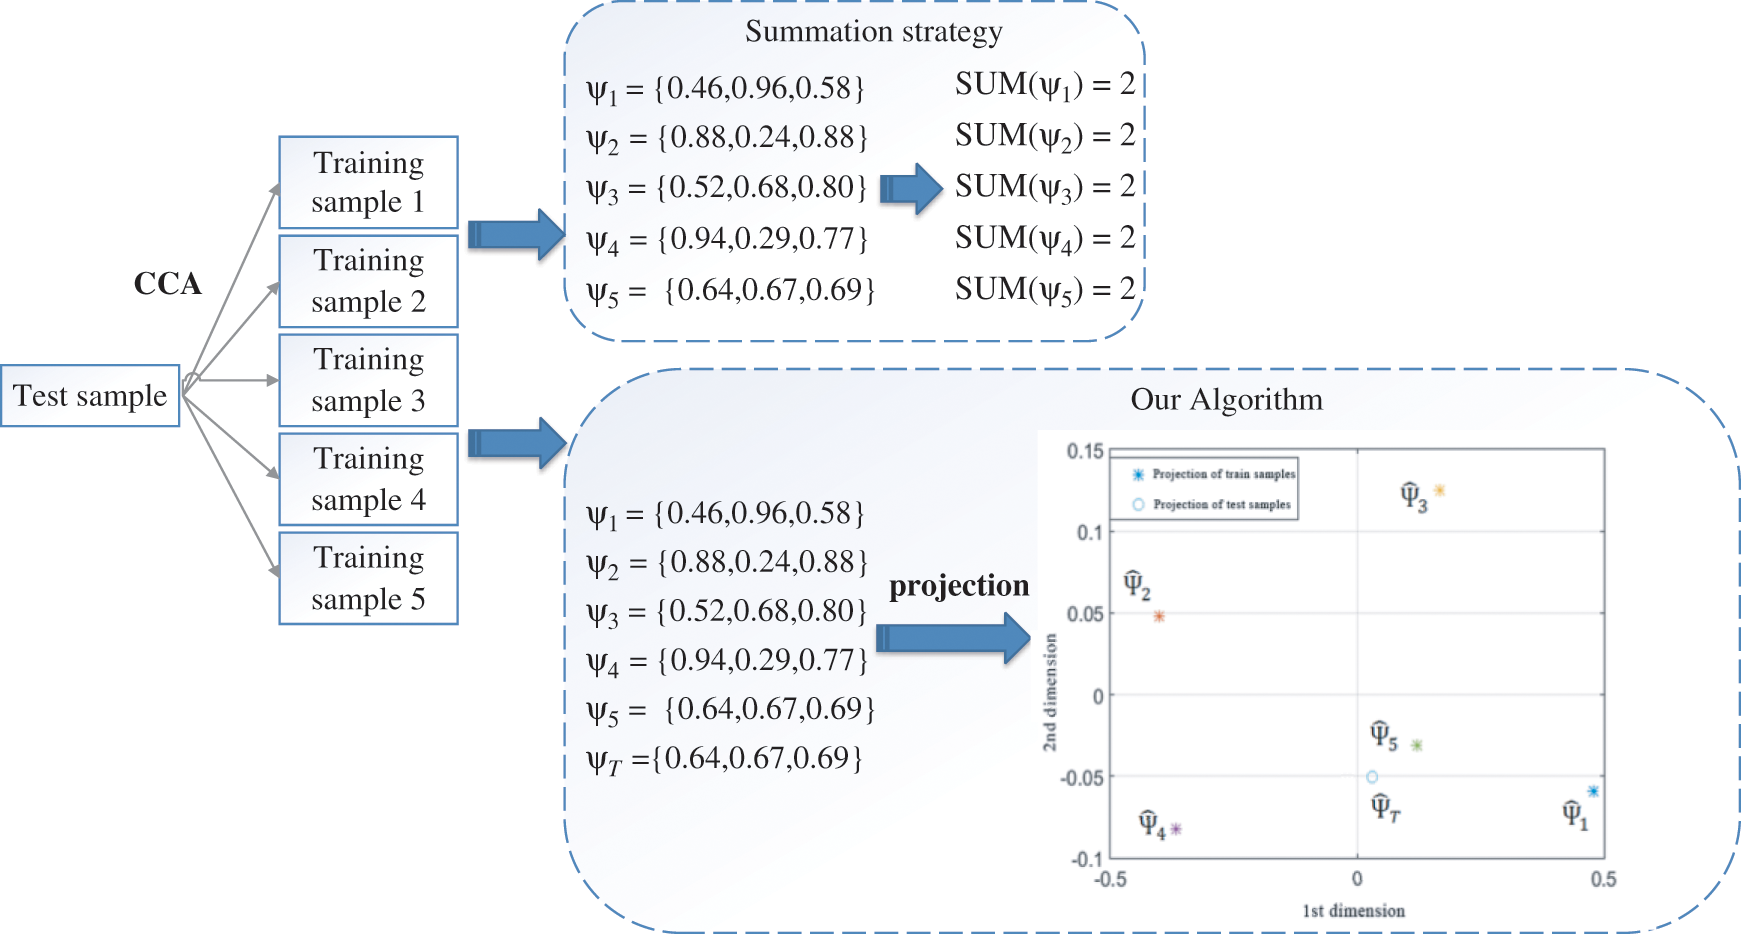
Figure 8: The similarity of the decomposition matrices between two algorithms
Calculating the typical correlation between the test sample and the training samples, we obtain five three-dimensional similarity vectors
3.2 The Complementarity of the Double Tensor Feature
The complementarity of the double tensor is tested. First, only the HSV tensors of the original data are used for holographic image recognition in the dataset. The confusion matrix of the HSV tensor recognition is shown in Fig. 9a. The identification of the HSV tensor is not good in distinguishing between “Label 10” and other holographic labels. Many “Label 10” labels are mis-identified as “Label 6” or “Label 7”. Second, the tensors constructed using the HOG features are tested with the same dataset, and the confusion matrix is shown in Fig. 9b. The HOG tensor has a high recognition rate (95%) for “Label 10”. The two tensors have complementary effect although the HOG tensor is worse than HSV tensor in other categories.
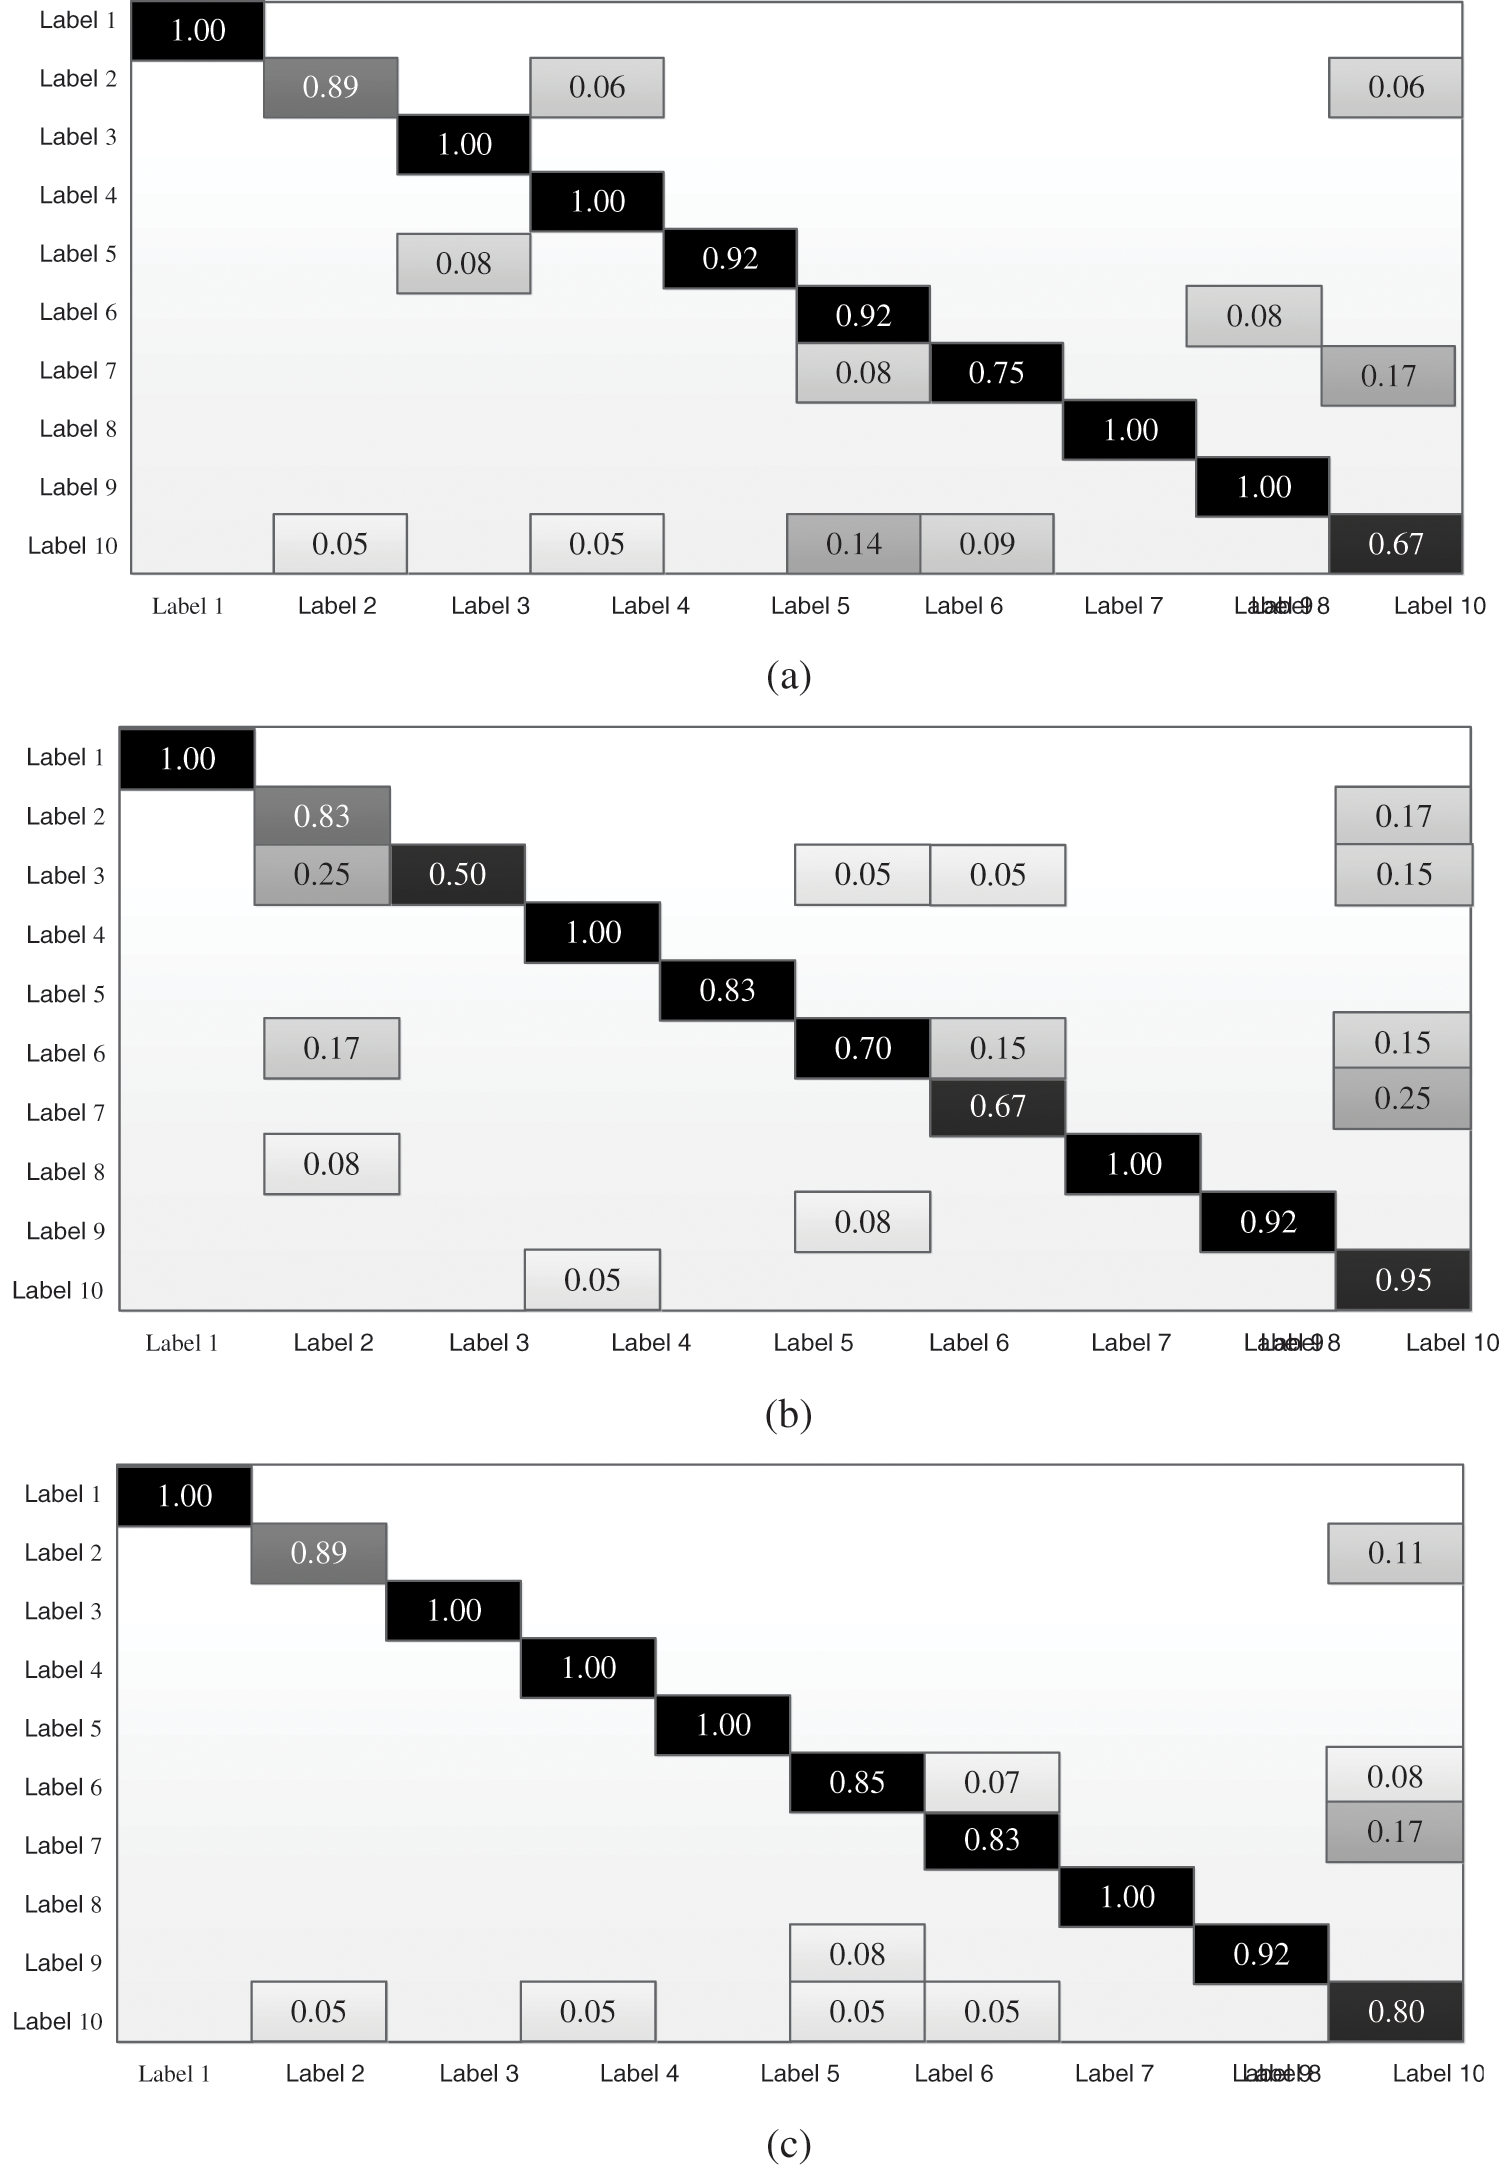
Figure 9: The fusion matrix for identification using different tensors (a) Confusion matrix using HSV tensor (b) Confusion matrix using HOG tensor (c) Confusion matrix using the double tensor
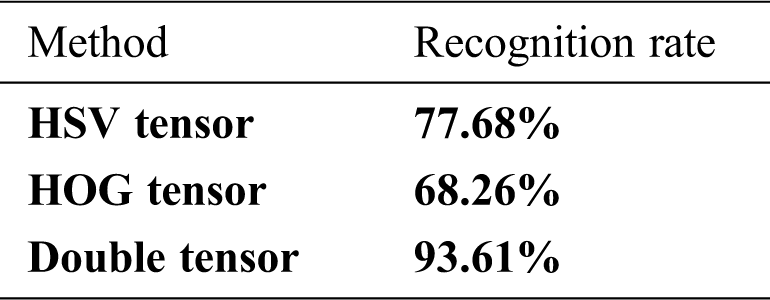
The typical correlation coefficients of the HSV tensor and the HOG tensor are combined based on the above experiment. A confusion matrix is obtained using this double tensor, as shown in Fig. 9c. The double tensor balances the inconsistent recognition results of holographic labels, to some extent, the misidentification of one tensor may be masked by the other tensor, resulting in the complementary effect being generally better than each effect alone. The recognition results using each tensor and the double tensor are shown in Tab. 2. The recognition accuracy of the double tensor is improved greatly.
Table 2: Recognition results using single tensor and the double tensor
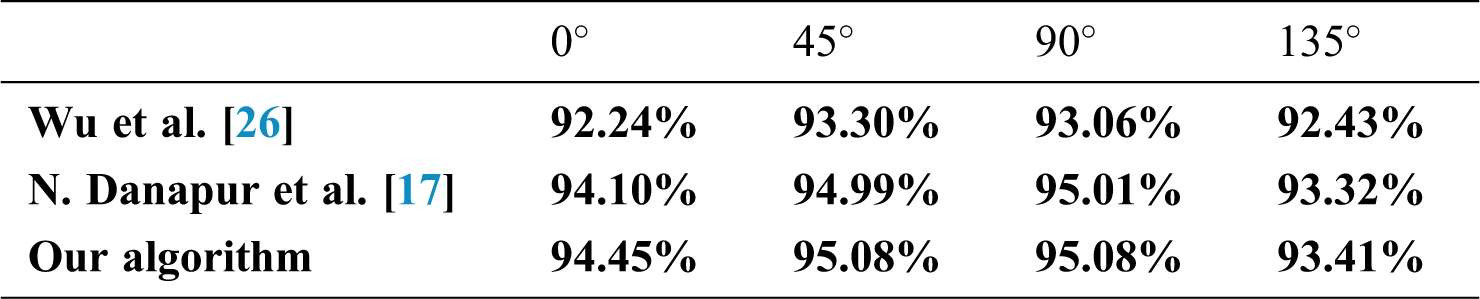
Our algorithm is compared with the algorithm proposed in [17,26] with the same dataset after rotation, cropping, and illumination change of the sample, respectively. The recognition results of the holographic labels are shown in Tabs. 3–5. The experimental results show that our algorithm is robust to rotation and illumination changes. The HSV tensor in the double tensor contains the color information of the sample, and the HOG tensor represents the gradient information. A higher recognition rate is achieved because of their complementation. However, cropping causes loss of sample information, it results in misjudgment. If the cropping parameters are small, the recognition accuracy remains higher than the expanded SIFT in [17,26].
Table 3: Comparison of recognition after sample scaling
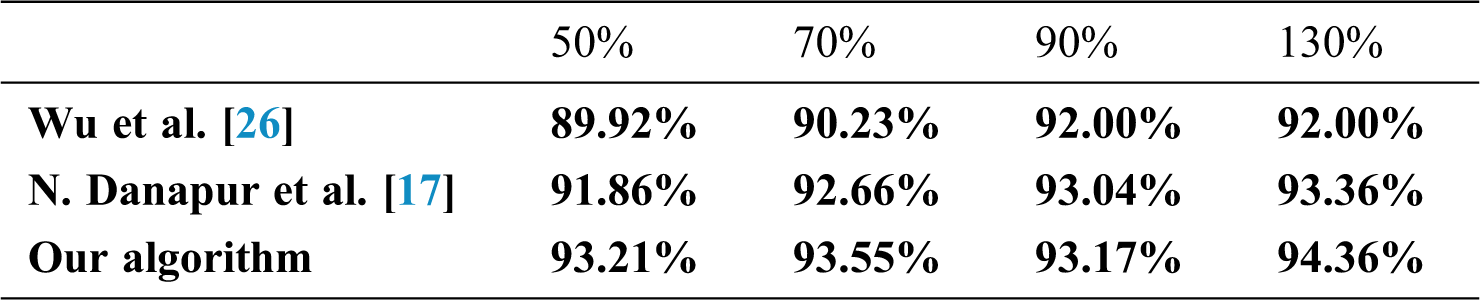
Table 4: Comparison of recognition after sample cropping
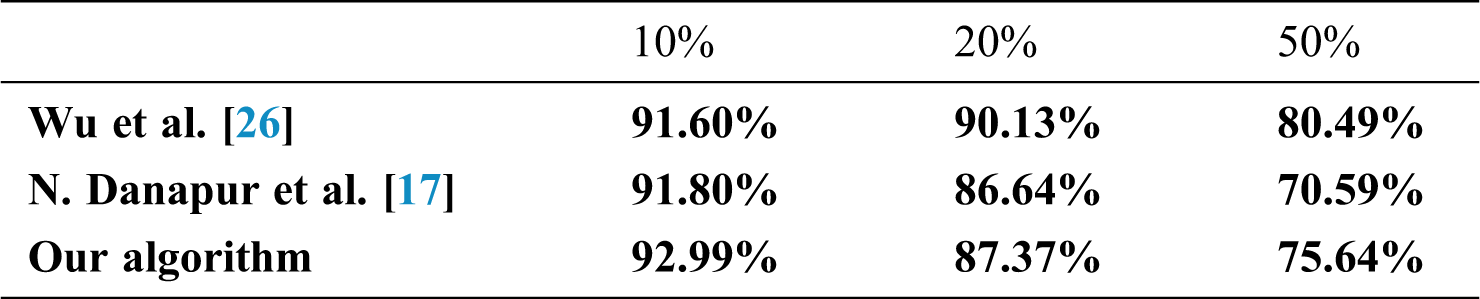
Table 5: Comparison of recognition after sample illumination angle change
An algorithm for holographic diffraction label recognition using a complementary double tensor is proposed. First, an approach is proposed to generate the HOG feature tensor that combines the HSV tensor of the original data to obtain the double tensor. Then, the double tensor is decomposed using HOSVD to obtain the double tensor decomposition matrix. Finally, typical correlation analysis is used to calculate the similarity between the decomposition matrices. The similarity of the decomposition matrix is fused according to different recognition capabilities, and the similarity vectors are projected to a PCA sub-space for classification. The algorithm makes up for the deficiency of the original data tensor, improves recognition rate, does not require advanced training process, and has high computational efficiency. The experimental results have shown that the double tensor fusion algorithm is capable of performing efficient recognition for holographic diffraction labels.
Acknowledgement: We thank the anonymous reviewers and editors for their very constructive comments.
Funding Statement: This work was mainly supported by Public Welfare Technology and Industry Project of Zhejiang Provincial Science Technology Department. (No. LGG18F020013, No. LGG19F020016, LGF21F020006).
Conflicts of Interest: The authors declare that they have no conflicts of interest to report regarding the present study.
1. L. D. Lathauwer, D. M. Bart and J. Vandewalle, “A multilinear singular value decomposition,” SIAM Journal on Matrix Analysis and Applications, vol. 21, no. 4, pp. 1253–1278, 2000. [Google Scholar]
2. L. Geng, C. Cui, Q. Guo, S. Niu, G. Zhang et al., “Robust core tensor dictionary learning with modified gaussian mixture model for multispectral image restoration,” Computers, Materials & Continua, vol. 65, no. 1, pp. 913–928, 2020. [Google Scholar]
3. L. T. Thanh and D. N. H. Thanh, “An adaptive local thresholding roads segmentation method for satellite aerial images with normalized HSV and LAB color models,” Intelligent Computing in Engineering. Singapore: Springer, pp. 865–872, 2020. [Google Scholar]
4. L. R. Tucker, “Some mathematical notes on three-mode factor analysis,” Psychometrika, vol. 31, no. 3, pp. 279–311, 1966. [Google Scholar]
5. X. Y. Zhang, Y. Xin and C. Lawrence, “Nonlocal low-rank tensor factor analysis for image restoration,” in Proc. IEEE Conf. on Computer Vision and Pattern Recognition, Utah, USA: Salt Lake City, pp. 8232–8241, 2018. [Google Scholar]
6. P. Roy, B. Parabattina and D. Pradip, “Gender detection from human voice using tensor analysis,” in Proc. SLTU & CCURL, Marseille, France, pp. 211–217, 2020. [Google Scholar]
7. B. Wang and P. Zhao, “An adaptive image watermarking method combining SVD and wang-landau sampling in DWT domain,” Mathematics, vol. 8, no. 5, pp. 691, 2020. [Google Scholar]
8. O. A. Malik and S. Becker, “Low-rank tucker decomposition of large tensors using tensorsketch,” Advances in Neural Information Processing Systems, vol. 31, pp. 10096–10106, 2018. [Google Scholar]
9. M. A. O. Vasilescu and D. Terzopoulos, “ Multilinear subspace analysis of image ensembles,” in Proc. IEEE Conf. on Computer Vision and Pattern Recognition, Madison, Wisconsin, USA, pp. II–93, 2003. [Google Scholar]
10. L. Feng, Y. Liu, L. Chen, X. Zhang and C. Zhu, “Robust block tensor principal component analysis,” Signal Processing, vol. 166, no. 13, pp. 107271, 2020. [Google Scholar]
11. D. Cai, X. F. He and J. W. Han, Subspace Learning Based on Tensor Analysis. 2005. [Online]. Available at: http://hdl.handle.net/2142/11025. [Google Scholar]
12. D. T. Tran, M. Gabbouj and A. Iosifidis, “Multilinear class-specific discriminant analysis,” Pattern Recognition Letters, vol. 100, pp. 131–136, 2017. [Google Scholar]
13. E. Stoudenmire and D. J. Schwab, “Supervised learning with tensor networks,” Advances in Neural Information Processing Systems, vol. 29, pp. 4799–4807, 2016. [Google Scholar]
14. J. Hagemann and T. Salditt, “The fluence-resolution relationship in holographic and coherent diffractive imaging,” Journal of Applied Crystallography, vol. 50, no. 2, pp. 531–538, 2017. [Google Scholar]
15. R. Y. Chen, L. L. Pan, Y. Zhou and Q. H. Lei, “Image retrieval based on deep feature extraction and reduction with improved CNN and PCA,” Journal of Information Hiding and Privacy Protection, vol. 2, no. 2, pp. 67–76, 2020. [Google Scholar]
16. S. Bakheet, “An SVM framework for malignant melanoma detection based on optimized HOG features,” Computation, vol. 5, no. 4, pp. 4–17, 2017. [Google Scholar]
17. N. Danapur, S. A. A. Dizaj and V. Rostami, “An efficient image retrieval based on an integration of HSV, RLBP, and CENTRIST features using ensemble classifier learning,” Multimedia Tools and Applications, vol. 79, no. 33, pp. 24463–24486, 2020. [Google Scholar]
18. Y. Wang, X. Zhu and B. Wu, “Automatic detection of individual oil palm trees from UAV images using HOG features and an SVM classifier,” International Journal of Remote Sensing, vol. 40, no. 19, pp. 7356–7370, 2019. [Google Scholar]
19. N. Jayashree and R. S. Bhuvaneswaran, “A robust image watermarking scheme using z-transform, discrete wavelet transform and bidiagonal singular value decomposition,” Computers, Materials & Continua, vol. 58, no. 1, pp. 263–285, 2019. [Google Scholar]
20. L. L. Liu and X. H. Liang, “QR code image correction based on improved canny operator and Hough transform,” Electronic Design Engineering, vol. 25, no. 19, pp. 183–186, 2017. [Google Scholar]
21. W. Ma, J. Qin, X. Xiang, Y. Tan, Y. Luo et al., “Adaptive median filtering algorithm based on divide and conquer and its application in captcha recognition,” Computers, Materials & Continua, vol. 58, no. 3, pp. 665–677, 2019. [Google Scholar]
22. T. Vo, D. Tran, W. Ma and K. Nguyen, “Improved hog descriptors in image classification with CP decomposition,” in Proc. ICNIP, Berlin, Heidelberg, Germany, pp. 384–391, 2013. [Google Scholar]
23. T. K. Kim and R. Cipolla, “Canonical correlation analysis of video volume tensors for action categorization and detection,” in Proc. IEEE Conf. on Computer Vision and Pattern Recognition, Anchorage, Alaska, USA, pp. 1415–1428, 2008. [Google Scholar]
24. T. K. Kim, S. F. Wong and R. Cipolla, “Tensor canonical correlation analysis for action classification,” in Proc. IEEE Conf. on Computer Vision and Pattern Recognition, Minneapolis, Minnesota, USA, pp. 1–8, 2007. [Google Scholar]
25. A. Ross and A. K. Jain, “Information fusion in biometrics,” Pattern Recognition Letters, vol. 24, no. 13, pp. 2115–2125, 2003. [Google Scholar]
26. T. Wu, X. Li, B. Wang, J. Yu, P. Li et al., “A classification algorithm for hologram label based on improved sift features,” in Proc. ISPACS, Xiamen, Fujian, China, pp. 257–260, 2017. [Google Scholar]
 | This work is licensed under a Creative Commons Attribution 4.0 International License, which permits unrestricted use, distribution, and reproduction in any medium, provided the original work is properly cited. |