DOI:10.32604/csse.2021.017191
| Computer Systems Science & Engineering DOI:10.32604/csse.2021.017191 | |
| Article |
COVID-19 Automatic Detection Using Deep Learning
1National Advanced IPv6 Centre of Excellence (Nav6), Universiti Sains Malaysia, 11800 USM, Penang, Malaysia
2Computer Science Department, Northern Border University (NBU), 9280 NBU, Ar’ar, the Kingdom of Saudi Arabia
*Corresponding Author: Yousef Sanjalawe, Email: yousefsinjlawi@gmail.com
Received: 21 January 2021; Accepted: 24 February 2021
Abstract: The novel coronavirus disease 2019 (COVID-19) is a pandemic disease that is currently affecting over 200 countries around the world and impacting billions of people. The first step to mitigate and control its spread is to identify and isolate the infected people. But, because of the lack of reverse transcription polymerase chain reaction (RT-CPR) tests, it is important to discover suspected COVID-19 cases as early as possible, such as by scan analysis and chest X-ray by radiologists. However, chest X-ray analysis is relatively time-consuming since it requires more than 15 minutes per case. In this paper, an automated novel detection model of COVID-19 cases is proposed to perform real-time detection of COVID-19 cases. The proposed model consists of three main stages: image segmentation using Harris Hawks optimizer, synthetic image augmentation using an enhanced Wasserstein And Auxiliary Classifier Generative Adversarial Network, and image classification using Conventional Neural Network. Raw chest X-ray images datasets are used to train and test the proposed model. Experiments demonstrate that the proposed model is very efficient in the automatic detection of COVID-19 positive cases. It achieved 99.4% accuracy, 99.15% precision, 99.35% recall, 99.25% F-measure, and 98.5% specificity.
Keywords: Conventional neural network; COVID-19; deep learning; enhanced Wasserstein and auxiliary classifier; generative adversarial network; image classification; image segmentation; chest x-rays
The novel coronavirus disease 2019 (COVID-19) infection first appeared in Wuhan, China, and has speedily spread over 200 countries around the world since early 2020 [1]. The World Health Organization (WHO) has declared COVID-19 as a “Public Health Emergency of International Concern” on the 30th of January 2020 [1]. There are more than 17,918,582 confirmed COVID-19 cases with 686,703 fatalities up to 4th of August 2020. This virus severely affected several countries around the world, where the Americas are the most infected WHO region as shown below in Fig. 1.
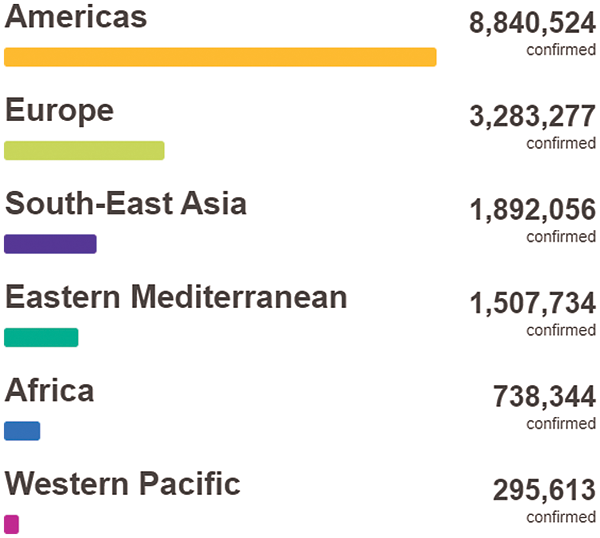
Figure 1: COVID-19 situation by WHO regions [1]
The symptoms of COVID-19 are classified into (i) specific symptoms including fever and cough, and (ii) non-specific symptoms such as fatigue, headache, and dyspnea [2–4]. However, there is an urgent need to detect the COVID-19 cases in its early stage, followed by an immediate quarantine (i.e., active) because of the lack of specific drugs and vaccines for COVID-19. At this moment, Real-time Polymerase Chain Reaction (RT-PCR) is the only way to confirm the diagnosis of COVID-19 [5]. However, RT-PCR suffers from issues such as high false-negative rate, high cost, and time-consuming [5–9]. Most importantly, the low sensitivity and accuracy of the RT-PCR test are not acceptable in the current epidemic situation. Some infected cases might not get proper treatment on time and others might be spreading COVID-19 to healthy people because of the communicable nature of this virus.
However, according to clinical reports of active cases, there is a noticeable bilateral change in chest computed tomography (CT) and X-ray images. Thus, a chest CT image could potentially be used as an alternative mechanism to detect COVID-19 infections due to high accuracy and sensitivity [4]. Chest CT images provides considerable amount of pathological information, but it requires an intensive and accurate analysis by the radiologists to obtain such pathological information from chest CT images. However, despite its advantages, CT images are not preferred over chest X-ray images because CT images are not easily accessible for COVID-19 disease diagnosis since they are always available only in main hospitals and health centers. Besides, when chest X-ray is compared to CT, the dose of radiation received by the patient is less. Therefore, there is a necessity to propose an efficient classification model to automatically detect COVID-19 from using the chest X-ray images without any intervention by radiologists.
Nowadays, there are publicly available X-rays images from positive COVID-19 cases and also from negative (i.e., healthy) cases. This allows us to analyze the medical images and obtain possible patterns, which might lead to the automatic diagnosis of the virus. The development of deep learning (DL) over the last several years looks to have appear at the right time. DL is a combination of machine learning (ML) algorithms basically focused on the automatic feature extraction and classification from images. Whilst DL applications are broadly meant for detection or/and image classification tasks. ML and DL are commonly used to analyze and extract patterns from raw data. New data is showing that the utilization of such technological advances in the clinical decision making is becoming more common [10]. DL usually refers to a mechanism wherein deep convolutional neural networks (CNNs) are used for automatic feature extraction, which is accomplished by a procedure called convolution [11]. Often, DL refers to more deep networks than the classic ML, especially when dealing with big data.
The main goal of this paper is to propose an efficient image segmentation technique based on Harris hawk’s optimizer to provide an explainable diagnosis results and to propose an accurate classification technique using an enhanced Wasserstein and auxiliary classifier generative adversarial network (EWACGAN) and conventional neural network (CNN) to automatically classify if a patient is infected with COVID-19 or not. The proposed model is trained and tested using chest X-rays images of COVID-19 cases. The comparisons between the proposed detection model with the state of arts are also drawn by considering the common classification metrics (i.e., accuracy, precision, recall, F-measure, and specificity).
The rest of this paper is organized as follows: Section 2 discusses the related works in the field of COVID-19 detection using automated systems; Section 3 provides details of the proposed technique and its stages; Section 4 analyzes the performance of the proposed technique and compares it with the state-of-art techniques; and finally, Section 5 concludes the paper.
Lately, many researchers have touched the importance of patterns on X-ray images for detecting the COVID-19 cases [12–21]. Fang et al. [13] investigated the sensitivity of RT-PCR test and X-ray images for the detection of COVID-19 disease. The travel history and symptoms of two active cases were studied and they found that the sensitivity of X-ray is much better than RT-PCR for detection of COVID-19 disease. Further, Xie et al. [12] reported that only two out of 167 patients have negative RT-PCR for COVID-19 disease. However, X-ray has better sensitivity ratio of COVID-19 detection over RT-PCR test. One the other hand, Berheim et al. [22] analyzed 121 COVID-19 infected cases by analyzing their chest CT images from four different health centers in China. The analysis results revealed that the severity of COVID-19 disease increased with time from the manifestation of COVID-19 disease symptoms.
Recently, deep learning techniques have been widely used in the detection of acute pneumonia in chest CT images [22–25]. Li et al. [23] proposed a deep learning-based model called COVNet that uses visual features extracted from chest CT images for the detection of COVID-19 disease. The extracted visual features are used to differentiate between cases of community-acquired pneumonia disease and other cases of non-pneumonia lung diseases. However, COVNet architecture is unable to classify the severity of this disease. On the other hand, Gozes et al. [24] proposed an AI-based X-ray image analysis technique for detecting COVID-19 infected cases. The technique automatically extracts a piece of opacities in the lungs. It achieves significant results in terms of sensitivity (98.2%) and specificity (92.2%). The technique performs well with pixel spacing in X-ray images and piece thicknesses as well [24]. Shan et al. [25] proposed a deep learning-based technique called VB-net for automatic segmentation using chest CT images for all lung conditions and infections. Also, Xu et al. [6] proposed a classification model to discriminate between COVID-19 disease and influenza-A viral disease using DL. The proposed technique uses the CNN model for performing classification tasks. The maximum classification accuracy obtained from the proposed classification techniques was 86.7%.
Wang et al. [7] studied the radiographic changes in the X-ray images of positive COVID-19 cases. They proposed a DL-based classification technique that uses transfer learning. The proposed technique achieves an accuracy of 89.5%, which is higher than the accuracy obtained from Xu’s technique [6] and reduces the diagnosis time. Narin et al. [9] introduced an automatic DL-based transfer technique for classifying COVID-19 disease in chest X-ray images. Different transfer learning models were used, such as Inception and ResNet, to obtain better prediction accuracy. The highest accuracy was obtained using ResNet50 at 98%, which is higher than [6,7]. Besides, Sethy et al. [8] proposed a DL-based model for the detection of COVID-19 disease from the chest X-ray images. The DL model was initially used to extract features, then the features are transferred to the support vector machine (SVM) classifier for classification. The obtained accuracy is 95.38%, which is better than [6,7]. From the aforementioned review of the related works, it is clear that the chest X-ray images can be used for early detection of COVID-19 infected cases [26]. Therefore, this paper proposed a novel DL-based prediction model, which is used to classify COVID-19 infected cases using chest X-ray images.
The proposed HHOCNN-based classification model comprises three main phases: (i) data preprocessing, (ii) E-WACGAN-based synthetic image augmentation, and (iii) CNN-based image classification. The three phases are depicted in Fig. 2 and discussed in detail in the following subsections.
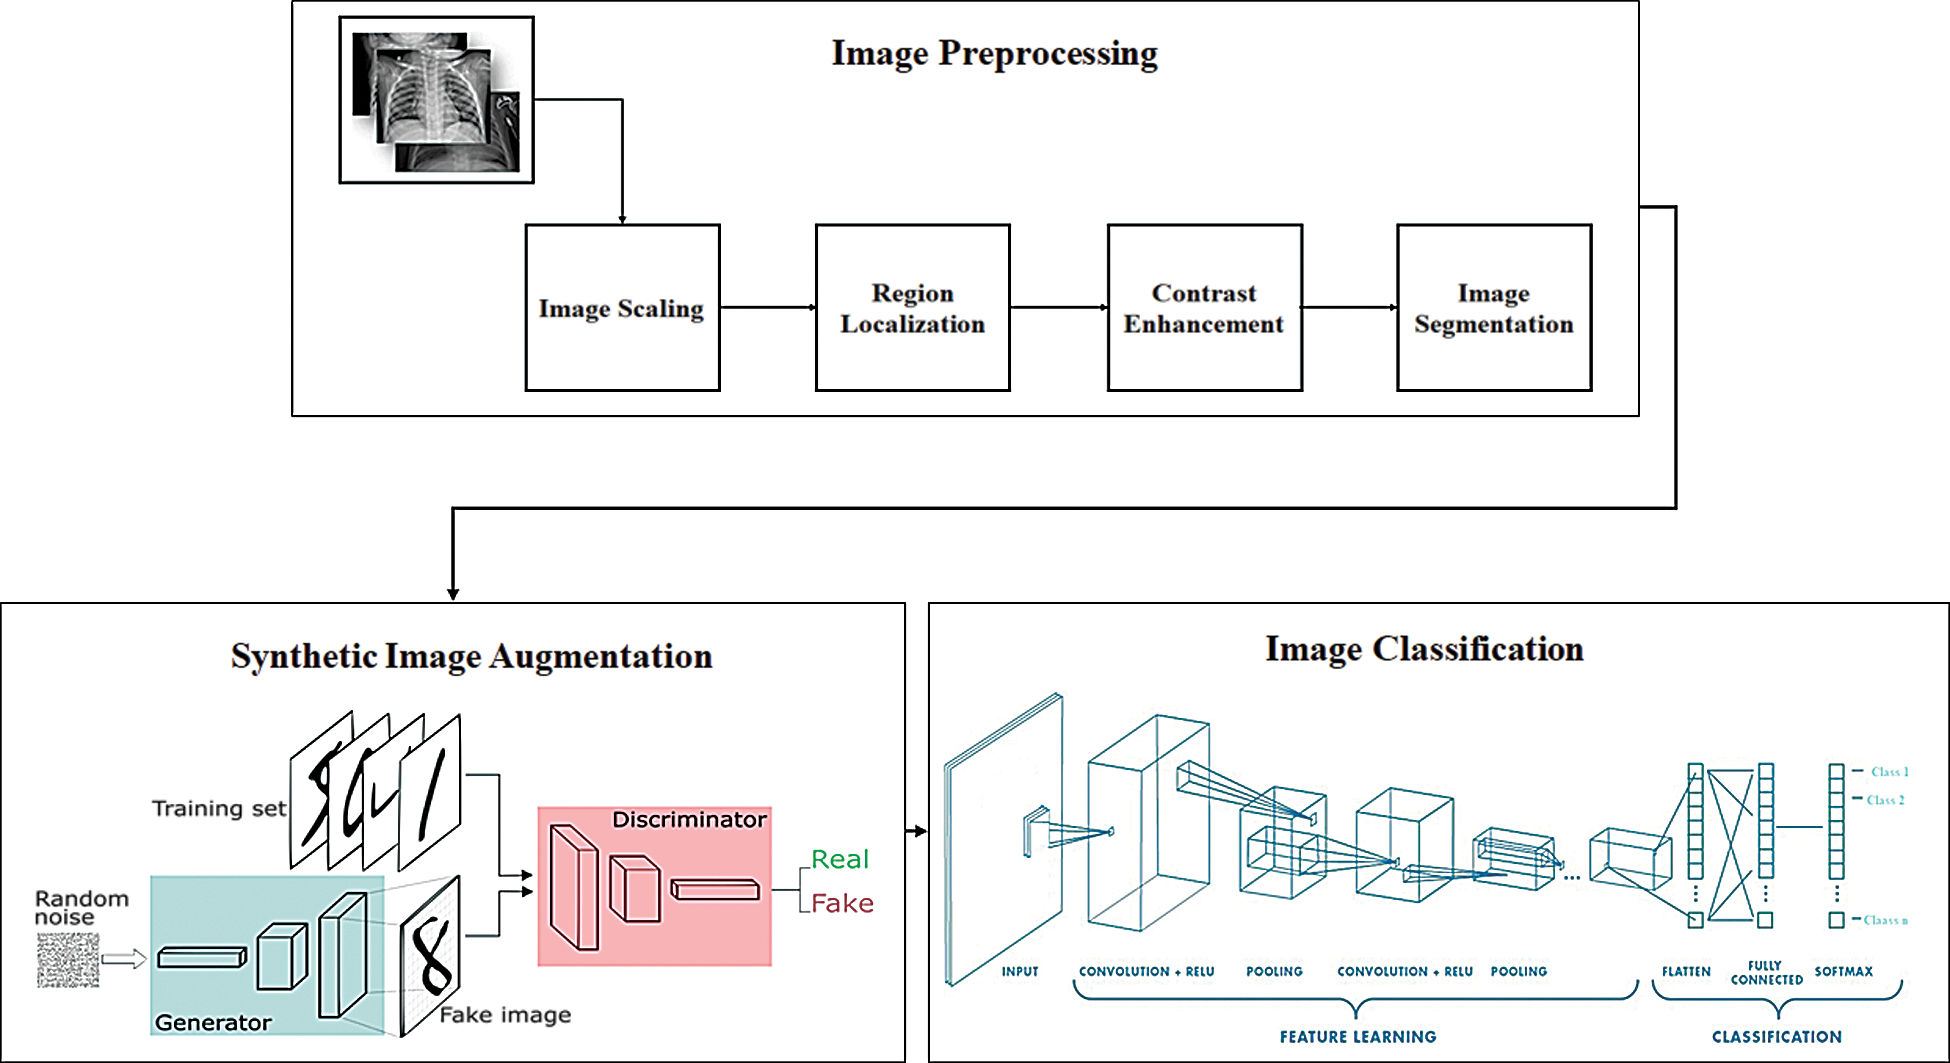
Figure 2: Architecture of proposed model
3.1 X-Ray Images Preprocessing
This section provides the details of the preprocessing steps that are followed to prepare chest X-ray images for further deep learning classification steps. Fig. 3 depicts the X-ray image preprocessing steps including image scaling, region localization, contrast enhancement, and image segmentation. These steps are discussed in detail in the following subsections.
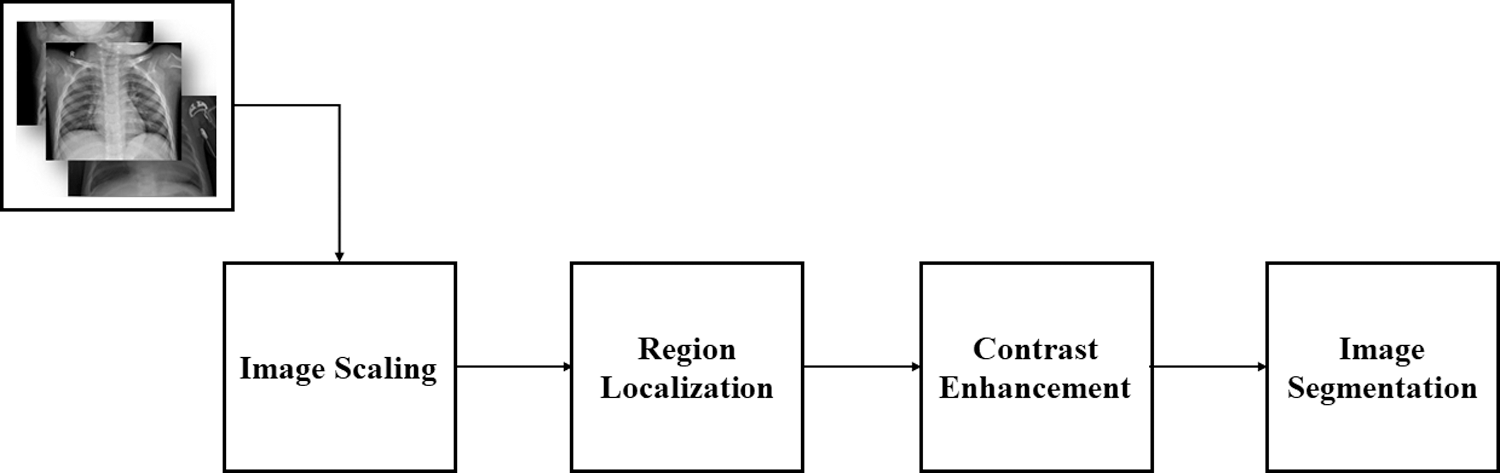
Figure 3: Steps of X-ray image preprocessing
All X-ray images in every dataset have been loaded for scaling (i.e., resizing) to a common size of 224 x 224 pixels to be more appropriate for further preprocessing steps and the DL classification. Fig. 4 presents the scaling code in Python used to resize the X-ray images, and a sample of an X-ray image after scaling.
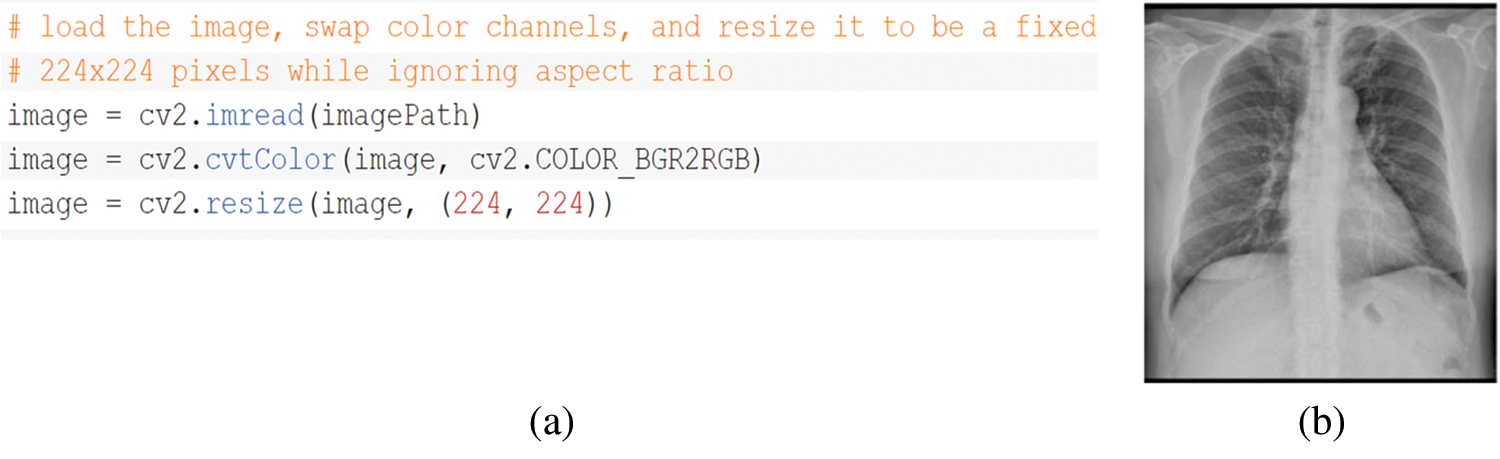
Figure 4: a) Scaling Python code; b) Sample of X-ray image after scaling
3.1.2 Region Localization (RL)
RL refers to the process of boundary estimation within any image that surround objects of interest at a coarse degree of precision. It is vital for helping experts in fast image display and analysis, and it is used in initializing an image segmentation process. For instance, with a method that can rapidly identify the object region along with a marked line passing, this region of interest might be zoomed in automatically on the display of an X-ray image even if the location and orientation of the object in the image vary appreciably. In this paper, occlusion sensitivity is used as a region localization technique [27], where this technique is a simple and straightforward technique for understanding which regions of an image are important for classification and segmentation purposes. Fig. 5 presents an example of image localization with chest X-ray image.
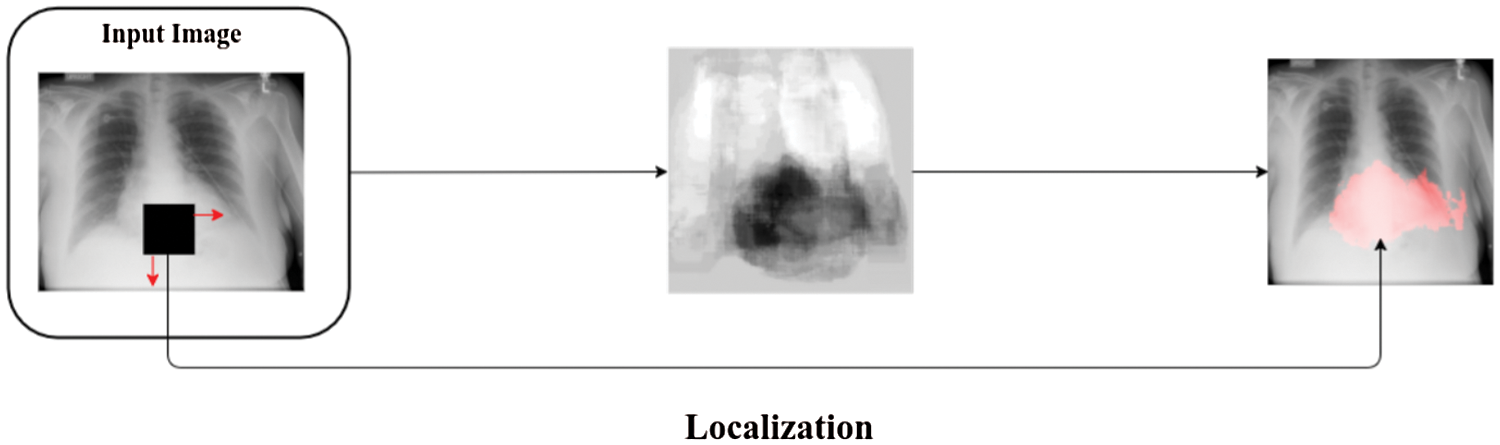
Figure 5: Example of image localization with chest X-ray image
Contrast enhancement is a significant process in image classification. Changes in lighting levels might dramatically decrease the classification performance. If a digital image has low contrast and dark, improving its contrast and brightness is preferable. The histogram equalization technique cannot correctly enhance all parts of a digital image. Once an image is irregularly illuminated, some of its details will remain too bright or too dark in resulting image. Typically, X-ray images are corrupted by noise. Thus, noise removal might enhance the visibility in X-ray images, therefore enhancing the performance of segmentation and classification processes.
However, image enhancement methods commonly amplify noise [28]. Thus, efficient noise removal is vital in getting X-ray images with higher visual quality. Herein, the idea is to improve contrast locally by considering the difference in local grey levels and mean global grey level. First, we use local adaptive contrast improvement. Local features are amplified by setting parameters and diminishing mean brightness to obtain more contrast in resulting X-ray image. Then, we applied a histogram equalization removal method [29] to get a uniform histogram for the resulting X-ray image, therefore perceiving an optimal overall contrast.
This step is one of the main contributions of this paper, herein, a Harris Hawks’ Optimization (HHO) is used to optimize the proposed multi-objective function to segment chest X-ray images efficiently. Initially, HHO is a stochastic metaheuristic algorithm proposed by Heidar in 2019 [30] to solve different optimization problems. The behavior feature of Harris hawks (HH) is that they trace (exploration), encircle, approach, and then attack the potential prey. Fig. 6 presents the main steps of HHO.
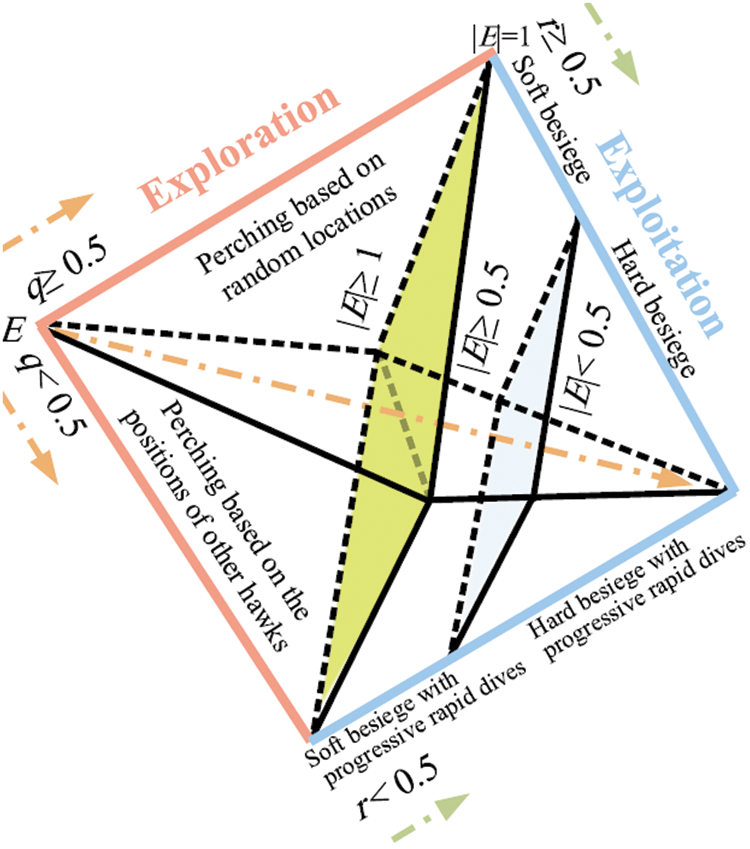
Figure 6: Stages of HHO [30]
The following subsections discuss the stages of HHO in details [30].
In this stage, HH update their current positions using two mechanisms with the same probability to be chosen. Eq. (1) is used to update HH positions and all HH have a close location to each other when attacking the prey (this equation is used if p < 0.5, where p is a random number ranging from 0 to 1). Otherwise, if p
where Y (n+1) denotes the position of hawks in the next generation. Yprey denotes the rabbit position. Yrand (n) denotes random position of hawk chosen from the current team. Z1, Z2, Z3, and Z4 are numbers chosen randomly to ensure diversification trends and to cover different regions in the allowed search space by hawks.
where Yi (n) denotes the position of each hawks in iteration n, and c denotes the total number of available hawks.
3.1.4.2 Transition from Exploration to Exploitation Stage
The HHO has the ability to switch from exploration stage to exploitation stage and then uses the escaping power of the rabbit to change exploitative behavior. This power decreased considerably during the escaping process. To model this situation, the following equation is used to compute the escaping power of a rabbit:
where M denotes the escaping power of prey, N and n denote the maximum and the current number of iterations, respectively. M0 denotes the power of prey at initial state, where this value is changing randomly in each iteration ranging from −1 to 1 (i.e., if M0 < 0, the rabbit (i.e., prey) is flagging; otherwise, it is strengthening).
In this stage, the HHs perform the surprise pounce by attacking the rabbit detected in the previous stage. However, rabbits usually try to escape from dangerous situations. Therefore, different chasing styles happen in real world. Based on the escaping behaviors of the rabbits and chasing mechanisms of the HHs, four possible mechanism are used to model the attacking stage. In this regard, the soft besiege occurs if |M|
(i) Soft Besiege
Suppose that r is a randomly generated number, where:
r =
Soft besiege occurs if and only if r
Where
Where r5 is a random number ranging from 0 to 1.
(ii) Hard Besiege
Hard besiege occurs if and only if r
(iii) Soft Besiege with Progressive Rapid Dives
This style of besiege occurs if and only if r
Then, HHs evaluate the possible result of such a position to the previous one to identify if it will be a reasonable dive or not. If it is not reasonable, they start to do irregular and fast dive when approaching the prey. In this situation, HHs will dive using the LF-based patterns as described in the following equation:
Where Z denotes the problem dimension, W is a random vector. LF(D) is a flight function computed using the following equation:
Where s and v are random numbers ranging from 0 to 1, β is a constant number set to 1.5, and
Therefore, the final mechanism for updating the positions of HHs in the soft besiege phase can be computed using the following equation.
(iv) Hard Besiege with Progressive Rapid Dives
Last, this besiege situation occurs if and only if r
where values of X and Z are computed in the following equations, respectively:
where
To summarize, Fig. 7 presents the pseudo code of the HH Algorithm.
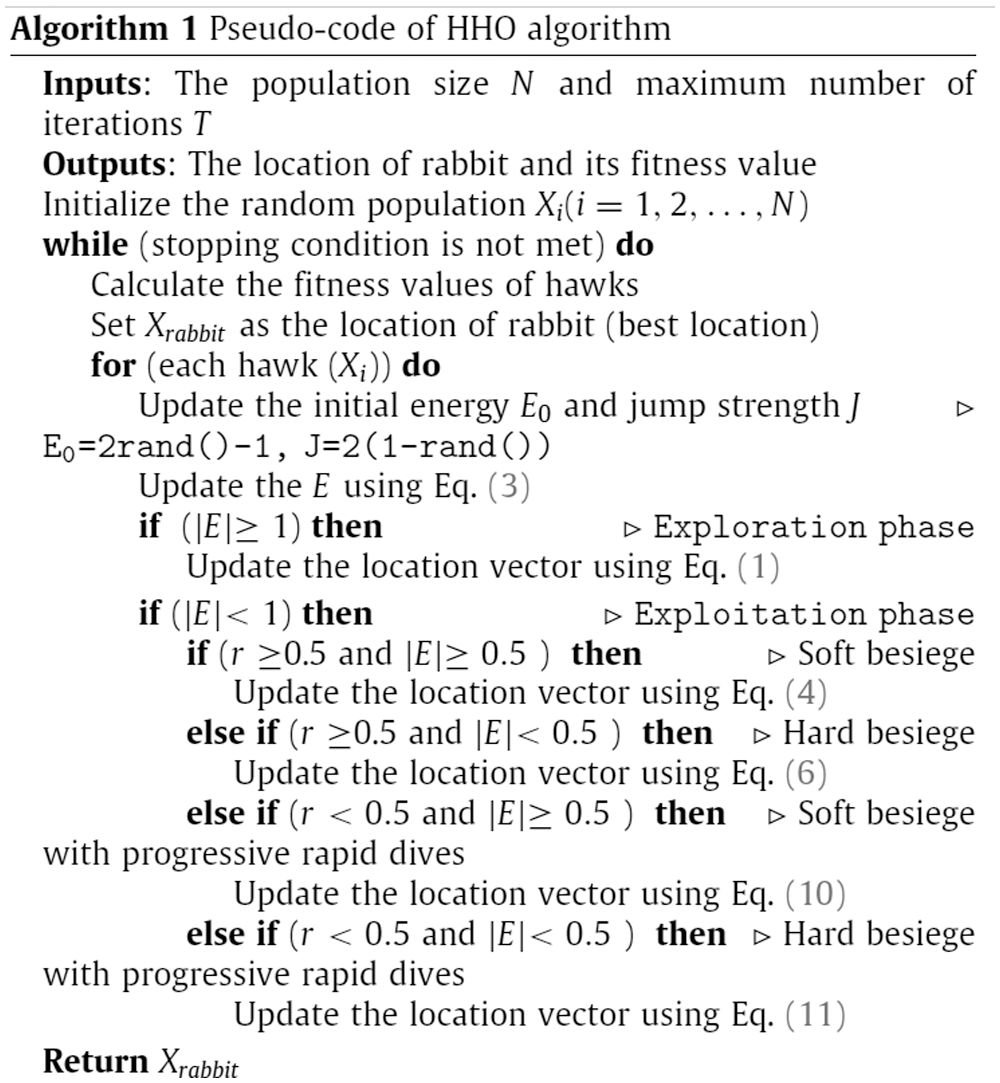
Figure 7: Pseudocode of original HHO [30]
In this paper, HHO is used to minimize the value of cross-entropy (CE) function. HHO is selected in this paper because it is a new optimization algorithm that provides solutions with high and superior quality for different research problems [30]. In this paper, HHO is used to minimize the value of cross-entropy (CE) function. CE was first proposed by Kullback in 1968 with the name of directed divergence [31]. It is usually used to determine the information theoretic distance among different probability distributions.
In this paper, CE function is an objective function that is optimized using HHO for finding a threshold value for bi-level thresholding of chest X-ray images. HHO is used to select the best threshold value by minimizing the value of CE function between the chest X-ray image and the thresholded image. A lower value of the CF function indicates greater homogeneity with lower uncertainty. However, CF function is adapted from [32] to obtain the optimal threshold for chest X-ray images. The value of cross entropy function is computed using Equation (18):
where thr denotes the threshold
And the segmented image is generated using the following equation:
where Iorg is the segmented X-ray image, Iorg denotes the original X-ray image, thri denotes the best segmentation threshold, and nt denotes number of thresholds.
The overall HHO-based segmentation of chest X-ray images is presented in Fig. 8 and 9 presents an example of chest X-ray image before and after the HHO-based segmentation.
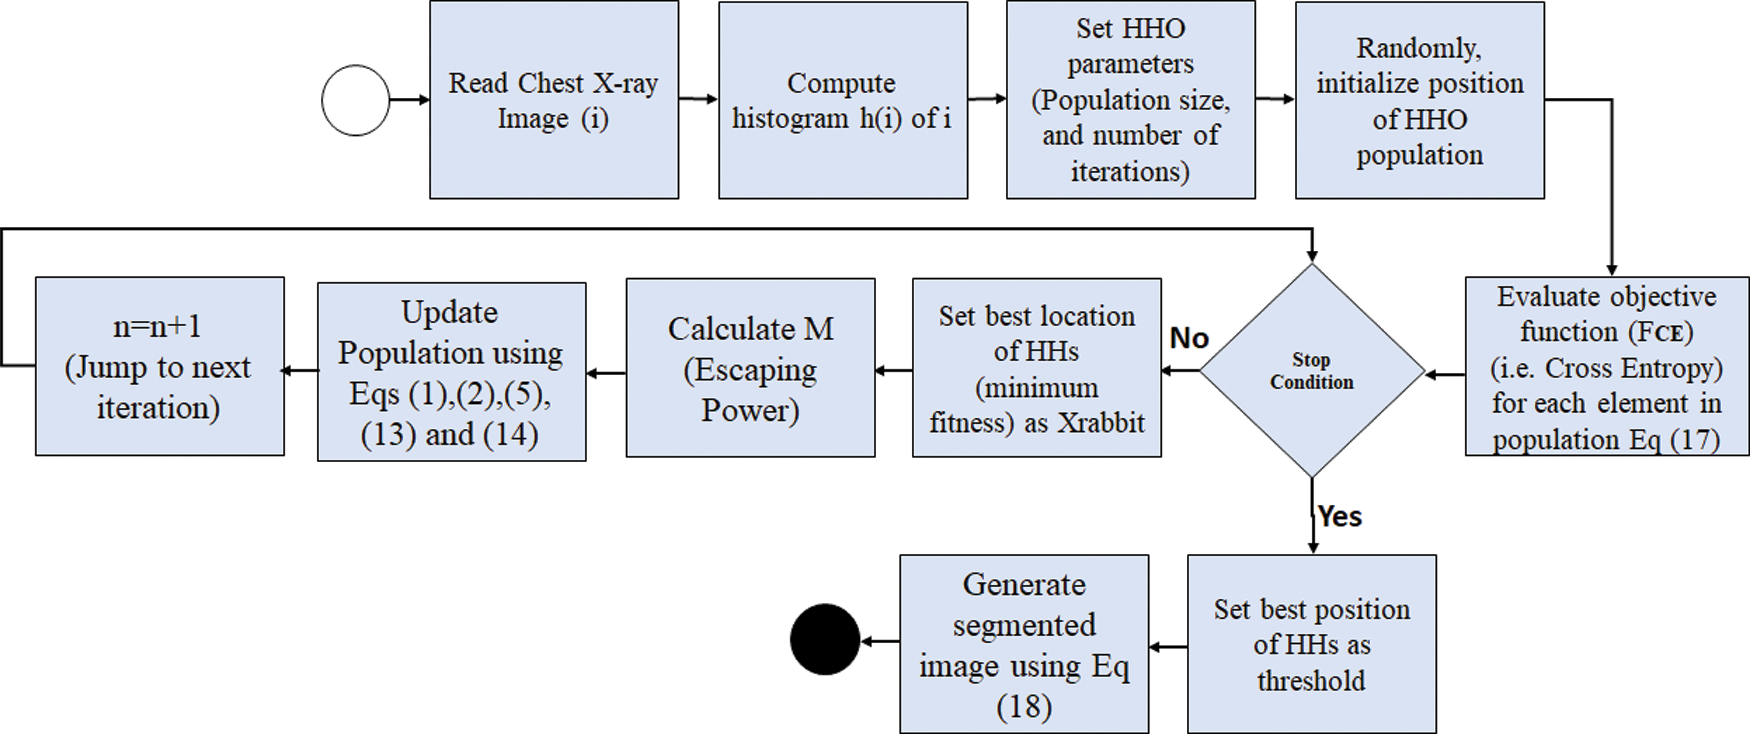
Figure 8: Flowchart of HHO-based segmentation of chest X-ray images
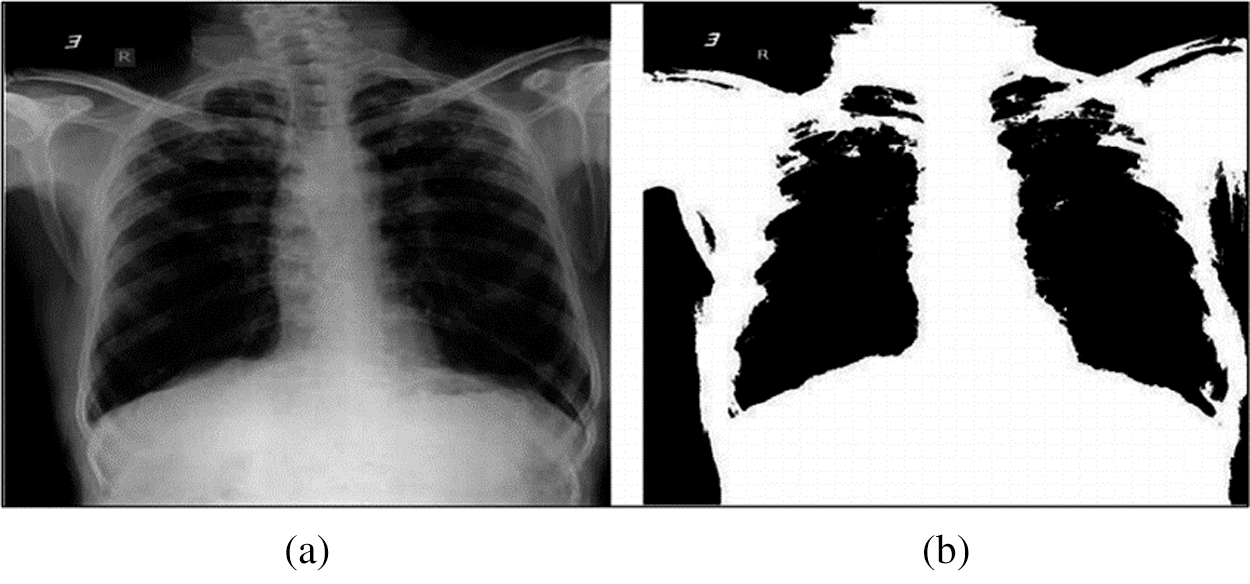
Figure 9: Example of chest X-ray image before and after HHO-based segmentation
One-hot encoding [33] is then used to label chest X-ray images to indicate the positive COVID-19 case (i.e., COVID) or “not” (i.e., normal) for image in the datasets. Where each encoded label comprises 2-elements array with one of the elements being “hot” (i.e.,1) and “not” (i.e.,0). Fig. 10 depicts the Python code used to perform the image encoding, and the format of datasets after encoding.
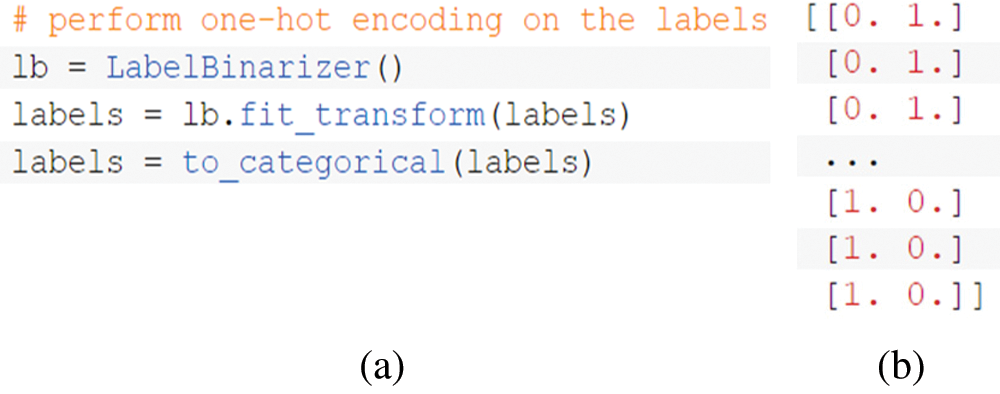
Figure 10: a) Encoding Python code; b) Format of dataset after encoding
Fig. 11 depicts the Python code used to perform data splitting (i.e., for each dataset), reserving 80% of each dataset for training and 20% for testing.
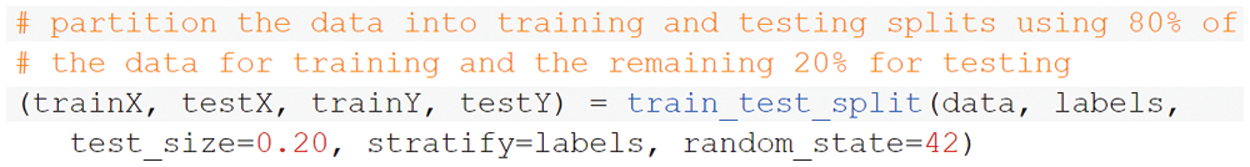
Figure 11: Python code of data splitting
The outputs of this stage are split datasets (i.e., training and testing) containing segmented chest X-ray images with its categorical labels indicating the infectious status of the person, whether he/she has been infected by COVID-19 or not. These outputs will be used as inputs for further steps in DL to be classified using CNN, which will be discussed in the following section.
3.2 Deep Learning-Based Classification
Indeed, one of the biggest challenges of the method used in detecting COVID-19 cases using chest X-ray images is the unviability of having enough reliable dataset (i.e., chest X-ray images) to be used for training and testing a COVID-19 detector. The majority of hospitals around the world are already overwhelmed in dealing with the ever-increasing cases of COVID-19. Additionally, given the issue of patients’ privacy and confidentiality of their medical history, it becomes even difficult to obtain enough reliable chest X-ray records in a timely fashion. Therefore, a synthetic image augmentation is used in this paper to enhance the performance of DL classifier.
3.3 Synthetic Image Augmentation
To enlarge the training chest X-ray datasets and improve the CNN classified results in the COVID-19 detection task, the datasets are augmented using the synthesis of new examples, which are directly learned from the datasets examples through generative models. Generative adversarial networks (GANs) have achieved noticeable success in different image generation tasks such as image-to-image translation, image super-resolution, and text-to-image synthesis [34–36]. It aims to generate further new samples derived directly from the learned dataset distributions from a set of samples.
As shown below in Fig. 12, GAN initially consists of two main elements: (i) generator that generates plausible instances to become negative training instances for the discriminator, and (ii) discriminator that learns to differentiate the fake samples from real samples [34–37]. It penalizes the generator for creating implausible results. When training starts, the generator creates an obvious fake instance, and the discriminator quickly learns to report that it is fake. As training process continues, the generator becomes closer to creating output samples that fool the discriminator. At the end, if the generator training process executes well, the discriminator will get worse at reporting the distinction between real samples and fake ones until it begins to classify fake samples as real ones.
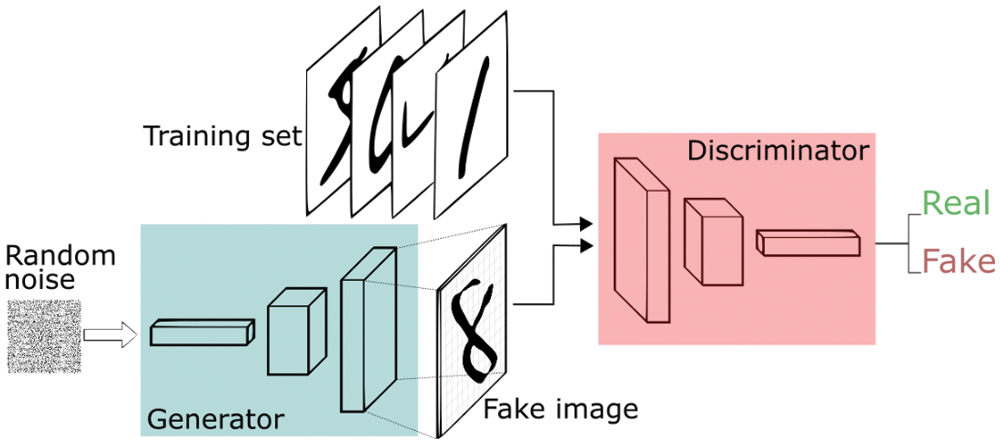
Figure 12: GAN architecture
There are many variations of GANs [38], such as ACGAN, conditional GAN (CGAN), Wasserstein GAN gradient penalty (WGAN-GP), and enhanced Wasserstein and auxiliary classifier GAN (E-WACGAN). In this paper, E-WACGAN is used to perform synthetic image augmentation because it outperforms other GAN variations in terms of modeling performance and stability [39].
Nowadays, different biomedical complications such as breast cancer detection are using AI-based detection systems [40–43]. Among the DL techniques, CNNs have shown superior results in image classification and hence explains the reason for a wide adoption by researchers [44,45]. DL on chest X-ray images is gaining popularity due to its ease of use with low cost and high performance. Many researchers [46–53] have recommended the use of DL algorithms in the classification on chest X-ray images; therefore, CNN are used in this paper to classify the chest X-ray images into COVID-19 positive or negative cases.
As shown in Fig. 13, CNN comprises three main layers [54]: (i) a convolution layer that is used to learn image features, (ii) a max-polling layer that reduces dimensionality and computational waste, and (iii) a fully connected layer that provides the network with classification capabilities.
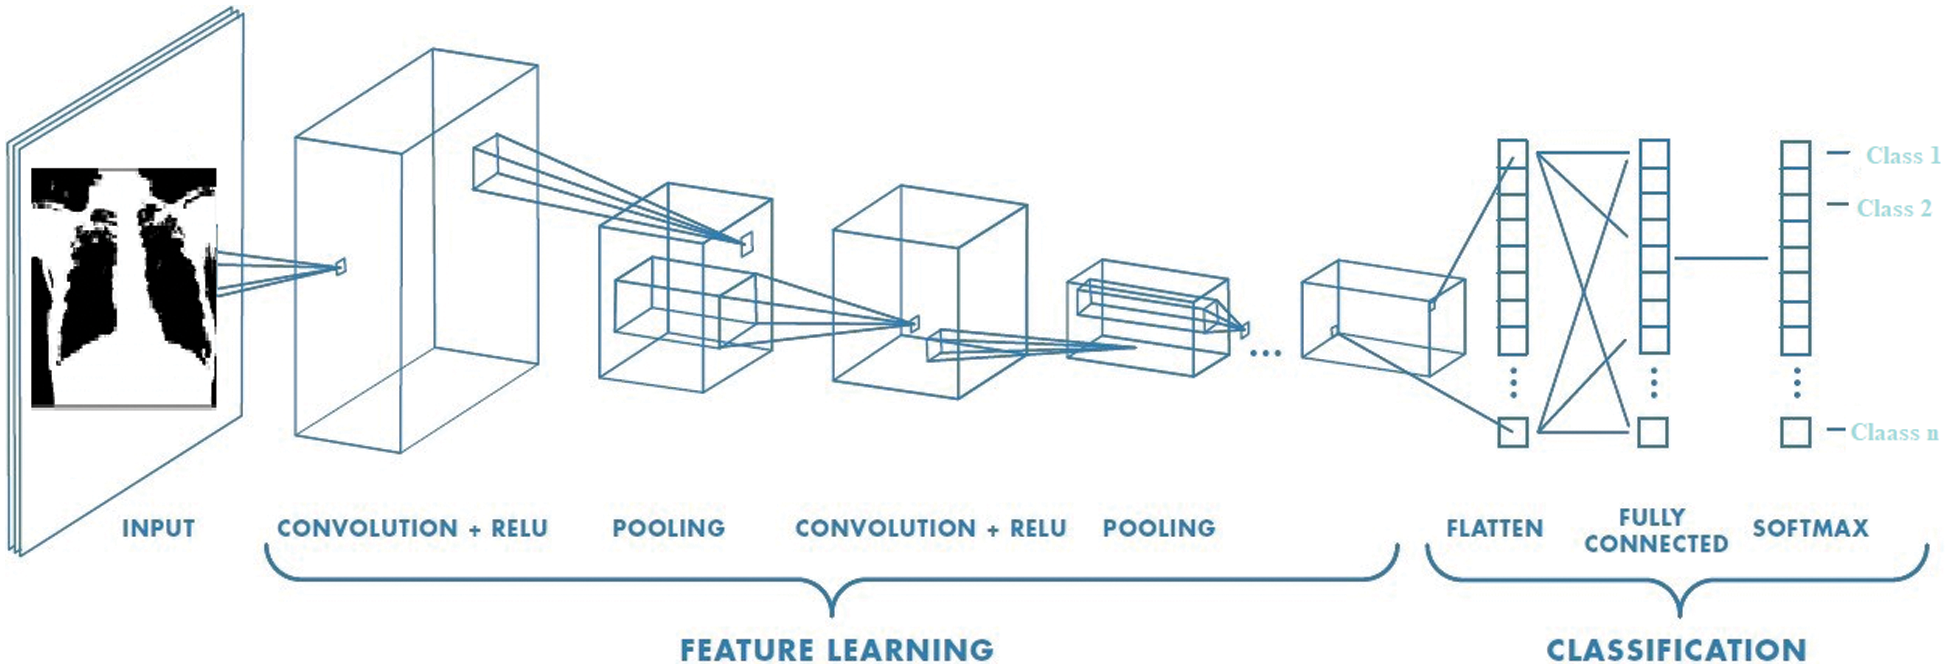
Figure 13: CNN architecture
There are many CNN architectures, such as LeNet-5, AlexNet, ZFNet, and GoogleNet. In this paper, two CNN architectures (i.e., AlexNet and ResNet) are used. AlexNet is used due to its strengths in supporting diverse internal representations and data augmentation to get an improved classification performance [55]. Fig. 14 depicts the AlexNet architecture and ResNet architecture, respectively.
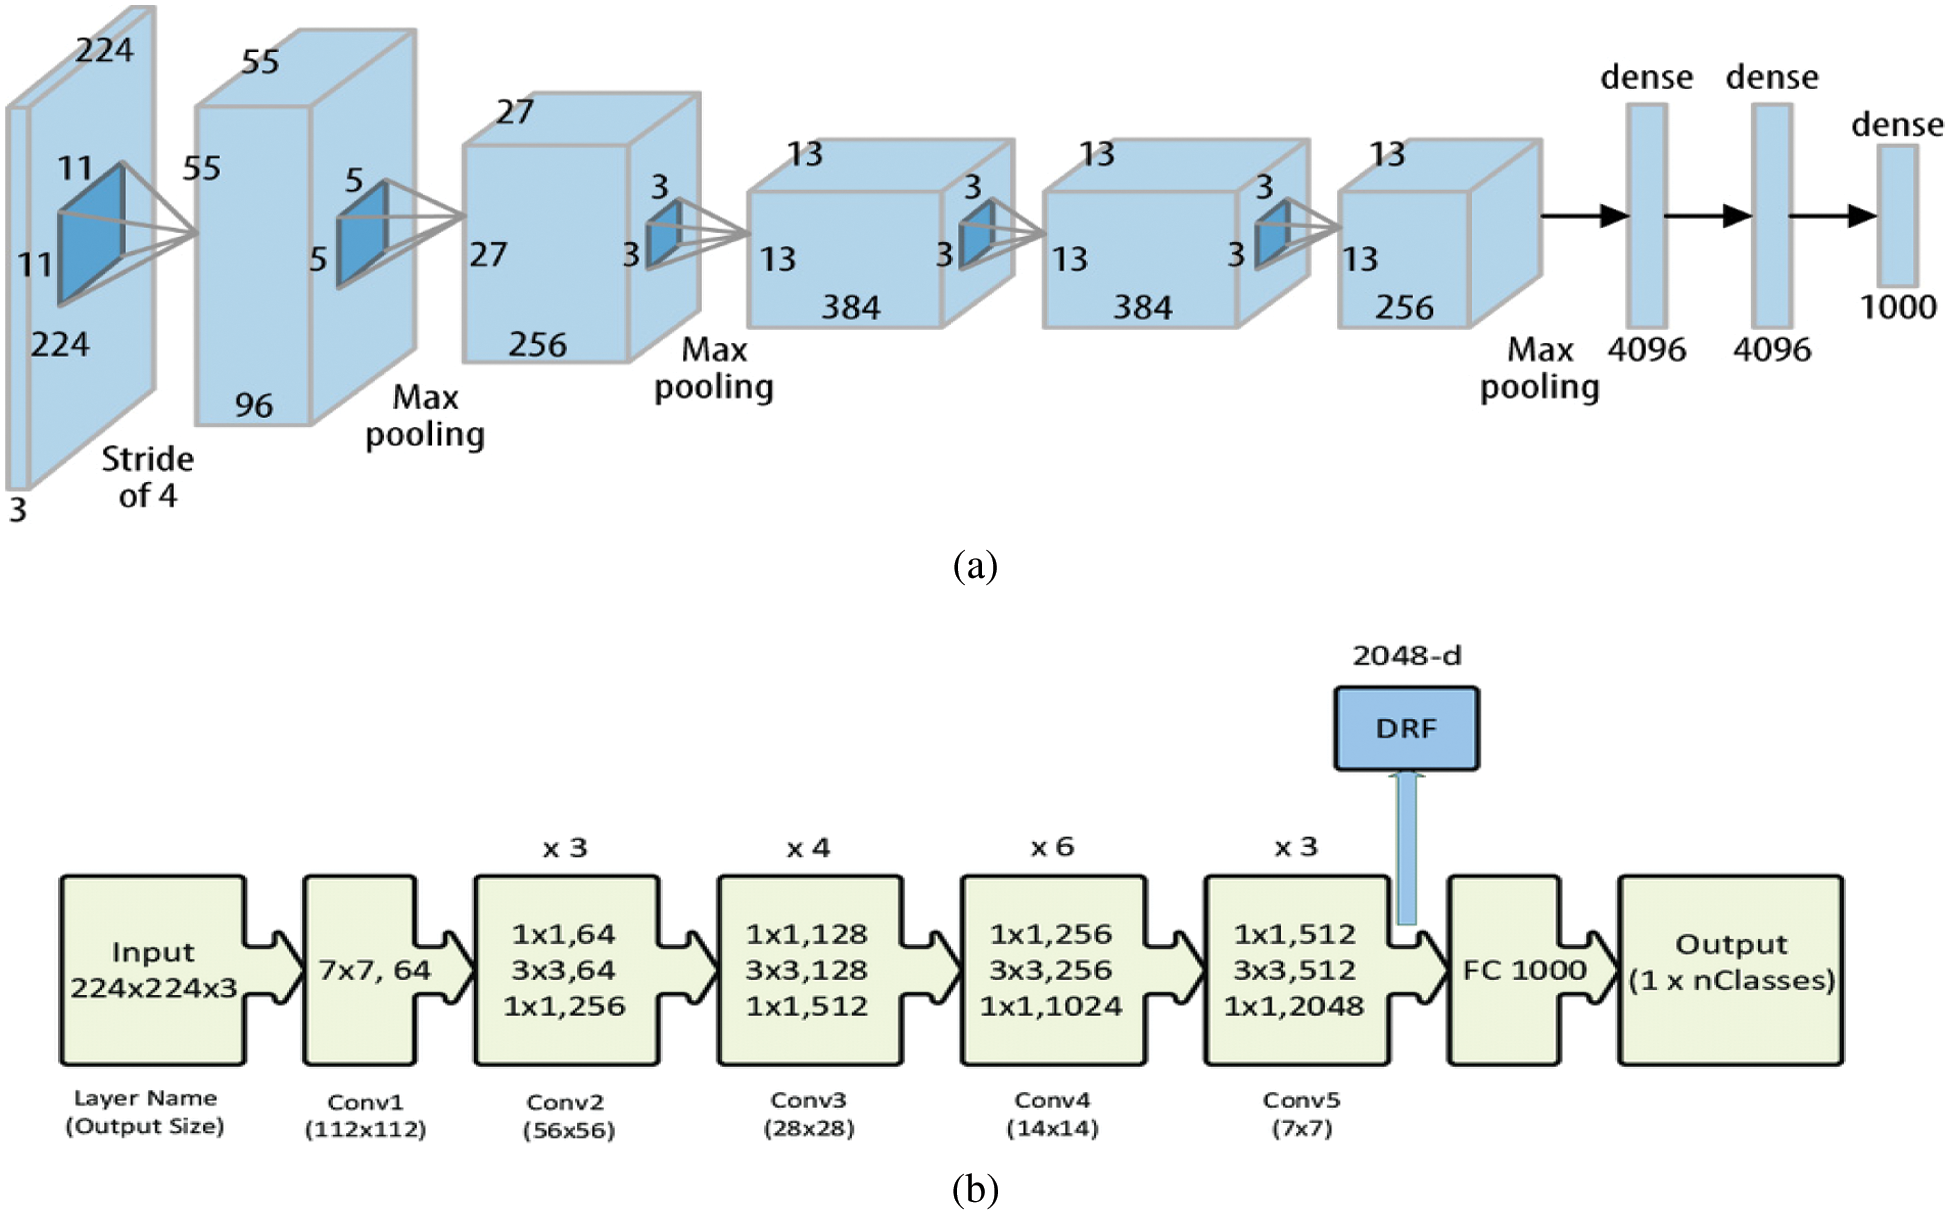
Figure 14: a) AlexNet architecture [55], b) ResNet architecture [56]
4 Experimental Results and Discussion
To evaluate the performance of the proposed technique, two different datasets are used: dataset-1 [57, 58] and dataset-2 [59, 60]. These datasets include X-ray images that are divided into two classes: (i) negative COVID-19 cases, and (ii) positive COVID-19 cases. Fig. 15 presents a sample of both classes extracted from the datasets. However, X-ray images with positive COVID-19 cases have a pattern of ground-glass opacification along with other indicators such as consolidation in the patchy areas and having a bilateral area [61].
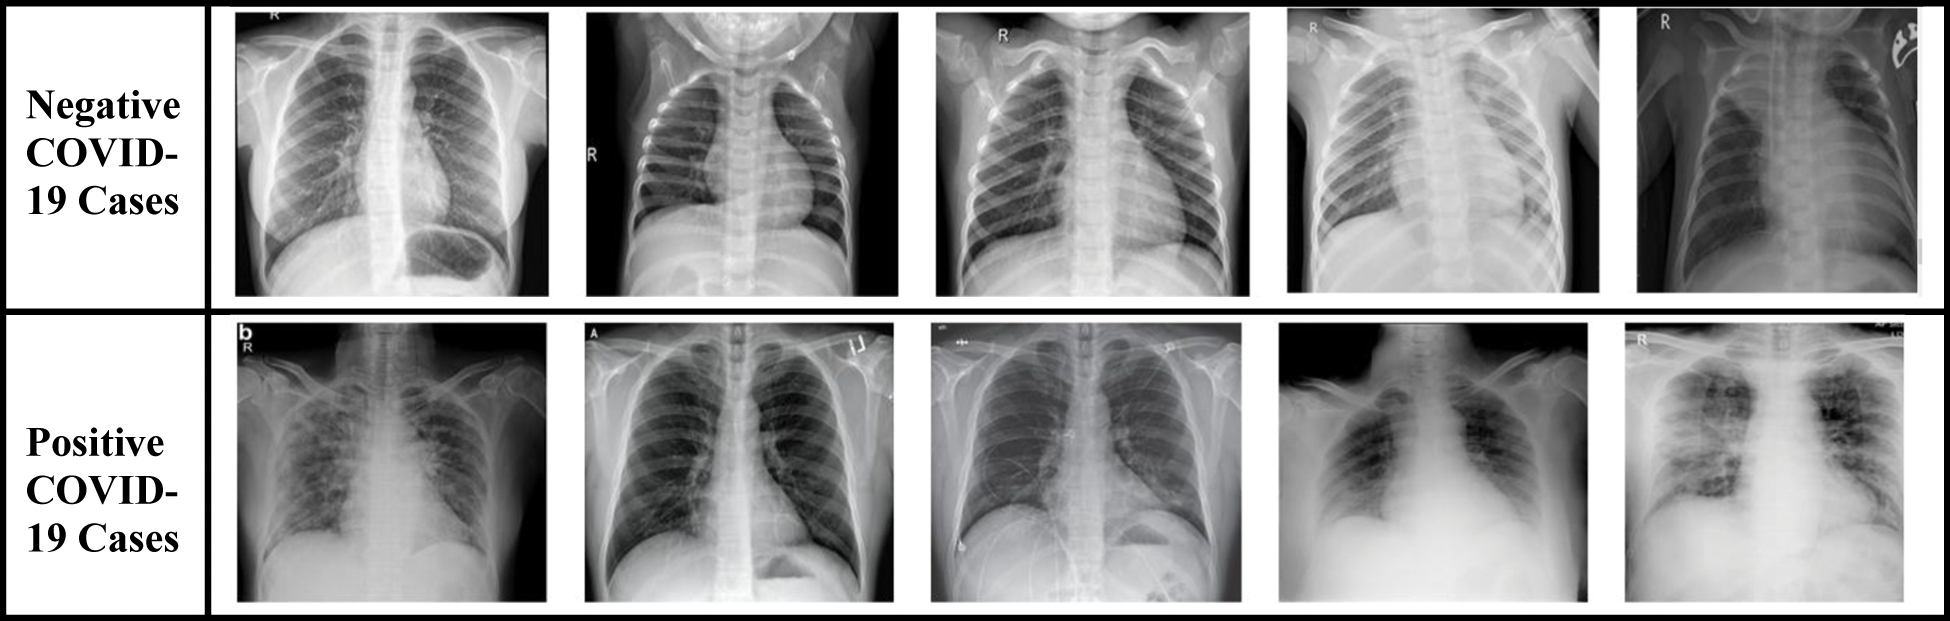
Figure 15: Sample of original chest X-ray dataset
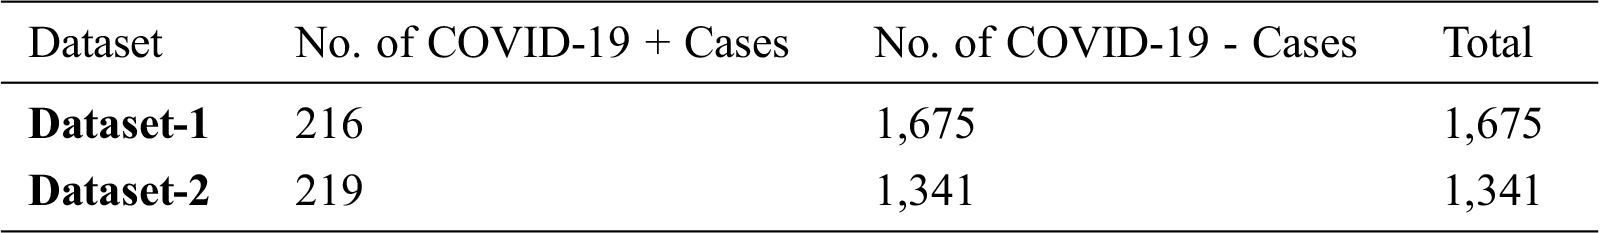
Tab. 1 illustrates the statistics of both datasets showing the total number of X-ray images and the number of images for each class (i.e., positive COVID-19 and negative COVID-19).
Table 1: Statistics of X-ray datasets
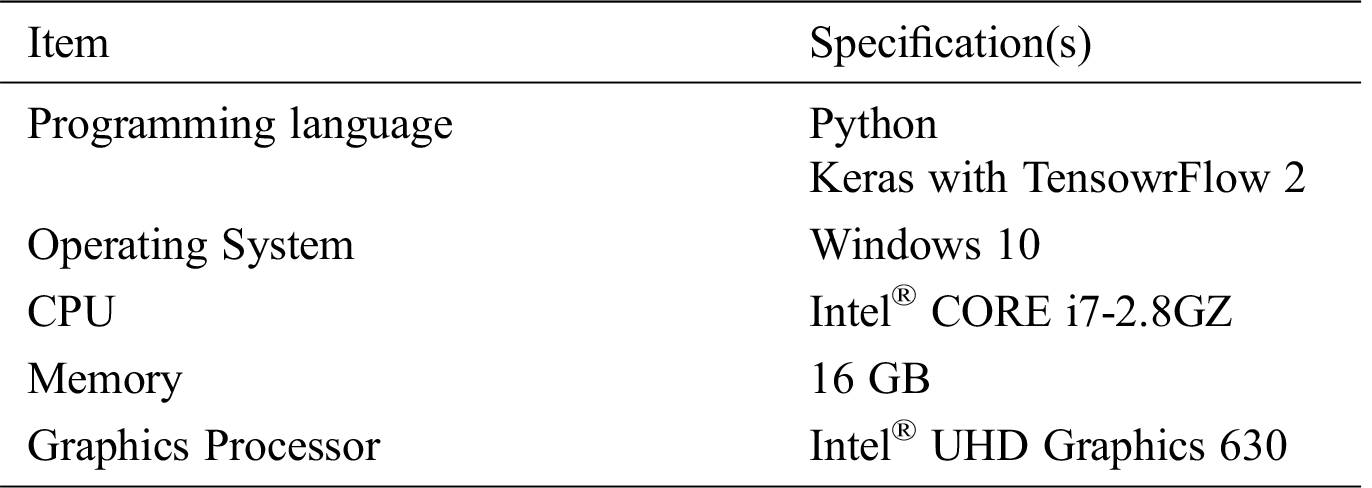
The specifications of the implementation and experimental environments used to implement and test the proposed techniques are summarized in Tab. 2.
Table 2: Implementation and experimental environment
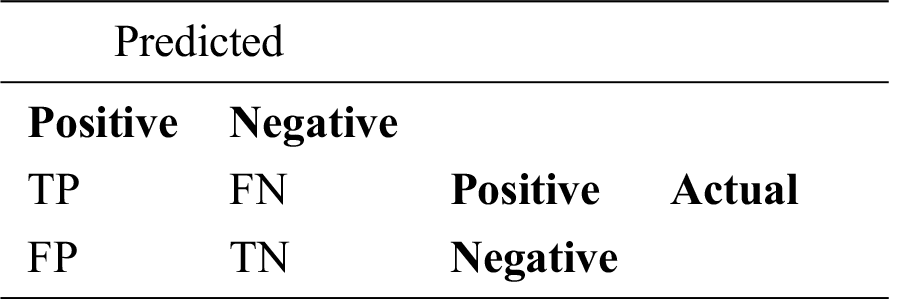
The effectiveness of the proposed technique is demonstrated using different evaluation metrics, by measuring the true and/or misclassification of COVID-19 positive/negative cases in the X-ray images (i.e., testing dataset). These metrics have been directly driven from the confusion matrix illustrated below in Tab. 3.
The following equations are used to compute the evaluation metrics used in this paper:
where (A) denotes accuracy, (P) denotes precision, (R) denotes recall, (F) denotes F-measure, (TP) denotes true positive that indicates the number of COVID-19 positive cases that has been correctly classified. (FN) denotes false negative that indicates the number of COVID-19 positive cases that has been wrongly classified as COVID-19 negative cases. (FP) denotes false positive that indicates the number of COVID-19 negative cases that are wrongly classified as COVID-19 positive cases. (TN) denotes true negative that indicates the number of COVID-19 negative cases that are correctly classified as COVID-19 negative cases.
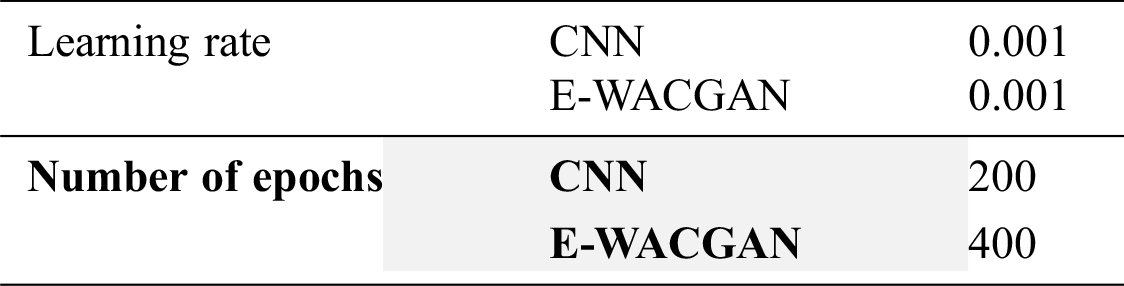
The experiments were performed to detect COVID-19 positive cases using chest X-ray images by training the HHOCNN model to detect two main classes: (i) COVID-19 positive and (ii) COVID-19 negative categories. As illustrated in Fig. 16, the performance of the HHOCNN model is assessed using the 5-fold cross-validation method. 80% of chest X-ray images were used to train the HHOCNN model and 20% for validation process, and this process was repeated five times to ensure consistency and reliability in the results. The parameter setups used to train CNN and E-WACGAN models are summarized in Tab. 4.
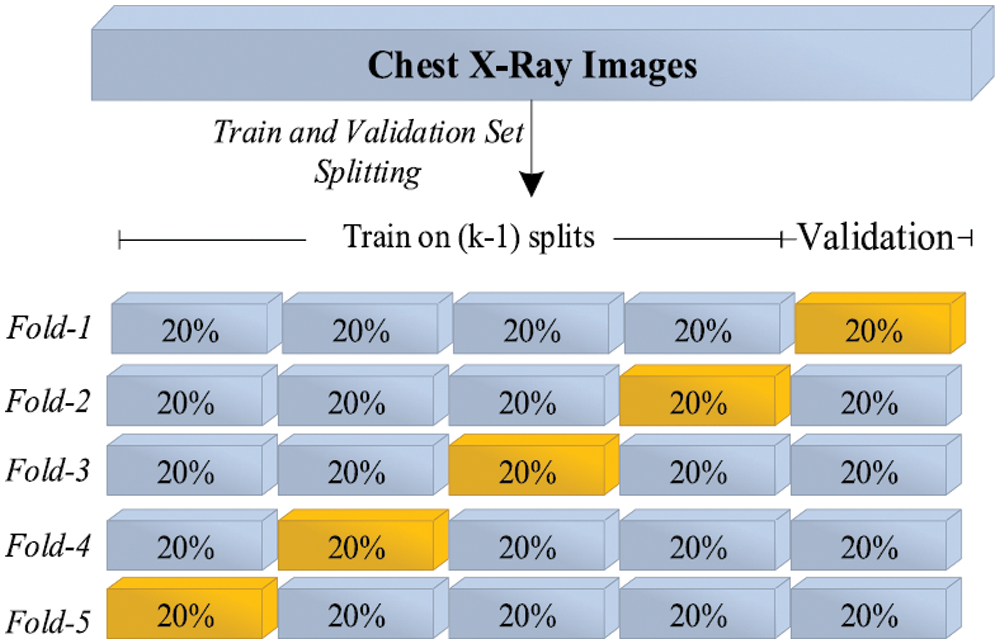
Figure 16: 5-Folds cross-validation mechanism
Table 4: Experimental parameters setup
At the early stage of CNN training, there was a significant increase in the value of training loss, but it was substantially reduced in the later epochs of the training process. The main reason behind this variation in value loss is attributed to the number of instances in the COVID-19 positive class, which is far less than the other class (i.e., COVID-19 negative). However, when the CNN model repeatedly examines all chest X-ray images again for each epoch during the training process, the increases and decreases slowly diminished in the later stages of the training process.
The performance of binary-class classification of the HHOCNN model has been assessed for each fold separately, and then the average performance of the model is computed for each metric as shown in Tab. 5.
Table 5: Experimental results of HHOCNN model
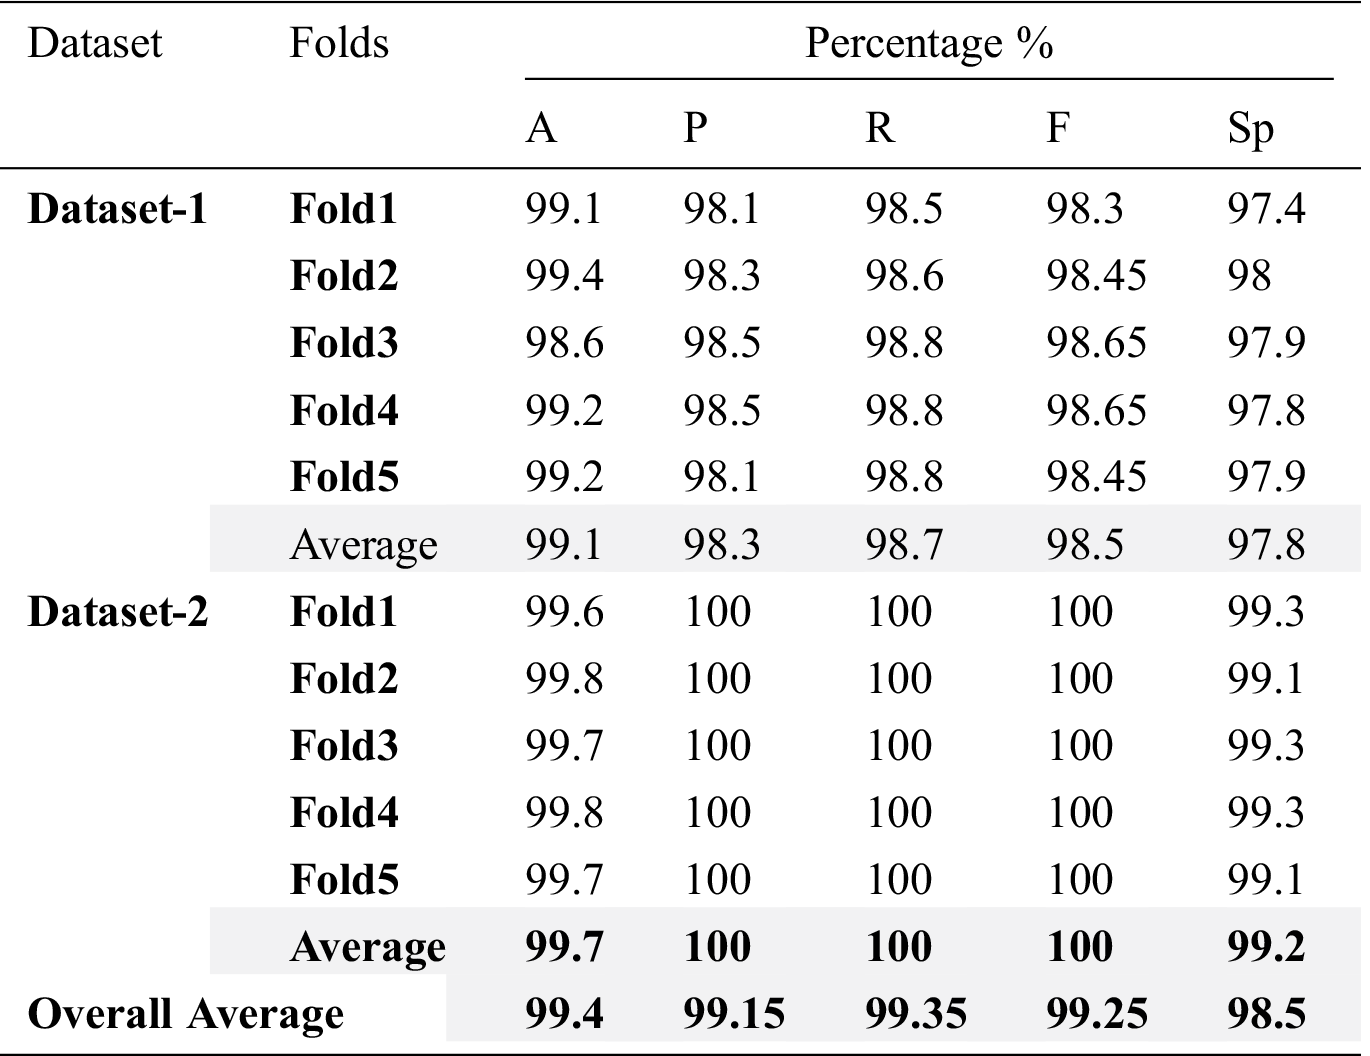
The HHOCNN model obtained an average classification accuracy of 99.1% and 99.7% for COVID-19 positive and COVID-19 negative categories on dataset-1 and dataset-2, respectively. Besides, the average values of the precision, recall, F-measure and specificity are 98.3%, 98.7%, 98.5% and 97.8%, respectively using dataset-1, and 100%, 100%, 100% and 99.2%, respectively using dataset-2. Therefore, the average of overall results obtained from HHOCNN model are: 99.4% accuracy, 99.15% precision, 99.35% recall, 99.25% F-measure and 98.5% specificity.
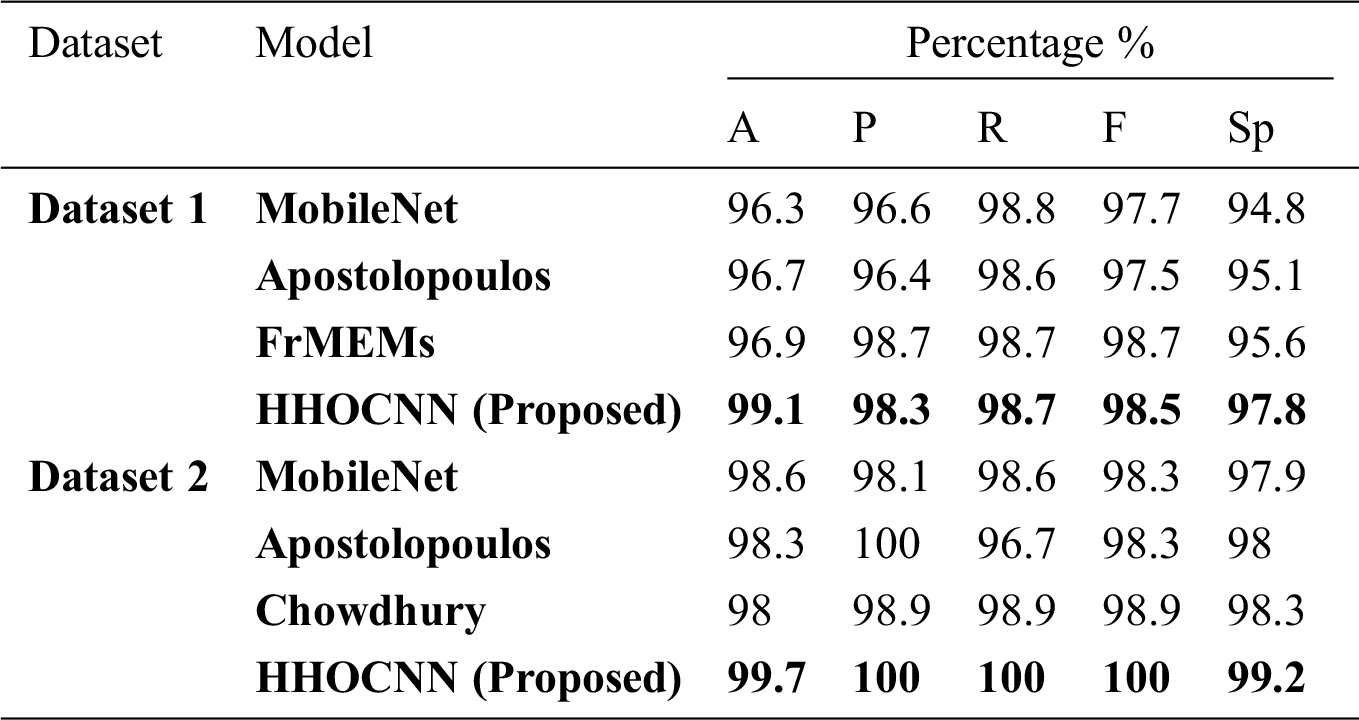
The performance of the HHOCNN model is compared to other existing models including MobileNet [62], Apostolopoulos [62], Chowdhury [59], and FrMEMs [63]. Tab. 6 summarizes the performance comparison in terms of several evaluation metrics (i.e., accuracy, precision, recall, f-measure, and specificity).
Table 6: Comparison results of HHOCNN and other models
The proposed HHOCNN model is designed to automatically detect COVID-19 using chest X-ray images without using manual feature extraction methods. The proposed model provides a second opinion to expert radiologists in hospitals and medical centers. It could significantly reduce the clinicians’ workloads and assist them in getting a more accurate decision of COVID-19 diagnosis. The HHOCNN model may save time since the COVID-19 diagnostic process is quick, therefore allows the specialists and radiologists to attend to more critical cases.
The HHOCNN model performed outstandingly in detecting COVID-19 cases using chest X-ray images. In addition to the diagnostic tests performed for the early diagnosis, radiological imaging such as X-ray images plays a vital role in the COVID-19 epidemic. Chest X-ray images might detect few characteristics in the lung related to COVID-19. DL models are sensitive in detecting COVID-19 lung involvement and therefore the diagnostic accuracy is high. In specific, this model is significant in recognizing the early stages of COVID-19 patients. Since an early diagnosis of the COVID-19 disease is important for immediate treatment and to mitigate its quick transmission, HHOCNN model can play a substantial role, especially for patients without early symptoms. Besides, it can be readily utilized in hospitals and healthcare centers. Since there is no long waiting time for the radiologists to screen the X-ray images, the healthcare employees and relatives of COVID-19 patients can focus on the seclusion of suspicious and critical cases so that treatment can start early. In sum, the spread of the disease can be significantly decreased. The COVID-19 patient may seek a second opinion if he/she is diagnosed as COVID-19 positive by the proposed model. Therefore, waiting time could also be significantly reduced, and it will relieve the workloads of clinicians and radiologists.
The proposed HHOCNN model can be used for the diagnosis of COVID-19 using X-ray images. Chest X-ray images are preferred since they are more accessible compared to other types of X-ray images in COVID-19 disease cases. They are widely used in hospitals and health centers around the world during the pandemic. The HHOCNN model can diagnose COVID-19 cases within few seconds. Besides, CT and CPR are costly process and not easily accessible since they are always located in main hospitals and health centers. Besides, chest X-ray has lower radiation dose on patients compared to CT. Therefore, it is recommended to use a DL-based COVID-19 detection model with chest X-ray images.
This paper proposes a technique to detect COVID-19 cases from chest X-ray images. Basically, after performing image segmentation using a modified Harris Hawks’ Optimization and synthetic image augmentation using an enhanced Wasserstein and auxiliary classifier generative adversarial network, the X-ray datasets of COVID-19-infected cases are decomposed into training and testing sets using 5-folds cross validation mechanism. The training dataset is used to train the COVID-19 disease classification model and other state-of arts detection models. Then, the conventional neural network is used to classify the chest X-ray images into infected or non-infected COVID-19 classes. Finally, the proposed model is compared with state-of arts detection models by using two different datasets. Extensive experiments demonstrate that the proposed technique outperforms existing techniques (i.e., MobileNet, Apostolopoulos, and FrMEMs) in terms of accuracy, precision, recall, F-measure, and specificity by 99.1%, 98.3%, 98.7%, 98.5%, and 97.8%, respectively with dataset-1. It also outperforms MobileNet, Apostolopoulos, and Chowdhury by 99.7%, 100%, 100%, 100%, and 99.2%, in terms of accuracy, precision, recall, F-measure, and specificity, respectively with dataset-2. Therefore, the proposed model is proven viable for real-time classification of COVID-19 disease using chest X-ray images.
Acknowledgement: I express my gratitude to Universiti Sains Malaysia, Malaysia and Northern Border University, Saudi Arabia, for administrative and technical support.
Conflicts of Interest: The authors declare that they have no conflicts of interest to report regarding the present study.
Funding Statement: The authors received no specific funding for this study.
1. World Health Organization, “Novel Coronavirus(2019-nCoV) Situation Report-11, August 2, 2020. [Online]. Available at: https://www.who.int/docs/defaultsource/coronaviruse/situationreports/20200131-sitrep-11-ncov. [Google Scholar]
2. Y. Zhang, “The epidemiological characteristics of an outbreak of 2019 novel coronavirus (COVID-19)-China CCDC,” Zhonghua Liuxingbingxue Zazhi, vol. 241, no. 2, pp. 145–134, 2020. [Google Scholar]
3. Z. Xie, “Pay attention to SARS-CoV-2 infection in children,” Pediatric Investigation, vol. 4, no. 1, pp. 1–4, 2020. [Google Scholar]
4. D. Wang, B. Hu and C. Hu, “Clinical characteristics of 138 hospitalized patients with 2019 novel coronavirus-infected pneumonia in Wuhan,” JAMA, vol. 323, no. 11, pp. 1061–1069, 2020. [Google Scholar]
5. T. Ali, “Correlation of chest CT and RT-PCR testing in coronavirus disease 2019 (COVID-19) in China: A report of 1014 cases,” Radiology, vol. 1, no. 14, pp. 123–134, 2020. [Google Scholar]
6. X. Xu, X. Jiang, P. Du, L. LiX, S. Lv et al., “Deep learning system to screen coronavirus disease 2019 pneumonia,” Applied Intelligence, vol. 1, no. 15, pp. 1–29, 2020. [Google Scholar]
7. S. Wang, B. Kang, J. Ma, X. Zeng, M. Xiao et al., “A deep learning algorithm using CT images to screen for corona virus disease (COVID-19),” Radiology, vol. 1, no. 23, pp. 150–162, 2020. [Google Scholar]
8. P. K. Sethy and S. K. Behera, “Detection of coronavirus disease (COVID-19) based on deep features,” Int. Journal of Mathematical, Engineering and Management Sciences, vol. 2, no. 15, pp. 212–219, 2020. [Google Scholar]
9. A. Narin, C. Kaya and Z. Pamuk, “Automatic detection of coronavirus disease (COVID-19) using x-ray images a d deep convolutional neural network,” Radiology, vol. 1, no. 23, pp. 207–219, 2020. [Google Scholar]
10. H. Greenspan, B. Van Ginneken and R. M. Summers, “Guest editorial deep learning in medical imaging: Overview and future promise of an exciting new technique,” IEEE Trans. on Medical Imaging, vol. 2, no. 25, pp. 1153–1159, 2016. [Google Scholar]
11. L. Deng and D. Yu, “Deep learning: Methods and applications,” Foundations and Trends in Signal Processing, vol. 7, no. 3-4, pp. 197–387, 2013. [Google Scholar]
12. X. Xie, Z. Zhong, W. Zhao, C. Zheng, F. Wang et al., “Chest CT for typical 2019-nCoV pneumonia: Relationship to negative RTPCR testing,” Radiology, vol. 201, no. 5, pp. 117–129, 2020. [Google Scholar]
13. Y. Fang, H. Zhang, Y. Xu, J. Xie, P. Pang et al., “CT manifestations of two cases of 2019 novel coronavirus (2019-nCoV) pneumonia,” Radiology, vol. 295, no. 1, pp. 208–209, 2020. [Google Scholar]
14. F. Song, N. Shi and F. Shan, “Emerging coronavirus 2019-nCoV pneumonia,” Radiology, vol. 295, no. 1, pp. 210–217, 2020. [Google Scholar]
15. M. Ng, E. Lee and J. Yang, “Imaging profile of the COVID-19 infection: Radiologic findings and literature review,” RadiolCardiothorac Imaging, vol. 2, no. 1, pp. 234–243, 2020. [Google Scholar]
16. W. Kong and P. Agarwal, “Chest imaging appearance of COVID-19 infection,” Radiology: Cardiothoracic Imaging, vol. 2, no. 1, pp. 12–325, 2020. [Google Scholar]
17. F. Kay and S. Abbara, “The many faces of COVID-19: Spectrum of imaging manifestations,” Radiology: Cardiothoracic Imaging, vol. 2, no. 1, pp. 367–386, 2020. [Google Scholar]
18. V. K. Venugopal, V. Mahajan, S. Rajan, V. K. Agarwal, R. Rajan et al., “A systematic meta-analysis of CT features of COVID-19: lessons from radiology,” medRxiv, 2020. [Google Scholar]
19. Y. Li, X. Zeng, B. Liu and Y. Yu, “COVID-19 infection presenting with CT halo sign,” Radiology: Cardiothoracic Imaging, vol. 2, no. 1, p. 26, 2020. [Google Scholar]
20. M. Chung, A. Bernheim and X. Mei, “CT imaging features of 2019 novel coronavirus (2019-nCoV),” Radiology, vol. 295, no. 1, pp. 202–207, 2020. [Google Scholar]
21. X. Yijiu, “China’s Hubei reports jump in new cases of COVID-19 after diagnosis criteria revision,” National Health Commission of the People’s Republic of China, vol. 5, p. 231, 2020. [Google Scholar]
22. A. Bernheim, X. Mei and M. Huang, “Chest CT findings in coronavirus disease-19 (COVID-19relationship to duration of infection,” Radiology, vol. 295, no. 3, pp. 200463–92, 2020. [Google Scholar]
23. L. Li, “Artificial intelligence distinguishes COVID-19 from community acquired pneumonia on chest CT,” Radiology, vol. 295, no. 3, pp. 155–161, 2020. [Google Scholar]
24. O. Gozes, “Rapid AI development cycle for the coronavirus (COVID-19) pandemic: Initial results for automated Detection & patient monitoring using deep learning CT image analysis,” 2020. [Online]. Available at: https://arxiv.org/abs/2003.05037. [Google Scholar]
25. F. Shan, Y. Gao, J. Wang, W. Shi, N. Shi et al., “Lung infection quantification of COVID-19 in CT images with deep learning,” 2020. [Online]. Available at: https://arxiv.org/abs/2003.04655. [Google Scholar]
26. K. C. Liu, P. Xu, W. F. Lv, X. H. Qiu, J. L. Yao et al., “CT manifestations of coronavirus disease-2019: A retrospective analysis of 73 cases by disease severity,” European Journal of Radiology, vol. 126, no. 3, pp. 56–79, 2020. [Google Scholar]
27. R. Guo, K. Passi and M. Jain, “Tuberculosis diagnostics and localization in chest x-rays via deep learning models,” Frontiers in Artificial Intelligence, vol. 3, no. 74, pp. 223, 2020. [Google Scholar]
28. S. Agaian, B. Silver and K. Panetta, “Transform coefficient histogram-based image enhancement algorithms using contrast entropy,” IEEE Trans. on Image Processing, vol. 16, no. 3, pp. 741–758, 2007. [Google Scholar]
29. B. Mohapatra and P. Panda, “Histogram equalization and noise removal process for enhancement of image,” ACCENTS Trans. on Image Proc. and Computer Vision, vol. 3, no. 9, pp. 22–25, 2017. [Google Scholar]
30. A. Heidari, S. Mirjalili, H. Faris, I. Aljarah, M. Mafarja et al., “Harris hawks’ optimization: Algorithm and applications,” Future Generation Computer Systems, vol. 97, no. 3, pp. 849–872, 2019. [Google Scholar]
31. M. Horng and R. Lio, “Multilevel minimum cross entropy threshold selection based on the firefly algorithm,” Expert Systems with Applications, vol. 38, no. 12, pp. 14805–14811, 2011. [Google Scholar]
32. P. Yin, “Yin Multilevel minimum cross entropy threshold selection based on particle swarm optimization,” Applied mathematics and computation, vol. 184, no. 2, pp. 503–513, 2007. [Google Scholar]
33. E. Hemdan, M. Shouman and M. Karar, “Covidx-net: A framework of deep learning classifiers to diagnose covid-19 in X-ray images,” Applied Intelligence, vol. 32, no. 5, pp. 1–11, 2020. [Google Scholar]
34. A. Antoniou, A. Storkey and H. Edwards, “Data augmentation generative adversarial networks,” Future Generation Computer Systems, vol. 97, no. 3, pp. 780–791, 2020. [Google Scholar]
35. F. Zhou, S. Yang, H. Fujita, D. Chen and C. Wen, “Deep learning fault diagnosis method based on global optimization GAN for unbalanced data,” Knowledge-Based Systems, vol. 41, no. 4, pp. 187–196, 2020. [Google Scholar]
36. T. Karras, S. Laine and T. Aila, “A style-based generator architecture for generative adversarial networks,” in Proc. of the IEEE Conf. on Computer Vision and Pattern Recognition, San Juan, Puerto Rico, USA, pp. 4401–4410, 2019. [Google Scholar]
37. A. Creswell, T. White, V. Dumoulin, K. Arulkumaran, B. Sengupta et al., “Generative adversarial networks: An overview,” IEEE Signal Processing Magazine, vol. 35, no. 1, pp. 53–65, 2018. [Google Scholar]
38. Q. Jin, R. Lin and F. Yang, “E-WACGAN: Enhanced generative model of signaling data based on WGAN-GP and ACGAN,” IEEE Systems Journal, vol. 15, no. 3, pp. 120–134, 2019. [Google Scholar]
39. I. Gulrajani, F. Ahmed, M. Arjovsky, V. Dumoulin and A. Courville, “Improved training of Wasserstein GANs,” Advances in Neural Information Processing Systems, vol. 15, no. 2, pp. 5767–5777, 2017. [Google Scholar]
40. A. Tahir, M. Chowdhury, A. Khandakar, S. Al-Hamouz, M. Abdalla et al., “A systematic approach to the design and characterization of a smart insole for detecting vertical ground reaction force (VGRF) in gait analysis,” Sensors, vol. 20, no. 4, pp. 957–962, 2020. [Google Scholar]
41. M. Chowdhury, K. Alzoubi, A. Khandakar, R. Khallifa, R. Abouhasera et al., “Wearable real-time heart attack detection and warning system to reduce road accidents,” Sensors, vol. 19, no. 12, pp. 2780–2791, 2019. [Google Scholar]
42. M. Chowdhury, A. Khandakar, K. Alzoubi, S. Mansoor, A. Tahir et al., “Real-time smart-digital stethoscope system for heart diseases monitoring,” Sensors, vol. 19, no. 12, pp. 2781–2791, 2019. [Google Scholar]
43. K. Kallianos, J. Mongan, S. Antani, T. Henry, A. Taylor et al., “How far have we come? Artificial intelligence for chest radiograph interpretation,” Clinical Radiology, vol. 74, no. 5, pp. 338–345, 2019. [Google Scholar]
44. H. Guo, J. Liu, Z. Xiao and L. Xiao, “Deep CNN-based hyperspectral image classification using discriminative multiple spatial-spectral feature fusion,” Remote Sensing Letters, vol. 11, no. 9, pp. 827–836, 2020. [Google Scholar]
45. A. Krizhevsky, I. Sutskever and G. Hinton, “ImageNet classification with deep convolutional neural networks,” Commun ACM, vol. 60, no. 6, pp. 84–90, 2017. [Google Scholar]
46. X. Wang, Y. Peng, L. Lu, Z. Lu, M. Bagheri et al., “ChestX-ray8: Hospital-Scale chest X-ray database and benchmarks on weakly-supervised classification and localization of common thorax diseases,” in Proc. of the 2017 IEEE Conf. on Computer Vision and Pattern Recognition (CVPRHonolulu, HI, USA, pp. 3462–3471, 2017. [Google Scholar]
47. O. Ronneberger, P. Fischer and T. Brox, “U-Net: Convolutional networks for biomedical image segmentation,” in Proc. of the Lecture Notes in Computer Science, Media LLC, Switzerland: Springer Science and Business, 9351, pp. 234–241, 2015. [Google Scholar]
48. M. Wo'zniak, D. Polap, G. Capizzi, G. Sciuto, L. Ko'smider et al., “Small lung nodules detection based on local variance analysis and probabilistic neural network,” Computer Methods and Programs Biomedicine, vol. 161, no. 3, pp. 173–180, 2018. [Google Scholar]
49. Y. Gu, X. Lu, L. Yang, B. Zhang, D. Yu et al., “Automatic lung nodule detection using a 3D deep convolutional neural network combined with a multi-scale prediction strategy in chest CTs,” Computer Biology and Medicine, vol. 103, no. 15, pp. 220–231, 2018. [Google Scholar]
50. T. Ho and J. Gwak, “Multiple feature integration for classification of thoracic disease in chest radiography,” Applied Sciences, vol. 9, no. 3, pp. 413–423, 2019. [Google Scholar]
51. A. Jaiswal, P. Tiwari, S. Kumar, N. Gupta, A. Khanna et al., “Identifying pneumonia in chest X-rays: A deep learning approach,” Measurement, vol. 145, no. 3, pp. 511–518, 2019. [Google Scholar]
52. G. Liang and L. Zheng, “A transfer learning method with deep residual network for pediatric pneumonia diagnosis,” Computer Methods Programs Biomed, vol. 187, no. 4, pp. 104– 113, 2019. [Google Scholar]
53. J. Souza, J. Diniz, J. Jerreira, G. Da Silva, A. Silva et al., “An automatic method for lung segmentation and reconstruction in chest X-ray using deep neural networks,” Computer Methods Programs Biomed, vol. 177, no. 5, pp. 285–296, 2019. [Google Scholar]
54. T. Rahman, M. Chowdhury, A. Khandakar, A. Islam, K. Islam et al., “Transfer learning with deep Convolutional neural network (CNN) for pneumonia detection using chest X-ray,” Applied Sciences, vol. 10, no. 9, pp. 32–39, 2020. [Google Scholar]
55. A. Khan, A. Sohail, U. Zahoora and A. Qureshi, “A survey of the recent architectures of deep convolutional neural networks,” Artificial Intelligence Review, vol. 12, no. 4, pp. 1–62, 2020. [Google Scholar]
56. A. Mahmood, A. Ospina, M. Bennamoun, S. An, F. Sohel et al., “Automatic hierarchical classification of kelps using deep residual features,” Sensors, vol. 20, no. 2, pp. 447–453, 2020. [Google Scholar]
57. J. Cohen, P. Morrison and L. Dao, “COVID-19 image data collection," 11988, 2020. [Online]. Available at: https://arxiv.org/abs/2006. [Google Scholar]
58. P. Mooney, “Chest X-ray images (Pneumonia),” 2020. [Online]. Available at: https://www.kaggle.com/paultimothymooney/chest-xray-pneumonia. [Google Scholar]
59. M. Chowdhury, T. Rahman, A. Khandakar, R. Mazhar, M. Kadir et al., “Can AI help in screening viral and COVID-19 pneumonia?,” 2020. [Online]. Available at: https://arxiv.org/abs/2003. [Google Scholar]
60. D. Izzo Andrea, “COVID-19 Database, [Online],” 2020, Available: https://www.sirm.org/category/senza-categoria/covid-19/. [Google Scholar]
61. W. Yang, A. Sirajuddin, X. Zhang, G. Liu, Z. Teng et al., “The role of imaging in 2019 novel coronavirus pneumonia (COVID-19),” European Radiology, vol. 12, no. 3, pp. 1–9, 2020. [Google Scholar]
62. I. Apostolopoulos and T. Mpesiana, “Covid-19: Automatic detection from X-ray images utilizing transfer learning with convolutional neural networks,” Physical and Engineering Sciences in Medicine, vol. 41, no. 7, pp. 13–27, 2020. [Google Scholar]
63. M. Elaziz, K. Hosny, A. Salah, M. Darwish and A. Sahlol, “New machine learning method for image-based diagnosis of COVID-19,” PloS One, vol. 15, no. 6, pp. 15–25, 2020. [Google Scholar]
 | This work is licensed under a Creative Commons Attribution 4.0 International License, which permits unrestricted use, distribution, and reproduction in any medium, provided the original work is properly cited. |