DOI:10.32604/csse.2021.017296
| Computer Systems Science & Engineering DOI:10.32604/csse.2021.017296 | |
| Article |
Community Detection in Aviation Network Based on K-means and Complex Network
1Civil Aviation Flight University of China, Guanghan, 618307, China
2WebChain Pty Ltd, Sydney, NSW 2118, Australia
*Corresponding Author: Hang He. Email: 43162164@qq.com
Received: 26 January 2021; Accepted: 16 March 2021
Abstract: With the increasing number of airports and the expansion of their scale, the aviation network has become complex and hierarchical. In order to investigate the complex network characteristics of aviation networks, this paper constructs a Chinese aviation network model and carries out related research based on complex network theory and K-means algorithm. Initially, the P-space model is employed to construct the Chinese aviation network model. Then, complex network indicators such as degree, clustering coefficient, average path length, betweenness and coreness are selected to investigate the complex characteristics and hierarchical features of aviation networks and explore their causes. Secondly, using K-means clustering algorithm, five values are obtained as the initial clustering parameter K values for each of the aviation network hierarchies classified according to five complex network indicators. Meanwhile, clustering simulation experiments are conducted to obtain the visual clustering results of Chinese aviation network nodes under different K values, as well as silhouette coefficients for evaluating the clustering effect of each indicator in order to obtain the hierarchical classification of aviation networks under different indicators. Finally, the silhouette coefficient is optimal when the K value is 4. Thus, the clustering results of the four layers of the aviation network can be obtained. According to the experimental results, the complex network association discovery method combined with K-means algorithm has better applicability and simplicity, while the accuracy is improved.
Keywords: K-means algorithm; complex network; community detection; aviation network
Complex networks are pervasive in various aspects of the human social world. Since Strogatz et al. [1] and Barabasi Albert [2] proposed the small-world and scale-free properties of complex networks, the study of complex network properties has been deepened and enriched. Among them, community structure is considered as one of the most important properties of complex networks. Radicchi et al. [3] intuitively divided the community structure into strong and weak communities, and the division was based on the comparison of the magnitude of the degree of the connection between the subgraph H and the internal and external nodes of the subgraph H of the complex network, reflecting the close and sparse relationship [4]. The study of community structure is of importance for network resistance to destruction, robustness and stability, for infectious disease transmission and prevention and control, for knowledge discovery and data mining on the basis of big data as well as for network simplification.
The identification of community structure is called community detection. There are two general types of community detection methods, respectively, network partitioning method and hierarchical clustering method. The network partitioning method is based on the principle of uniform partitioning to analyze the structure of complex network communities. However, the proposed method cannot determine how many communities it is reasonable to decompose the network into. The Kernighan-Lin algorithm and Spectrum algorithm based on Laplace Graph Features are demonstrated to be two important network partitioning methods. Hierarchical clustering methods naturally divide the network into subgroups based on the similarity or strength of the connections existing between individual nodes. Hierarchical clustering methods are classified into coalescent and split methods based on whether an edge is added or removed from the network. Hierarchical clustering algorithms are usually able to classify core nodes well while there are errors in the classification of peripheral nodes. In addition, with the development of machine learning, the unsupervised learning field supports clustering algorithms such as K-means clustering, fuzzy C-mean algorithm [5], density-based DBSCAN clustering and EM clustering methods, which can be applied in community detection studies.
In the present study, we introduce K-means clustering algorithm and combine it with complex network theory in order to develop aviation network related research. K-means algorithm was first proposed by MacQueen [6] which is a traditional division method in clustering algorithm in machine learning field. K-means algorithm has the advantages of rapid convergence, high efficiency and simple principle. However, the accuracy of K-means algorithm severely is dependent on the value K of cluster classes and the initial cluster centers. A large body of literature demonstrates that there are numerous studies on the application and improvement of the K-means algorithm. Maamar et al. [7] employed the K-means algorithm to cluster users in smart grid research to identify users with similar electricity consumption patterns. Tang et al. [8] applied k-means clustering and Pearson’s correlation coefficient to investigate the potential correlations in college students’ physical fitness. Wu et al. [9] based on the K-means algorithm to cluster the sentiment source domain data and target domain data. Yang et al. [10] proposed a multi-feature weighted K-means (MFWK-means) based algorithm to classify learners based on their rank and weighted features to classify the learners and also compared with the traditional K-means clustering algorithm to prove the superiority of the method. Wang et al. [11] proposed a method that can enhance the accuracy of K-means algorithm using stochastic evolution process.
The combination of clustering algorithms such as K-means and complex networks has gradually become a popular direction of research. Based on the process and characteristics of traditional K-means algorithm, scholars mostly optimize the defects of K-means algorithm and apply the relevant theory of complex network discipline. Tian et al. [12] selected the degree and defined the aggregation coefficient as the basis for optimizing the K-value of K-means. Additionally, some scholars also chose the degree, the betweenness of edges and the passenger flow as the basis for optimizing the K-means of K-means [13]. Zhao et al. [14] constructed the association matrix to explore the clustering centers based on the node association degree. Moreover, this method is in consistence with the principle of constructing the similarity matrix by K-means algorithm. Cai et al. [15] proposed a DDJKM method based on node density and node centrality, effectively avoiding selecting isolated points as initial clustering centers. In the meanwhile, some researchers have also applied K-means algorithm [16] on the basis of complex networks with weighted features, which generates good experimental results. In this paper, based on the study of the complex characteristics of the Chinese aviation network, a method based on the hierarchical classification of complex characteristics is proposed for the reasonable determination of the K-value of the K-means algorithm. According to the results, the betweenness of each node in the Chinese aviation network can influence the structure of communities in the Chinese aviation network in a large way.
2.1 Complex Network Related Indicators
1) Degree and degree distribution. Degree of a node is defined as the number of edges connected to that node. In the aviation network, the airport is the node
Degree distribution is an important statistical feature of airport network. The degree distribution of nodes in aviation network can be described by distribution function
2) Average path length. The distance between two nodes in the network is the number of edges on the shortest path between two nodes. In the branch aviation network of the present study, the distance
where the total number of possible edges in the network is
3) Clustering Coefficient. Clustering coefficient, also called cluster coefficient, agglomeration coefficient or cluster coefficient, is used to describe the agglomeration between airport nodes in aviation network, which is an important index of local characteristics of aviation network structure. The ratio of the actual number of edges
4) Betweenness. A certain node
Among them, is the number of shortest paths between nodes
5) Coreness. The k-core of a graph refers to the remaining subgraph after removing nodes with degree values less than k and their connections repeatedly. The number of nodes in the subgraph is the size of the core.
2.2 Building China Aviation Network Model
An aviation network remains a system of complex networks. The network model is generally constructed spatially. There are generally SPACE L, SPACE R and SPACE P methods which can be used to construct networks spatially [17]. In the current work, the SPACE P method is chosen to construct the Chinese aviation network. The network has the following characteristics. The airports are treated as nodes in the network, the links between the cities where the flight segments start are the edges in the network, and the links in the network are not repeated. Non-weighted network, the network edge weights are all 1. Non-directional network, the Chinese flight schedule preparation is generally scheduled for round-trip flights. Therefore, the air transportation between two places is considered to be two-way. Fig. 1 shows the topology of the Chinese airline network, each circle represents an airport node, and the size of the circle node signifies the size of the node degree and the degree of connectivity between that airport node and other airports.
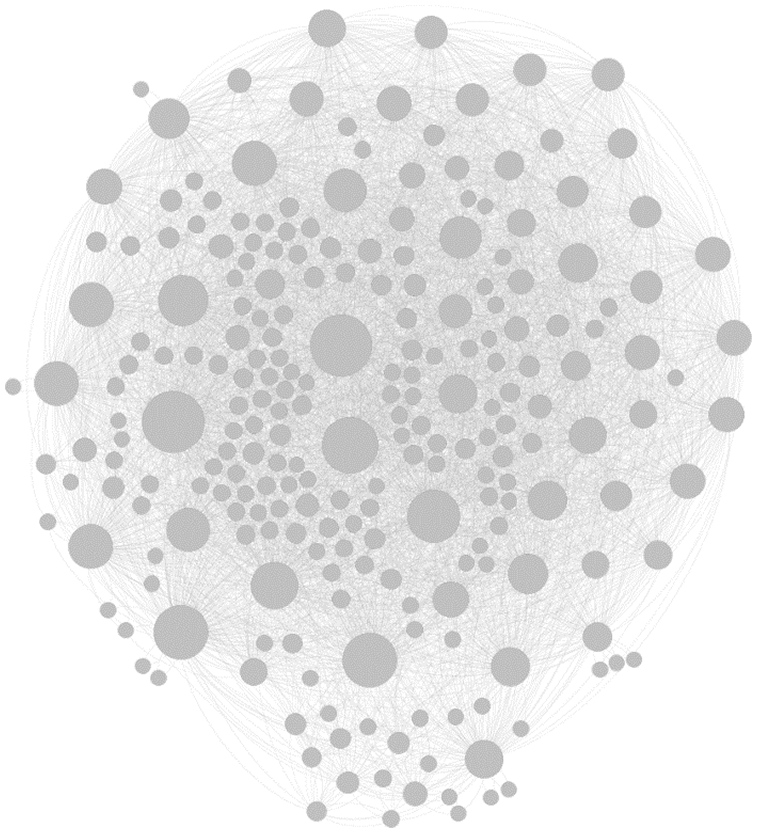
Figure 1: China aviation network topology (2020)
The K-means algorithm is the representative of a typical prototype-based objective function clustering method, where some distance from the data points to the prototype is used as the optimized objective function [18]. Given a data set
Step 1: Arbitrarily select k objects as the center of the initial cluster.
Step 2: All objects in D are assigned to the nearest cluster based on the average value of the objects in the cluster.
Step 3: Updating the average of clusters, i.e, recalculating the center of each cluster.
Step 4: Repeat Step2 and Step3 until the cluster center no longer changes or the number of iterations exceeds the set maximum number of iterations.
In this paper, the contour coefficient is used as the method to evaluate the quality of clustering results. In terms of dataset samples
Among them,
For a particular clustering of a dataset, the contour coefficient
where n is the number of samples in the data set and
The data in the present study comes from the Civil Aviation Administration of China’s (CAAC) Advance Flight Planning Management System (AFPMS), which selects China’s domestic flight schedules for the 2020 summer and fall seasons. The data includes 9,278 flight segments from 232 airport nodes.
3.1 K Value Selected Based on Complex Network Theory
In this paper, we use the relevant indicators of complex network theory to explore the complex characteristics of China’s aviation network, and select the appropriate cluster value K for clustering analysis in accordance with the distribution of each index.
1) Degree and its distribution. Degree is a simple and important index in complex network research. Generally, the degree distribution of nodes is used to determine the network type. This paper calculates the degree of totally 232 Chinese airport nodes in the selected data, and obtains the degree distribution results of China’s aviation network nodes, which can be found in the Fig. 2.
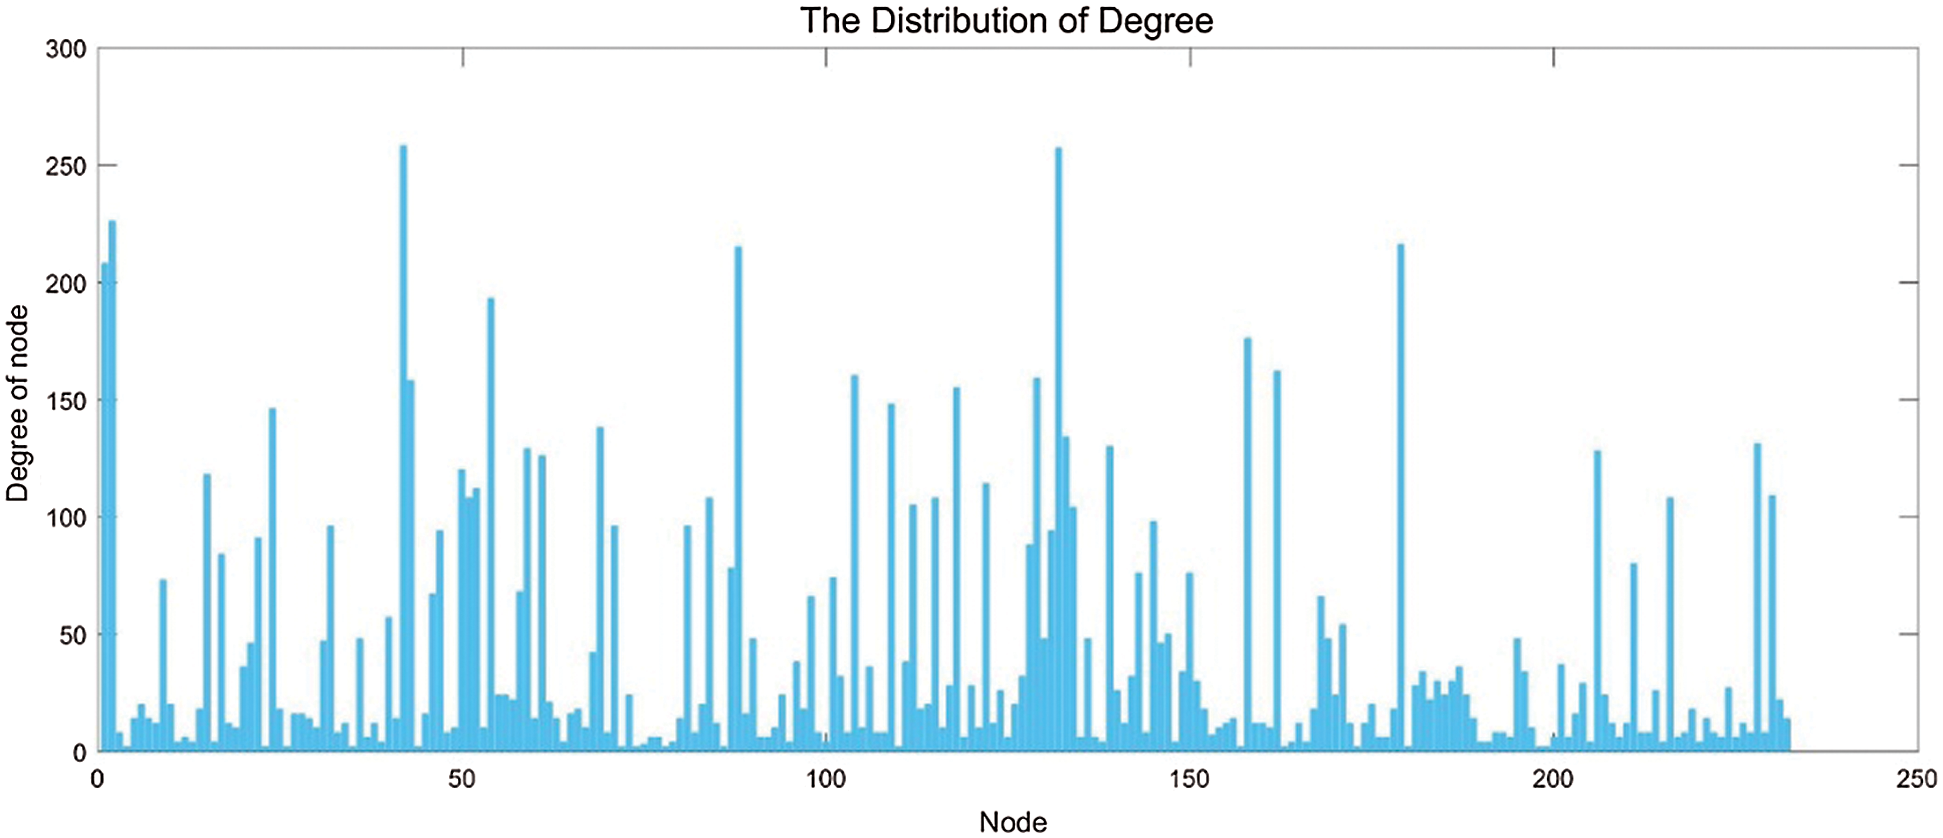
Figure 2: The distribution of degree
The probability distribution of node degree is fitted by curve, and the probability distribution of discovery degree shows good fitting effect for Gaussian curve fitting, but not for power-law distribution and polynomial distribution. As shown in Fig. 3.
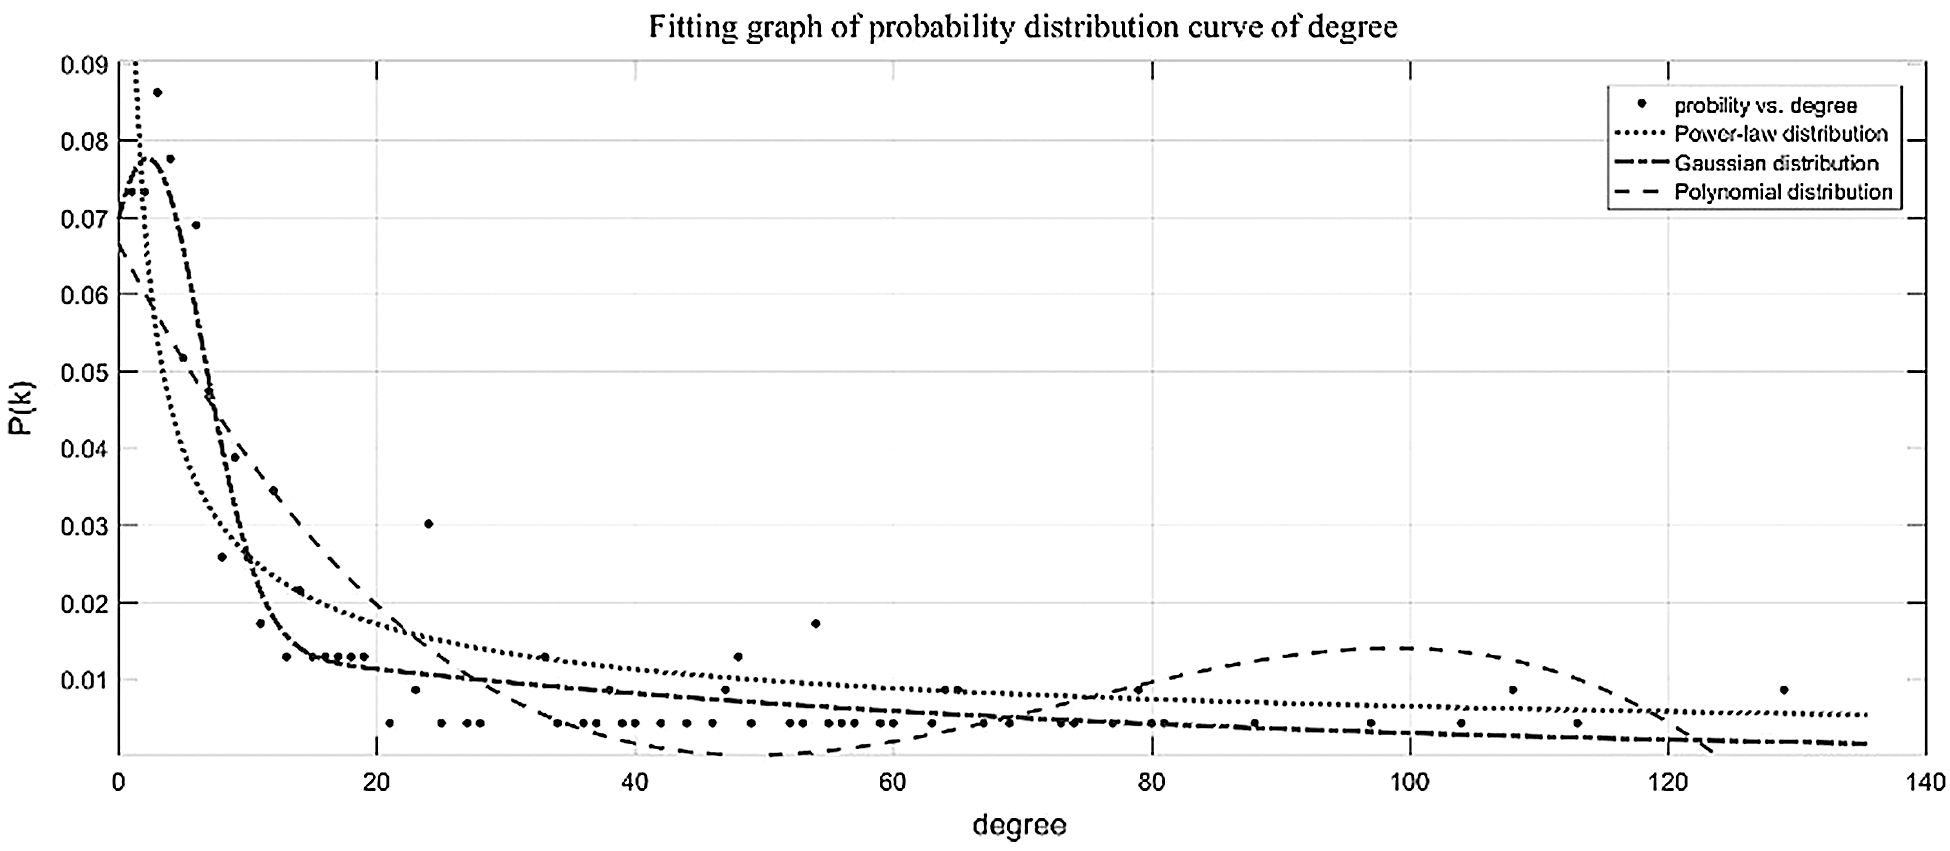
Figure 3: Fitting graph of probility distribution curve of degree
The connectivity between airport and other airports can be expressed by the degree of airport nodes. Through calculating the proportion of airports in all airports in China’s aviation network, it can reflect the hierarchical distribution of airport nodes and aviation network to a certain extent. Therefore, on this basis, the node levels of China aviation network are divided, as presented in Tab. 1.
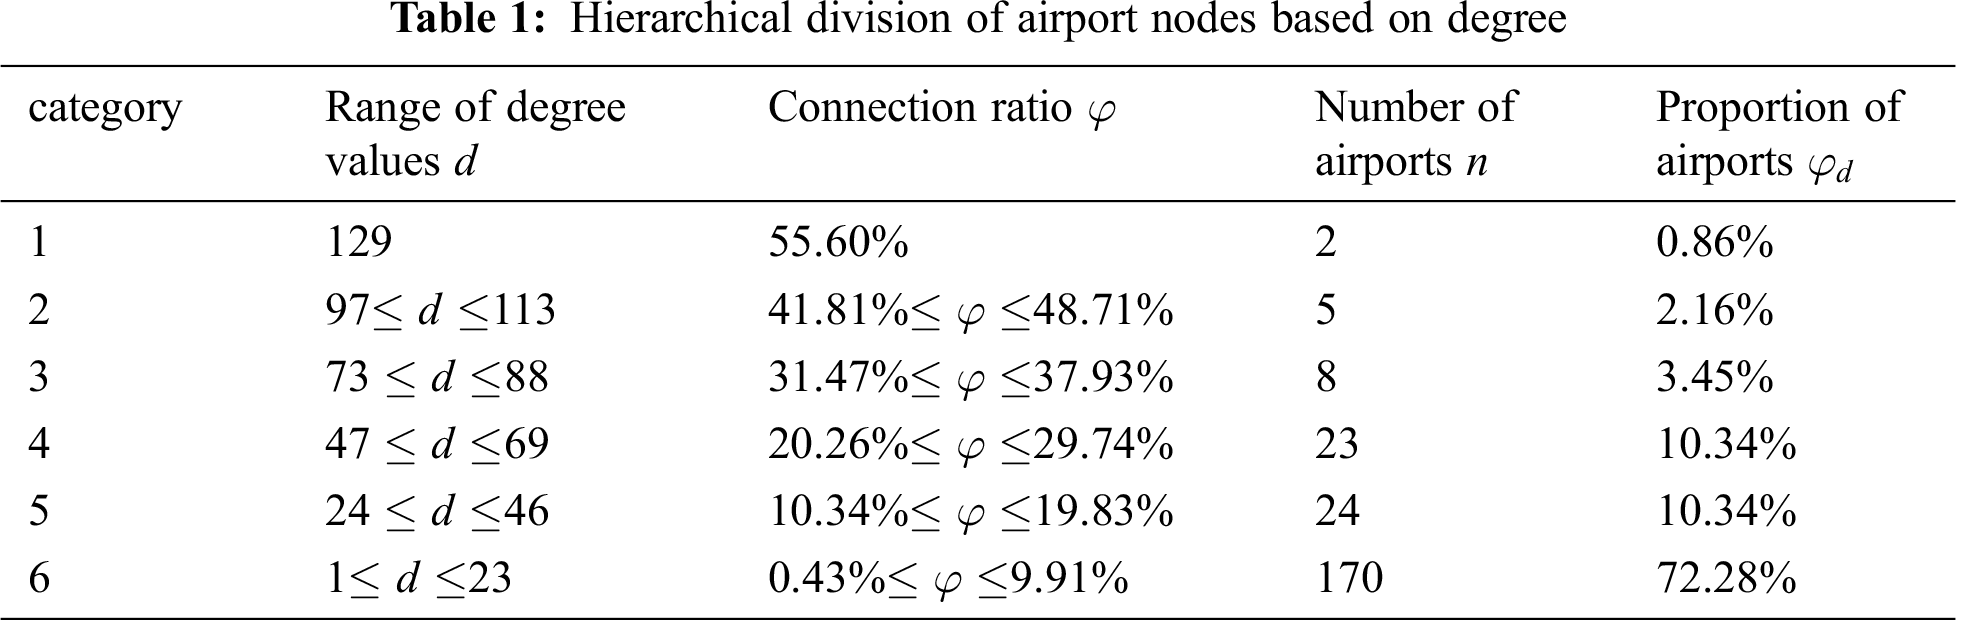
Through the analysis of Tab. 1, it can be found that China’s aviation network does not present the characteristics of “fewer large airports with high degree value, fewer small airports with low degree value, and more medium-sized airports in the middle supporting position” in the traditional cognition. Among these airport nodes, 72.41% of them are small airports with degree below 21 nodes, 20.68% of them are medium and small airports, and 3% are high degree airports. Through analyzing relevant reasons, large airports are mostly distributed in regions with strong economic strength. As a fast channel to carry the flow of economic factors such as people flow, logistics, capital flow and information flow, the transportation department will attract more factors from the outside world, resulting in the shortage of resources and busy operation of large airports at all times. However, small airports are mostly distributed in remote areas with underdeveloped economy and inconvenient transportation. Meanwhile, the degree of economic factor flow in these areas does not remain high. Other airports are not well connected. As time goes on, “Matthew effect” will aggravate this unbalanced differential distribution of aviation network.
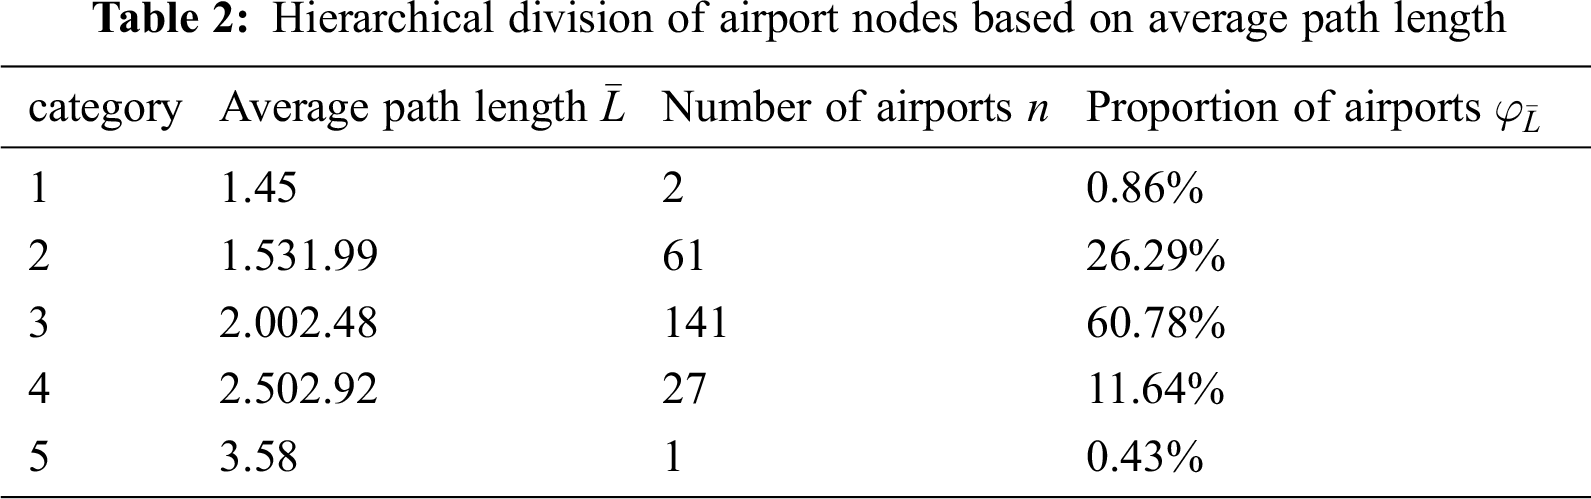
2) Average path length. The aviation network constructed is an undirected and unauthorized network. Through calculating the complex network, the average shortest path of the whole network is 2.15, indicating that the average path length from any node a to any node B is 2.15. In comparison with 232 nodes, the average path length is smaller, which reflects the small world characteristics of aviation network to some extent. Simultaneously, the average shortest path length from each node to other nodes is divided into five levels, as shown in Tab. 2.
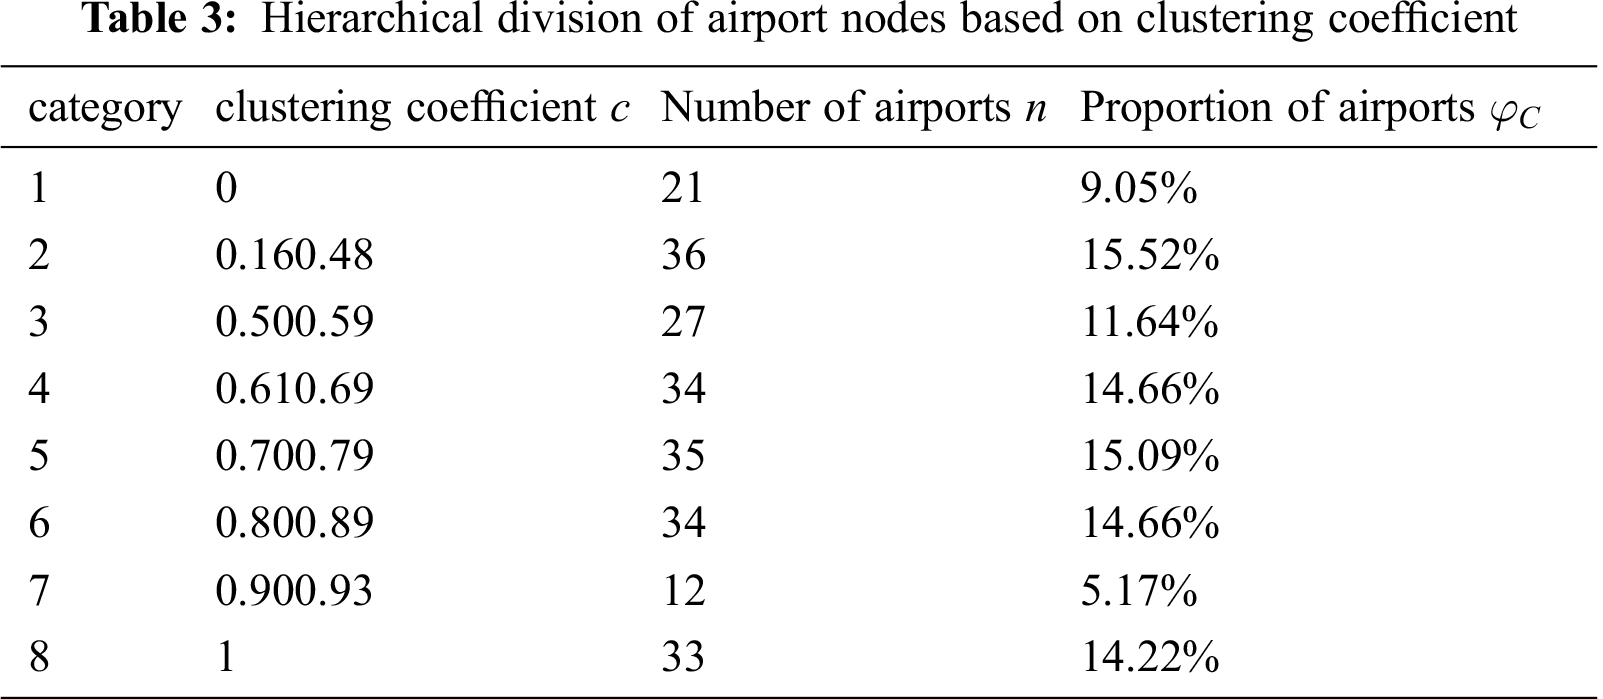
3) Clustering coefficient. Clustering coefficient is a measure of node clustering in complex networks. In most practical networks, there is a strong tendency of clustering among nodes. The average clustering coefficient of China aviation network is 0.639. Meanwhile, according to the measurement results, the node clustering coefficient is divided into 8 levels, as presented in Tab. 3.
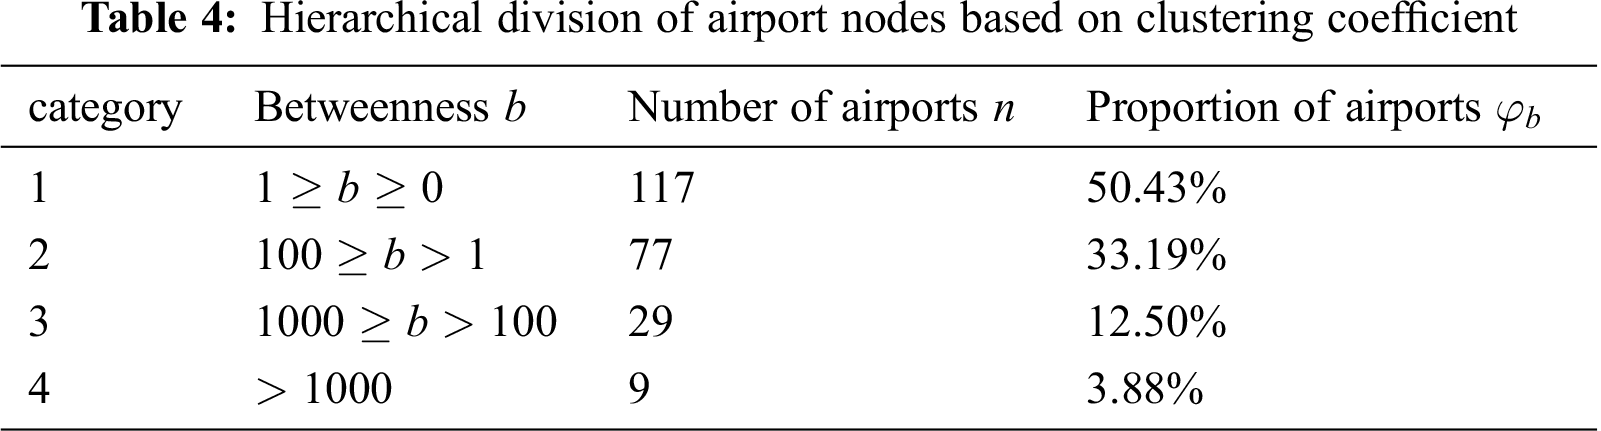
4) Betweenness. The necessity and influence of nodes in the whole aviation network are associated with the size of betweenness. It indicates the greater the betweenness, the stronger the centrality of nodes in the network. According to the calculation results, it is found that the distribution of node betweenness is extremely uneven, proving that the importance of Chinese airport hub in aviation network is extremely different. The distribution of betweenness can be divided into four levels in Tab. 4.
5) Coreness. According to the definition of core, we can find that the number of nodes in aviation network can measure the depth of the node in the whole “core” (aviation network). The large number of cores in the whole network indicates that most nodes in the network will not leave the network easily for the reason that other nodes are damaged. The core number of the whole network is the maximum number of cores in the network nodes. The aviation network constructed in this paper has 31 cores. Besides, there are four nodes with 31 cores. Compared with the network composed of 232 nodes, the core value does not remain high. Even if the degree of a node is extremely high, its core number may be very small, for example, the core number of star network center node is 1. At the same time, the core number of the node with degree value of 1 is also 1. Due to the uniform distribution of the number of cores, it is difficult to clearly divide the levels. Moreover, a new parameter “coreness degree ratio” is proposed to measure the distribution level of node cores, as shown in Tab. 5.
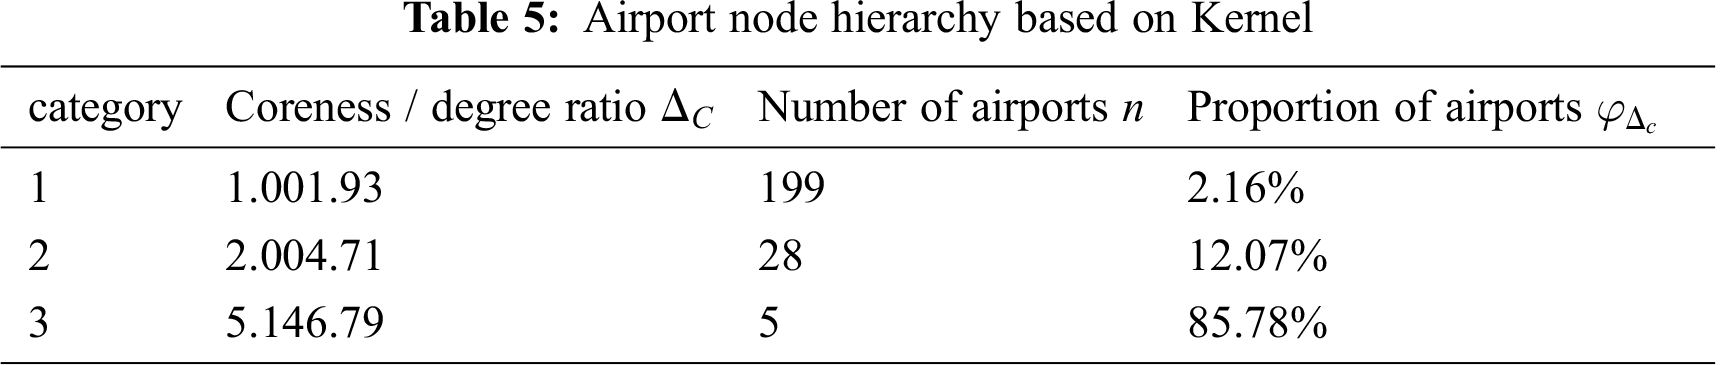
The airport nodes are divided into three levels according to the parameter coreness degree ratio. It indicates the higher the kernel ratio, the higher the status and importance of the airport nodes in the network. At the same time, in accordance with the complex network theory, the k values of moderate, clustering coefficient, average path length, betweenness and kernel number are 6, 8, 5, 4, 3, thus providing a scientific basis for the algorithm to select the initial cluster value reasonably.
The airport nodes are divided into three levels according to the parameter coreness degree ratio. The higher the kernel ratio, the higher the status and the importance of the airport nodes in the network. Based on the complex network theory, the cluster value k is determined as 6,8,5,4,3, according to the index of degree, clustering coefficient, average path length, betweenness and coreness, which can thus provide a scientific basis for the algorithm to select the initial cluster value reasonably.
3.2 Algorithm Flow Improvement
Input: China aviation network G (V, E), complex characteristic matrix M (F, N)
Output: G (V, E) division results of China Aviation Network
Algorithm process:
1) China’s aviation network construction. The undirected and unauthorized network of China aviation is constructed in P space, and G (V, E) of China aviation network is obtained. The complex characteristic matrix M (F, N) of each node
2) K value is determined. According to the complex network characteristics of China’s aviation network, such as complexity, clustering coefficient, average path length, betweenness and kernel number, the parameter distribution is divided into levels and K value is reasonably determined.
3) The initial cluster center is determined. K-means algorithm is employed to determine K initial cluster centers randomly.
4) Distance measurement. In this paper, Euclidean distance is used as the distance measure in K-means algorithm and its formula is
5) The division of clusters. The distance between each node and each cluster center is compared, and the nodes are divided into clusters with the smallest distance.
6) Updating the clustering center. The sum of distances between each node in each cluster and other nodes in the cluster is calculated, and the node with the smallest sum is taken as the new cluster center.
7) Iteration. Iterating step 5) and step 6) until the cluster center does not change.
8) Cluster analysis evaluation. The contour coefficient formula was used to evaluate and score the results of different K values.
9) Optimal clustering. The cluster with the highest score of contour coefficient is regarded as the final community division result.
3.3 Experimental Results and Analysis
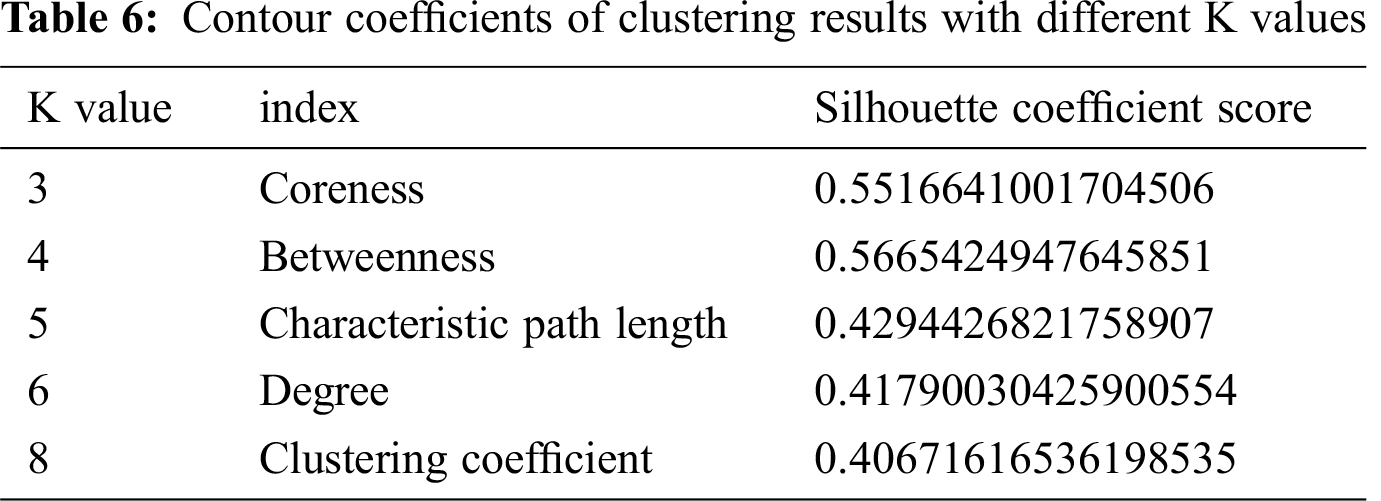
Based on the improved K-means algorithm, the clustering results with k values of 3,4,5,6,8 are obtained. The contour coefficient is employed to evaluate the results, and the contour coefficients of different k-value clustering results are obtained. The contour coefficients of clusters in the results are visualized. At the same time, the standardized clustering data are visualized. Details can be referred to Figs. 4–8.
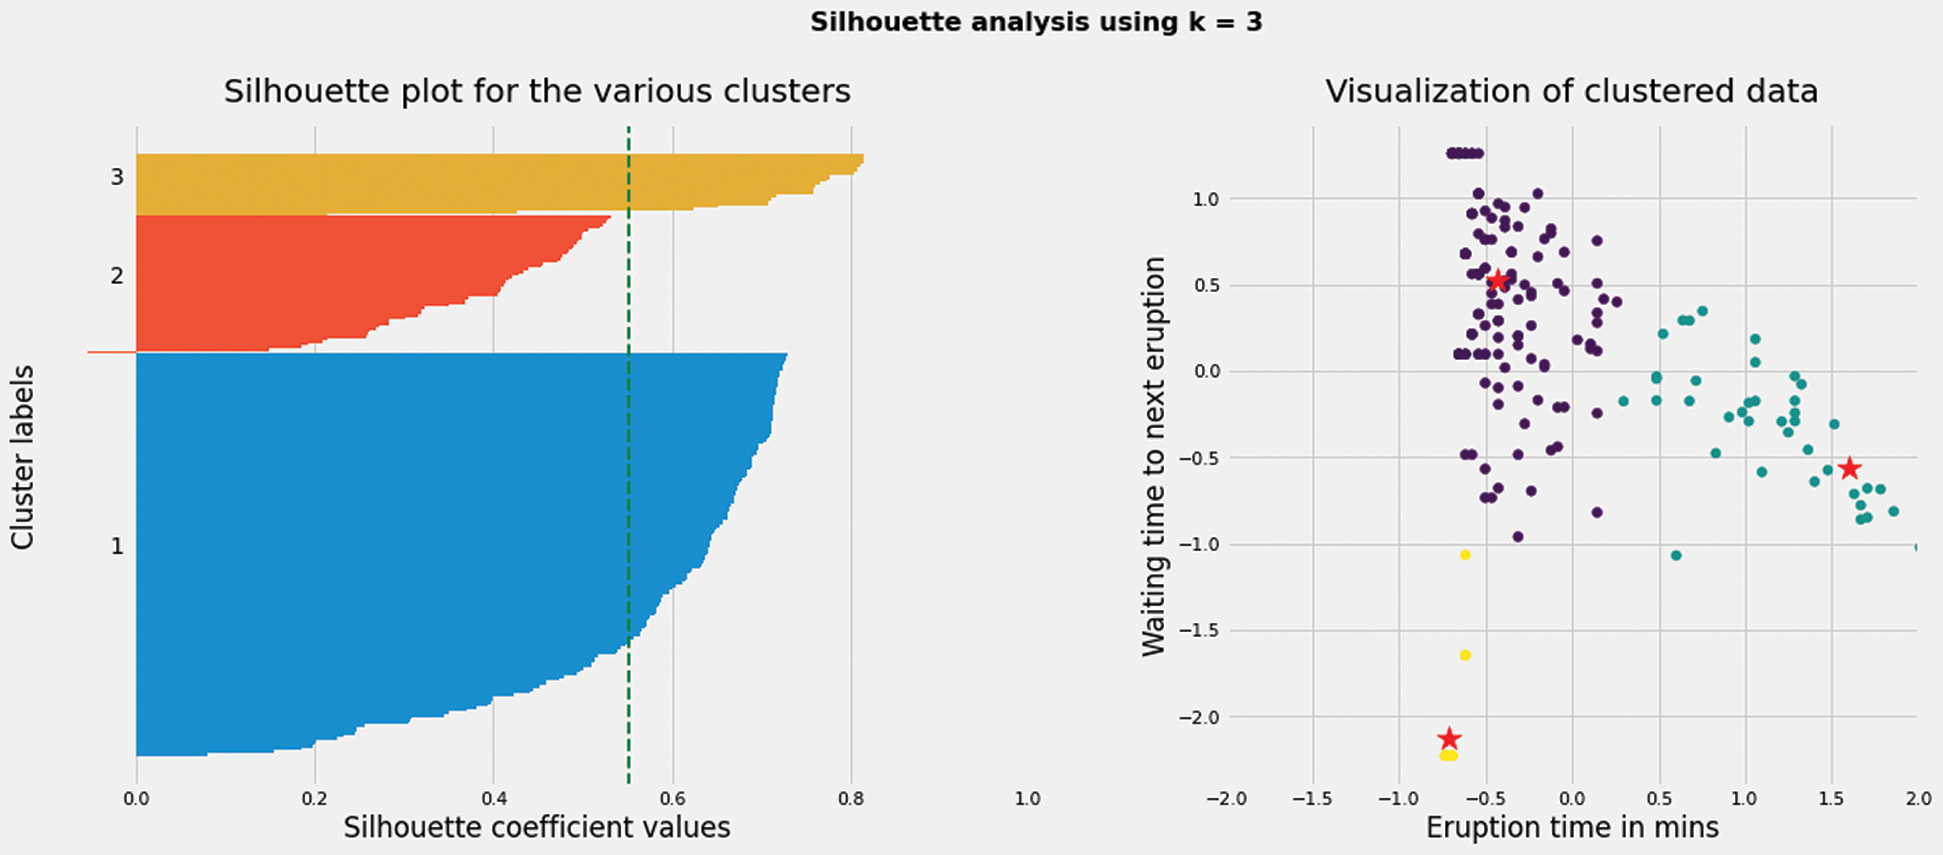
Figure 4: When K value is 3, silhouette coefficient of each cluster and the cluster distribution of nodes in the network
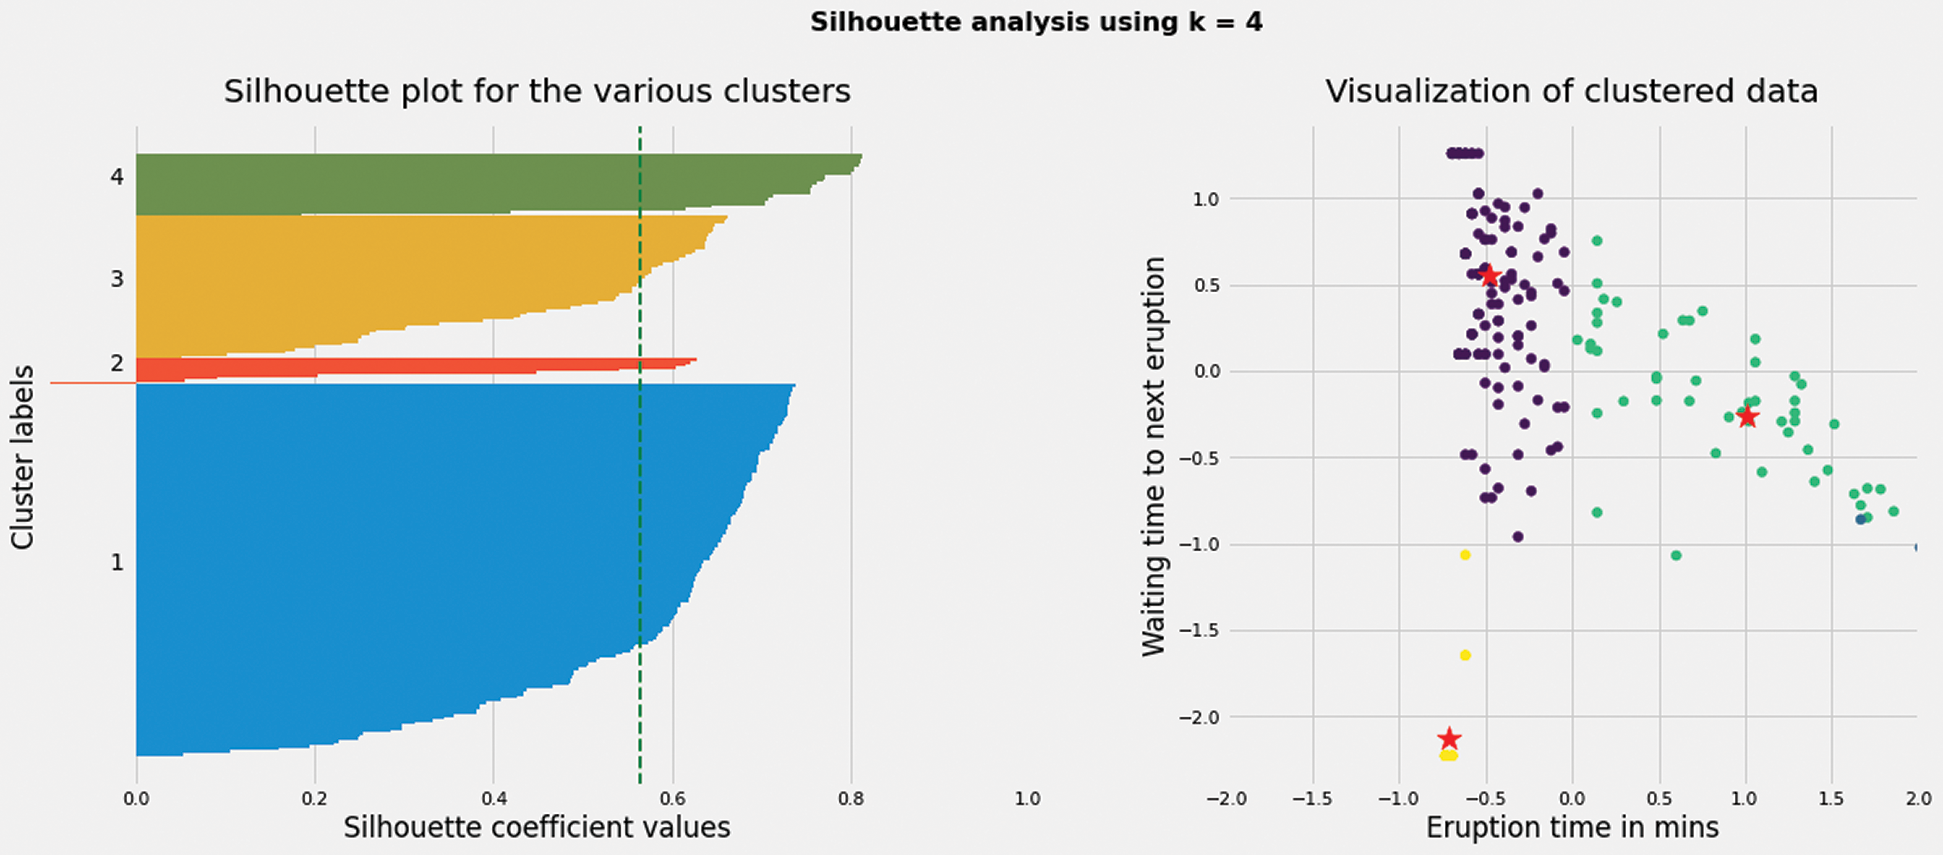
Figure 5: When K value is 4, silhouette coefficient of each cluster and the cluster distribution of nodes in the network
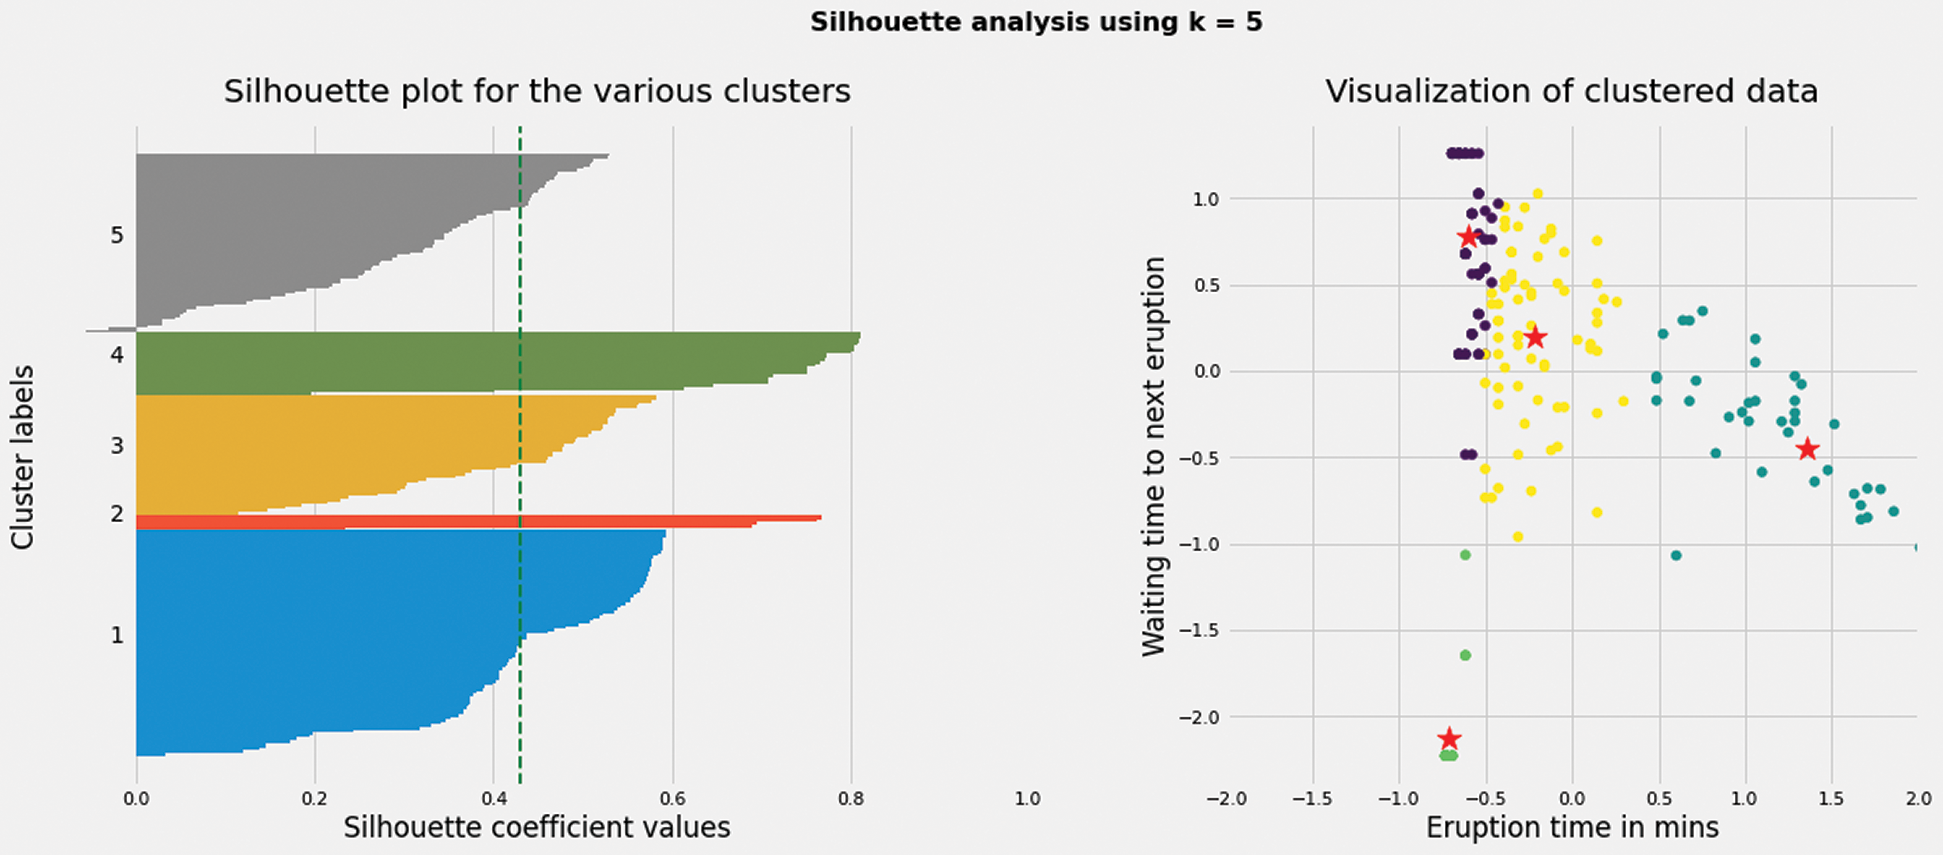
Figure 6: When K value is 5, silhouette coefficient of each cluster and the cluster distribution of nodes in the network
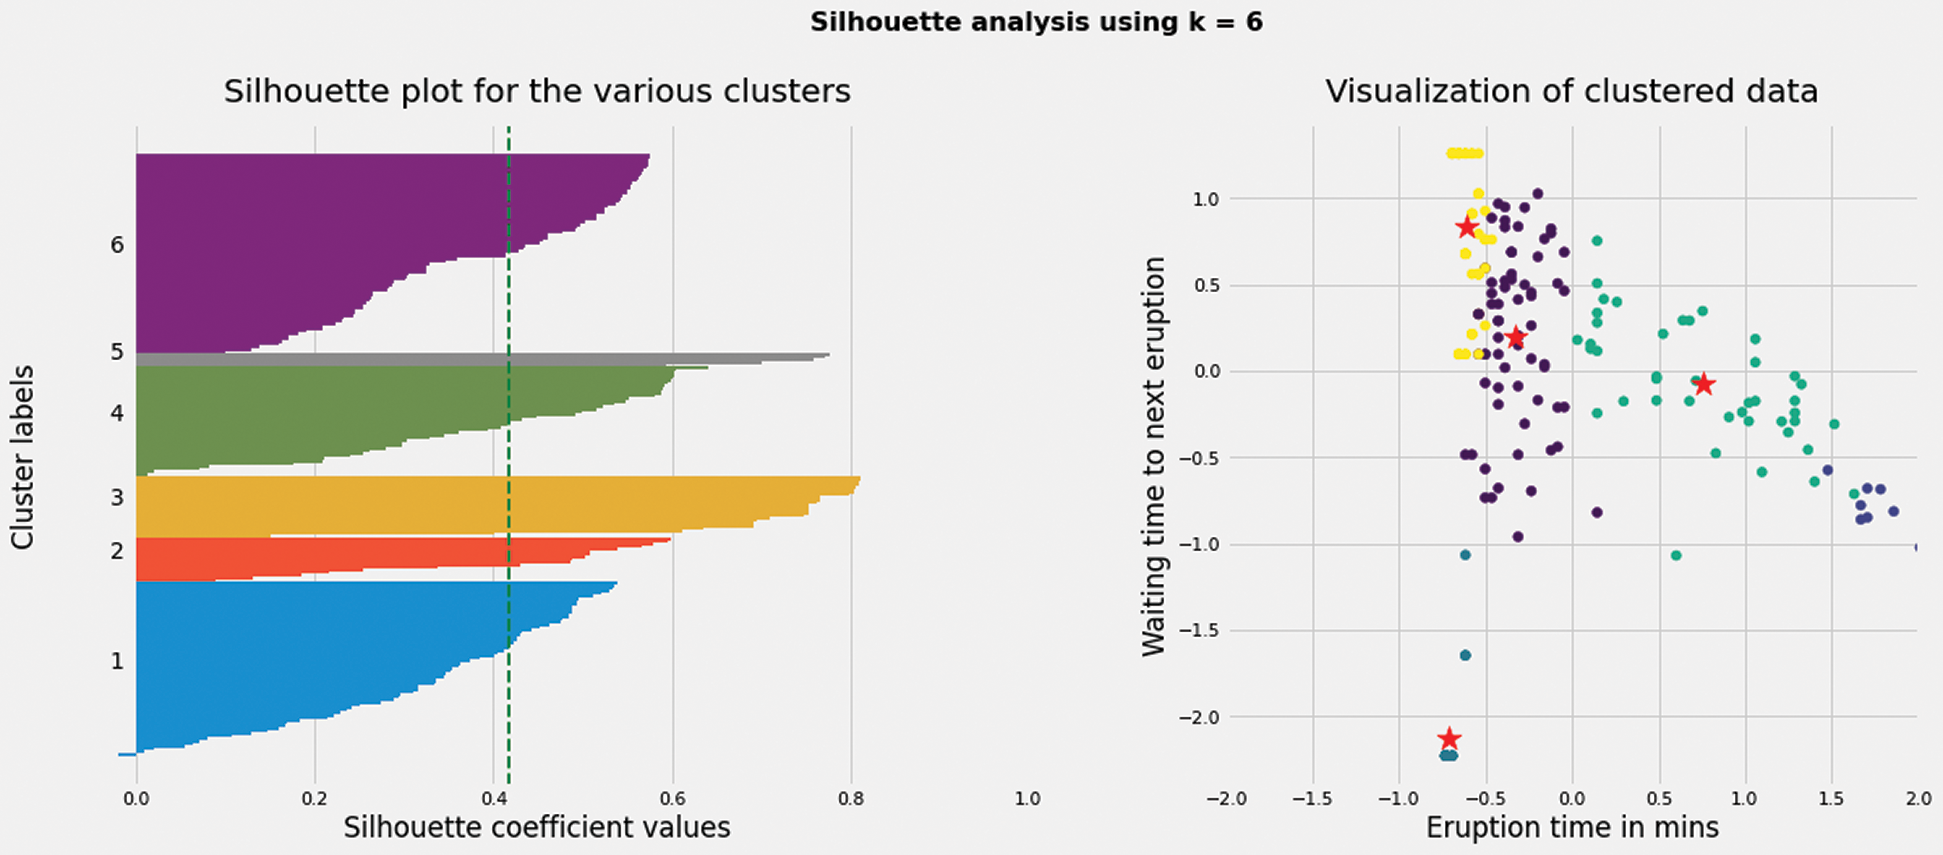
Figure 7: The distribution of silhouette coefficient and node cluster in the network with K value of 6
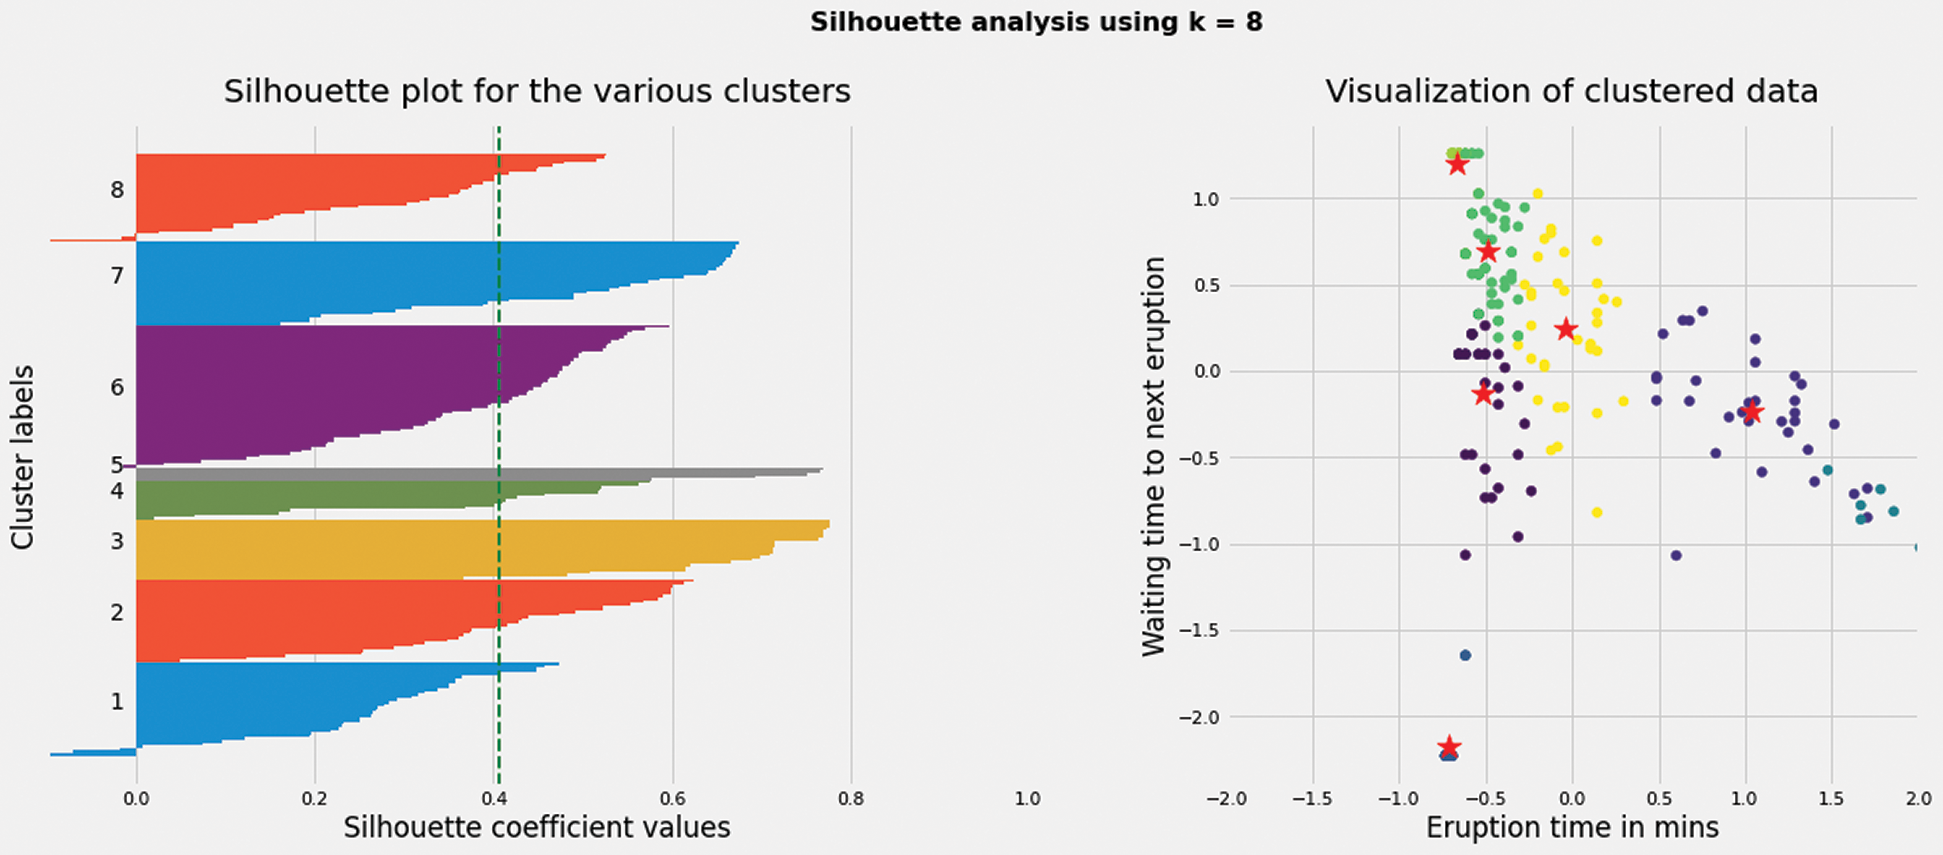
Figure 8: When K value is 8, silhouette coefficient of each cluster and the cluster distribution of nodes in the network
When the K value is 4, the contour coefficient score is the highest (visible table), indicating that the clustering effect is the best, which is shown in the Tab. 6. At the same time, the right side of these five graphs shows the actual clustering results of each node, and the star symbol represents the cluster center.
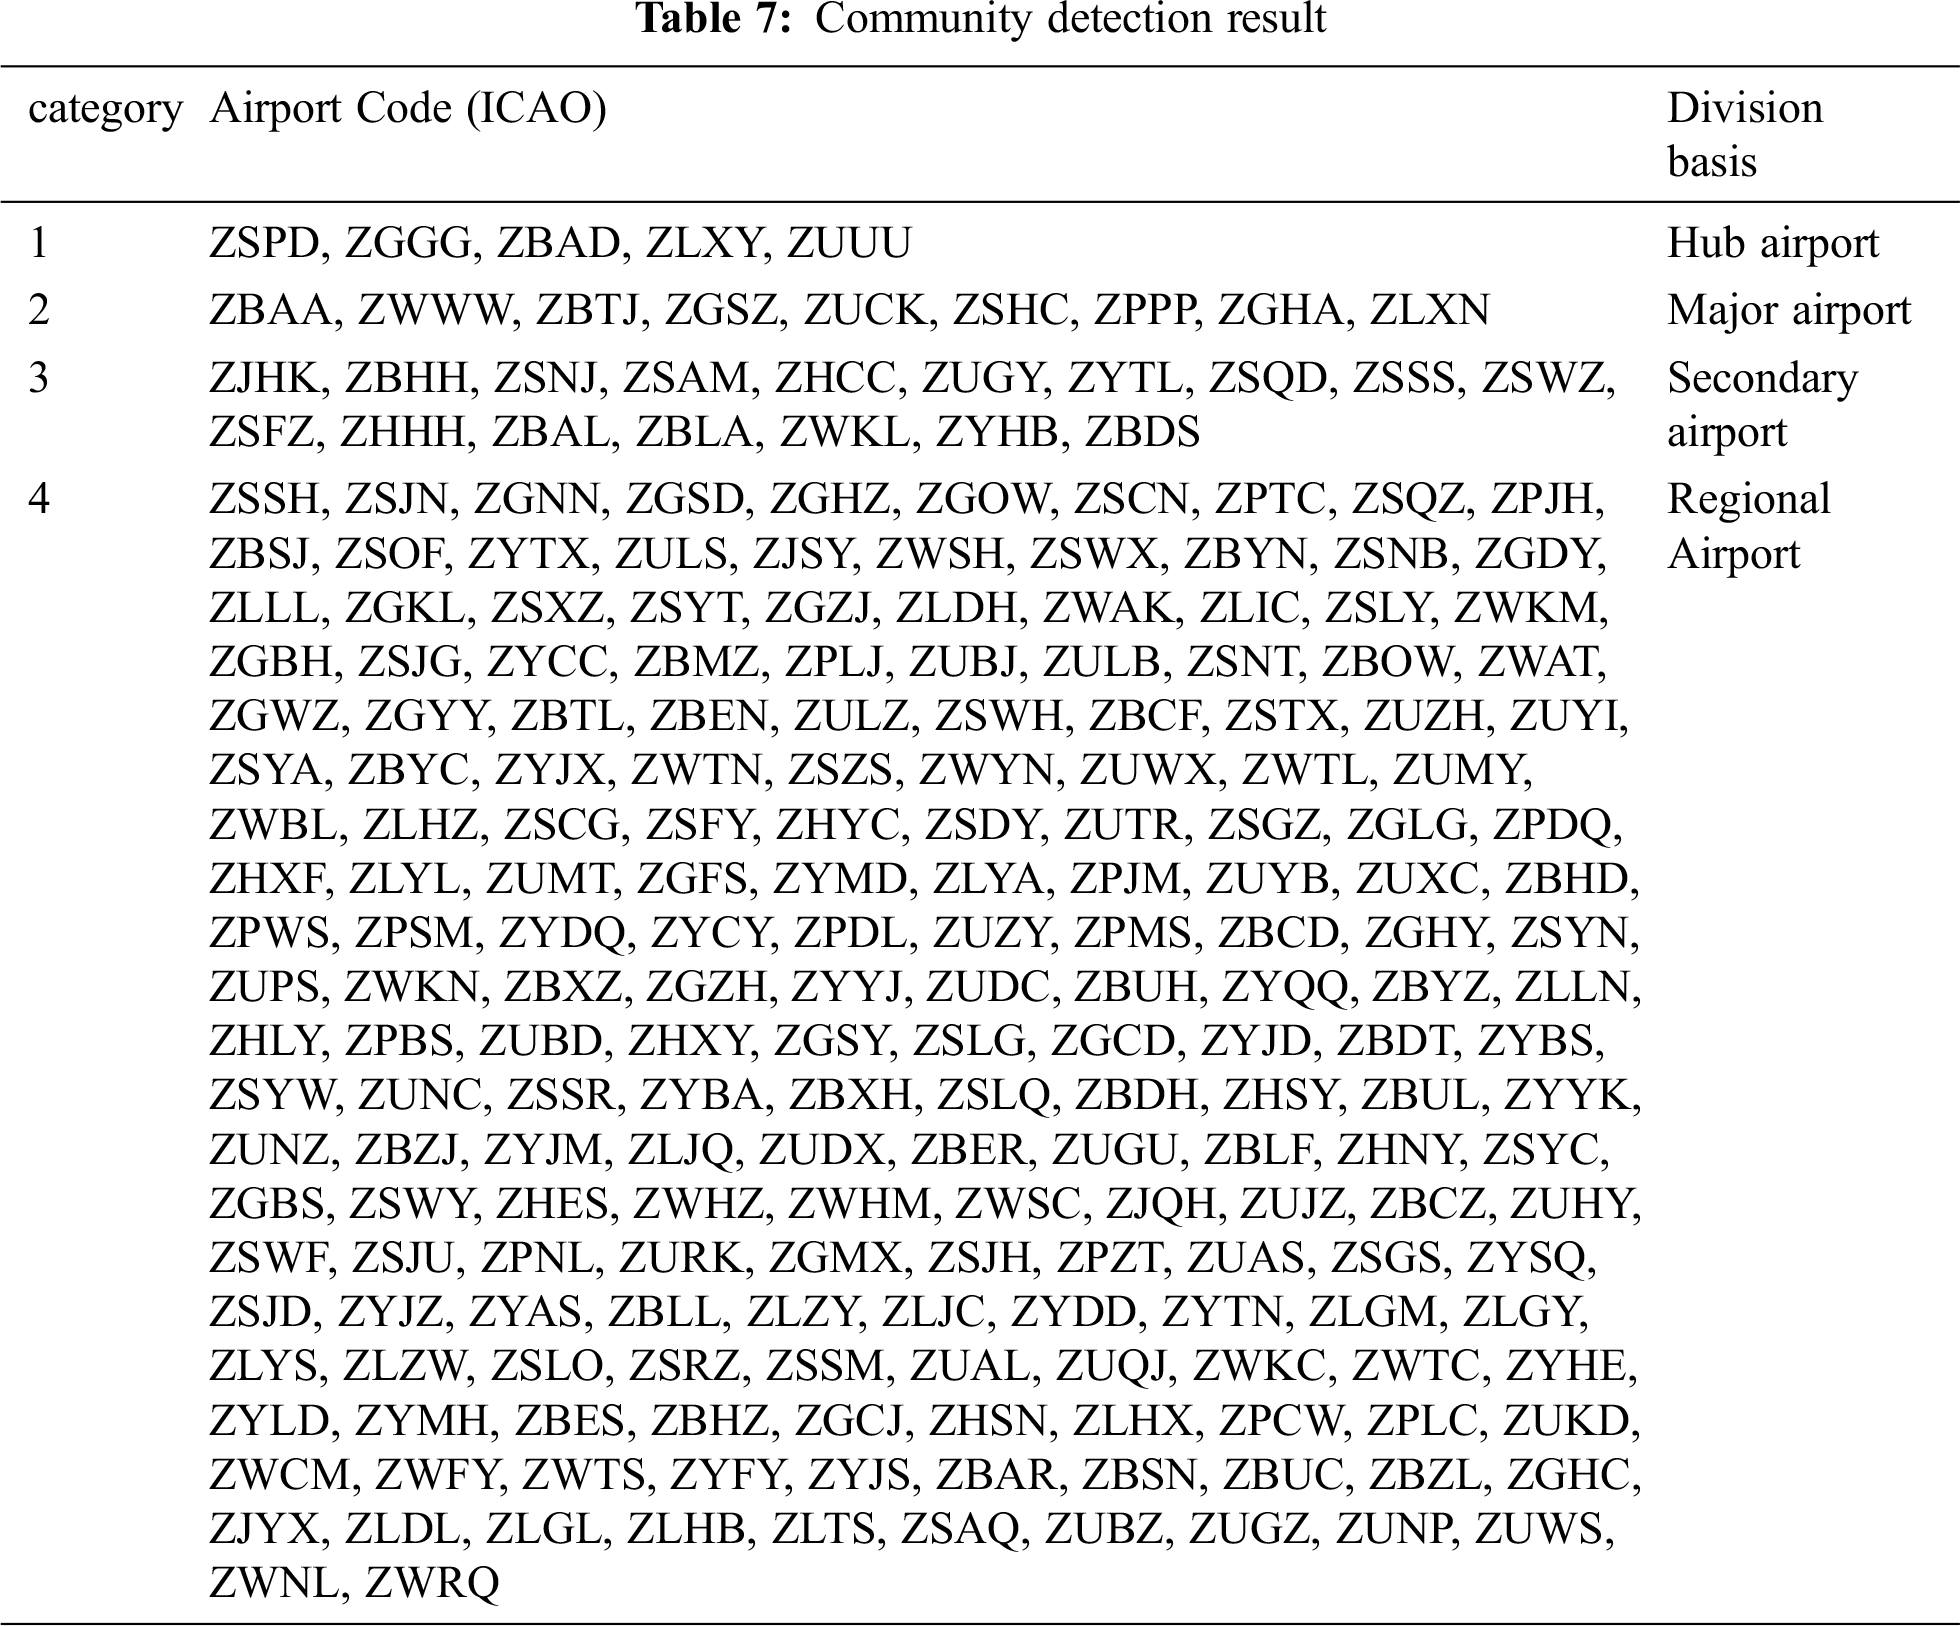
When K value is 4, the clustering results are shown in the Tab. 7. At the same time, 232 nodes are divided into 4 clusters. In the first cluster of data, there are five nodes, ZSPD (Shanghai), ZGGG (Guangzhou), ZBAD (Beijing), ZLXY (Xi’an) and ZUUU (Chengdu). These five airports correspond to the central nodes in China’s aviation network in reality, demonstrating the accuracy of the algorithm. The nodes in the second cluster are the trunk nodes in China’s aviation network, the third are the secondary trunk nodes in China’s aviation network, and the fourth cluster are mostly medium and small airports or feeder airports in China’s aviation network.
To conclude, combining the complex network theory and the related research of K-means clustering algorithm, based on the previous research results, we have conducted an applied research on Chinese aviation network, which mainly includes the following aspects.
1) This study links community detection in the field of complex networks with clustering algorithms in machine learning, explores new methods for community structure detection, and provides certain reference ideas for cross research of related disciplines.
2) This work constructs a Chinese aviation network model in P-space, and investigates the complex characteristics of Chinese aviation network based on degree, clustering coefficients, average path length, betweenness and coreness.
3) A new K-value determination method is proposed to visually divide the hierarchy based on the network complexity characteristics, while silhouette coefficient is applied to evaluate the clustering results. It is found that betweenness of Chinese aviation network exerts an optimal effect on the node clustering in Chinese aviation network.
During the research of the present study, some areas were also found to be improved.
1) The distance metric of the complex characteristic matrix in the K-means algorithm needs to be optimized.
2) Although the subjective hierarchical division is used to select K-value, it has achieved good results, but it is easy to make mistakes. Meanwhile, excellent algorithms can be explored in the division of complex features.
3) The final division results are good in pivot nodes and trunk nodes division, and the algorithm does not perform well in other hierarchical results.
Funding Statement: The authors receive no specific funding for this study.
Conflicts of Interest: The authors declare that they have no conflicts of interest to report regarding the present study.
1. D. J. Watts and S. H. Strogatz, “Collective dynamics of ‘small-world’ networks,” Nature, vol. 393, no. 6684, pp. 440–442, 1998. [Google Scholar]
2. Barabasi, “Emergence of scaling in random networks,” Science (New York, N. Y.), vol. 286, no. 5439, pp. 509–512, 1999. [Google Scholar]
3. F. Radicchi, C. Castellano, F. Cecconi, V. Loreto and D. Parisi, “Defining and identifying communities in networks,” Proceedings of the National Academy of Sciences of the United States of America, vol. 101, no. 9, pp. 2658–2663, 2004. [Google Scholar]
4. M. Girvan and M. E. J. Newman, “Community structure in social and biological networks,” Proceedings of the National Academy of Sciences, vol. 99, no. 12, pp. 7821–7826, 2002. [Google Scholar]
5. A. Ahmed and B. Akay, “A survey and systematic categorization of parallel k-means and fuzzy-c-means algorithms,” Computer Systems Science and Engineering, vol. 34, no. 5, pp. 259–281, 2019. [Google Scholar]
6. J. MacQueen, “Some methods for classification and analysis of multivariate observations,” in Proc of the5th Berkeley Symp on Mathematical Statistics and Probalility, Bekeley, California, USA, vol. I: Statistics, pp. 281–297, 1967. [Google Scholar]
7. A. Maamar and K. Benahmed, “A hybrid model for anomalies detection in AMI system combining k-means clustering and deep neural network,” Computers, Materials & Continua, vol. 60, no. 1, pp. 15–39, 2019. [Google Scholar]
8. P. Tang, Y. Wang and N. Shen, “Prediction of college students’ physical fitness based on k-means clustering and SVR,” Computer Systems Science and Engineering, vol. 35, no. 4, pp. 237–246, 2020. [Google Scholar]
9. S. Wu, Y. Liu, J. Wang and Q. Li, “Sentiment analysis method based on K-means and online transfer learning,” Computers, Materials & Continua, vol. 60, no. 3, pp. 1207–1222, 2019. [Google Scholar]
10. Y. Yang, D. Zhou and X. Yang, “A multi-feature weighting based k-means algorithm for MOOC learner classification,” Computers Materials & Continua, vol. 59, no. 2, pp. 625–633, 2019. [Google Scholar]
11. Y. Wang, X. Luo, J. Zhang, Z. Zhao and J. Zhang, “An improved algorithm of k-means based on evolutionary computation,” Intelligent Automation & Soft Computing, vol. 26, no. 5, pp. 961–971, 2020. [Google Scholar]
12. S. Tian, Y. Wang and A. Li, “A k-means initialization method using complex network features,” Computer Engineering and Applications, vol. 46, no. 06, pp. 127–129, 2010. [Google Scholar]
13. B. Gao, Y. Qin, X. Xiao and L. Zhu, “Cluster analysis of the importance of Beijing subway network based on K-means,” Transportation System Engineering and Information, vol. 14, no. 03, pp. 207–213, 2014. [Google Scholar]
14. F. Zhao and F. Xie, “A new method for community discovery in complex networks based on K-means clustering algorithm,” Computer Application Research, vol. 26, no. 06, pp. 2041–2043, 2009. [Google Scholar]
15. B. Cai, X. Zeng, Z. Wang, L. Li and Z. Wu, “Community detection method based on node density, degree centrality, and k-means clustering in complex network,” Entropy, vol. 21, no. 12, pp. 1145, 2019. [Google Scholar]
16. P. Zhao, H. Geng, Q. Cai and Q. Wang, “A k-means clustering algorithm based on weighted complex network features,” Computer Technology and Development, vol. 017, no. 009, pp. 35–37, 2007. [Google Scholar]
17. D. He, Z. Liu and B. Wang, “Cooperation network and cooperation-competition network, ” in Complex Systems and Complex Networks, 1st ed., vol. 1. Beijing: Higher Education Press, pp.229–231,2010. [Google Scholar]
18. X. Ou and J. Yu, “An improved community discovery algorithm based on K-means,” Information Technology and Application of Scientific Research, vol. 8, no. 05, pp. 111–118, 2017. [Google Scholar]
 | This work is licensed under a Creative Commons Attribution 4.0 International License, which permits unrestricted use, distribution, and reproduction in any medium, provided the original work is properly cited. |